Attached files
| file | filename |
|---|---|
| 8-K - FORM 8-K - FIFTH THIRD BANCORP | d482426d8k.htm |
 Fifth Third Bank | All Rights Reserved
Credit Suisse
Financial Services Forum
Kevin T. Kabat
Vice Chairman and Chief Executive Officer
February 13, 2013
Refer to earnings release dated January 17, 2013 for further information
Exhibit 99.1 |
 2
Fifth Third Bank | All Rights Reserved
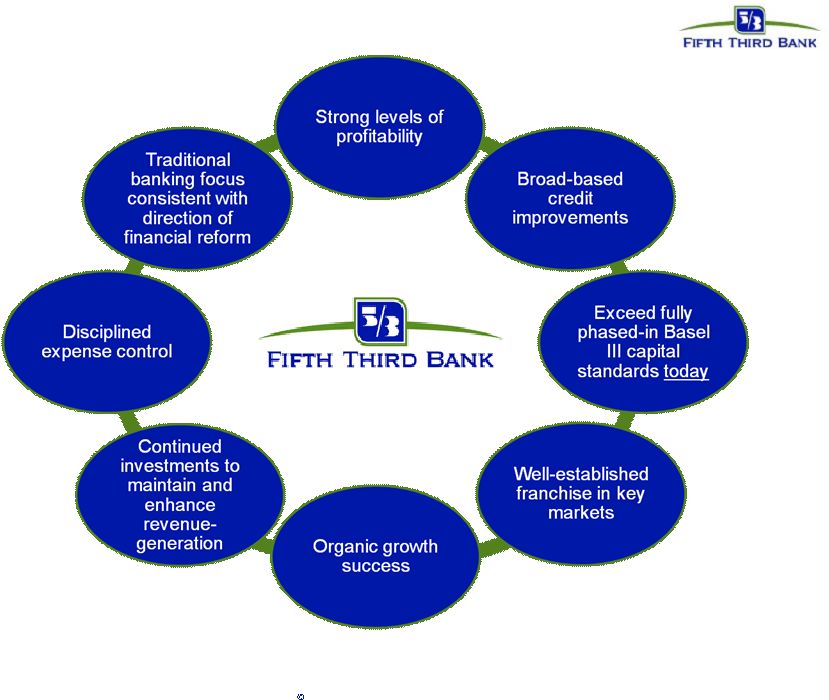
Well-positioned for success and leadership in new banking landscape
Key themes |
 3
Fifth Third Bank | All Rights Reserved
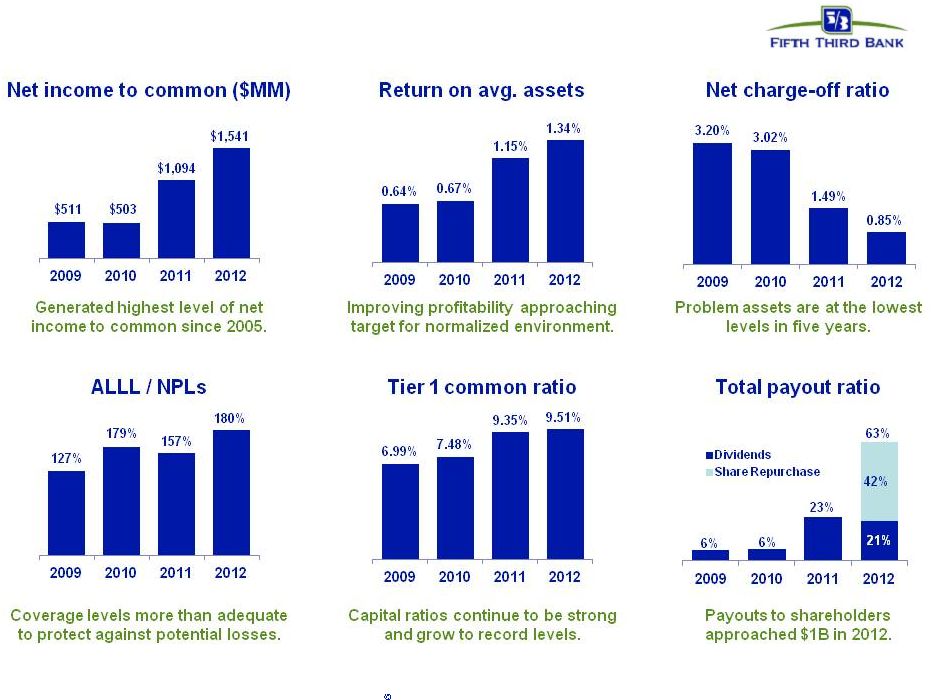
A strong franchise with strong momentum |
 4
Fifth Third Bank | All Rights Reserved
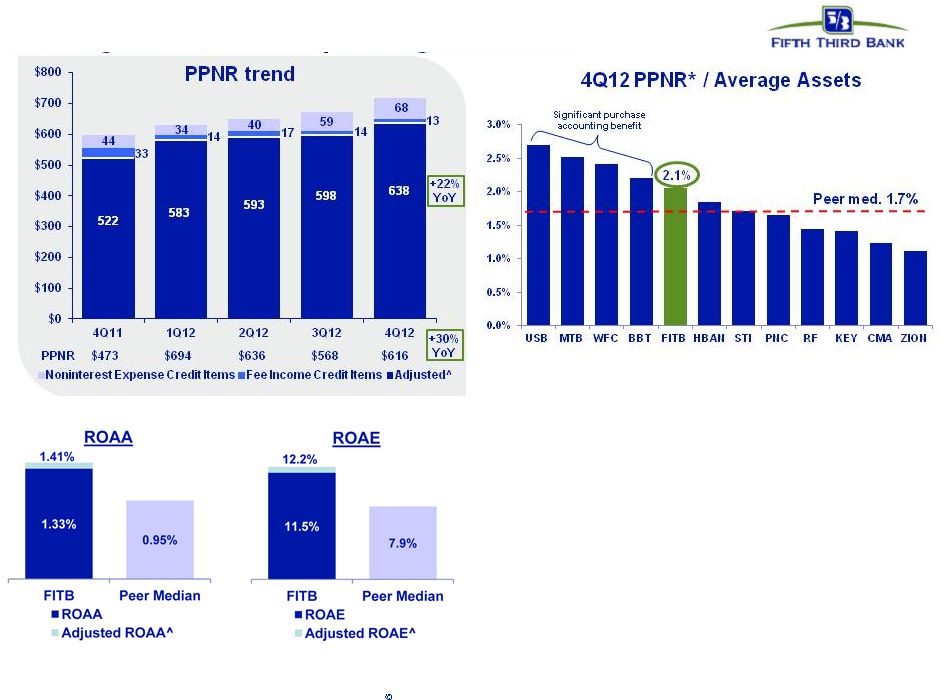
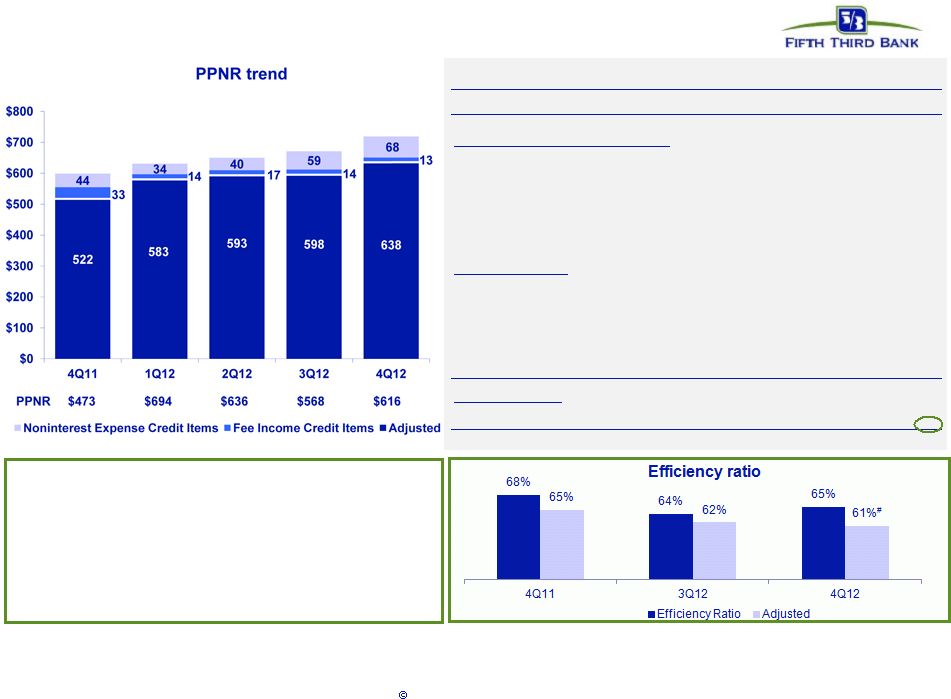
Strong revenue and profit generation
4Q12 returns strong relative to peers
•
Business mix provides higher than
average diversity among spread and fee
revenues (40+% of revenue)
•
Relatively strong margin and relatively
high fee income contribution drives
strong revenue and PPNR generation
profitability despite interest rate
environment
PPNR is a Non-GAAP measure. See Reg. G reconciliation in the Appendix to
the presentation. Source: SNL Financial and Company Reports. Peer median
includes: BBT, CMA, HBAN, KEY, MTB, PNC, RF, STI, USB, WFC, and ZION *
Excludes securities gains / losses for FITB and peers. Also excludes goodwill impairment charge for peers as applicable.
^ See Page 18 in the Appendix for adjustments |
 5
Fifth Third Bank | All Rights Reserved
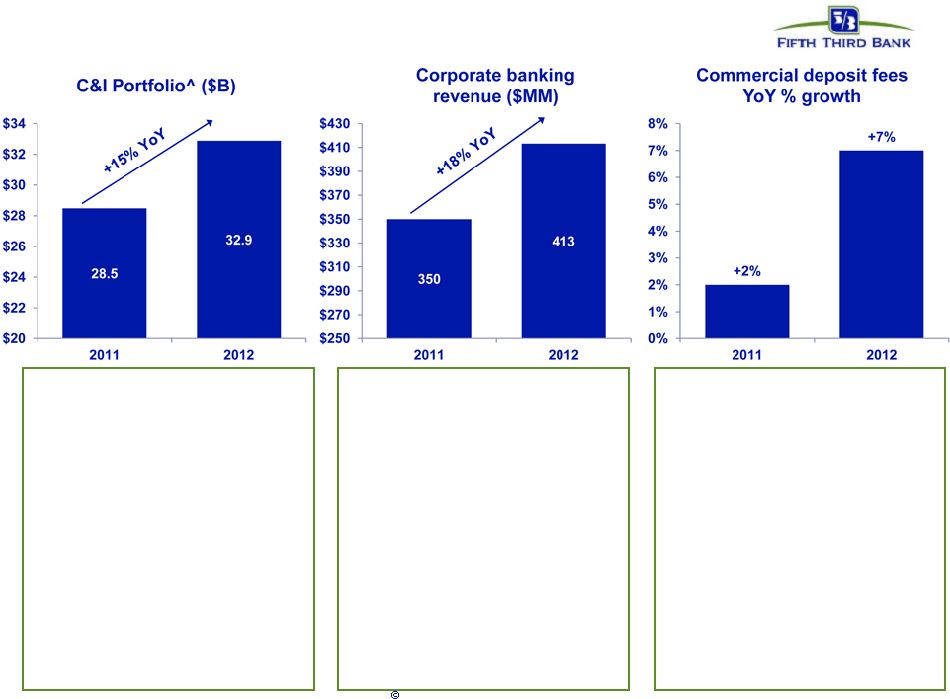
Corporate banking business generating growth
•
Reflects investments in mid-
corporate space (businesses
that generate $200MM to $2B
in revenue)
•
C&I production broad based
across industries and
sectors
–
Strength in
manufacturing and
healthcare industries
•
Launch of Energy Lending
concentration contributed to
4Q12 production and
expected to contribute to
future growth in C&I
^ Presented on an average basis; Excluding held-for-sale loans.
•
Growth in corporate banking
revenue driven by:
–
Investments in capital
markets capabilities
–
Increased syndication
and business lending
fees
•
Led or co-led ~80% of
syndications in 2012 versus
~60% in 2011
•
Broad product set and
capabilities to deliver
solutions that meet client
needs
•
Growth from investments in
treasury management
business
•
Remote Currency Manager
(RCM) contributed ~$13MM in
revenue in 2012
–
Remote cash management
solution that simplifies
cash handling and
improves cash flow
•
Specialized healthcare
industry products including
RevLink Solutions platform;
~20% increase in accounts
from a year ago |
 6
Fifth Third Bank | All Rights Reserved
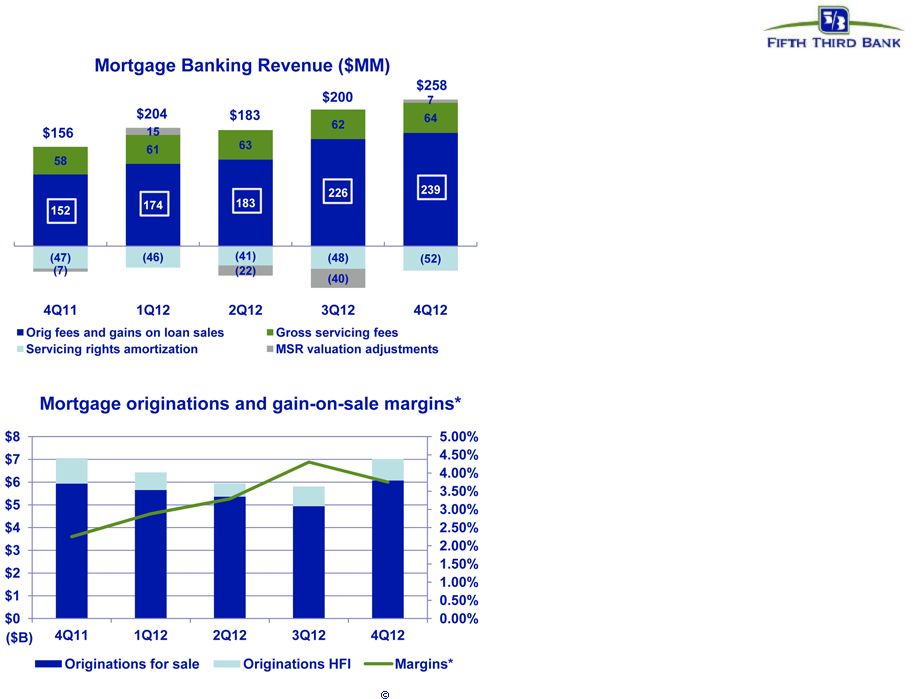
Strong mortgage banking results
•
Record origination fees and gain on
loan sales in FY12
–
Driven by record gain on sales
margin and origination volumes
–
2012 origination fees and gain on
loan sales increased 108% to
$822MM from 2011
–
Originations increased 35% to
$25.2B in 2012 versus $18.6B in
2011
Looking forward into 2013:
•
Expect solid mortgage revenue,
although lower than recent quarters
due to:
–
Pressure on margins (competitive
/ market)
–
Waning of refinance boom
–
Partially offset by better mortgage
servicing results
* Gain-on-sale margin represents margin on loans originated for sale.
•
Maintained mortgage market share
position in Top 20 |
 7
Fifth Third Bank | All Rights Reserved
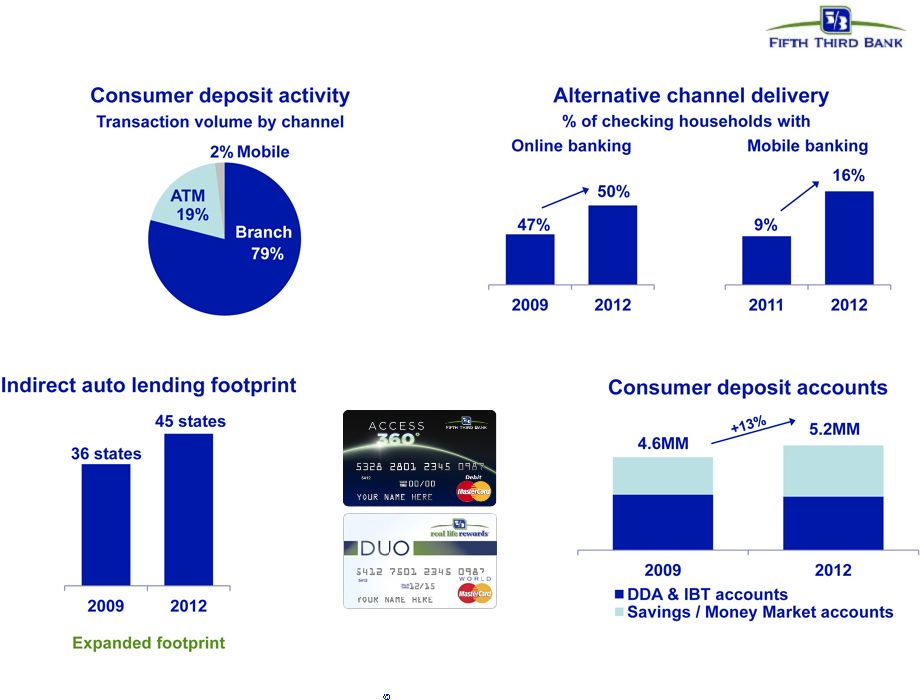
Momentum building in consumer bank as a
result of investments and strategic changes
More distribution channels for customers to access our products and services
4Q12 consumer deposit account average balance
increased 16% compared with 4Q09
Card innovation
New products that fit the way
customers choose to bank |
 8
Fifth Third Bank | All Rights Reserved
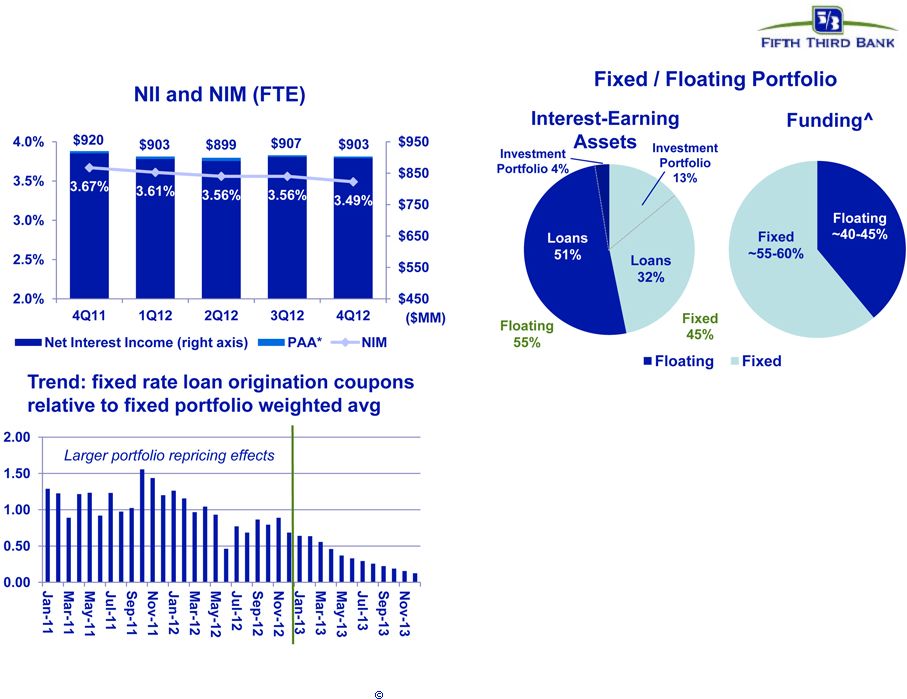
NII results reflect continued moderate NIM
pressure offset by balance sheet growth
* Represents purchase accounting adjustments included in net interest income.
^ Estimate; funding (DDAs + interest-bearing liabilities); liabilities
attributed to fixed or floating using terms and expected beta •
Negative impact of lower rates on net interest
income generally offset by loan growth
•
Spreads on new originations of variable rate
assets consistent with historical spreads
•
Coupons on new fixed rate loan originations
converging with portfolio average coupons
–
Emphasis on variable rate C&I lending |
 9
Fifth Third Bank | All Rights Reserved
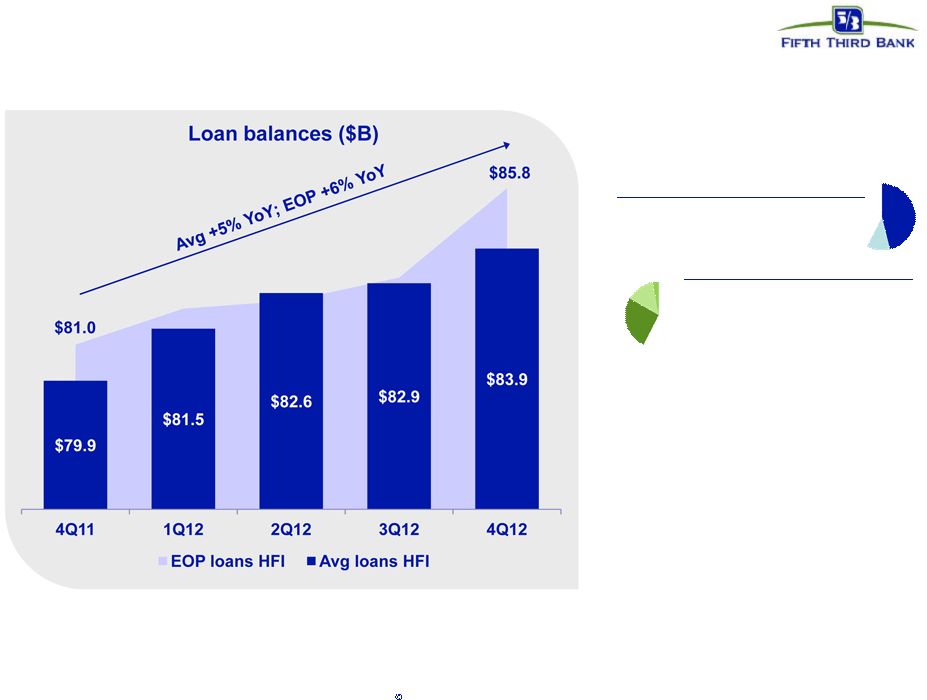
Loan growth excelled in 2012,
ample opportunities for ongoing growth
Loan composition
46% C&I / lease
11% Commercial real estate
Commercial
26% Resi. mtg. / home equity
14% Auto
3% Card / other
Consumer
•
Solid loan growth with
disciplined lending standards
throughout 2012
•
C&I and residential mortgage
balance growth more than
offset run-off in both home
equity and commercial real
estate loans (CRE run-off
continues to slow) |
 10
Fifth Third Bank | All Rights Reserved
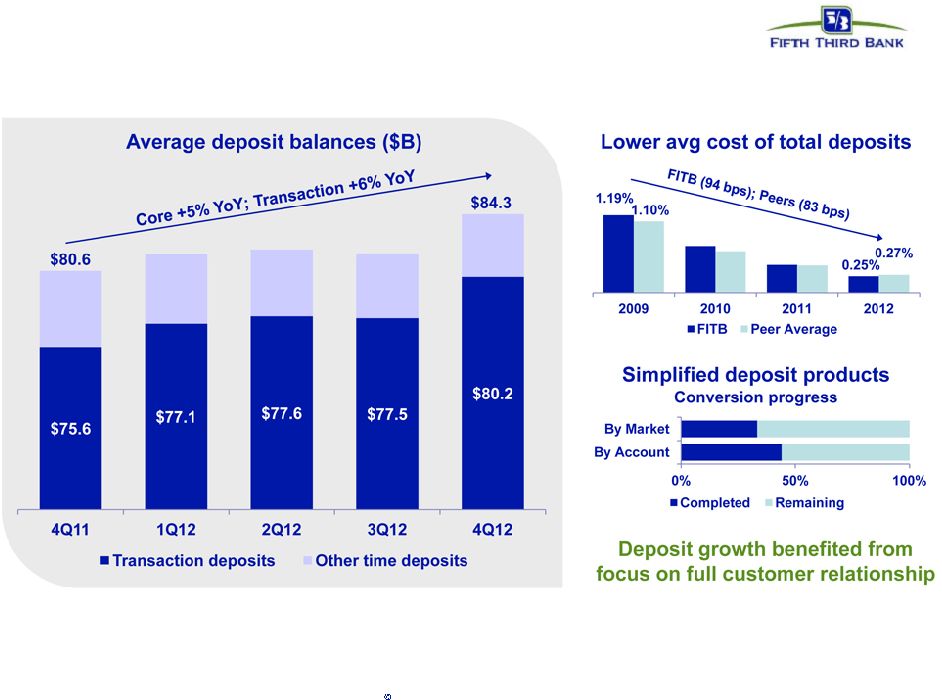
Strengthened deposit profile
and increased value proposition to customers
Source: SNL Financial. Peer average includes: BBT, CMA, HBAN, KEY, MTB, PNC, RF,
STI, USB, WFC, ZION |
 11
Fifth Third Bank | All Rights Reserved
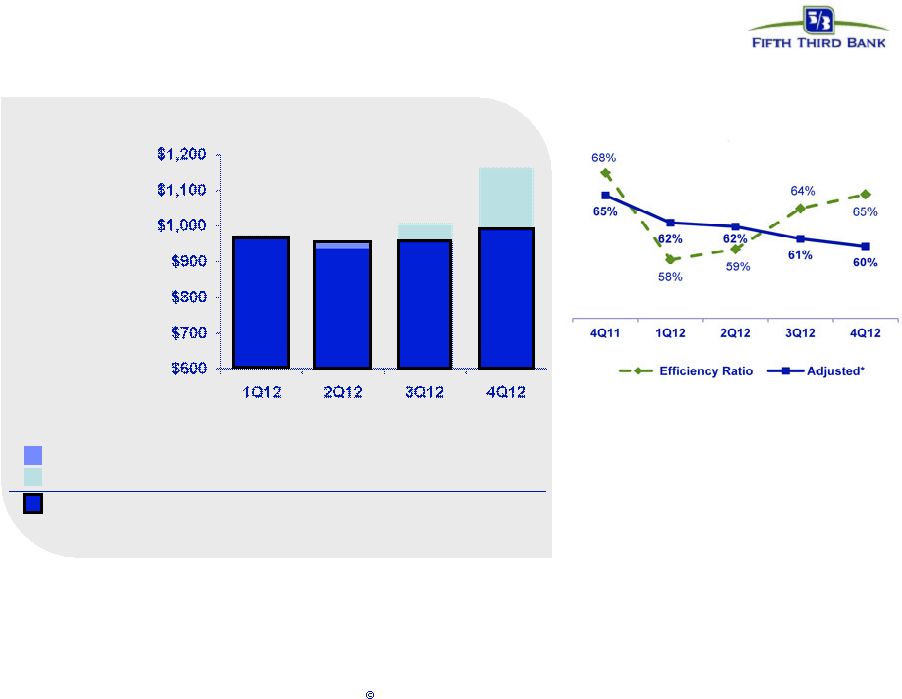
Disciplined expense management
•
Long-term target for mid-50% efficiency
ratio in normalized environment (with
higher interest rate environment)
2012 expense trend ($MM)
* Non-recurring items described on page 18 in the appendix to this
presentation. Reported expense
Increasing expense
Non-recurring items*:
Adjusted expense
Decreasing expense
$973
$937
$1,006
$23
$18
$5
($29)
--
($55)
$967
$955
$956
Managing expenses carefully in response to revenue
environment; continuous process of expense evaluation
Efficiency ratio trend
--
($173)
$990
$1,163
–
Current
impact
of
credit
costs
on
revenue
and
expenses;
impact
of
regulatory
reforms
(e.g.,
debit
interchange)
not
fully
mitigated
–
Reflects
below-capacity
balance
sheet
and
lower
revenue
than
we
expect
and
can
support
longer
term
–
~60%
for
year
end
2013 |
 12
Fifth Third Bank | All Rights Reserved
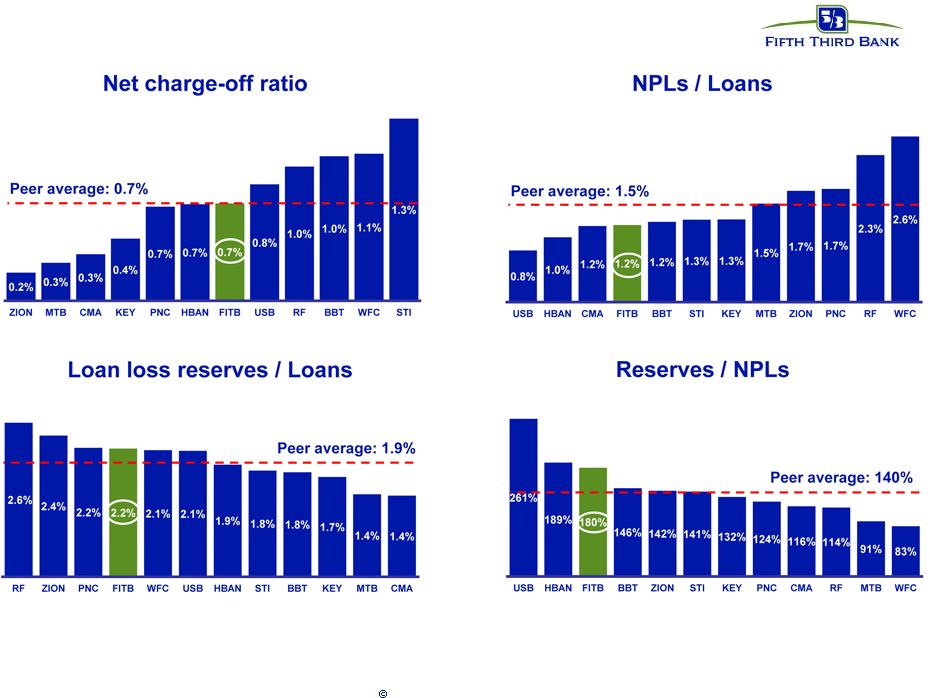
Credit trends continue to improve
with strong reserve coverage levels
Source: SNL Financial and Company Reports. Data as of 4Q12. HFI NPLs exclude loans
held-for-sale and also exclude covered assets for BBT, USB, and ZION
Continued decline in problem assets and corresponding decline in
charge-offs combined
with strong reserves on an absolute and relative basis
|
 13
Fifth Third Bank | All Rights Reserved
Capital management philosophy
* Subject to Board of Directors and regulatory approval
Organic growth opportunities
•
Support growth of core banking franchise
•
Continued loan growth despite sluggish
economy
Strategic opportunities
*
•
Prudently evaluate franchise including
increasing density in core markets via
disciplined acquisitions or selective de
novos
•
Expect future acquisition opportunities
although activity remains muted in near-term
•
Attain top 3 market position in 65% of
markets or more longer term
Dividends*
•
Move towards levels more consistent with
Fed’s near-term payout ratio guidance of
30%
•
Strong levels of profitability would support
higher dividend than current level
•
Quarterly dividend increased to $0.10 in
3Q12
Repurchases / Redemptions
*
•
Common share repurchases to limit and
manage growth of excess capital levels
•
Redeemed $1.4bn in TruPS in 3Q12
Expect capital philosophy to remain consistent
pending evaluation of results in 2013 CCAR process
Capital Deployment
Capital Return
–
Manage capital in light of regulatory
environment, other alternatives,
maintenance of desired / required buffers,
stock price
–
2012 capital plan included $600MM of
repurchases over five quarters ended 1Q13
($125MM ASR entered into in January) |
 14
Fifth Third Bank | All Rights Reserved
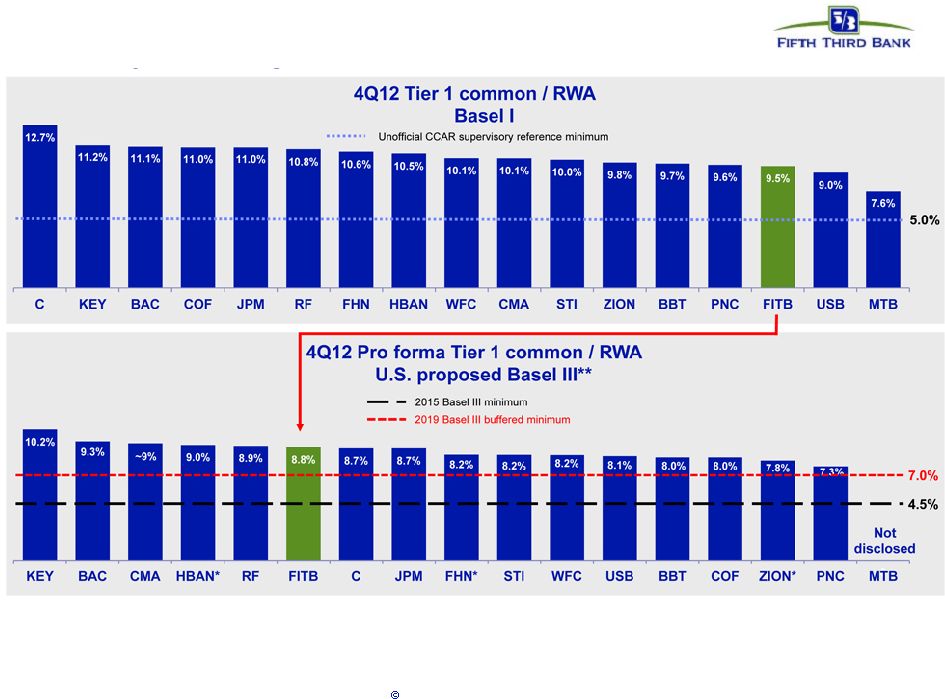
Fifth Third’s balance sheet and business model
relatively advantaged under new capital standards
Source: SNL Financial and company reports (financial data as of 4Q12).
*
In
2Q12,
HBAN
stated
Basel
III
Tier
1
common
ratio
would
be
negatively
impacted
by
approximately
150
basis
points.
In
2Q12,
ZION
stated
Tier
1
common
ratio
would
be
in
the
7.75%
area.
In
3Q12
FHN
stated
Basel
III
Tier
1
common
ratio
would
be
negatively
impacted
by
approximately
240
basis
points.
** Note: Fifth Third’s pro forma Tier I common equity ratio is
management’s estimate based upon its current interpretation of the three draft Federal Register notices proposing
enhancements to regulatory capital requirements published in June 2012. The actual
impact to the Bancorp’s Tier I common equity ratio may change significantly due to further clarification
of the agencies proposals or revisions to the agencies final rules, which remain
subject to public comment. Not adjusted for potential mitigation efforts. Fifth
Third’s capital position already well in excess of any established standards, likely standards, and most peers |
 15
Fifth Third Bank | All Rights Reserved
FITB
“Trillionaire”
Banks
Regional
Banks
Community
Banks
Investment
Banks
Diverse businesses
Efficiencies
of scale
Local market focus
Multi-channel
delivery
Customer-centric
model
Moderate risk
profile
Strong profitability
and well-capitalized
Fifth Third: A differentiated business model
Competitively well-positioned in new landscape
|
 16
Fifth Third Bank | All Rights Reserved
Cautionary statement
This
report
contains
statements
that
we
believe
are
“forward-looking
statements”
within
the
meaning
of
Section
27A
of
the
Securities
Act
of
1933,
as
amended,
and
Rule
175
promulgated
thereunder,
and
Section
21E
of
the
Securities
Exchange
Act
of
1934,
as
amended,
and
Rule
3b-6
promulgated
thereunder.
These
statements
relate
to
our
financial
condition,
results
of
operations,
plans,
objectives,
future
performance
or
business.
They
usually
can
be
identified
by
the
use
of
forward-looking
language
such
as
“will
likely
result,”
“may,”
“are
expected
to,”
“is
anticipated,”
“estimate,”
“forecast,”
“projected,”
“intends
to,”
or
may
include
other
similar
words
or
phrases
such
as
“believes,”
“plans,”
“trend,”
“objective,”
“continue,”
“remain,”
or
similar
expressions,
or
future
or
conditional
verbs
such
as
“will,”
“would,”
“should,”
“could,”
“might,”
“can,”
or
similar
verbs.
You
should
not
place
undue
reliance
on
these
statements,
as
they
are
subject
to
risks
and
uncertainties,
including
but
not
limited
to
the
risk
factors
set
forth
in
our
most
recent
Annual
Report
on
Form
10-K.
When
considering
these
forward-looking
statements,
you
should
keep
in
mind
these
risks
and
uncertainties,
as
well
as
any
cautionary
statements
we
may
make.
Moreover,
you
should
treat
these
statements
as
speaking
only
as
of
the
date
they
are
made
and
based
only
on
information
then
actually
known
to
us.
There
are
a
number
of
important
factors
that
could
cause
future
results
to
differ
materially
from
historical
performance
and
these
forward-
looking
statements.
Factors
that
might
cause
such
a
difference
include,
but
are
not
limited
to:
(1)
general
economic
conditions
and
weakening
in
the
economy,
specifically
the
real
estate
market,
either
nationally
or
in
the
states
in
which
Fifth
Third,
one
or
more
acquired
entities
and/or
the
combined
company
do
business,
are
less
favorable
than
expected;
(2)
deteriorating
credit
quality;
(3)
political
developments,
wars
or
other
hostilities
may
disrupt
or
increase
volatility
in
securities
markets
or
other
economic
conditions;
(4)
changes
in
the
interest
rate
environment
reduce
interest
margins;
(5)
prepayment
speeds,
loan
origination
and
sale
volumes,
charge-offs
and
loan
loss
provisions;
(6)
Fifth
Third’s
ability
to
maintain
required
capital
levels
and
adequate
sources
of
funding
and
liquidity;
(7)
maintaining
capital
requirements
may
limit
Fifth
Third’s
operations
and
potential
growth;
(8)
changes
and
trends
in
capital
markets;
(9)
problems
encountered
by
larger
or
similar
financial
institutions
may
adversely
affect
the
banking
industry
and/or
Fifth
Third;
(10)
competitive
pressures
among
depository
institutions
increase
significantly;
(11)
effects
of
critical
accounting
policies
and
judgments;
(12)
changes
in
accounting
policies
or
procedures
as
may
be
required
by
the
Financial
Accounting
Standards
Board
(FASB)
or
other
regulatory
agencies;
(13)
legislative
or
regulatory
changes
or
actions,
or
significant
litigation,
adversely
affect
Fifth
Third,
one
or
more
acquired
entities
and/or
the
combined
company
or
the
businesses
in
which
Fifth
Third,
one
or
more
acquired
entities
and/or
the
combined
company
are
engaged,
including
the
Dodd-Frank
Wall
Street
Reform
and
Consumer
Protection
Act;
(14)
ability
to
maintain
favorable
ratings
from
rating
agencies;
(15)
fluctuation
of
Fifth
Third’s
stock
price;
(16)
ability
to
attract
and
retain
key
personnel;
(17)
ability
to
receive
dividends
from
its
subsidiaries;
(18)
potentially
dilutive
effect
of
future
acquisitions
on
current
shareholders’
ownership
of
Fifth
Third;
(19)
effects
of
accounting
or
financial
results
of
one
or
more
acquired
entities;
(20)
difficulties
from
the
separation
of
or
the
results
of
operations
of
Vantiv,
LLC
from
Fifth
Third;
(21)
loss
of
income
from
any
sale
or
potential
sale
of
businesses
that
could
have
an
adverse
effect
on
Fifth
Third’s
earnings
and
future
growth;
(22)
ability
to
secure
confidential
information
through
the
use
of
computer
systems
and
telecommunications
networks;
and
(23)
the
impact
of
reputational
risk
created
by
these
developments
on
such
matters
as
business
generation
and
retention,
funding
and
liquidity.
You
should
refer
to
our
periodic
and
current
reports
filed
with
the
Securities
and
Exchange
Commission,
or
“SEC,”
for
further
information
on
other
factors,
which
could
cause
actual
results
to
be
significantly
different
from
those
expressed
or
implied
by
these
forward-looking
statements. |
 17
Fifth Third Bank | All Rights Reserved
Appendix |
 18
Fifth Third Bank | All Rights Reserved
($ in millions)
4Q11
1Q12
2Q12
3Q12
4Q12
Income before income taxes (U.S. GAAP) (a)
$418
$603
$565
$503
$540
Add: Provision expense (U.S. GAAP) (b)
55
91
71
65
76
PPNR (a) + (b)
$473
$694
$636
$568
$616
Adjustments to remove (benefit) / detriment^:
In noninterest income:
Gain from Vantiv IPO (1Q12) and sale of shares (4Q12)
-
(115)
-
-
(157)
Vantiv debt refinancing
-
34
-
-
-
Valuation of 2009 Visa total return swap
54
19
11
1
15
Vantiv warrant & puts
(10)
(46)
(56)
16
19
Valuation of bank premises moved to HFS
-
-
17
-
-
Litigation reserve additions in revenue
-
-
6
-
-
Sale of certain Fifth Third funds
-
-
-
(13)
-
Securities (gains) / losses
(5)
(9)
(3)
(2)
(2)
In noninterest expense:
Debt extinguishment (gains) / losses
-
9
-
26
134
Non-income tax related assessment resolution
-
(23)
-
-
-
Sale of certain Fifth Third funds
-
-
-
2
-
Termination of certain borrowing & hedging transactions
-
-
-
-
-
Severance expense
-
6
-
-
-
FDIC insurance expense
-
-
(9)
-
-
Gain on sale of affordable housing
-
-
(8)
(5)
-
Litigation reserve additions in expense
10
14
(1)
5
13
Adjusted PPNR
$522
$583
$593
$598
$638
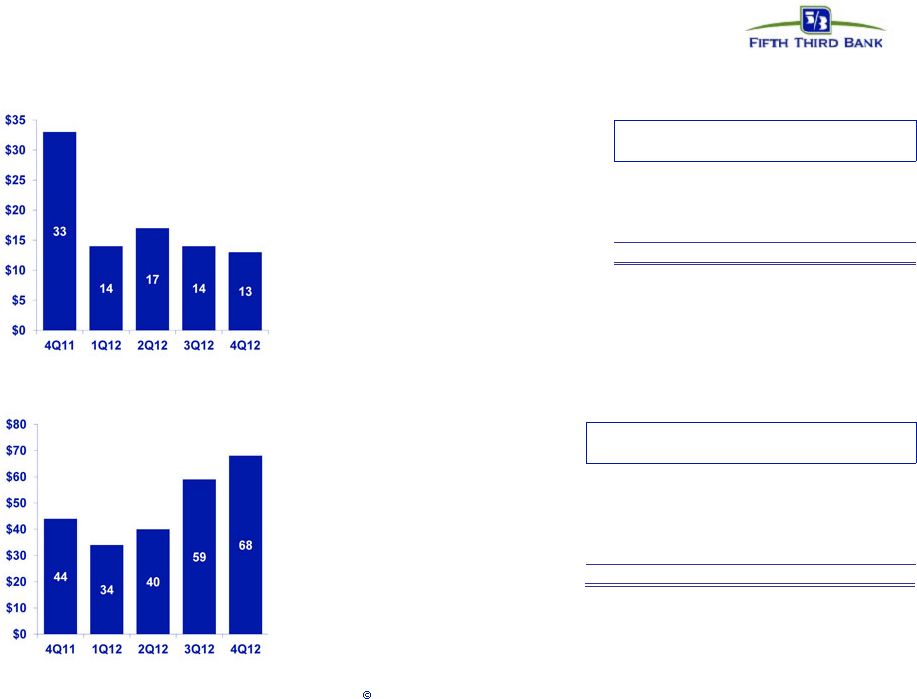
Credit-related items^^:
In noninterest income
33
14
17
14
13
In noninterest expense
44
34
40
59
68
Credit-adjusted PPNR**
$599
$631
$650
$671
$719
Pre-tax pre-provision earnings*
* Non-GAAP measure. See Reg. G reconciliation on pages 20 and 21.
**
There
are
limitations
on
the
usefulness
of
credit-adjusted
PPNR,
including
the
significant
degree
to
which
changes
in
credit
and
fair
value
are
integral,
recurring
components
of
the
Bancorp’s
core
operations
as
a
financial
institution.
This
measure
has
been
included
herein
to
facilitate
a
greater
understanding
of
the
Bancorp’s
financial
condition.
^ Prior quarters include similar adjustments.
^^ See Slide 19 for detailed breakout of credit-related items.
# 60% also excluding 4Q12 mortgage repurchase reserve build
•
PPNR of $616MM up 8% from 3Q12 levels and
30% from prior year
•
Adjusted PPNR of $638MM, up 7% sequentially and
22% year-over-year
—
Including 4Q12 mortgage repurchase reserve
build of $29MM in adjustments, related to new
Freddie Mac guidance, adjusted PPNR of
$667MM
PPNR reconciliation |
 19
Fifth Third Bank | All Rights Reserved
Credit-related costs
In noninterest income ($MM)
In noninterest expense ($MM)
Note: Numbers may not sum due to rounding
Actual
($ in millions)
4Q11
1Q12
2Q12
3Q12
4Q12
Gain / (loss) on sale of loans
$9
$5
$8
$2
$4
Commercial loans HFS FV adjustment
(18)
(1)
(5)
(3)
(3)
Gain / (loss) on sale of OREO properties
(22)
(17)
(19)
(11)
(10)
Mortgage repurchase costs
(1)
(2)
(2)
(2)
(3)
Total credit-related revenue impact
($33)
($14)
($17)
($14)
($13)
Actual
($ in millions)
4Q11
1Q12
2Q12
3Q12
4Q12
Mortgage repurchase expense
$18
$15
$18
$36
$44
Provision for unfunded commitments
(6)
(2)
(1)
(2)
3
Derivative valuation adjustments
(5)
(4)
(0)
(2)
(2)
OREO expense
8
5
5
6
5
Other problem asset related expenses
28
19
19
21
19
Total credit-related operating expenses
$44
$34
$40
$59
$68 |
 20
Fifth Third Bank | All Rights Reserved
Regulation G Non-GAAP reconciliation
Fifth Third Bancorp and Subsidiaries
Regulation G Non-GAAP Reconcilation
$ and shares in millions
(unaudited)
December
September
June
March
December
2012
2012
2012
2012
2011
Income before income taxes (U.S. GAAP)
$540
$503
$565
$603
$418
Add:
Provision expense (U.S. GAAP)
76
65
71
91
55
Pre-provision net revenue (a)
616
568
636
694
473
Net income available to common shareholders (U.S. GAAP)
390
354
376
421
305
Add:
Intangible amortization, net of tax
2
2
2
3
3
Tangible net income available to common shareholders
392
356
378
424
308
Tangible net income available to common shareholders (annualized) (b)
1,559
1,416
1,520
1,705
1,222
Average Bancorp shareholders' equity (U.S. GAAP)
13,855
13,887
13,628
13,366
13,147
Less:
Average preferred stock
(398)
(398)
(398)
(398)
(398)
Average goodwill
(2,417)
(2,417)
(2,417)
(2,417)
(2,417)
Average intangible assets
(28)
(31)
(34)
(38)
(42)
Average tangible common equity (c)
11,012
11,041
10,779
10,513
10,290
Total Bancorp shareholders' equity (U.S. GAAP)
13,716
13,718
13,773
13,560
13,201
Less:
Preferred stock
(398)
(398)
(398)
(398)
(398)
Goodwill
(2,416)
(2,417)
(2,417)
(2,417)
(2,417)
Intangible assets
(27)
(30)
(33)
(36)
(40)
Tangible common equity, including unrealized gains / losses (d)
10,875
10,873
10,925
10,709
10,346
Less: Accumulated other comprehensive income / loss
(375)
(468)
(454)
(468)
(470)
Tangible common equity, excluding unrealized gains / losses (e)
10,500
10,405
10,471
10,241
9,876
Total assets (U.S. GAAP)
121,894
117,483
117,543
116,747
116,967
Less:
Goodwill
(2,416)
(2,417)
(2,417)
(2,417)
(2,417)
Intangible assets
(27)
(30)
(33)
(36)
(40)
Tangible assets, including unrealized gains / losses (f)
119,451
115,036
115,093
114,294
114,510
Less: Accumulated other comprehensive income / loss, before tax
(577)
(720)
(698)
(720)
(723)
Tangible assets, excluding unrealized gains / losses (g)
118,874
114,316
114,395
113,574
113,787
Common shares outstanding (h)
882
897
919
920
920
Net charge-offs (i)
147
156
181
220
239
Ratios:
Return on average tangible common equity (b) / (c)
14.2%
12.8%
14.1%
16.2%
11.9%
Tangible
common
equity
(excluding
unrealized
gains/losses)
(e)
/
(g)
8.83%
9.10%
9.15%
9.02%
8.68%
Tangible
common
equity
(including
unrealized
gains/losses)
(d)
/
(f)
9.10%
9.45%
9.49%
9.37%
9.04%
Tangible book value per share (d) / (h)
12.33
12.12
11.89
11.64
11.25
Pre-provision net revenue / net charge-offs (a) / (i)
419%
364%
351%
315%
198%
For the Three Months Ended |
 21
Fifth Third Bank | All Rights Reserved
Regulation G Non-GAAP reconciliation
Fifth Third Bancorp and Subsidiaries
Regulation G Non-GAAP Reconcilation
$ and shares in millions
(unaudited)
December
September
June
March
December
2012
2012
2012
2012
2011
Total Bancorp shareholders' equity (U.S. GAAP)
$13,716
$13,718
$13,773
$13,560
$13,201
Goodwill and certain other intangibles
(2,499)
(2,504)
(2,512)
(2,518)
(2,514)
Unrealized gains
(375)
(468)
(454)
(468)
(470)
Qualifying trust preferred securities
810
810
2,248
2,248
2,248
Other
33
38
38
38
38
Tier I capital
11,685
11,594
13,093
12,860
12,503
Less:
Preferred stock
(398)
(398)
(398)
(398)
(398)
Qualifying trust preferred securities
(810)
(810)
(2,248)
(2,248)
(2,248)
Qualifying noncontrolling interest in consolidated subsidiaries
(48)
(51)
(51)
(50)
(50)
Tier I common equity (a)
10,429
10,335
10,396
10,164
9,807
Risk-weighted assets, determined in accordance with
prescribed regulatory requirements (b)
109,699
106,858
106,398
105,412
104,945
Ratio:
Tier I common equity (a) / (b)
9.51%
9.67%
9.77%
9.64%
9.35%
Basel III -
Estimates (Amounts in billions)
December
September
June
2012
2012
2012
Tier 1 common equity (Basel I)
$10.4
$10.3
$10.4
Add:
Adjustment related to AOCI for AFS securities
0.5
0.5
0.5
All other adjustments
-
-
-
Estimated Tier 1 common equity under Basel III rules (a)
$10.9
$10.8
$10.9
Estimated risk-weighted assets under Basel III rules (b)
123.7
120.3
119.4
Estimated Tier 1 common equity ratio under Basel III rules
8.8%
9.0%
9.2%
(a)
(b)
Tier 1 common equity under Basel III includes the unrealized gains and losses for
AFS securities. Other adjustments include mortgage servicing rights and deferred tax assets subject to
threshold limitations and deferred tax liabilities related to intangible
assets. Key differences under Basel III in the calculation of
risk-weighted assets compared to Basel I include: (1) Risk weighting for commitments under 1 year; (2) Higher risk weighting for exposures
to residential
mortgage,
home
equity,
past
due
loans,
foreign
banks
and
certain
commercial
real
estate;
(3)
Higher
risk
weighting
for
mortgage
servicing
rights
and
deferred
tax
assets
that
are
under
certain
thres
holds
as
a
percent
of
Tier
1
capial;
(4)
Incremental
capital
requirements
for
stress
VaR;
and
(5)
Derivatives
are
differentiated
between
exchange
clearing
and
over-the-counter and the 50% risk-weight cap is removed.
For the Three Months Ended
For the Three Months Ended |