Attached files
| file | filename |
|---|---|
| 8-K - FORM 8-K - Argo Group International Holdings, Ltd. | d486653d8k.htm |
Exhibit 99.1
Exhibit 99.1
4Q 2012 Investor Presentation February 2013
Forward-Looking Statements This presentation contains “forward-looking statements” which are made pursuant to the safe harbor provisions of the Private Securities Litigation Reform Act of 1995. The forward-looking statements are based on the Company’s current expectations and beliefs concerning future developments and their potential effects on the Company. There can be no assurance that actual developments will be those anticipated by the Company. Actual results may differ materially from those projected as a result of significant risks and uncertainties, including non-receipt of the expected payments, changes in interest rates, effect of the performance of financial markets on investment income and fair values of investments, development of claims and the effect on loss reserves, accuracy in projecting loss reserves, the impact of competition and pricing environments, changes in the demand for the Company’s products, the effect of general economic conditions, adverse state and federal legislation, regulations and regulatory investigations into industry practices, developments relating to existing agreements, heightened competition, changes in pricing environments, and changes in asset valuations. The Company undertakes no obligation to publicly update any forward-looking statements as a result of events or developments subsequent to the presentation. 2.
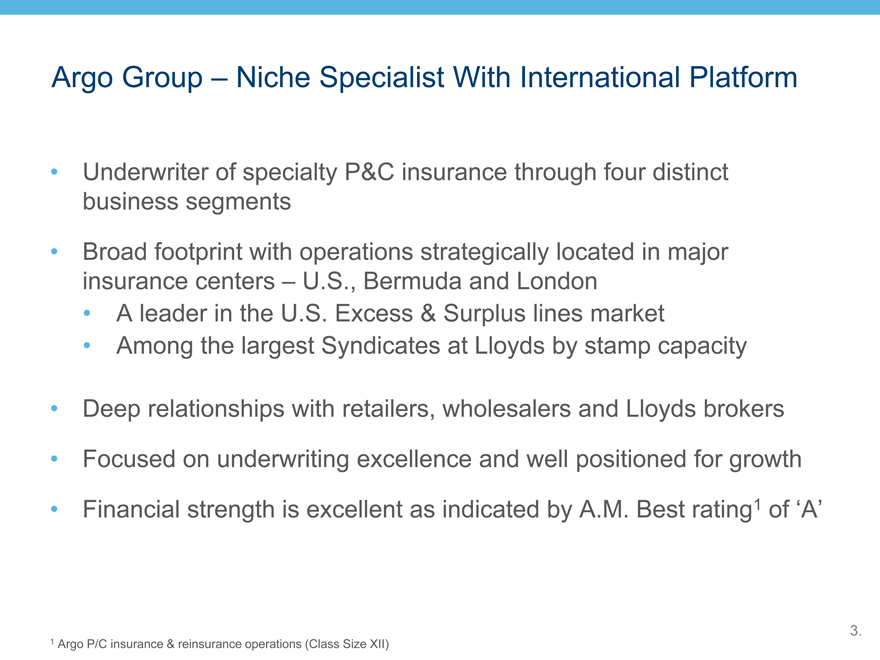
Argo Group – Niche Specialist With International Platform Underwriter of specialty P&C insurance through four distinct business segments Broad footprint with operations strategically located in major insurance centers – U.S., Bermuda and London A leader in the U.S. Excess & Surplus lines market Among the largest Syndicates at Lloyds by stamp capacity Deep relationships with retailers, wholesalers and Lloyds brokers Focused on underwriting excellence and well positioned for growth Financial strength is excellent as indicated by A.M. Best rating1 of ‘A’ 1 Argo P/C insurance & reinsurance operations (Class Size XII)
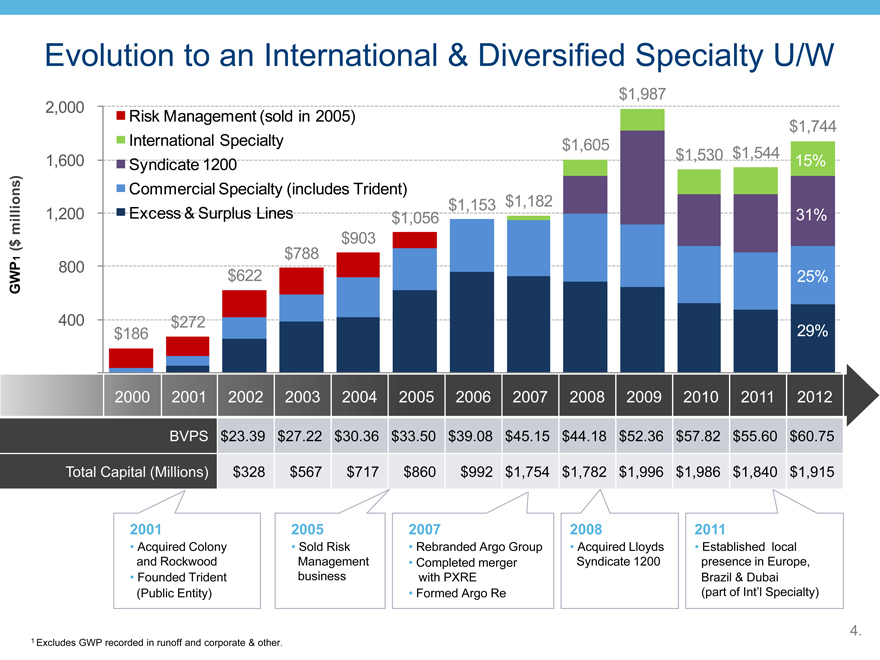
Evolution to an International & Diversified Specialty U/W $23.03 $501.1M $30.36 $716.8M $992.0M $54.85 $1,844.7M 2000 2001 2002 2003 2004 2005 2006 2007 2008 2009 2010 2011 2012 BVPS BVPS BVPS $23.39 $27.22 $30.36 $33.50 $39.08 $45.15 $44.18 $52.36 $57.82 $55.60 $60.75 Total Capital (Millions) Total Capital (Millions) Total Capital (Millions) $328 $567 $717 $860 $992 $1,754 $1,782 $1,996 $1,986 $1,840 $1,915 2001 • Acquired Colony and Rockwood • Founded Trident (Public Entity) 2005 • Sold Risk Management business 2007 • Rebranded Argo Group • Completed merger with PXRE • Formed Argo Re 2008 • Acquired Lloyds Syndicate 1200 2011 • Established local presence in Europe, Brazil & Dubai (part of Int’l Specialty) 4. 1 Excludes GWP recorded in runoff and corporate & other.
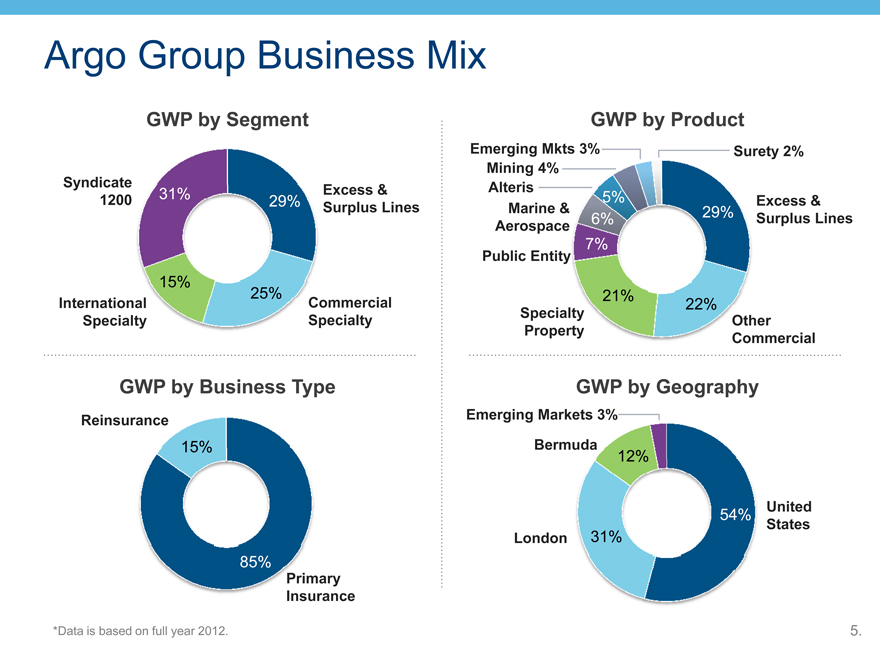
(CHART) Argo Group Business Mix 5. GWP by Segment (CHART) Excess & Surplus Lines Commercial Specialty Syndicate 1200 International Specialty 31% 15% 29% GWP by Product GWP by Business Type (CHART) Primary Insurance Reinsurance GWP by Geography United States London Bermuda *Data is based on full year 2012. 25% (CHART) 22% Excess & Surplus Lines 29% Other Commercial Specialty Property Public Entity 21% 7% 6% Marine & Aerospace Surety 2% 5% Alteris Mining 4% Emerging Mkts 3% Emerging Markets 3% 54% 12% 31%
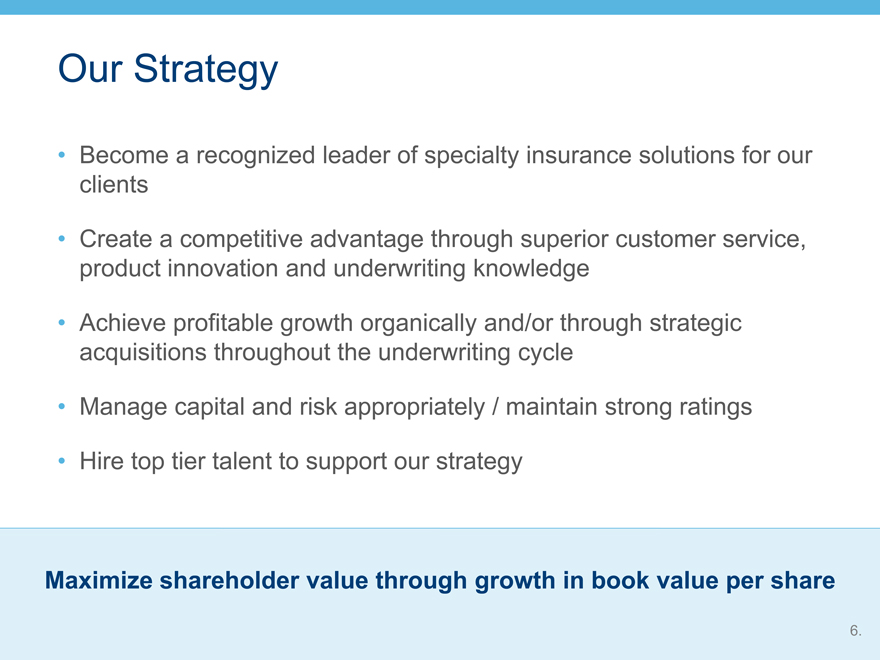
Maximize shareholder value through growth in book value per share Our Strategy Become a recognized leader of specialty insurance solutions for our clients Create a competitive advantage through superior customer service, product innovation and underwriting knowledge Achieve profitable growth organically and/or through strategic acquisitions throughout the underwriting cycle Manage capital and risk appropriately / maintain strong ratings Hire top tier talent to support our strategy 6.
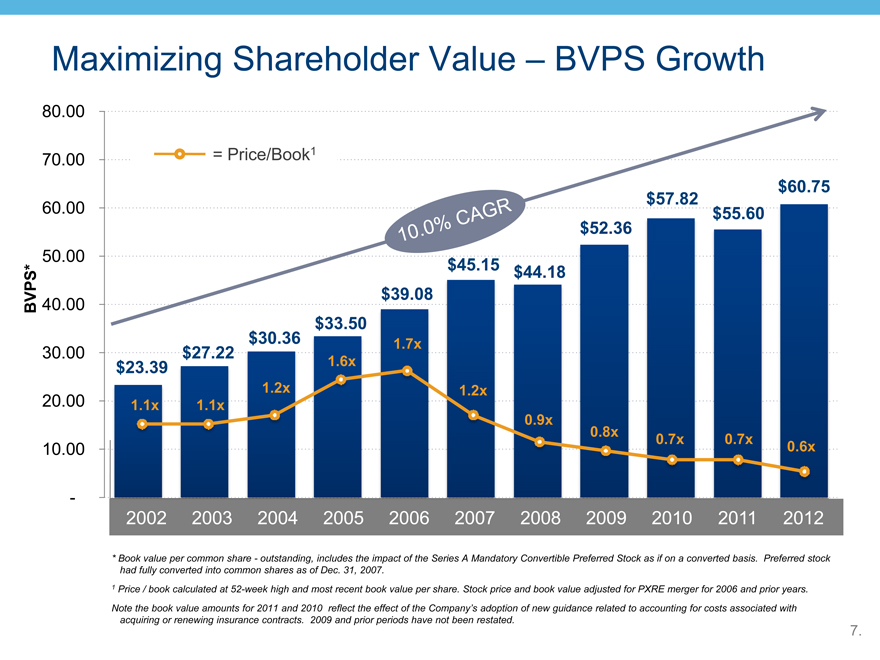
Maximizing Shareholder Value – BVPS Growth * Book value per common share—outstanding, includes the impact of the Series A Mandatory Convertible Preferred Stock as if on a converted basis. Preferred stock had fully converted into common shares as of Dec. 31, 2007. 1 Price / book calculated at 52-week high and most recent book value per share. Stock price and book value adjusted for PXRE merger for 2006 and prior years. Note the book value amounts for 2011 and 2010 reflect the effect of the Company’s adoption of new guidance related to accounting for costs associated with acquiring or renewing insurance contracts. 2009 and prior periods have not been restated. (CHART) 10.0% CAGR $45.15 $44.18 $52.36 $57.82 $60.75 $39.08 2008 2009 2010 2011 2006 2007 2005 2004 2003 2002 (CHART) $23.39 $27.22 $30.36 $33.50 1.1x 1.1x 1.2x 1.6x 1.7x 1.2x 0.9x 0.8x 0.7x 0.6x = Price/Book1 BVPS* 7. 2012 0.7x $55.60
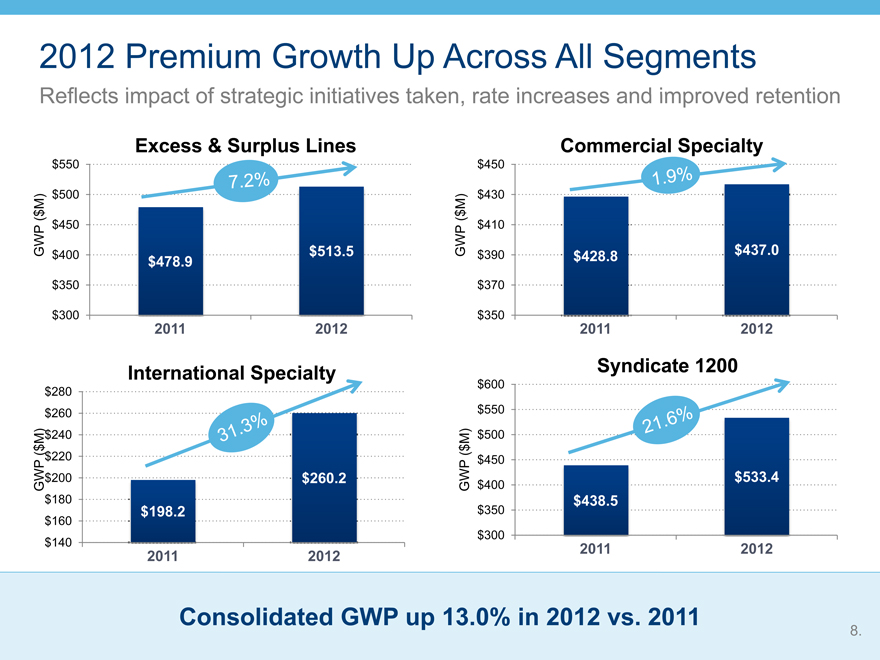
(CHART) (CHART) 7.2% Consolidated GWP up 13.0% in 2012 vs. 2011 2012 Premium Growth Up Across All Segments Reflects impact of strategic initiatives taken, rate increases and improved retention GWP ($M) GWP ($M) (CHART) 1.9% GWP ($M) 21.6% GWP ($M) 8. (CHART) 31.3%
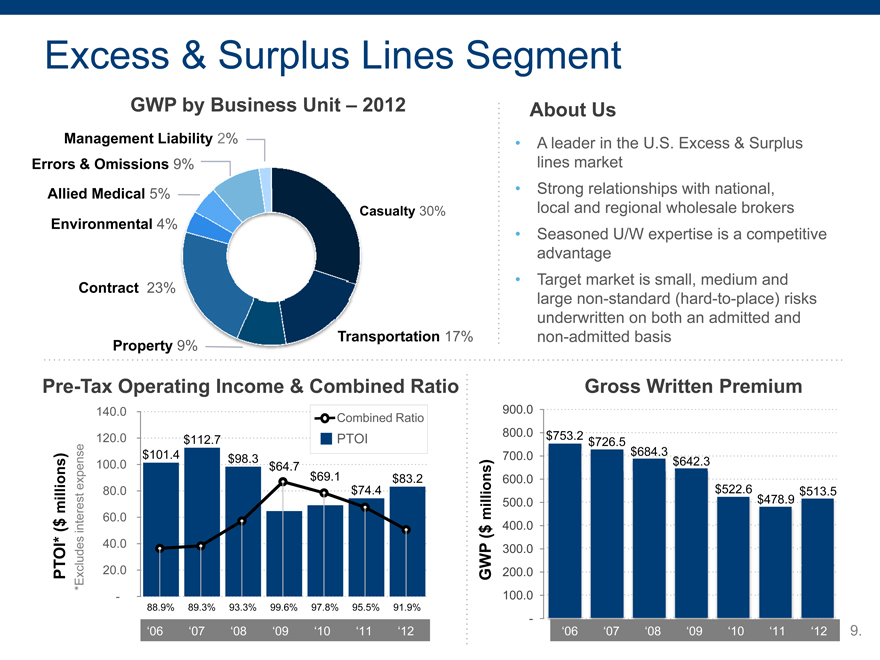
(CHART) (CHART) (CHART) About Us A leader in the U.S. Excess & Surplus lines market Strong relationships with national, local and regional wholesale brokers Seasoned U/W expertise is a competitive advantage Target market is small, medium and large non-standard (hard-to-place) risks underwritten on both an admitted and non-admitted basis GWP by Business Unit – 2012 (CHART) Casualty 30% Transportation 17% Environmental 4% Allied Medical 5% Management Liability 2% Property 9% Contract 23% Errors & Omissions 9% Excess & Surplus Lines Segment 9. GWP ($ millions) PTOI* ($ millions) *Excludes interest expense Combined Ratio PTOI 93.3% 99.6% 97.8% 95.5% 89.3% 88.9% ‘12 ‘10 ‘09 ‘08 ‘07 ‘06 ‘11 91.9% Gross Written Premium Pre-Tax Operating Income & Combined Ratio ‘12 ‘10 ‘09 ‘08 ‘07 ‘06 ‘11
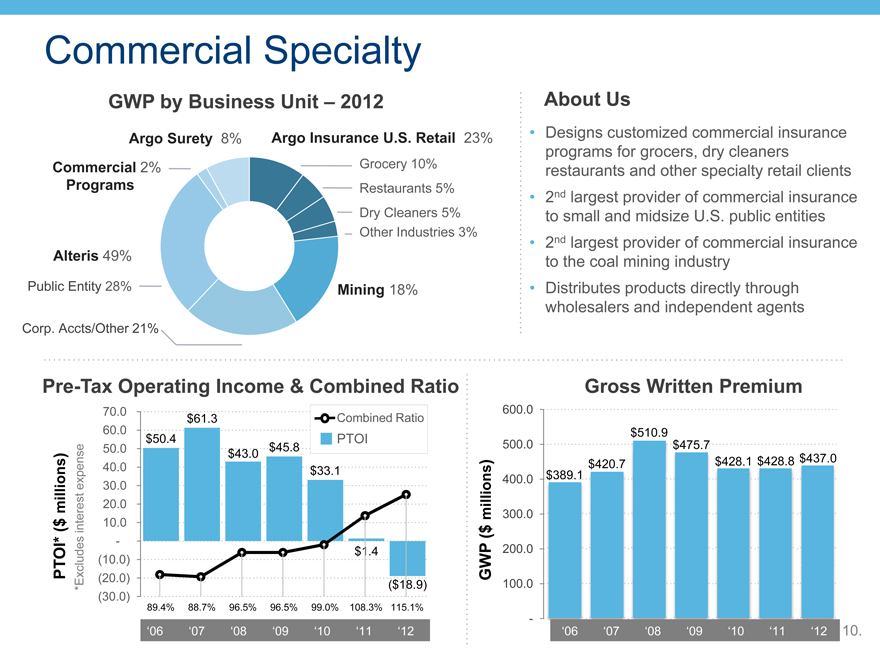
(CHART) (CHART) Commercial Specialty About Us Designs customized commercial insurance programs for grocers, dry cleaners restaurants and other specialty retail clients 2nd largest provider of commercial insurance to small and midsize U.S. public entities 2nd largest provider of commercial insurance to the coal mining industry Distributes products directly through wholesalers and independent agents GWP by Business Unit – 2012 (CHART) Argo Insurance U.S. Retail 23% Restaurants 5% Grocery 10% Dry Cleaners 5% Other Industries 3% Mining 18% Public Entity 28% Commercial 2% Programs. Argo Surety 8% Alteris 49% Corp. Accts/Other 21% . (CHART) GWP ($ millions) PTOI* ($ millions) *Excludes interest expense 96.5% 96.5% 99.0% 108.3% 88.7% 89.4% ‘12 ‘10 ‘09 ‘08 ‘07 ‘06 ‘11 115.1% Gross Written Premium Pre-Tax Operating Income & Combined Ratio ‘12 ‘10 ‘09 ‘08 ‘07 ‘06 ‘11 Combined Ratio PTOI
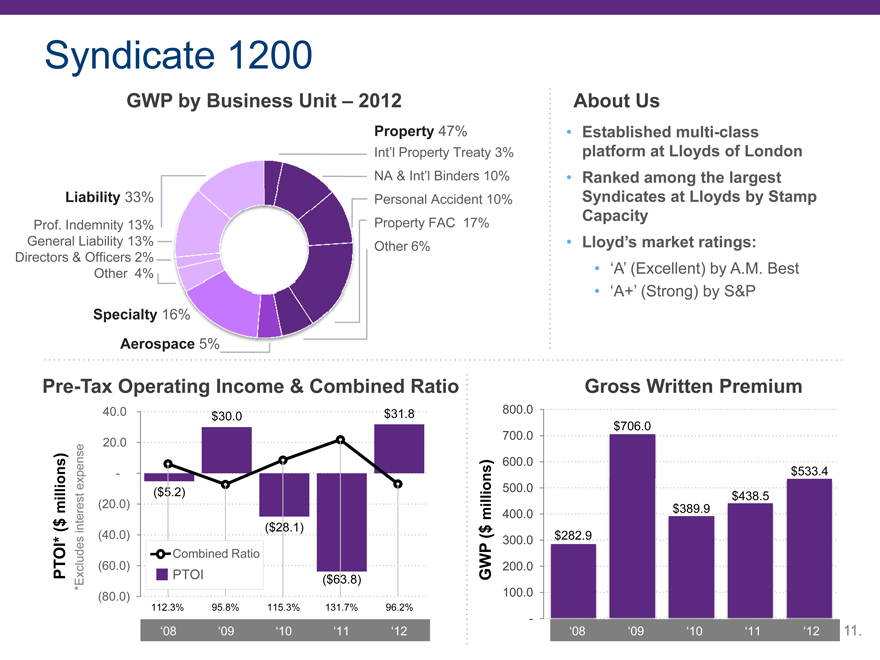
(CHART) (CHART) Syndicate 1200 About Us Established multi-class platform at Lloyds of London Ranked among the largest Syndicates at Lloyds by Stamp Capacity Lloyd’s market ratings: ‘A’ (Excellent) by A.M. Best ‘A+’ (Strong) by S&P GWP by Business Unit – 2012 Property 47% Liability 33% Specialty 16% Aerospace 5% Prof. Indemnity 13% General Liability 13% Directors & Officers 2% Other 4% Int’l Property Treaty 3% NA & Int’l Binders 10% Personal Accident 10% Property FAC 17% Other 6% 11. (CHART) (CHART) GWP ($ millions) PTOI* ($ millions) *Excludes interest expense 115.3% 131.7% 95.8% 112.3% ‘12 ‘10 ‘09 ‘08 ‘11 96.2% Gross Written Premium Pre-Tax Operating Income & Combined Ratio ‘12 ‘10 ‘09 ‘08 ‘11 Combined Ratio PTOI
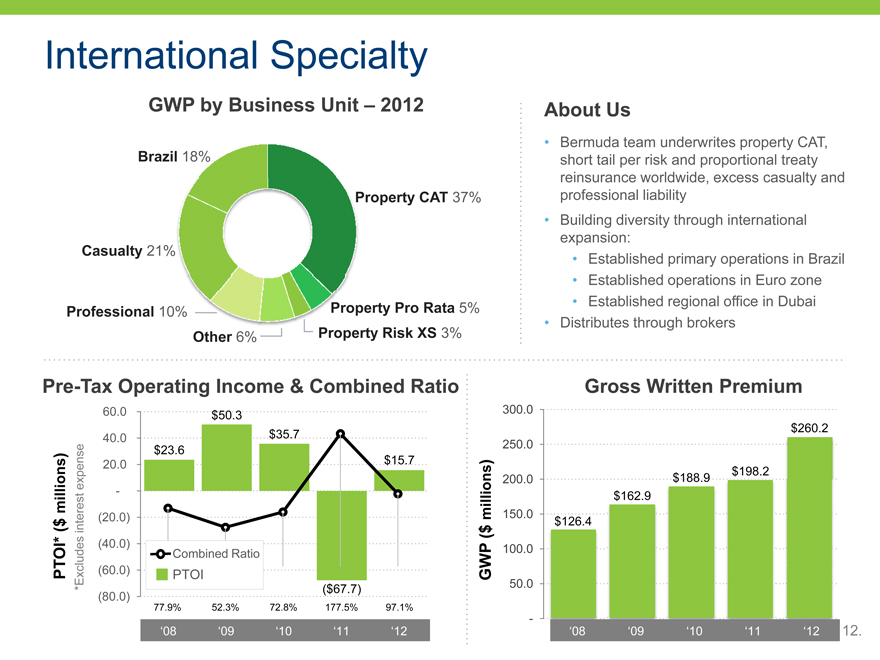
(CHART) (CHART) (CHART) International Specialty About Us Bermuda team underwrites property CAT, short tail per risk and proportional treaty reinsurance worldwide, excess casualty and professional liability Building diversity through international expansion: Established primary operations in Brazil Established operations in Euro zone Established regional office in Dubai Distributes through brokers GWP by Business Unit – 2012 Property CAT 37% Casualty 21% Professional 10% Other 6% Property Pro Rata 5% 12. Property Risk XS 3% Brazil 18% (CHART) GWP ($ millions) PTOI* ($ millions) *Excludes interest expense 72.8% 177.5% 52.3% 77.9% ‘12 ‘10 ‘09 ‘08 ‘11 97.1% Gross Written Premium Pre-Tax Operating Income & Combined Ratio ‘12 ‘10 ‘09 ‘08 ‘11 Combined Ratio PTOI
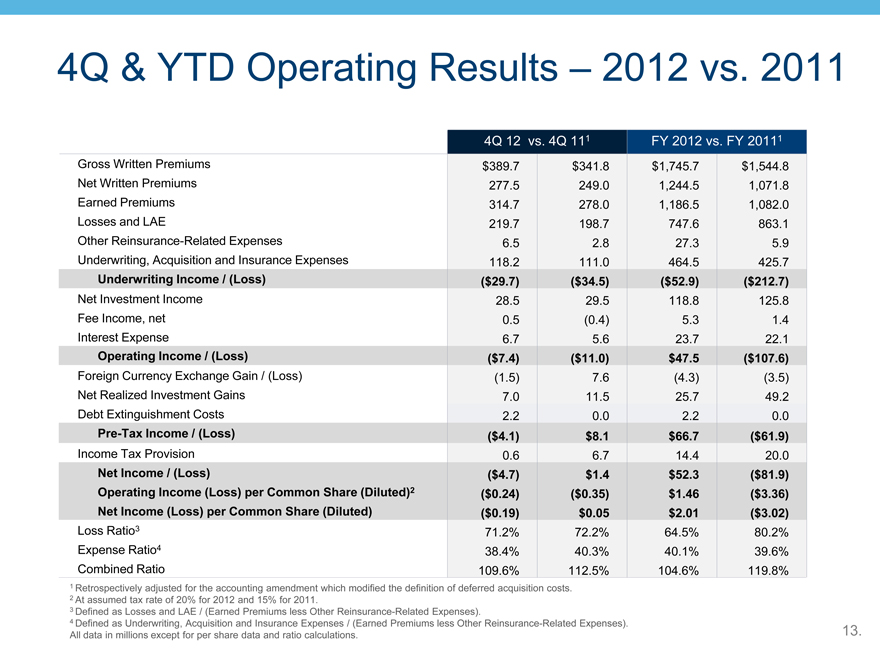
4Q & YTD Operating Results – 2012 vs. 2011 13.
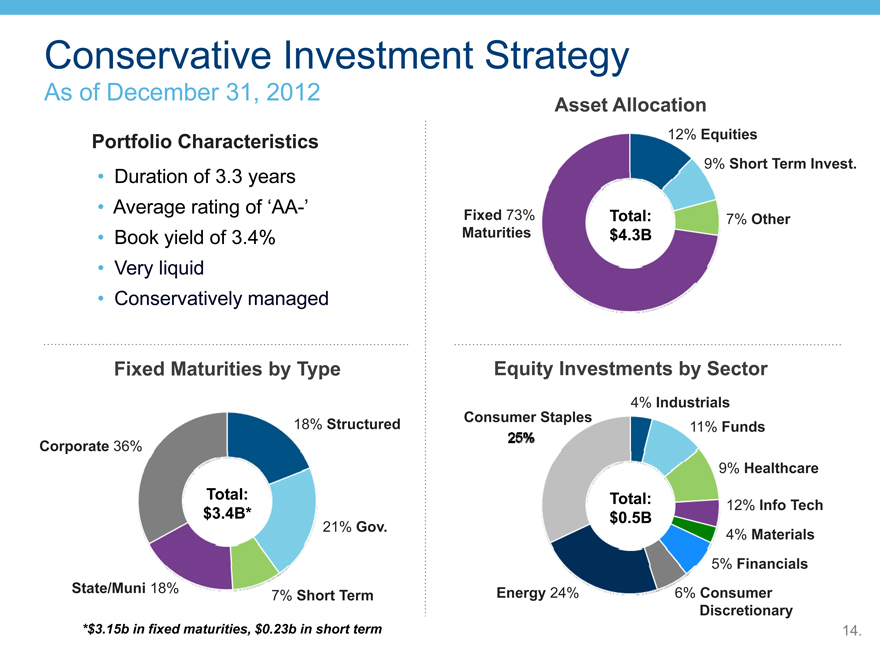
17% 14. Conservative Investment Strategy As of December 31, 2012 Duration of 3.3 years Average rating of ‘AA-’ Book yield of 3.4% Very liquid Conservatively managed Portfolio Characteristics Equity Investments by Sector 9% Healthcare Energy 24% 4% Industrials 11% Funds 5% Financials 12% Info Tech 4% Materials 6% Consumer Discretionary Consumer Staples Total: $4.3B Total: $0.5B Fixed Maturities by Type 7% Short Term Corporate 36%. 21% Gov. 18% Structured State/Muni 18%. Total: $3.4B* *$3.15b in fixed maturities, $0.23b in short term
Argo Group – Recap of Major Highlights Argo is an established carrier in the specialty insurance markets Broad platform is well-positioned to take advantage of improving market International platform supports diversification and future growth strategy Recent strategic initiatives are beginning to yield results Underwriting focus and talent are key competitive advantages Management is committed to maximizing shareholder value Achieved double digit book value per share growth since 2002 Well capitalized Will continue to return capital as appropriate 15.