Attached files
| file | filename |
|---|---|
| 8-K - FORM 8-K - ASPEN INSURANCE HOLDINGS LTD | d485265d8k.htm |
Exhibit 99.1
BANK OF AMERICA MERRILL LYNCH INSURANCE CONFERENCE
FEBRUARY 2013
Aspen Insurance Holdings Limited
SAFE HARBOR DISCLOSURE
This slide presentation is for information purposes only. It should be read in conjunction with our financial supplement posted on our website on the Investor Relations page and with other documents filed or to be filed shortly by Aspen Insurance Holdings Limited (the “Company” or “Aspen”) with the US Securities and Exchange Commission.
Non-GAAP Financial Measures
In presenting Aspen’s results, management has included and discussed certain “non-GAAP financial measures”, as such term is defined in Regulation G. Management believes that these non-GAAP financial measures, which may be defined differently by other companies, better explain Aspen’s results of operations in a manner that allows for a more complete understanding of the underlying trends in Aspen’s business. However, these measures should not be viewed as a substitute for those determined in accordance with GAAP. The reconciliation of such non-GAAP financial measures to their respective most directly comparable GAAP financial measures in accordance with Regulation G is included herein or in the financial supplement, as applicable, which can be obtained from the Investor Relations section of Aspen’s website at www.aspen.co.
Application of the Safe Harbor of the Private Securities Litigation Reform Act of 1995:
This presentation contains, written or oral “forward-looking statements” within the meaning of the US federal securities laws. These statements are made pursuant to the safe harbor provisions of the Private Securities Litigation Reform Act of 1995. Forward-looking statements include all statements that do not relate solely to historical or current facts, and can be identified by the use of words such as “expect,” “intend,” “plan,” “believe,” “do not believe,” “aim,” “project,” “anticipate,” “seek,” “will,” “estimate,” “may,” “continue,” “guidance,” and similar expressions of a future or forward-looking nature.
All forward-looking statements address matters that involve risks and uncertainties. Accordingly, there are or will be important factors that could cause actual results to differ materially from those indicated in these statements. Aspen believes these factors include, but are not limited to: the possibility of greater frequency or severity of claims and loss activity, including as a result of natural or man-made (including economic and political risks) catastrophic or material loss events, than our underwriting, reserving, reinsurance purchasing or investment practices have anticipated; the reliability of, and changes in assumptions to, natural and man-made catastrophe pricing, accumulation and estimated loss models; evolving issues with respect to interpretation of coverage after major loss events and any intervening legislative or governmental action and changing judicial interpretation and judgments on insurers’ liability to various risks; the effectiveness of our loss limitation methods; changes in the total industry losses, or our share of total industry losses, resulting from past events and, with respect to such events, our reliance on loss reports received from cedants and loss adjustors, our reliance on industry loss estimates and those generated by modeling techniques, changes in rulings on flood damage or other exclusions as a result of prevailing lawsuits and case law; the impact of acts of terrorism and acts of war and related legislation; decreased demand for our insurance or reinsurance products and cyclical changes in the insurance and reinsurance sectors; any changes in our reinsurers’ credit quality and the amount and timing of reinsurance recoverables; changes in the availability, cost or quality of reinsurance or retrocessional coverage; the continuing and uncertain impact of the current depressed
economic environment in many of the countries in which we operate; the persistence of the global financial crisis and the Eurozone debt crisis; the level of inflation in repair costs due to limited availability of labor and materials after catastrophes; changes in insurance and reinsurance market conditions; increased competition on the basis of pricing, capacity, coverage terms or other factors and the related demand and supply dynamics as contracts come up for renewal; a decline in our operating subsidiaries’ ratings with Standard & Poor’s (“S&P”), A.M. Best Company, Inc. (“A.M. Best”) or Moody’s Investor Service (“Moody’s”); our ability to execute our business plan to enter new markets, introduce new products and develop new distribution channels, including their integration into our existing operations; changes in general economic conditions, including inflation, foreign currency exchange rates, interest rates and other factors that could affect our investment portfolio; the risk of a material decline in the value or liquidity of all or parts of our investment portfolio; changes in our ability to exercise capital management initiatives or to arrange banking facilities as a result of prevailing market changes or changes in our financial position; changes in government regulations or tax laws in jurisdictions where we conduct business; Aspen Holdings or Aspen Bermuda becoming subject to income taxes in the United States or the United Kingdom; loss of key personnel; and increased counterparty risk due to the credit impairment of financial institutions. For a more detailed description of these uncertainties and other factors, please see the “Risk Factors” section in Aspen’s Annual Report on Form 10-K as filed with the US Securities and Exchange Commission on February 28, 2012. Aspen undertakes no obligation to publicly update or revise any forward-looking statements, whether as a result of new information, future events or otherwise. Readers are cautioned not to place undue reliance on these forward-looking statements, which speak only as of the dates on which they are made.
In addition, any estimates relating to loss events involve the exercise of considerable judgment and reflect a combination of ground-up evaluations, information available to date from brokers and cedants, market intelligence, initial tentative loss reports and other sources. The actuarial range of reserves and management’s best estimate represents a distribution from our internal capital model for reserving risk based on our then current state of knowledge and explicit and implicit assumptions relating to the incurred pattern of claims, the expected ultimate settlement amount, inflation and dependencies between lines of business. Due to the complexity of factors contributing to the losses and the preliminary nature of the information used to prepare these estimates, there can be no assurance that Aspen’s ultimate losses will remain within the stated amounts.
AHL: NYSE 2
CONTENTS
• Framework for Creating Shareholder Value
• Who We Are & What We Do
• Financial Highlights Full Year 2012
• Creating Shareholder Value
-The Aspen Approach
-Optimization of Business Portfolio
-Proactive Management of Capital
-Delivering Strong Investment Returns
• Appendix
AHL: NYSE 3
ASPEN GROUP
FRAMEWORK FOR CREATING SHAREHOLDER VALUE
• Executing plan to drive higher operating return on equity (ROE) and diluted book value per share (BVPS) growth
-Optimizing business portfolio to free up capital and improve risk-adjusted returns
-Improving capital efficiency
-Enhancing investment yield within acceptable risk parameters
• Pursuing selective growth in exposures we know and understand, subject to market conditions
-Diversified platform allows us to take advantage of areas where rates are improving
-Significant portion of growth expected to be in diversifying lines that will consume minimal incremental capital
• We expect to return most of our earnings to shareholders through dividends and share repurchases after setting aside the amount we need for growth in risk capital
Goal: 10% ROE in 2014 (1)
(1) As at February 7, 2013; Given the current interest rate and pricing environments, assuming normal loss experience and including a pre tax cat
AHL: NYSE 4
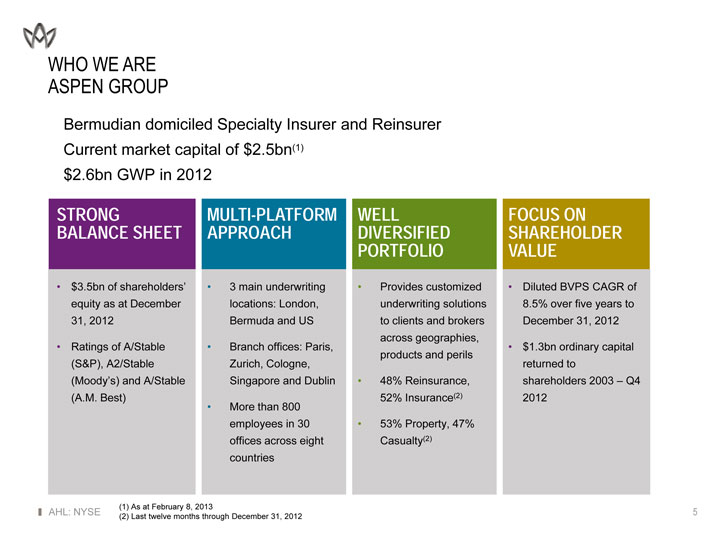
WHO WE ARE ASPEN GROUP
• Bermudian domiciled Specialty Insurer and Reinsurer
• Current market capital of $2.5bn(1)
• $2.6bn GWP in 2012
STRONG BALANCE SHEET
• $3.5bn of shareholders’ equity as at December 31, 2012
• Ratings of A/Stable (S&P), A2/Stable (Moody’s) and A/Stable
(A.M. Best)
MULTI-PLATFORM APPROACH
| • |
|
3 main underwriting locations: London, Bermuda and US |
• Branch offices: Paris, Zurich, Cologne, Singapore and Dublin
• More than 800 employees in 30 offices across eight countries
WELL DIVERSIFIED PORTFOLIO
• Provides customized underwriting solutions to clients and brokers across geographies, products and perils
• 48% Reinsurance, 52% Insurance(2)
• 53% Property, 47% Casualty(2)
FOCUS ON SHAREHOLDER VALUE
• Diluted BVPS CAGR of
8.5% over five years to December 31, 2012
• $1.3bn ordinary capital returned to shareholders 2003 – Q4 2012
| (1) |
|
As at February 8, 2013 |
| (2) |
|
Last twelve months through December 31, 2012 |
AHL: NYSE 5
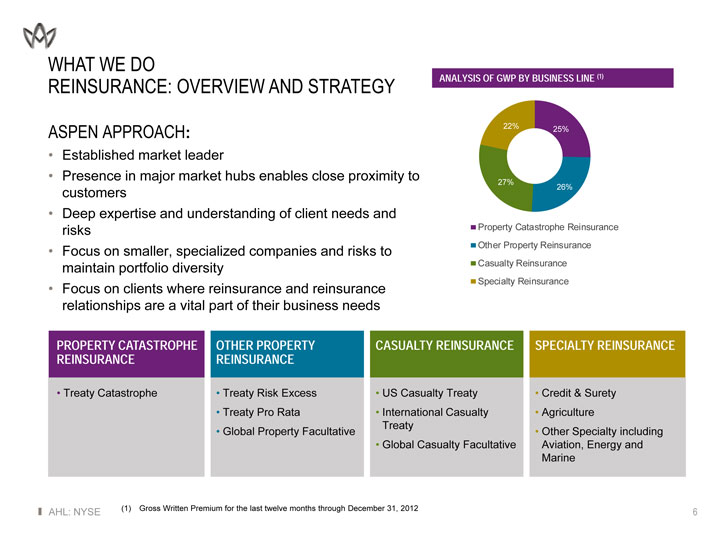
WHAT WE DO
REINSURANCE: OVERVIEW AND STRATEGY
ASPEN APPROACH:
• Established market leader
• Presence in major market hubs enables close proximity to customers
• Deep expertise and understanding of client needs and risks
• Focus on smaller, specialized companies and risks to maintain portfolio diversity
• Focus on clients where reinsurance and reinsurance relationships are a vital part of their business needs
ANALYSIS OF GWP BY BUSINESS LINE (1)
22% 25%
27%
26%
Property Catastrophe Reinsurance Other Property Reinsurance Casualty Reinsurance Specialty Reinsurance
PROPERTY CATASTROPHE REINSURANCE
• Treaty Catastrophe
OTHER PROPERTY REINSURANCE
• Treaty Risk Excess
• Treaty Pro Rata
• Global Property Facultative
CASUALTY REINSURANCE
• US Casualty Treaty
• International Casualty Treaty
• Global Casualty Facultative
SPECIALTY REINSURANCE
• Credit & Surety
• Agriculture
• Other Specialty including Aviation, Energy and Marine
| (1) |
|
Gross Written Premium for the last twelve months through December 31, 2012 |
AHL: NYSE
| 6 |
|
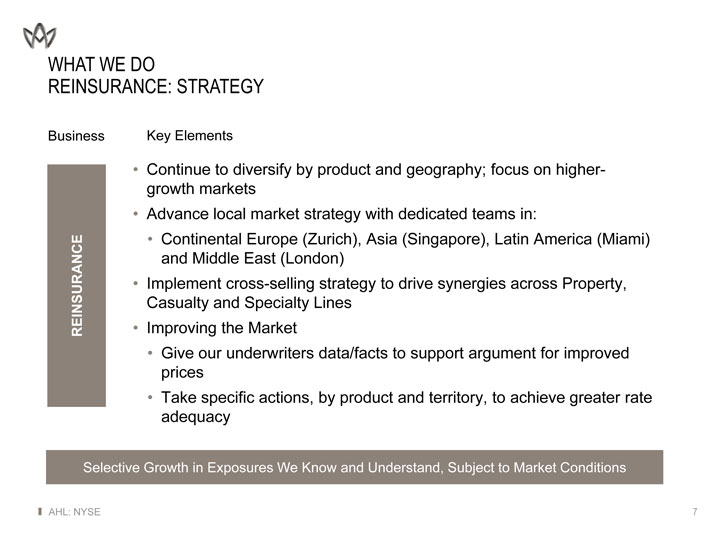
WHAT WE DO
REINSURANCE: STRATEGY
Business Key Elements
• Continue to diversify by product and geography; focus on higher-growth markets
• Advance local market strategy with dedicated teams in:
• Continental Europe (Zurich), Asia (Singapore), Latin America (Miami) and Middle East (London) SURANCE • Implement cross-selling strategy to drive synergies across Property, Casualty and Specialty Lines REIN • Improving the Market
• Give our underwriters data/facts to support argument for improved prices
• Take specific actions, by product and territory, to achieve greater rate adequacy
Selective Growth in Exposures We Know and Understand, Subject to Market Conditions
AHL: NYSE 7
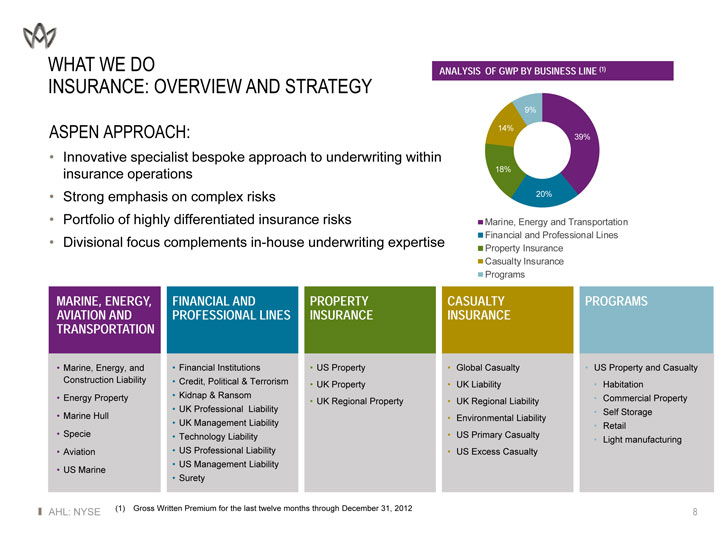
WHAT WE DO
INSURANCE: OVERVIEW AND STRATEGY
ASPEN APPROACH:
• Innovative specialist bespoke approach to underwriting within insurance operations
• Strong emphasis on complex risks
• Portfolio of highly differentiated insurance risks
• Divisional focus complements in-house underwriting expertise
ANALYSIS OF GWP BY BUSINESS LINE (1)
9%
14%
39% 18% 20%
Marine, Energy and Transportation Financial and Professional Lines Property Insurance Casualty Insurance Programs
MARINE, ENERGY, AVIATION AND TRANSPORTATION
• Marine, Energy, and Construction Liability
• Energy Property
• Marine Hull
• Specie
• Aviation
• US Marine
FINANCIAL AND PROFESSIONAL LINES
• Financial Institutions
• Credit, Political & Terrorism
• Kidnap & Ransom
• UK Professional Liability
• UK Management Liability
• Technology Liability
• US Professional Liability
• US Management Liability
• Surety
PROPERTY INSURANCE
• US Property
• UK Property
• UK Regional Property
CASUALTY INSURANCE
• Global Casualty
• UK Liability
• UK Regional Liability
• Environmental Liability
• US Primary Casualty
• US Excess Casualty
PROGRAMS
• US Property and Casualty
• Habitation
• Commercial Property
• Self Storage
• Retail
• Light manufacturing
| (1) |
|
Gross Written Premium for the last twelve months through December 31, 2012 |
AHL: NYSE
| 8 |
|
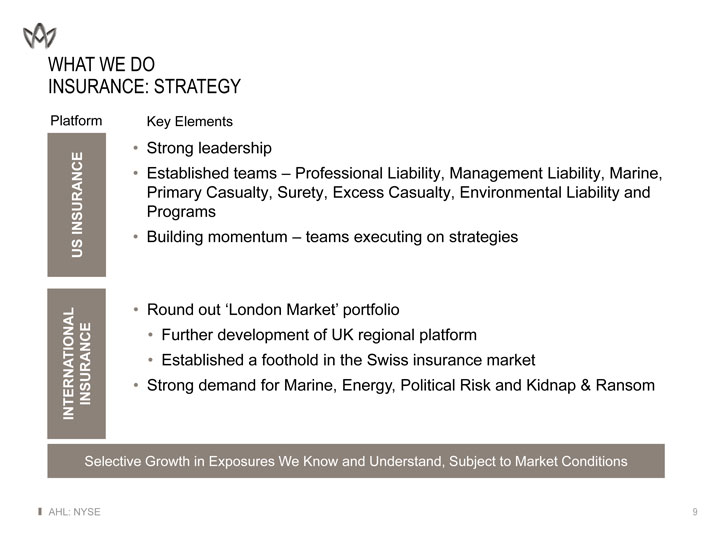
WHAT WE DO
INSURANCE: STRATEGY
Platform Key Elements
US INSURANCE
• Strong leadership
• Established teams – Professional Liability, Management Liability, Marine, Primary Casualty, Surety, Excess Casualty, Environmental Liability and Programs
• Building momentum – teams executing on strategies
INTERNATIONAL INSURANCE
• Round out ‘London Market’ portfolio
• Further development of UK regional platform
• Established a foothold in the Swiss insurance market
• Strong demand for Marine, Energy, Political Risk and Kidnap & Ransom
Selective Growth in Exposures We Know and Understand, Subject to Market Conditions
AHL: NYSE 9
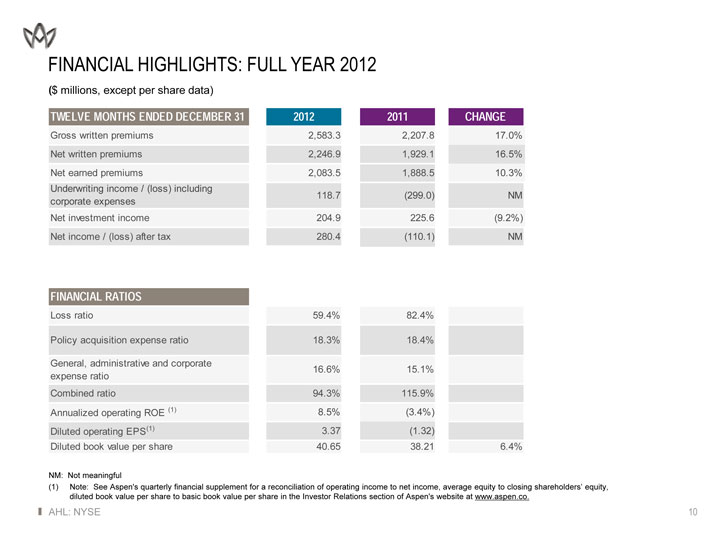
FINANCIAL HIGHLIGHTS: FULL YEAR 2012
($ millions, except per share data)
TWELVE MONTHS ENDED DECEMBER 31 2012 2011 CHANGE
Gross written premiums 2,583.3 2,207.8 17.0%
Net written premiums 2,246.9 1,929.1 16.5%
Net earned premiums 2,083.5 1,888.5 10.3%
Underwriting income / (loss) including
corporate expenses 118.7 (299.0) NM
Net investment income 204.9 225.6 (9.2%)
Net income / (loss) after tax 280.4 (110.1) NM
FINANCIAL RATIOS
Loss ratio 59.4% 82.4%
Policy acquisition expense ratio 18.3% 18.4%
General, administrative and corporate 16.6% 15.1%
expense ratio
Combined ratio 94.3% 115.9%
Annualized operating ROE (1) 8.5% (3.4%)
Diluted operating EPS(1) 3.37 (1.32)
Diluted book value per share 40.65 38.21 6.4%
NM: Not meaningful
(1) Note: See Aspen’s quarterly financial supplement for a reconciliation of operating income to net income, average equity to closing shareholders’ equity, diluted book value per share to basic book value per share in the Investor Relations section of Aspen’s website at www.aspen.co.
AHL: NYSE 10
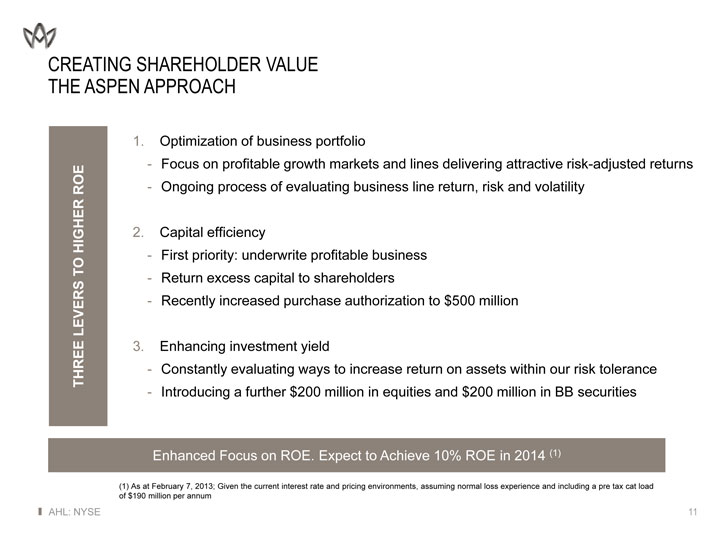
CREATING SHAREHOLDER VALUE THE ASPEN APPROACH
THREE LEVERS TO HIGHER ROE
1. Optimization of business portfolio
-Focus on profitable growth markets and lines delivering attractive risk-adjusted returns
-Ongoing process of evaluating business line return, risk and volatility
2. Capital efficiency
-First priority: underwrite profitable business
-Return excess capital to shareholders
-Recently increased purchase authorization to $500 million
3. Enhancing investment yield
-Constantly evaluating ways to increase return on assets within our risk tolerance
-Introducing a further $200 million in equities and $200 million in BB securities
Enhanced Focus on ROE. Expect to Achieve 10% ROE in 2014 (1)
(1) As at February 7, 2013; Given the current interest rate and pricing environments, assuming normal loss experience and including a pre tax cat load of $190 million per annum
AHL: NYSE 11
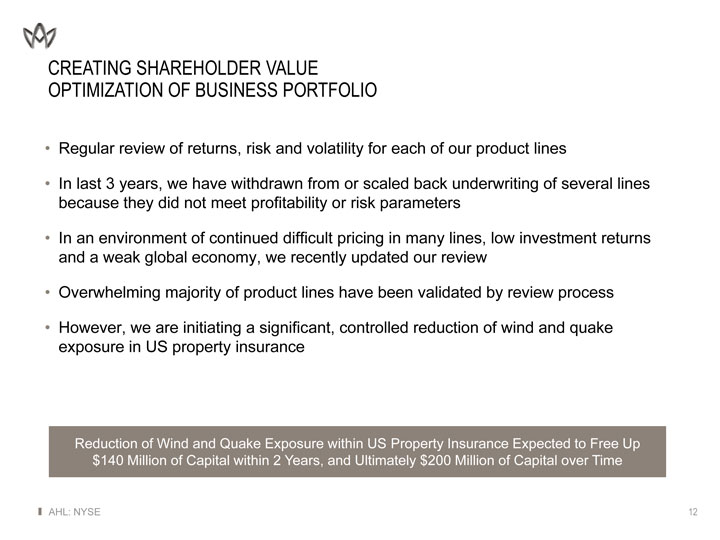
CREATING SHAREHOLDER VALUE OPTIMIZATION OF BUSINESS PORTFOLIO
• Regular review of returns, risk and volatility for each of our product lines
• In last 3 years, we have withdrawn from or scaled back underwriting of several lines because they did not meet profitability or risk parameters
• In an environment of continued difficult pricing in many lines, low investment returns and a weak global economy, we recently updated our review
• Overwhelming majority of product lines have been validated by review process
• However, we are initiating a significant, controlled reduction of wind and quake exposure in US property insurance
Reduction of Wind and Quake Exposure within US Property Insurance Expected to Free Up $140 Million of Capital within 2 Years, and Ultimately $200 Million of Capital over Time
AHL: NYSE 12
CREATING SHAREHOLDER VALUE PROACTIVE MANAGEMENT OF CAPITAL
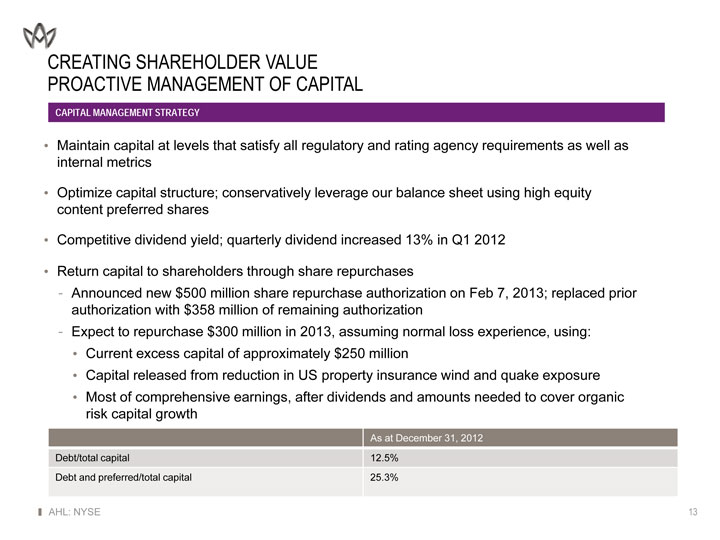
CAPITAL MANAGEMENT STRATEGY
• Maintain capital at levels that satisfy all regulatory and rating agency requirements as well as internal metrics
• Optimize capital structure; conservatively leverage our balance sheet using high equity content preferred shares
• Competitive dividend yield; quarterly dividend increased 13% in Q1 2012
• Return capital to shareholders through share repurchases
-Announced new $500 million share repurchase authorization on Feb 7, 2013; replaced prior authorization with $358 million of remaining authorization
-Expect to repurchase $300 million in 2013, assuming normal loss experience, using:
• Current excess capital of approximately $250 million
• Capital released from reduction in US property insurance wind and quake exposure
• Most of comprehensive earnings, after dividends and amounts needed to cover organic risk capital growth
As at December 31, 2012
Debt/total capital 12.5%
Debt and preferred/total capital 25.3%
AHL: NYSE 13
CREATING SHAREHOLDER VALUE
DELIVERING STRONG INVESTMENT RETURNS
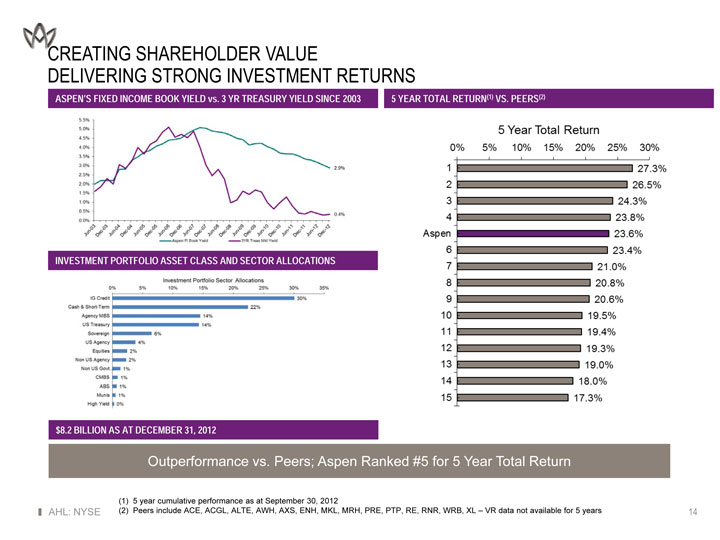
ASPEN’S FIXED INCOME BOOK YIELD vs. 3 YR TREASURY YIELD SINCE 2003 5 YEAR TOTAL RETURN(1) VS. PEERS(2)
INVESTMENT PORTFOLIO ASSET CLASS AND SECTOR ALLOCATIONS
$8.2 BILLION AS AT DECEMBER 31, 2012
Outperformance vs. Peers; Aspen Ranked #5 for 5 Year Total Return
| (1) |
|
5 year cumulative performance as at September 30, 2012 |
AHL: NYSE (2) Peers include ACE, ACGL, ALTE, AWH, AXS, ENH, MKL, MRH, PRE, PTP, RE, RNR, WRB, XL – VR data not available for 5 years 14
THE ASPEN APPROACH: CONCLUSION FOCUSED ON SHAREHOLDER VALUE
• Executing plan to drive higher ROE and BVPS growth
-Optimizing business portfolio to free up capital and improve risk-adjusted returns
-Improving capital efficiency
-Enhancing investment yield within acceptable risk parameters
• Pursuing selective growth in exposures we know and understand, subject to market conditions
-Diversified platform allows us to take advantage of areas where rates are improving
-Significant portion of growth expected to be in diversifying lines that will consume minimal incremental capital
• We expect to return most of our earnings to shareholders through dividends and share repurchases after setting aside the amount we need for growth in risk capital
Goal: 10% ROE in 2014 (1)
(1) As at February 7, 2013; Given the current interest rate and pricing environments, assuming normal loss experience and including a pre tax cat load of $190 million per annum
AHL: NYSE 15

APPENDIX
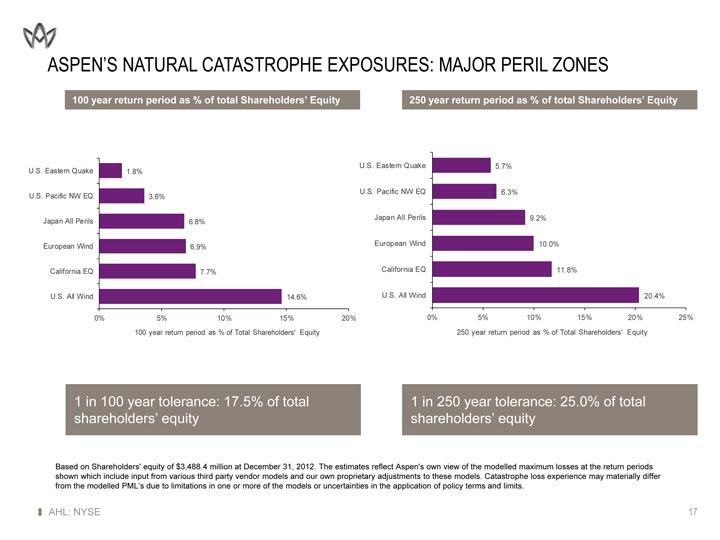
ASPEN’S NATURAL CATASTROPHE EXPOSURES: MAJOR PERIL ZONES
100 year return period as % of total Shareholders’ Equity 250 year return period as % of total Shareholders’ Equity
1 in 100 year tolerance: 17.5% of total 1 in 250 year tolerance: 25.0% of total shareholders’ equity shareholders’ equity
Based on Shareholders’ equity of $3,488.4 million at December 31, 2012. The estimates reflect Aspen’s own view of the modelled maximum losses at the return periods shown which include input from various third party vendor models and our own proprietary adjustments to these models. Catastrophe loss experience may materially differ from the modelled PML’s due to limitations in one or more of the models or uncertainties in the application of policy terms and limits.
AHL: NYSE 17
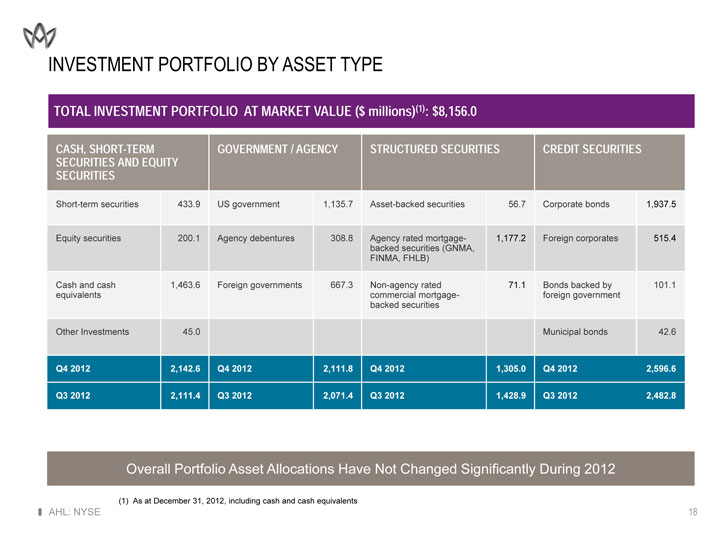
INVESTMENT PORTFOLIO BY ASSET TYPE
TOTAL INVESTMENT PORTFOLIO AT MARKET VALUE ($ millions)(1): $8,156.0
CASH, SHORT-TERM GOVERNMENT / AGENCY STRUCTURED SECURITIES CREDIT SECURITIES
SECURITIES AND EQUITY
SECURITIES
Short-term securities 433.9 US government 1,135.7 Asset-backed securities 56.7 Corporate bonds 1,937.5
Equity securities 200.1 Agency debentures 308.8 Agency rated mortgage—1,177.2 Foreign corporates 515.4
backed securities (GNMA,
FINMA, FHLB)
Cash and cash 1,463.6 Foreign governments 667.3 Non-agency rated 71.1 Bonds backed by 101.1
equivalents commercial mortgage— foreign government
backed securities
Other Investments 45.0 Municipal bonds 42.6
Q4 2012 2,142.6 Q4 2012 2,111.8 Q4 2012 1,305.0 Q4 2012 2,596.6
Q3 2012 2,111.4 Q3 2012 2,071.4 Q3 2012 1,428.9 Q3 2012 2,482.8
Overall Portfolio Asset Allocations Have Not Changed Significantly During 2012
| (1) |
|
As at December 31, 2012, including cash and cash equivalents |
AHL: NYSE 18
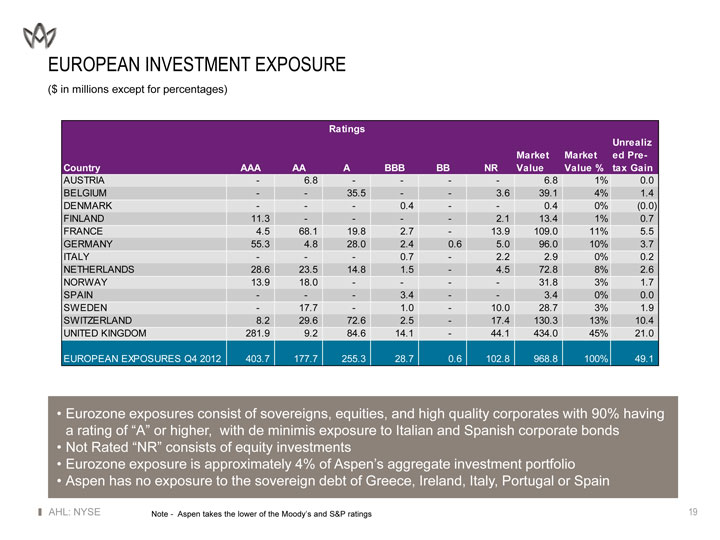
EUROPEAN INVESTMENT EXPOSURE
($ in millions except for percentages)
Ratings
Unrealiz
Market Market ed Pre-
Country AAA AA A BBB BB NR Value Value % tax Gain
AUSTRIA—6.8—— 6.8 1% 0.0
BELGIUM—35.5—3.6 39.1 4% 1.4
DENMARK——0.4—0.4 0% (0.0)
FINLAND 11.3—— 2.1 13.4 1% 0.7
FRANCE 4.5 68.1 19.8 2.7—13.9 109.0 11% 5.5
GERMANY 55.3 4.8 28.0 2.4 0.6 5.0 96.0 10% 3.7
ITALY——0.7—2.2 2.9 0% 0.2
NETHERLANDS 28.6 23.5 14.8 1.5—4.5 72.8 8% 2.6
NORWAY 13.9 18.0—— 31.8 3% 1.7
SPAIN——3.4—3.4 0% 0.0
SWEDEN—17.7—1.0—10.0 28.7 3% 1.9
SWITZERLAND 8.2 29.6 72.6 2.5—17.4 130.3 13% 10.4
UNITED KINGDOM 281.9 9.2 84.6 14.1—44.1 434.0 45% 21.0
EUROPEAN EXPOSURES Q4 2012 403.7 177.7 255.3 28.7 0.6 102.8 968.8 100% 49.1
• Eurozone exposures consist of sovereigns, equities, and high quality corporates with 90% having a rating of “A” or higher, with de minimis exposure to Italian and Spanish corporate bonds
• Not Rated “NR” consists of equity investments
• Eurozone exposure is approximately 4% of Aspen’s aggregate investment portfolio
• Aspen has no exposure to the sovereign debt of Greece, Ireland, Italy, Portugal or Spain
Note—Aspen takes the lower of the Moody’s and S&P ratings
AHL: NYSE
19