Attached files
| file | filename |
|---|---|
| 8-K - FORM 8-K - RENASANT CORP | d483127d8k.htm |
 Sterne Agee & Leach
Financial Institutions Investor
Conference
February 11-13, 2013
Exhibit 99.1 |
 2
Forward Looking Statement
This presentation contains forward-looking statements within the
meaning of the Private Securities Litigation Reform Act of
1995. Congress passed the Private Securities Litigation Act of 1995 in an effort to encourage corporations to provide
information about companies’ anticipated future financial
performance. This act provides a safe harbor for such disclosure,
which protects the companies from unwarranted litigation if
actual results are different from management expectations. This
release contains forward looking statements within the meaning of the
Private Securities Litigation Reform Act, and reflects
management’s current views and estimates of future economic
circumstances, industry conditions, company performance, and
financial results. These forward looking statements are subject
to a number of factors and uncertainties which could cause
Renasant’s, M&F’s or the combined company’s actual
results and experience to differ from the anticipated results and
expectations expressed in such forward looking statements.
Forward looking statements speak only as of the date they are made
and neither Renasant nor M&F assumes any duty to update forward
looking statements. In addition to factors previously
disclosed in Renasant’s and M&F’s reports filed with the
SEC and those identified elsewhere in presentation, these forward-
looking statements include, but are not limited to, statements about
(i) the expected benefits of the transaction between Renasant and
M&F and between Renasant Bank and Merchants and Farmers Bank, including future financial and operating results, cost
savings, enhanced revenues and the expected market position of the
combined company that may be realized from the transaction, and
(ii) Renasant and M&F’s plans, objectives, expectations and intentions and other statements contained in this
presentation that are not historical facts. Other statements
identified by words such as “expects,” “anticipates,” “intends,”
“plans,” “believes,” “seeks,”
“estimates,” “targets,” “projects” or words of similar meaning generally are intended to identify
forward-looking statements. These statements are based upon
the current beliefs and expectations of Renasant’s and M&F’s
management and are inherently subject to significant business, economic
and competitive risks and uncertainties, many of which are
beyond their respective control. In addition, these forward-looking statements are subject to assumptions with respect
to future business strategies and decisions that are subject to
change. Actual results may differ materially from those indicated
or implied in the forward-looking statements. |
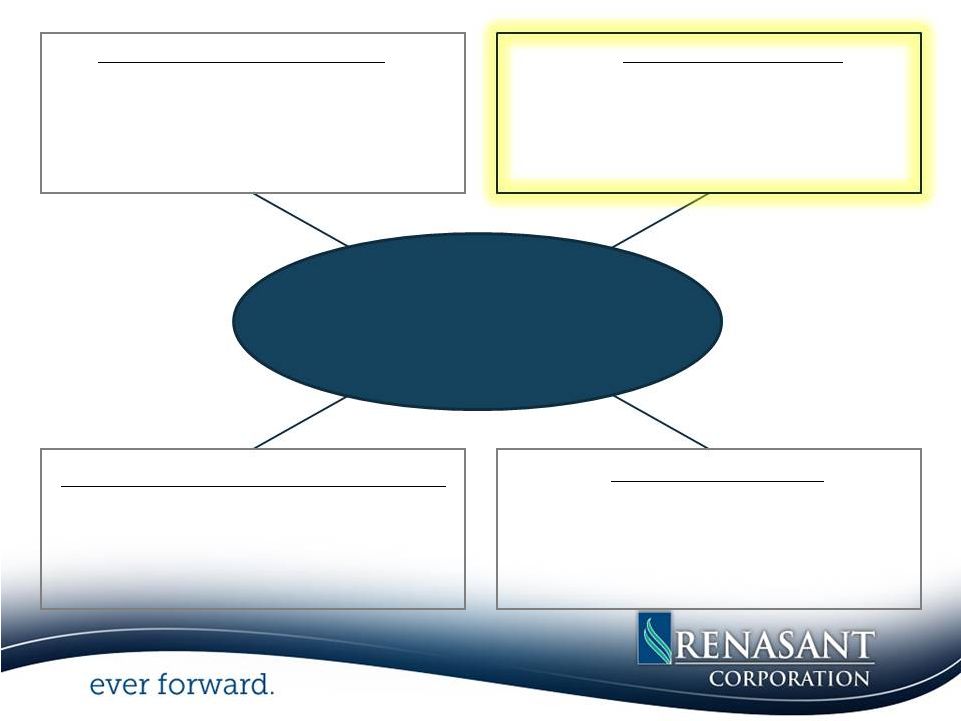
 Capitalize on Opportunities
Leverage Existing Markets
FDIC Assisted Acquisitions
Seek New Markets
Enhance Lines of Business
Build Capital Ratios
Selective Balance Sheet Growth
Maintain Dividend
Non-TARP Participant
3
Enhance Profitability
Noninterest Expense Control
Execution of
Execution of
Strategic
Strategic
Initiatives
Aggressively Manage Problem Credits
Quarantine Troubled Assets
“Good Bank/Bad Bank”
Structure
Managed Asset Growth
Loan Growth
Core Deposit Growth
Net Int Margin Expansion/Int Rate Risk |
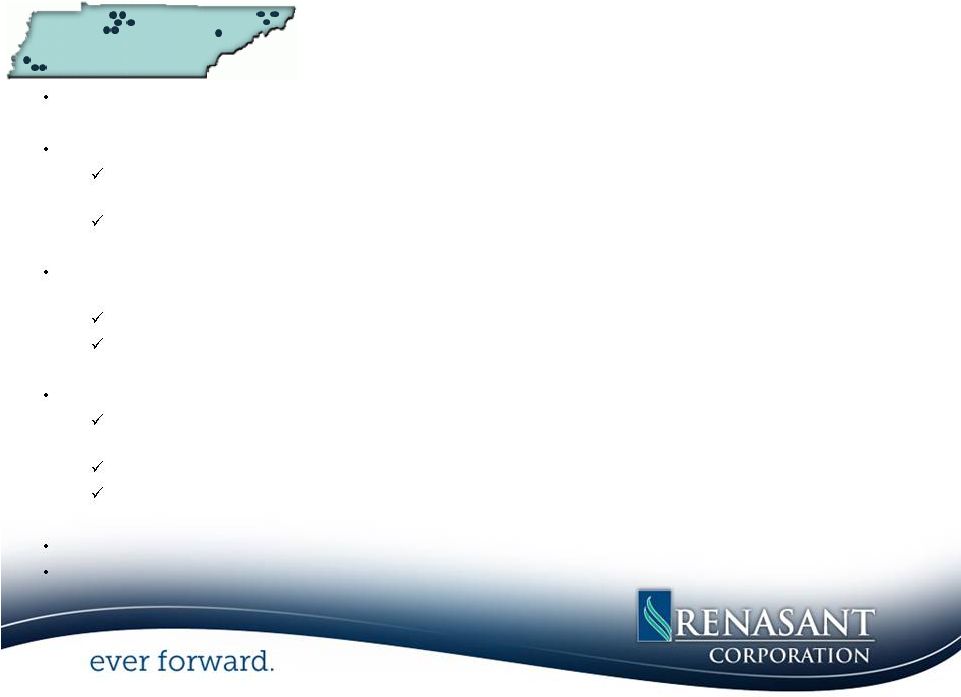
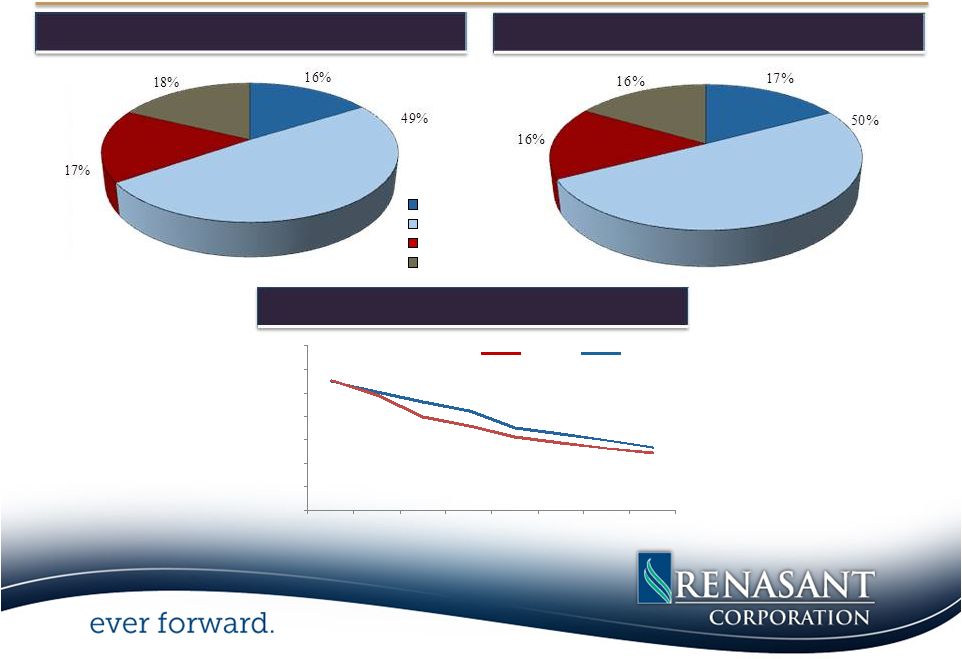
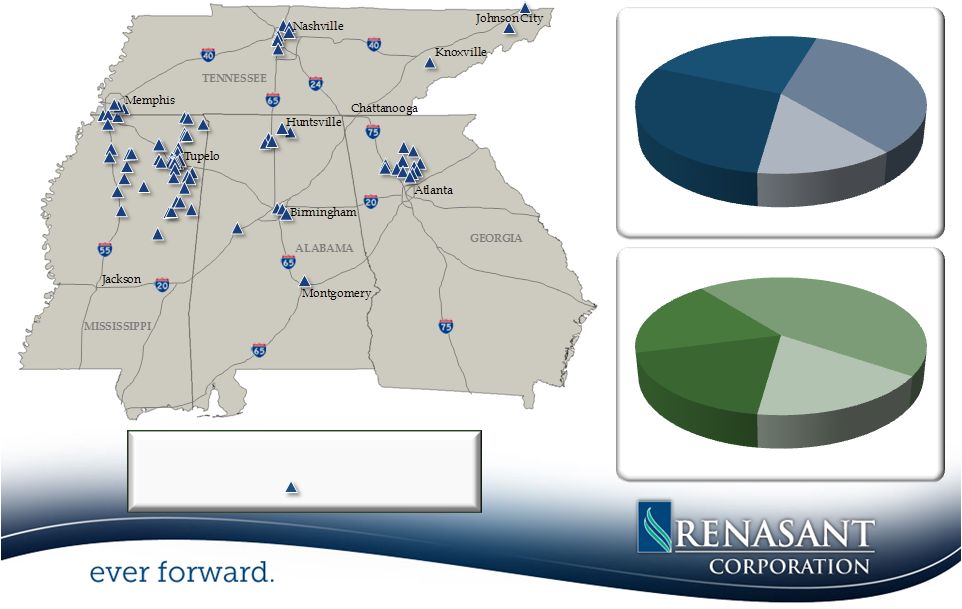 Over 75 banking, lending, financial services and insurance offices
Portfolio Loans: $2.81B
Total Deposits: $3.46B
4
TN
19%
AL
18%
MS
45%
GA
18%
Existing Footprint
RNST
TN
30%
AL
23%
MS
34%
GA
13%
Targeted Market Expansion |
 5
*Source: Dunn & Bradstreet
Small businesses defined as businesses with annual sales less than $5 million
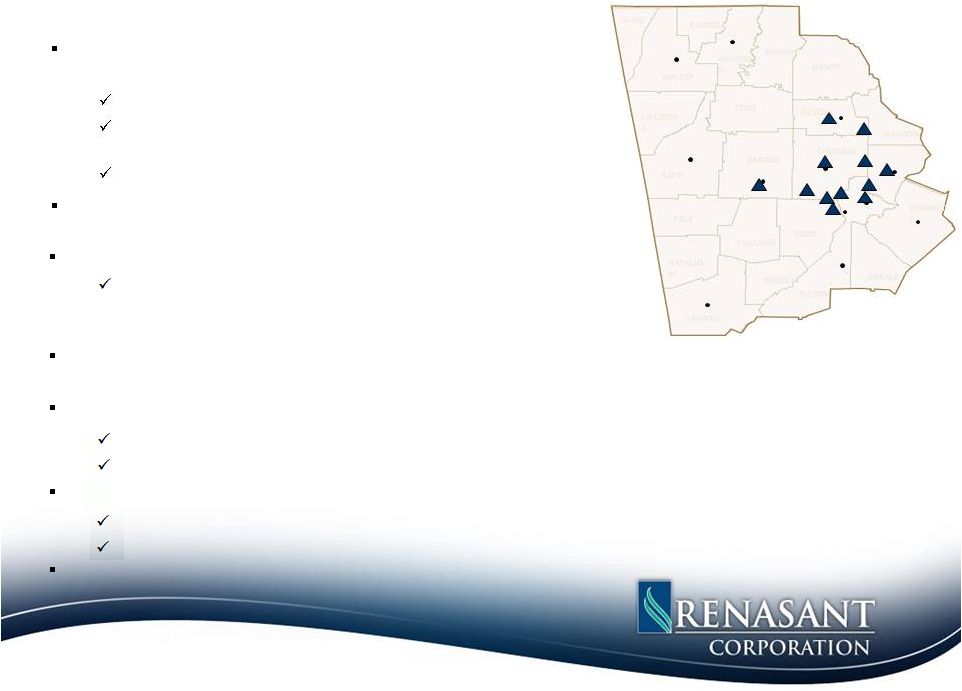
ATLANTA
Roswell
Alpharetta
Cartersville
Canton
Cumming
Jasper
Dalton
Rome
Lafayette
Georgia
Entered the North GA market through two FDIC loss
share
transactions
12 full-service locations
Footprint located in attractive markets with
long-term
growth potential
Expanded our mortgage and wealth management personnel
Over 36K small businesses* in our GA footprint, of which many
are being under-served due to the lack of strong community
banks Carrollton
Woodstock
Lawrenceville
Median home sales prices increased 25.3%
Pending sales are up an average of 16.5%
Positive economic developments in Georgia markets
Recent announcement of a $600M mixed-use project in
the
Alpharetta area, to be located on the GA 400
corridor with construction to begin in
early 2013 According to a recent study conducted by Georgetown
University, Georgia is one of
the
top two states that will add health-care related jobs between
2010 and 2020 Housing inventories have declined 36% to a 4.8
month’s supply year-over-year Loans total $372M at
December 2012 Recently established an asset based lending
division Growth
in
non-covered
loans
continue
to
offset
the
decline
in
covered
loans
on
a
Y-T-D
basis
64% of the loans outstanding are covered under FDIC loss share
agreements |
 6
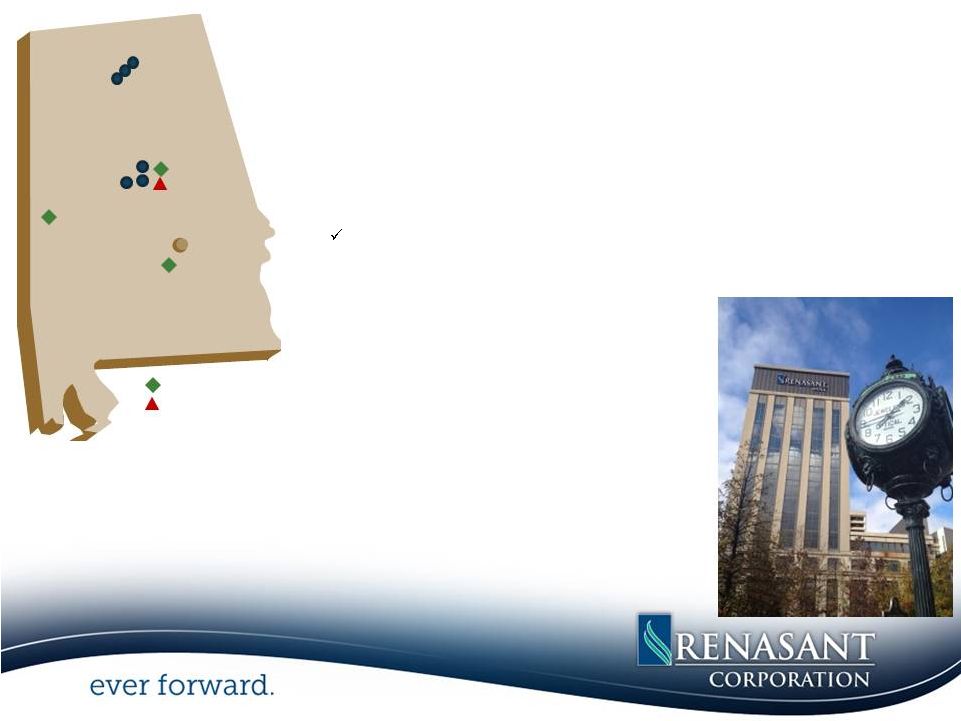
Huntsville/
Decatur
Montgomery
Tuscaloosa
Birmingham
Acquisition
De Novo
•
Entered the Montgomery and Tuscaloosa markets during late
3Q11 with the hiring of an experienced management team well
entrenched in the respective markets
•
Acquired RBC Bank USA’s Birmingham, AL Trust unit
on
Sept 1, 2011 with assets under management of $680M
•
Birmingham leads the state in the health care
industry with an annual payroll of approximately
$2.9B, followed by Huntsville with $998M
•
With an unemployment rate of 5.8% in December
Metro Birmingham is ranked number 8 out of top
50 MSA’s
•
All three auto makers (Honda, Hyundai, Mercedes-
Benz) are adding employees to keep pace with
demand
•
Net loan growth was 18.5% for the year, with loan
growth occurring in 11 out of the last 12 quarters
•
Proposed merger with First M&F will provide
$113.9 million loans, $184.4 million deposits and
4 branch locations
Account retention exceeded 95%
Alabama
|
 7
Tupelo
New Albany
De Novo
Toyota Plant
Columbus
Starkville
West Point
Mississippi
Entered the Columbus, MS market in November 2010 and opened an
office in
Starkville,
home
of
Mississippi
State
University,
during
late
3Q11
Columbus is home of the Columbus Air Force Base which trains one-third
of the nation’s pilots, and has a $250M economic impact
The Tupelo/Lee County market is showing positive signs of improvement
North MS Medical Center is constructing a $55M West Wing Tower
Toyota recently announced the completion of its 100,000
th
Corolla as
downstream suppliers are beginning to add new jobs
Tupelo recently approved the construction of an $11M aquatic center and
completed a $4M expansion of the Elvis Presley Birthplace and
Museum Hosts one of the largest furniture markets in the U.S., with
the Fall 2012
market attendance up 100% over markets held in the previous 5 years
Oxford, Tupelo and Columbus were noted by American Express as three of
the best small towns in America for business
Oxford has recently announced the construction of a $250M hospital
American Express also noted Desoto County for placing 7
th
nationally for
job creation in late 2011
Net loans grew 8.5% during 2012
Proposed
merger
with
First
M&F
will
add
$732.6
million
in
loans,
$1.2
billion in deposits and 30 branches |
 Opened the Knoxville/Maryville MSA location in late 2Q12 employing a 13
member management team to
be further utilized in the planned expansions in to Johnson
City/Bristol Tennessee ranked 7
th
best state to do business according to Area Development magazine
In the Nashville market, Hospital Corporation of American has announced an
expansion that will create 2,000 jobs over the next five years
The Memphis MSA market ranked #1 for Logistics Leaders both nationally and
globally Net loans grew by 8.8% during 2012
Proposed merger with First M&F will provide $19.9 million in loans,
$36.0 million in deposits and 2 branches 8
Tennessee
Memphis and Nashville
Driven
by
VW,
Nissan
and
GM,
Tennessee
was
named
as
the
#1
state
in
the
nation
for
automotive
manufacturing
strength
for
a
3
rd
consecutive
year
according
to
Business
Facilities
Magazine
The unemployment rate continues to improve for the state with the rate
declining to 7.6% down from 9.1% on a year over year basis
The Nashville housing market continues sustainability as sales increased
23.4% year-over-year The median home price increased
approximately 6% on a year-over-year, with average price/sq ft increasing
49.3%
Bass Pro Shops announced their intention to build a $70M hotel in
conjunction with their Pyramid flagship store
Electrolux has begun the hiring of some 1,200 workers from its expansion
announcement in 2010 The
housing
market
continues
to
improve
in
the
Memphis
market
as
home
sales
increased
on
a
year-over-year basis by approximately 16% with median sales prices
up slightly |
 9
Capitalize
on
Opportunities
Leverage Existing Markets
FDIC Assisted Acquisitions
Seek New Markets
Enhance Lines of Business
Enhance Profitability
Managed Asset Growth
Loan Growth
Core Deposit Growth
Net Int Margin Expansion/Int Rate Risk
Noninterest Expense Control
Build
Capital
Ratios
Selective Balance Sheet Growth
Maintain Dividend
Non-TARP Participant
Aggressively
Manage
Problem
Credits
Quarantine Troubled Assets
“Good Bank/Bad Bank”
Structure
Execution of
Execution of
Strategic
Strategic
Initiatives |
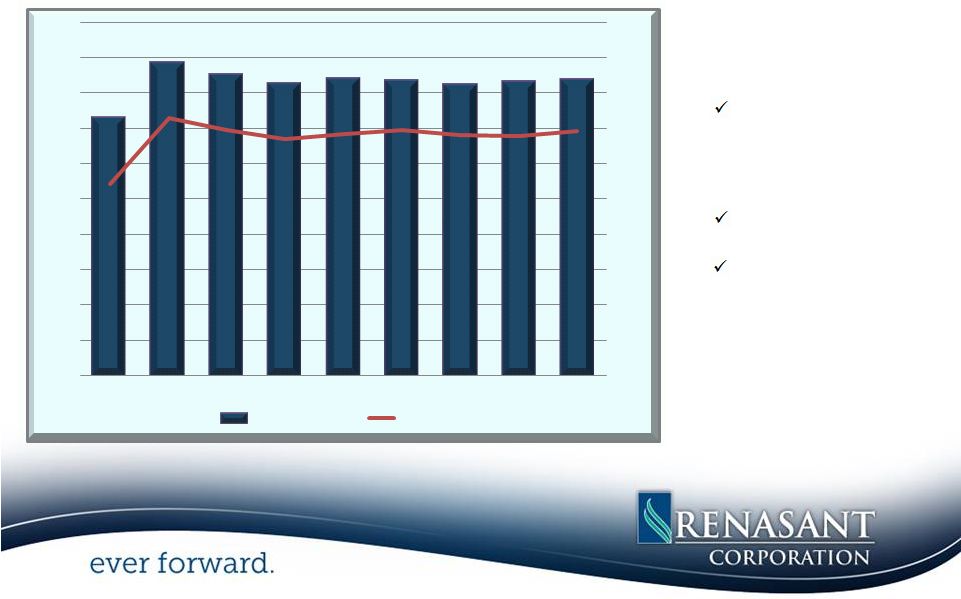 10
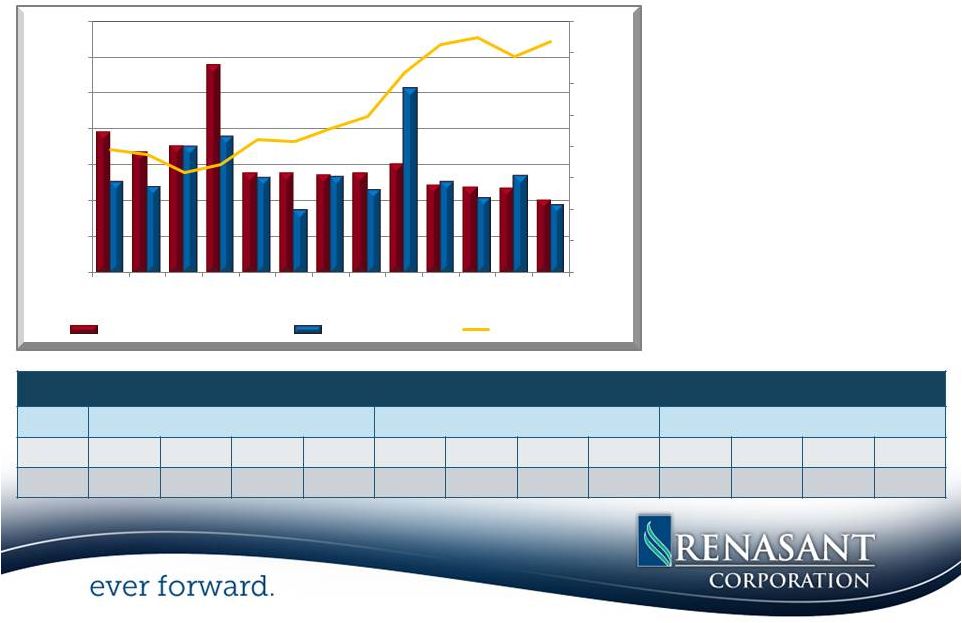
•
Asset levels have been managed
on a declining basis over the prior
quarters
Managed deposit mix by
emphasizing core deposit
growth while allowing
higher-priced, non-core
deposits to erode
Significantly paid down
high-costing borrowings
Restructured asset mix by
redeploying excess cash
levels into higher yielding
investments and loans
•
Loan demand will drive
deposit/funding growth going
forward
(in millions)
Total
Assets
3,642
4,422
4,259
4,136
4,202
4,176
4,112
4,164
4,182
$0
$500
$1,000
$1,500
$2,000
$2,500
$3,000
$3,500
$4,000
$4,500
$5,000
1Q10
1Q11
2Q11
3Q11
4Q11
1Q12
2Q12
3Q12
4Q12
Total Assets
Deposits |
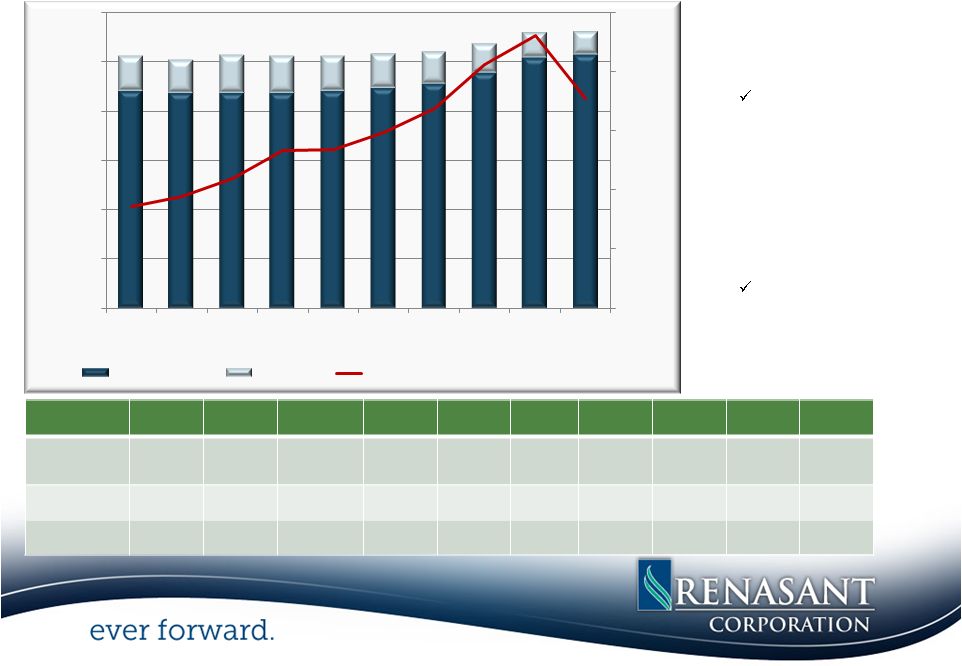 11
*Covered loans stated at fair value
•
Non-covered loans have
increased $331M or 15% on
a Y-O-Y basis
Approximately 46% of
2012 loan growth
originated from de novos
•
Covered loans declined $103M
during 2012
•
Consistent increases in
quarterly production
over
past 2 years
New loan production
totaled $177M for 4Q12
and $783M for the year,
outpacing 2011 by 49%
Total
Portfolio
Loans
$0
$50,000
$100,000
$150,000
$200,000
$250,000
$0
$500,000
$1,000,000
$1,500,000
$2,000,000
$2,500,000
$3,000,000
3Q10
4Q10
1Q11
2Q11
3Q11
4Q11
1Q12
2Q12
3Q12
4Q12
Non-Covered
Covered
Quarterly New Production (Right Axis)
3Q10
4Q10
1Q11
2Q11
3Q11
4Q11
1Q12
2Q12
3Q12
4Q12
Non-
Covered
$2,205
$2,191
$2,190
$2,186
$2,205
$2,242
$2,282
$2,392
$2,540
$2,573
Covered*
$360
$334
$387
$377
$360
$339
$318
$290
$260
$237
Total Loans
$2,565
$2,525
$2,577
$2,563
$2,565
$2,581
$2,600
$2,682
$2,800
$2,810 |
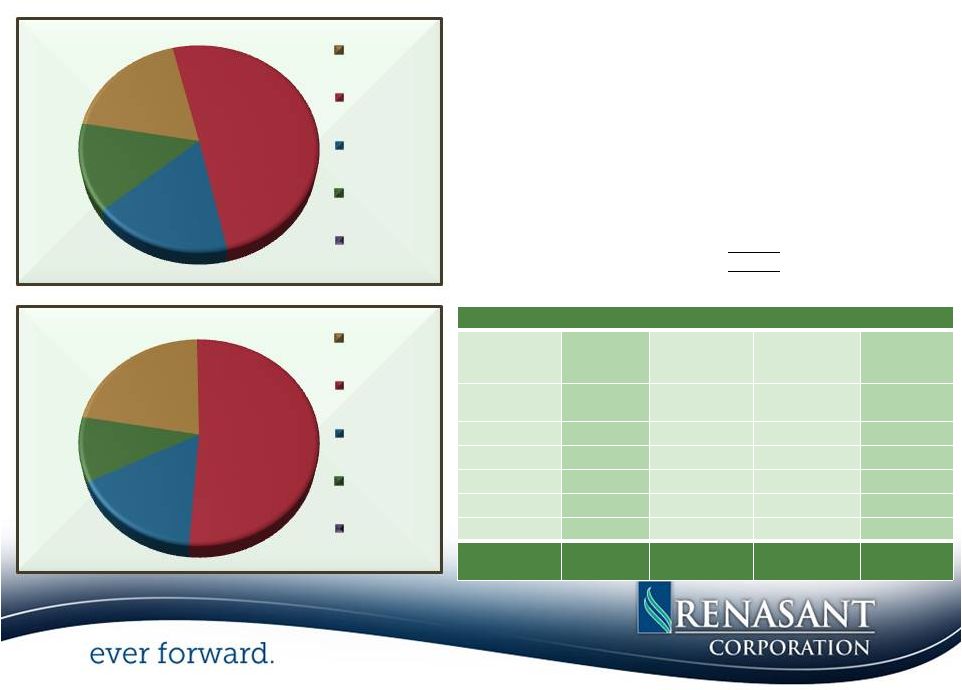
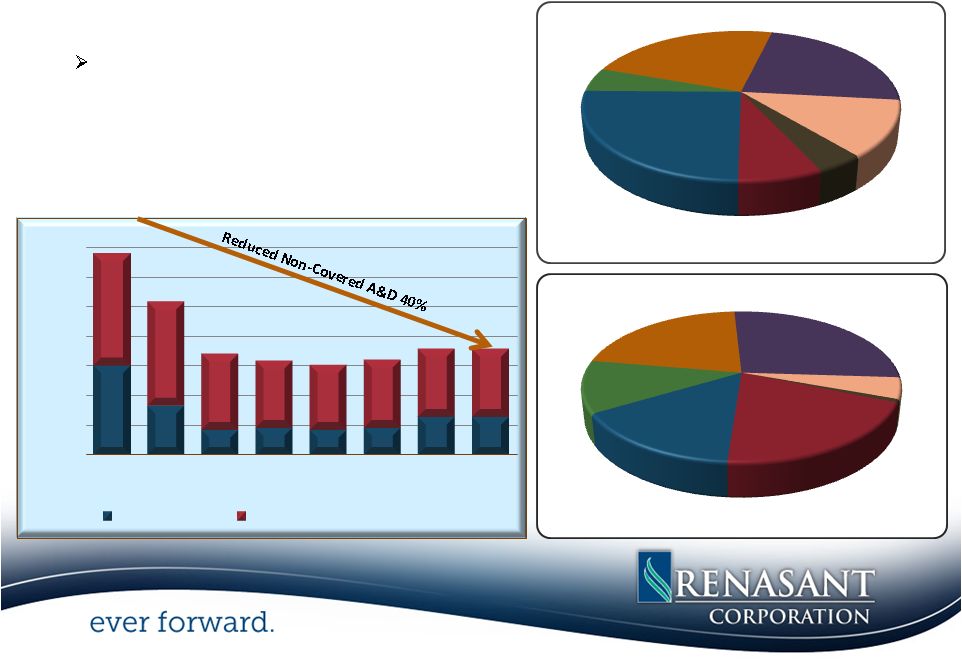 •
Loans totaled $2.80B
8.4% of portfolio covered by FDIC through an
80% loss share agreement
•
Owner occupied/C&I loans comprise 35% of the non
covered loan portfolio
•
Reduced non-covered A&D loans by 40% from 2008
12
* Covered loans stated at fair value
Diversified Loan Portfolio
241,818
133,299
66,798
74,159
67,223
73,109
103,522
104,058
302,409
281,521
205,981
179,549
176,201
184,649
181,876
181,439
$0
$80,000
$160,000
$240,000
$320,000
$400,000
$480,000
$560,000
2008
2009
2010
2011
1Q12
2Q12
3Q12
4Q12
Construction
Land Development (A&D)
Const
4%
Land Dev
7%
1-4 Family
25%
1-4 Family
Rental
5%
Non Owner
Occupied
24%
Owner
Occupied
23%
C&I
12%
Non Covered Loans $2.57B
Const
1%
Land Dev
20%
1-4 Family
15%
1-4 Family
Rental
11%
Non Owner
Occupied
21%
Owner
Occupied
27%
C&I
5%
Covered Loans $237M* |
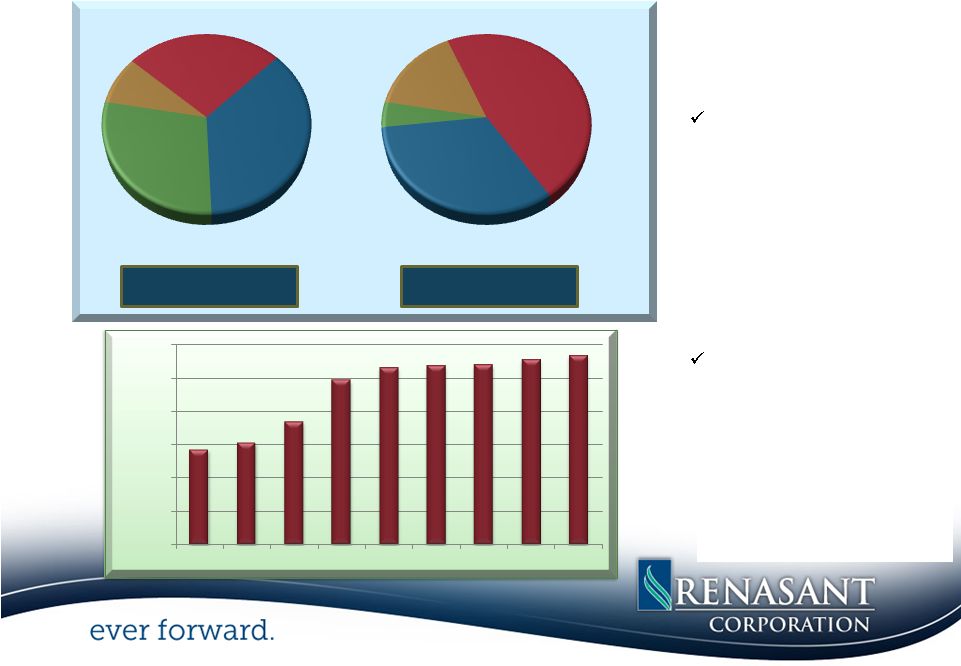 13
$3.28B
$3.62B
•
Non-interest bearing deposits
represent 16% of deposits, up
from 12% at year end 2008
DDA grew 7% on a Y-O-Y
basis
•
Time deposits totaling $207M
at WAR of 83 bps will be
maturing during 1Q13 with the
current repricing rate between
60-65 bps
•
Less reliance on borrowed
funds
Borrowed funds as a percentage
of funding sources declined
from 15% at year end 2008 to
5% at the end of 2012
Transition To Core Funding Cost of Funds
2.81%
Cost of Funds
.72%
DDA
10%
Other Int
Bearing
Accts
36%
Time
Deposits
39%
Borrowed
Funds
15%
2008
DDA
16%
Other Int
Bearing
Accts
47%
Time
Deposits
33%
Borrowed
Funds
5%
2012
-
100,000
200,000
300,000
400,000
500,000
600,000
2008
2009
2010
3Q11
2011
1Q12
2Q12
3Q12
4Q12
Non Interest Bearing Demand Deposits |
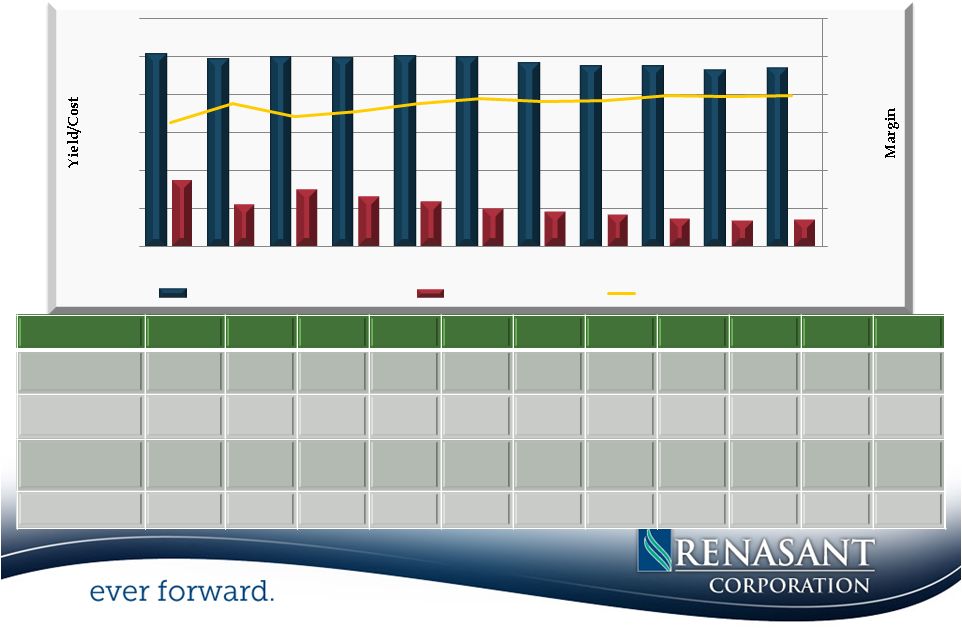 14
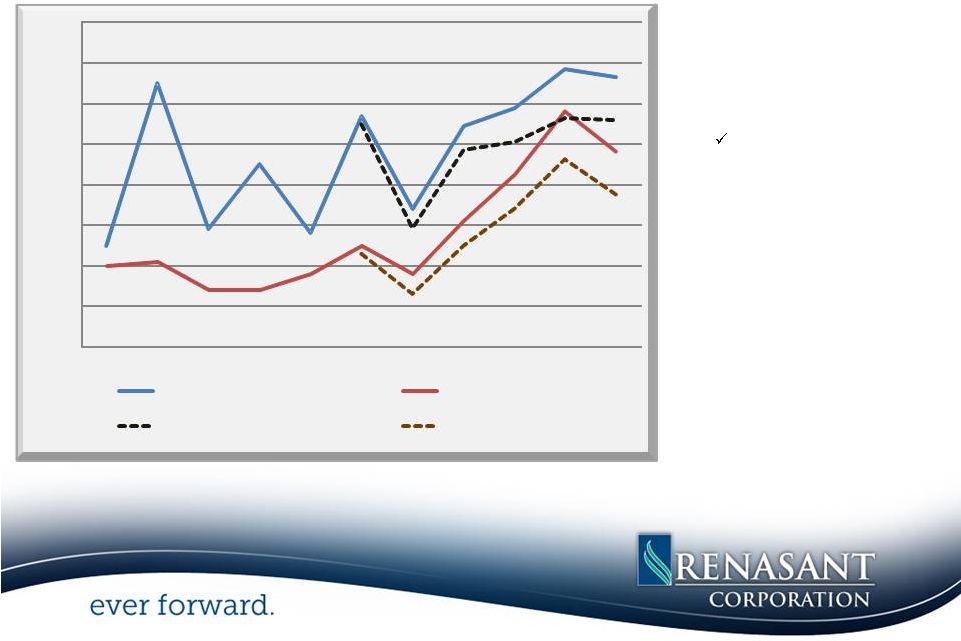
Net Interest Income and Net Interest Margin Remained at
one of the Highest Since 3Q06 0.00%
1.00%
2.00%
3.00%
4.00%
5.00%
6.00%
0.00%
1.00%
2.00%
3.00%
4.00%
5.00%
6.00%
2010
2011
4Q10
1Q11
2Q11
3Q11
4Q11
1Q12
2Q12
3Q12
4Q12
Yield on Earning Assets
Cost of Funds
Margin
2010
2011
4Q10
1Q11
2Q11
3Q11
4Q11
1Q12
2Q12
3Q12
4Q12
Net
Interest
Income
105,062
129,077
29,855
31,096
32,622
32,864
32,495
32,843
33,410
33,132
33,954
Net Interest
Margin
3.26%
3.77%
3.43%
3.55%
3.75%
3.90%
3.82%
3.85%
3.98%
3.94%
3.97%
Yield on
Earning Assets
5.04%
4.92%
4.97%
4.93%
4.99%
4.94%
4.79%
4.71%
4.73%
4.63%
4.67%
Cost of Funds
1.74%
1.11%
1.49%
1.31%
1.18%
1.00%
0.93%
0.84%
0.74%
0.68%
0.72% |
 •
Non Interest Income for 4Q, excluding securities gains and gain
from acquisitions, increased 39% on a Y-O-Y basis
Fees associated with increased production in secondary market
mortgage loans
Expansion from our wealth management division with the
acquisition of RBC Trust in Birmingham
Fees derived from higher penetration and usage of debit cards and
deposit charges
•
Opportunities for growing Non Interest Income
Expansion of Trust Division Wealth Management Services into
larger, metropolitan markets
Expansions within our de novo operations
Expansion of the Mortgage Division within new markets
*Non interest income excludes gains from securities transactions, gain from
the acquisition of the RBC Trust unit and insurance settlements on
real property 15
-
5,000
10,000
15,000
20,000
2Q10
3Q10
4Q10
1Q11
2Q11
3Q11
4Q11
1Q12
2Q12
3Q12
4Q12
Non Interest Income*
35%
6%
5%
12%
29%
13%
27%
6%
25%
10%
26%
7%
4Q11
$12.8M
Svc
Chgs
Insurance
Mtg
Gains
Wealth
Mgmt
Fees
&
Comm
Other
4Q12
$18.1M
Svc
Chgs
Insurance
Mtg
Gains
Wealth
Mgmt
Fees
&
Comm
Other
Sources of Non Interest Income*
|
 •
Continued focus on managing
Noninterest Expense
•
Provided resources for
nine de novo
expansions Approximately 56% of the
increase in Noninterest
Expense Y-O-Y is related to
de novo expansions and
acquisition of the RBC Trust
Division
•
Increased mortgage loan expense
driven by higher production
•
Incurred elevated costs related to
OREO and loan collection fees
•
Incurred merger related expenses
during 2010 & 2011
*Adjusted NIE is equal to total non interest expense less expenses related
to OREO, merger expense and FHLB prepayment penalty 16
Total Annualized NIE
to Avg. Assets
Adjusted Annualized NIE
to Avg. Assets
DeNovo Impact
on Total Annualized NIE
DeNovo Impact on
Adjusted Annualized NIE
2.40%
2.60%
2.80%
3.00%
3.20%
3.40%
3.60%
3.80%
4.00%
2Q10
3Q10
4Q10
1Q11
2Q11
3Q11
4Q11
1Q12
2Q12
3Q12
4Q12
Noninterest Expense
|
 •
OREO totaled $44.7M at 4Q12, a decline of $25.3M from 4Q11 and
$13.7M from 2Q12
•
Sold XX properties totaling $4.7M during 4Q12
•
Purchased X properties totaling $2.5M
•
44% of Y-T-D sales were from residential lots and land
development •
Geographic segmentation
•
West TN
$13.4M
•
MS (Excluding DeSoto)
8.0M
•
DeSoto
8.0M
•
Mid TN
4.5M
•
AL
10.4M
•
GA
.4M
Total
$
44.7M
•
$4.9M under purchase agreements to close by the end of 1Q13
Changes in OREO
Non-
Covered
4Q12
Non-Covered
2011
Y-T-D
Non-Covered
2012
Y-T-D
**Covered
2012
Y-T-D
Beginning
Balance
$48,568
$71,833
$70,079
$43,156
Additions
2,522
35,623
9,683
38,977
Improvements
0
37
492
0
Impairments
-1,637
-7,895
-5,326
-9,738
Dispositions
-4,736
-29,087
-30,410
-26,797
Other
0
-432
199
-64
Ending
Balance
$44,717
$70,079
$44,717
$45,534
17
•
Amounts based on OREO not covered through the FDIC loss share agreement
** Amounts based on OREO covered through the FDIC loss share agreement
18.4%
50.3%
17.4%
13.9%
4Q12
$44.7M
Residential
Properties
Residential
Land
Dev
Commercial
Properties
Commercial
Land
Dev
Other
21.9%
51.5%
16.4%
10.2%
4Q11
$70.1M
Residential
Properties
Residential
Land
Dev
Commercial
Properties
Commercial
Land
Dev
Other
Other Real Estate*
|
 18
Capitalize
on
Opportunities
Leverage Existing Markets
FDIC Assisted Acquisitions
Seek New Markets
Enhance Lines of Business
Enhance Profitability
Managed Asset Growth
Loan Growth
Core Deposit Growth
Net Int Margin Expansion/Int Rate Risk
Noninterest Expense Control
Aggressively
Manage
Problem
Credits
Quarantine Troubled Assets
“Good Bank/Bad Bank”
Structure
Build
Capital
Ratios
Selective Balance Sheet Growth
Maintain Dividend
Non-TARP Participant
Execution of
Execution of
Strategic
Strategic
Initiatives |
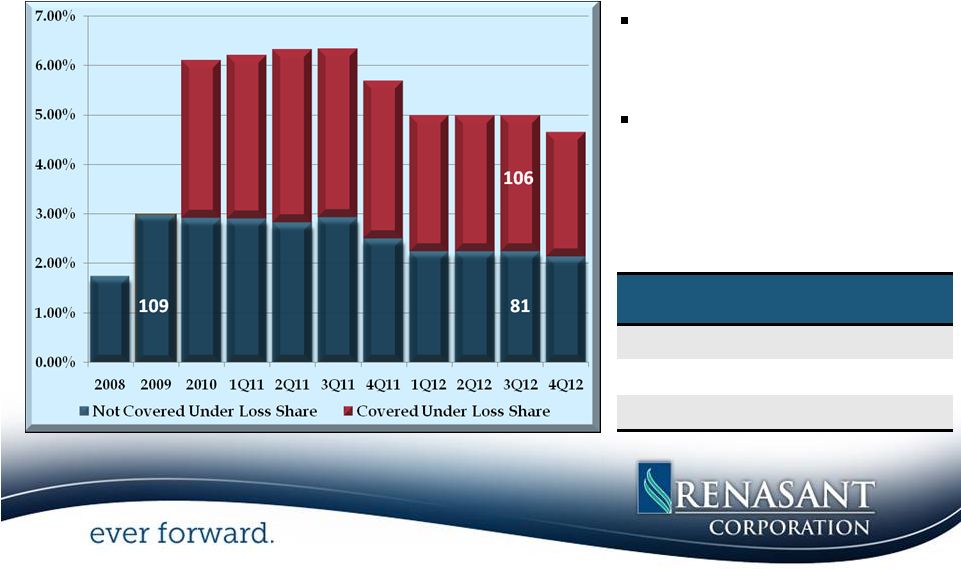 57% of total NPAs are
covered under FDIC loss
share
NPAs not covered through
an FDIC loss share declined
29% on a Y-O-Y basis
129
126
120
122
105
65
19
115
141
149
146
137
95
132
Non-
Covered
Covered
NPL’s
$30.19M
$53.19M
ORE
$44.72M
$45.53M
Total NPA’s
$74.91M
$98.72M
104
88
As a percentage of total assets
75
99
Non Performing Assets Continue
to Decline Both
on a Linked Quarter and Y-O-Y Basis
|
 *Amounts based on loans not covered through the FDIC loss share
agreement 20
•
Net charge-offs totaled $3.7M for
4Q12 and $18.1M for 2012
compared to $23.4M for 2011
•
Provision for loan losses totaled
$4.0M and $18.1M for 4Q and
Y-T-D respectively, down $4.23M
on a Y-O-Y basis
•
The allowance for loan losses to
non-covered loans was 1.72%
•
Consistent improvement in the
coverage ratio
0.00%
20.00%
40.00%
60.00%
80.00%
100.00%
120.00%
140.00%
160.00%
$-
$2,000
$4,000
$6,000
$8,000
$10,000
$12,000
$14,000
4Q09
1Q10
2Q10
3Q10
4Q10
1Q11
2Q11
3Q11
4Q11
1Q12
2Q12
3Q12
4Q12
($)Provision for Loan Losses
($)Net Charge Offs
Coverage Ratio*
Proactive in Providing Reserves for
Problem Credit Resolution
2009
2010
2011
2012
Q4
Q1
Q2
Q3
Q4
Q1
Q2
Q3
Q4
Q1
Q2
Q3
Q4
1.67%
1.78%
1.82%
2.02%
2.07%
2.17%
2.18%
2.20%
1.98%
1.94%
1.87%
1.74%
1.72%
Allowance for Loan Losses as % of Non-Covered Loans*
|
 Continued Improvement
NPLs and Early Stage Delinquencies
(30-89 Days Past Due Loans)
*
*Amounts based on loans not covered through the FDIC loss share
agreement 21
(In millions)
•
NPL’s declined $1.8M during 4Q and $4.7M Y-T-D
TDRs declined to $29.4M, down $6.9M from 4Q11
•
Loans 30-89 days past due declined $7.8M Y-T-D
$0
$10,000
$20,000
$30,000
$40,000
$50,000
$60,000
$70,000
2008
2009
1Q10
2Q10
3Q10
4Q10
1Q11
2Q11
3Q11
4Q11
1Q12
2Q12
3Q12
4Q12
39.9
50.0
54.6
64.7
65.6
53.4
57.2
51.9
49.0
34.9
30.4
29.9
32.0
30.2
48.5
24.1
35.6
18.9
17.5
15.8
13.4
14.5
14.1
8.0
NPLs
30-89
Days
41.6
23.5
21.5
16.6 |
 Capitalize on Opportunities
Leverage Existing Markets
FDIC Assisted Acquisitions
Seek New Markets
Enhance Lines of Business
Build Capital Ratios
Selective Balance Sheet Growth
Maintain Dividend
Non-TARP Participant
22
Enhance Profitability
Aggressively Manage Problem Credits
Quarantine Troubled Assets
“Good Bank/Bad Bank”
Structure
Execution of
Execution of
Strategic
Strategic
Initiatives
Loan Growth
Core Deposit Growth
Net Int Margin Expansion/Int Rate
Risk Noninterest Expense
Control |
 *1Q11 decline in leverage is primarily due to ATB transaction
23
Capital
2008
2009
2010
1Q11*
2Q11
3Q11
4Q11
1Q12
2Q12
3Q12
4Q12
Tangible
Common Equity
5.87%
6.34%
6.76%
6.66%
7.11%
7.47%
7.35%
7.47%
7.65%
7.69%
7.62%
Leverage
8.34%
8.68%
8.97%
8.77%
9.10%
9.48%
9.44%
9.38%
9.68%
9.90%
9.86%
Tier 1 Risk Based
10.85%
11.12%
13.58%
13.59%
13.58%
13.63%
13.32%
13.32%
13.14%
12.73%
12.85%
Total Risk Based
12.10%
12.37%
14.83%
14.84%
14.83%
14.89%
14.58%
14.58%
14.39%
14.00%
14.13%
•
Continue to grow common equity which is
at highest level since 2Q07
•
Regulatory capital ratios are above the
minimum for well-capitalized classification
Expected to remain “well capitalized”
on a pro forma basis under the
proposed Basel III NPR
•
Capital level positions the Company for
future growth and geographic expansion
•
Maintained dividend throughout economic
downturn
•
Did not participate in the TARP program
Tangible Common Equity Ratio
4.50%
5.00%
5.50%
6.00%
6.50%
7.00%
7.50%
8.00%
8.50%
2007
2008
2009
2010
1Q11
2Q11
3Q11
4Q11
1Q12
2Q12
3Q12
4Q12
Renasant
All US Banks
Strong Capital Position
Source: SNL Financial “All US Banks” : Includes all Major Exchange (NYSE,
NYSE Amex, NASDAQ) Banks in SNL's coverage universe. |
 24
$4.2B
franchise
well
positioned
in
attractive
markets
in
the
Southeast
with
comprehensive
line of product offerings
Strategic focus on expanding footprint
Established a 12 branch network in North GA through 2 FDIC assisted
acquisitions Entered 5 new markets with the hiring of management
teams Acquired the AL Trust Division of RBC Trust in 3Q11, enhancing
fee income opportunities
Improved risk profile
Aggressive identification and prudent disposition of problem assets
Significantly reduced concentration in land development loans
Continued decline of early stage delinquencies
Net loan growth Y-O-Y was 15%*
Strong
base
for
continued
core
deposit
growth
Continued focus on revenue growth
Strong capital position affording future opportunities to enhance
shareholder value Consistent
dividend
history
*Amounts based on loans not covered through the FDIC loss share
agreement Poised for Growth with Added Shareholder Value
|
 Merger of Renasant Corporation and First M&F Corporation
|
 26
Strategically advantageous
•
Acquisition of 120+ year old bank with quality core customer
base –
Combination of two 100+ year old institutions
•
In-market transaction consistent with our acquisition
philosophy •
Creates
the
4
th
largest
bank
by
pro
forma
deposit
market
share
in
Mississippi
–
Strengthens position throughout existing footprint and provides
entrance into new markets •
Enhances fee revenue businesses of insurance, mortgage, and wealth
management •
Complementary cultures and strong ties to community
•
Strong, stable deposits and earnings generation complement de novo and
out-of-state market expansion activities
Financially attractive
•
Immediately accretive to EPS, double-digit EPS accretion projected
in 2014 •
Tangible book value earn back in approximately 2.5 years
•
IRR approximately 20%
•
Realization
of
significant
expense
synergies
(25%
of
noninterest
expense)
•
Pro
forma
capital
ratios
above
“well
capitalized”
guidelines
Transaction Rationale |
 27
27
Source: SNL Financial
(1)
Pro forma branches as of 1/31/2013
(2)
Pro forma figures as of 12/31/2012, excluding purchase accounting
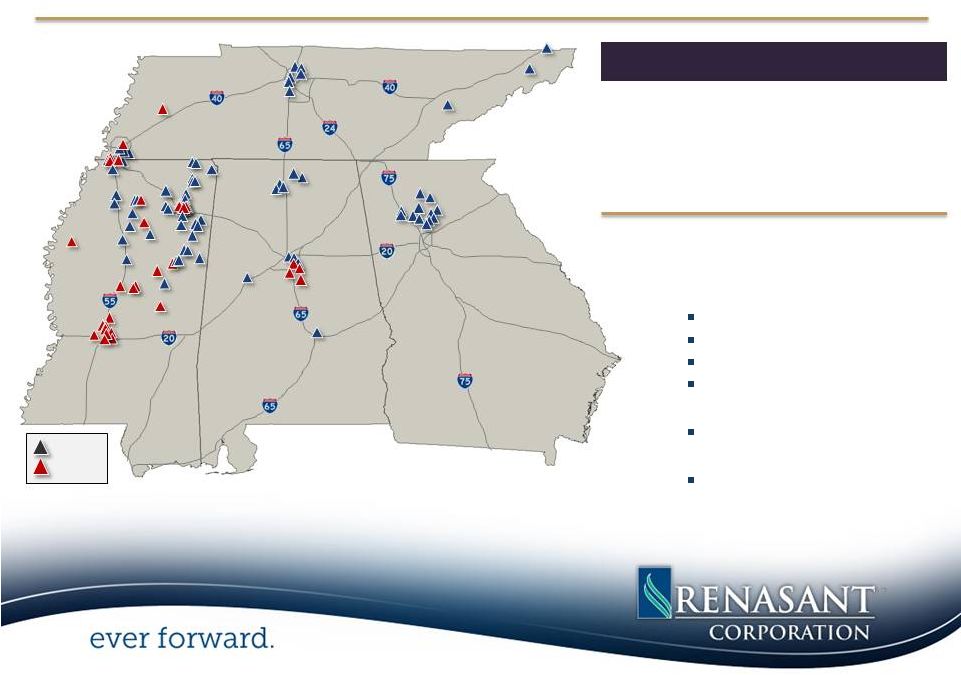
adjustments •
Provides further expansion in
current states of operation
–
Mississippi
Jackson MSA
DeSoto County
Oxford
Starkville
–
Alabama
Birmingham MSA
–
Tennessee
Greater Memphis
•
7 of 36 FMFC branches are located
within 1 mile of a RNST branch
Branches
(1)
117
Assets
(2)
$5.8 billion
Gross Loans
(2)
$3.8 billion
Deposits
(2)
$4.9 billion
Pro Forma Highlights
Tupelo
Nashville
Atlanta
Birmingham
Huntsville
Montgomery
Jackson
Memphis
Kosciusko
Chattanooga
Johnson City
Knoxville
GEORGIA
ALABAMA
MISSISSIPPI
TENNESSEE
RNST
FMFC
Logical In-Market Transaction |
 28
Consideration:
100% stock (tax-free exchange)
Fixed exchange ratio of 0.6425x
Implied Price Per Share:
$12.35
(1)
Aggregate Value:
$118.8 million
(1)(2)
CDCI Preferred Stock and TARP Preferred
Warrant Treatment:
$30.0 million CDCI to be redeemed in full prior to close
TARP warrants to be repurchased at close
Repurchase price to be negotiated with US Treasury
Board Seats:
Two current members from FMFC to be added to RNST’s board
of directors
Ownership:
FMFC pro forma ownership will be approximately 20%
Required Approvals:
Customary regulatory approval, RNST and FMFC shareholder
approval
Expected Closing:
Third quarter 2013
(1)
Based on RNST’s 10 day average closing price as of February 4, 2013
of $19.22 (2)
Does not include consideration to repurchase TARP warrants
Transaction Terms |
 29
Implied Price Per Share:
$12.35
(1)
Price / Tangible Book Value Per Share:
119%
Price / 2012 EPS:
23.1x
Price / 2013 EPS
(2)
:
15.8x
Core Deposit Premium:
1.5%
(1)
Based on RNST’s 10 day average closing price as of February 4, 2013
of $19.22 and an exchange ratio of 0.6425x (2)
Based on analyst estimate
Transaction Multiples |
 30
Extensive Credit Review
•
Two tiered review conducted by Renasant’s senior
credit officers and loan review team
•
Individually reviewed 84% of adversely classified
loans by volume, representing all relationships with
a balance greater than $100,000
•
Individually reviewed 100% of relationships with a
balance greater than $500,000
•
Conducted review of underwriting policy and
procedure for smaller balance portfolios
•
Reviewed 100% of OREO properties, including
physical inspection of over 80% of OREO by
volume
Cumulative Losses and Credit Mark
Cumulative
Losses
Since
12/31/07
(1)
:
$118.2mm
Estimated Credit Mark (Loans & OREO)
$62.5mm
Total Estimated Losses Through
Cycle: $180.7mm As
%
of
12/31/07
Gross
Loan
Balance
(2)
:
14.8%
(1)
Represents cumulative net charge-offs and OREO expenses through
12/31/12 (2)
12/31/07 gross loans held for investment of $1.2 billion
Credit Due Diligence |
 31
Assumptions
•
Credit Mark
•
Gross of Reserves: $54.7mm or 5.4% of
loans
•
Net of Reserves: $37.5mm or 3.7% of loans
•
OREO Mark: 30%
•
Cost Savings: 25%, 40% realized in 2013 and
100% realized thereafter
•
No revenue enhancements assumed
•
Pre-Tax Merger Expenses: $12.0 million
•
100% realized in 2013
•
Core Deposit Intangible: 2.0%, amortized
sum-of-the-years digits over 10 years
•
Closing: Q3 2013
Attractive Returns
•
Immediately accretive to EPS; double-digit EPS
accretion projected in 2014
•
Tangible book value earn back in less than two and a
half years
•
IRR approximately 20%
Pro Forma Capital Ratios
Pro
“Well RNST
Forma
Capitalized”
TCE/TA
7.7%
6.5% N/A
Tier 1
Leverage 9.9% 8.3% 5.0%
Tier 1
Risk-Based 12.7% 11.0% 6.0%
Total
Risk-Based 14.0% 12.1% 10.0%
(1)
As of December 31, 2012
(2)
Estimated pro forma capital ratios at close, including the redemption of
the CDCI preferred stock (1)
(2)
Financial Impact of the Transaction |
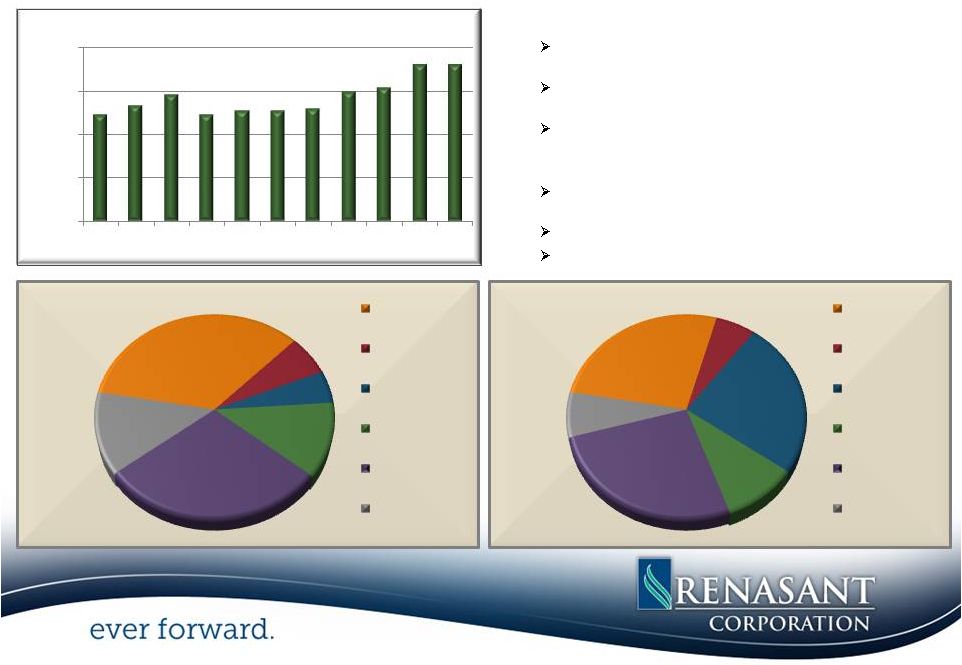
 32
32
Source: SNL Financial, Company documents
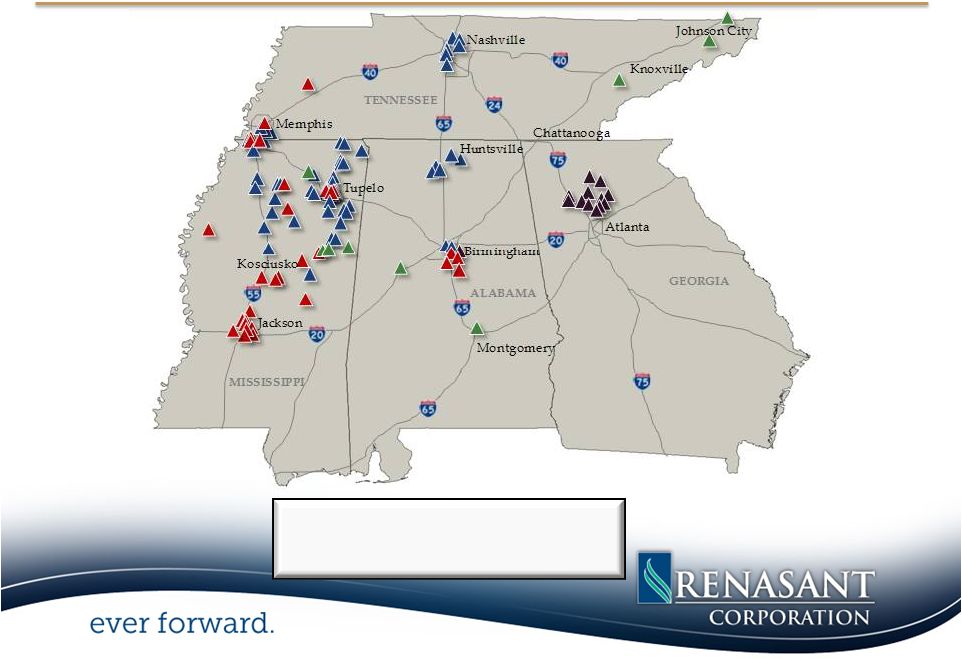
Expansions in 2010 –
2013
RNST
De Novo
FMFC
Acquisition
Market Expansion Experience Since 2010 |
 33
Source:
SNL
Financial,
dates
are
those
on
which
each
transaction
was
announced
Market Expansion Experience Since 2010
FDIC-assisted transaction:
Crescent Bank and Trust Company headquartered
in Jasper, Georgia; assets ~ $1 billion
De novo expansion:
Columbus, Mississippi
FDIC-assisted transaction:
American Trust Bank headquartered in Roswell,
Georgia; assets ~ $145 million
Trust
acquisition:
RBC
(USA)
Trust
Unit
based
in
Birmingham,
Alabama;
AUM ~ $680 million
De novo expansion:
Montgomery, Alabama
De novo expansion:
Starkville, Mississippi
De
novo
expansion:
Tuscaloosa,
Alabama
De novo expansion:
Maryville, Tennessee
De novo expansion:
Jonesborough, Tennessee
De
novo
expansion:
Bristol,
Tennessee
Whole
Bank
transaction:
First
M&F
Corporation
headquartered
in
Kosciusko,
MS; assets ~$1.6 billion
July 23
September 8
February 4
June 29
July 1
July 26
August 23
May 2
December 6
January 17
February 7 |
 34
Strategically advantageous
•
Acquisition of 120+ year old bank with quality core customer base
•
In-market transaction consistent with our acquisition
philosophy •
Creates the 4
th
largest bank by pro forma deposit market share in Mississippi
•
Enhances fee revenue businesses of insurance, mortgage, and wealth
management •
Complementary cultures and strong ties to community
•
Strong, stable deposits and earnings generation complement de novo and
out-of-state market expansion activities
Financially attractive
•
Immediately accretive to EPS, double-digit EPS accretion projected
in 2014 •
Tangible book value earn back in approximately 2.5 years
•
IRR approximately 20%
•
Realization
of
significant
expense
synergies
(25%
of
noninterest
expense)
•
Pro
forma
capital
ratios
above
“well
capitalized”
guidelines
•
Extensive due diligence process completed
•
Comprehensive review of loan and OREO portfolios
•
Conservative credit mark
Low
risk
opportunity
Summary
Highlights |
 Appendix |
 36
Source: SNL Financial
Company Profile
Bank Subsidiary
Merchants
and
Farmers Bank
Headquarters
Kosciusko,
Mississippi
Bank Established:
1890
Offices
36 branches
9 insurance
offices
Top 5 Markets by
Deposit Market Share:
Jackson, MS
Birmingham, AL
Tupelo,
MS
Starkville, MS
Memphis, TN
Financial
Highlights (Year Ended 12/31/12)
Total Assets:
Gross Loans:
Total Deposits:
$1.6 billion
$1.0 billion
$1.4 billion
NPAs/Assets:
Noninterest Income/Avg. Assets:
Q4’12 Cost of Deposits:
2.15%
1.41%
0.54%
First M&F Corporation Highlights |
 37
(1) In 2009, excludes $34.3 million goodwill impairment charge
(2) Nonperforming loans (NPLs) include loans 90 days past due and
nonaccrual loans. Nonperforming assets (NPAs) include NPLs
and other real estate owned Source: SNL Financial, data as of
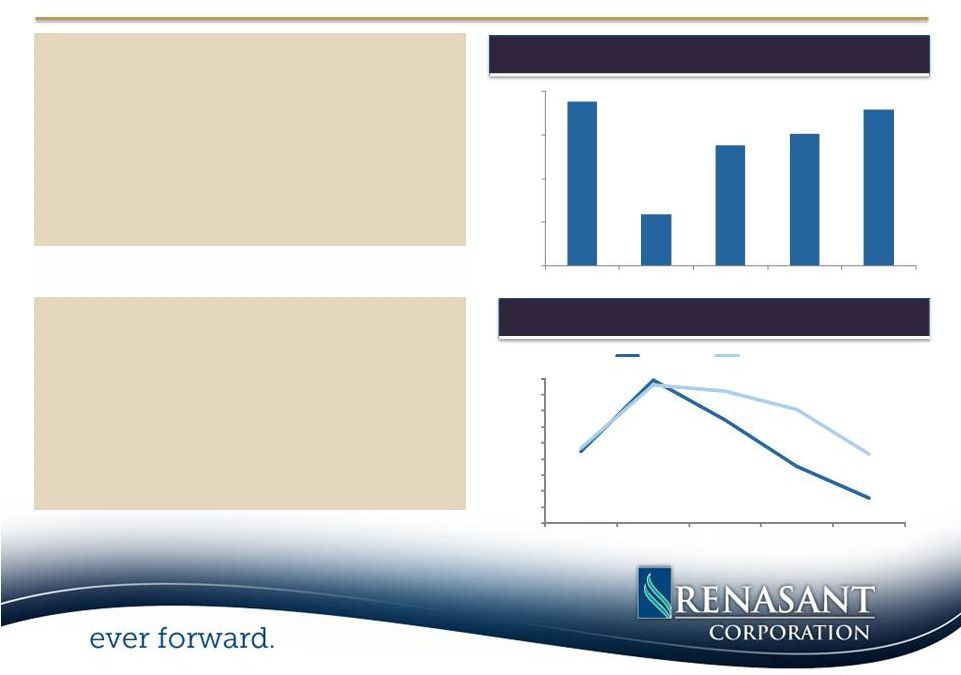
12/31/2012 Credit Quality
(2)
Pre-Tax, Pre-Provision Revenue ($mm)
(1)
2.23%
0.80%
2.34%
2.15%
0.00%
0.50%
1.00%
1.50%
2.00%
2.50%
3.00%
3.50%
4.00%
4.50%
2008
2009
2010
2011
2012
NPLs / Loans
NPAs / Assets
$18.8
$6.0
$13.8
$15.1
$17.9
$0.0
$5.0
$10.0
$15.0
$20.0
2008
2009
2010
2011
2012
First M&F Corporation: Recent Improvements
•
Increased Profitability
–
Net income available to common
shareholders increased by 90% in 2012
•
Fee Income
–
–
Insurance revenues of $3.5 million
•
Considerable Improvement in Asset Quality
–
Nonperforming Loans/Loans at lowest
level since 2006 (0.80% of gross loans)
–
38% decrease in total nonperforming
assets in 2012 (to 2.15% of total assets)
Mortgage
banking
revenue
of
$5.3
million |
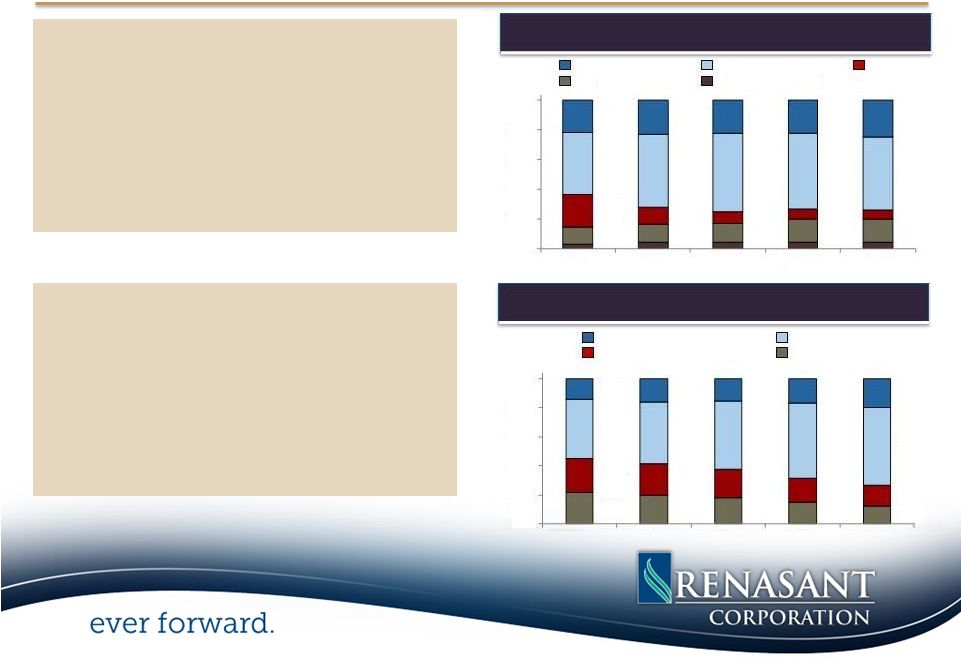 38
Non-Int. Bearing
Int. Bearing
Trans.
Time < $100K
Time > $100K
RE –
Residential
C&I
•
Significant Remixing of Loan Portfolio
–
C&D loans now represent 6% of the
portfolio, replaced by a greater
concentration of owner occupied CRE and
C&I loans
•
Shift in Deposit Mix
–
Noninterest bearing deposits represent
20% of total deposits
–
Decrease in time deposits to 27% of total
deposits
Loan Portfolio
Deposit Mix
First M&F Corporation: Recent Improvements
Consumer & Other
RE
–
Commercial
C&D
42%
50%
22%
6%
12%
16%
3%
4%
22%
24%
0%
20%
40%
60%
80%
100%
2008
2009
2010
2011
2012
41%
54%
14%
20%
23%
14%
22%
13%
0%
20%
40%
60%
80%
100%
2008
2009
2010
2011
2012 |
 39
Source: SNL Financial, company earnings releases, data as of
12/31/2012 RNST
FMFC
Non-Int. Bearing
Int. Bearing Trans.
Time < $100K
Time > $100K
Renasant Corporation (12/31/12)
Pro Forma Company (12/31/12)
Historical Cost of Total Deposits
1.10%
1.01%
0.93%
0.85%
0.71%
0.65%
0.60%
0.54%
1.11%
0.99%
0.80%
0.72%
0.63%
0.58%
0.53%
0.49%
0.00%
0.20%
0.40%
0.60%
0.80%
1.00%
1.20%
1.40%
Q1'11
Q2'11
Q3'11
Q4'11
Q1'12
Q2'12
Q3'12
Q4'12
Pro Forma Deposit Composition |
   40
Source: SNL Financial
Deposit data as of 6/30/2012
(1)Represents deposit market share for the state of Mississippi
(2)Represents deposit market share for counties with RNST presence
40
Mississippi
1
Alabama
2
Total
Market
# of
Deposits
Share
Rank
Institution
Branches
($mm)
(%)
1
Regions Financial Corp.
146
$6,851
14.8
2
Trustmark Corp.
137
6,577
14.2
3
BancorpSouth Inc.
102
5,047
10.9
--
Pro Forma
77
2,830
6.1
4
Hancock Holding Co.
46
2,642
5.7
5
Community Bancshares of MS
37
1,915
4.1
6
BancPlus Corp.
59
1,814
3.9
7
Renasant Corp.
47
1,658
3.6
8
First M&F Corp.
30
1,172
2.5
9
Citizens National Banc Corp.
27
956
2.1
10
BankFirst Capital Corp.
13
626
1.4
11
Wells Fargo & Co.
13
619
1.3
12
Planters Holding Co.
15
616
1.3
13
Citizens Holding Co.
22
593
1.3
14
First Bancshares Inc.
17
536
1.2
15
State Capital Corp.
22
493
1.1
16
Peoples Financial Corp.
17
482
1.0
17
Guaranty Capital Corp.
13
472
1.0
18
First Horizon National Corp.
7
454
1.0
19
PriorityOne Capital Corp.
11
449
1.0
20
Merchants & Marine Bancorp
11
449
1.0
Top 20 Institutions
792
$34,420
74.5
Total Market
1,199
46,221
100.0
Total
Market
# of
Deposits
Share
Rank
Institution
Branches
($mm)
(%)
1
Regions Financial Corp.
118
$14,394
33.2
2
Banco Bilbao Vizcaya Argentaria SA
48
7,320
16.9
3
Wells Fargo & Co.
62
5,087
11.7
4
Synovus Financial Corp.
27
2,645
6.1
5
BB&T Corp.
28
2,603
6.0
6
ServisFirst Bancshares Inc.
7
1,853
4.3
7
PNC Financial Services Group Inc.
33
1,556
3.6
8
Cadence Bancorp LLC
26
988
2.3
9
Bryant Bank
12
807
1.9
--
Pro Forma
14
719
1.7
10
Renasant Corp.
10
568
1.3
11
AloStar Bank of Commerce
1
466
1.1
12
IBERIABANK Corp.
13
452
1.0
13
USAmeriBancorp Inc.
9
433
1.0
14
Charles Investment Group LLC
4
376
0.9
15
Progress Bank and Trust
4
357
0.8
16
BancorpSouth Inc.
11
285
0.7
17
Capstone Bancshares Inc.
3
211
0.5
18
SouthPoint Bank
3
198
0.5
19
Trustmark Corp.
4
175
0.4
20
Oakworth Capital Bank
1
171
0.4
21
River Financial Corp.
2
162
0.4
22
Altrust Financial Services Inc.
9
155
0.4
23
First M&F Corp.
4
152
0.4
Top 20 Institutions
424
$40,944
94.4
Total Market
540
43,388
100.0
Pro Forma Deposit Market Share |
   41
Counties with Top 5 Deposit Market Share
Source: SNL Financial, deposit data as of 6/30/2012
Includes counties with pro forma deposits greater than $100 million
Blue highlight denotes top 5 deposit market share
RNST Market Share Information
FMFC Market Share Information
Pro Forma Market Share Information
Deposits
Market
Deposits
Market
Deposits
Market
County
($mm)
Share
Branches
Rank
($mm)
Share
Branches
Rank
($mm)
Share
Branches
Rank
Lee, MS
$653.2
36.3
13
1
$133.6
7.4
3
4
$786.8
43.7
%
16
1
Morgan, AL
275.9
17.1
3
2
--
--
--
--
275.9
17.1
3
2
Shelby, TN
241.4
1.3
3
14
14.6
0.1
1
21
256.0
1.4
4
13
Davidson, TN
252.1
1.1
4
13
--
--
--
--
252.1
1.1
4
13
Madison, MS
--
--
--
--
250.4
10.6
5
4
250.4
10.6
5
4
Attala, MS
--
--
--
--
191.9
60.0
3
1
191.9
60.0
3
1
Shelby, AL
32.2
1.2
1
17
151.6
5.6
4
5
183.8
6.8
5
5
Cherokee, GA
173.2
7.6
3
6
--
--
--
--
173.2
7.6
3
6
Desoto, MS
84.1
4.2
4
8
64.3
3.2
3
9
148.3
7.4
7
5
Monroe, MS
138.9
23.5
4
2
--
--
--
--
138.9
23.5
4
2
Jefferson, AL
133.7
0.6
2
16
--
--
--
--
133.7
0.6
2
16
Forsyth, GA
126.5
4.8
2
9
--
--
--
--
126.5
4.8
2
9
Rankin, MS
--
--
--
--
121.9
5.4
4
7
121.9
5.4
4
7
Pickens, GA
116.3
15.8
2
3
--
--
--
--
116.3
15.8
2
3
Fulton, GA
112.1
0.2
3
21
--
--
--
--
112.1
0.2
3
21
Pontotoc, MS
106.1
27.8
2
2
--
--
--
--
106.1
27.8
2
2
Bartow, GA
103.5
8.9
2
5
--
--
--
--
103.5
8.9
2
5
Prentiss, MS
102.7
27.6
3
2
--
--
--
--
102.7
27.6
3
2
Lafayette, MS
25.0
2.9
2
8
76.2
8.9
2
5
101.2
11.8
4
4
Counties with top 5 market share
7
5
12
Deposit Market Share by County |
 42
Renasant and M&F will be filing a joint proxy statement/prospectus,
and other relevant documents concerning the merger
with the Securities and Exchange
Commission (the “SEC”). This presentation does not constitute an offer to sell or the
solicitation
of
an
offer
to
buy
any
securities
or
a
solicitation
of
any
vote
or
approval.
INVESTORS
ARE
URGED
TO
READ
THE JOINT PROXY STATEMENT/PROSPECTUS AND ANY OTHER DOCUMENTS TO BE
FILED WITH THE SEC IN CONNECTION WITH THE MERGER OR INCORPORATED
BY REFERENCE IN THE JOINT PROXY STATEMENT/PROSPECTUS BECAUSE
THEY WILL CONTAIN IMPORTANT INFORMATION ABOUT RENASANT, M&F
AND THE PROPOSED MERGER. When available, the joint proxy statement/prospectus will be mailed to shareholders
of
both
Renasant
and
M&F.
Investors
will
also
be
able
to
obtain
copies
of
the
joint
proxy
statement/prospectus
and
other
relevant documents (when they become available) free of charge at the
SEC’s Web site (www.sec.gov). In addition, documents
filed with the SEC by Renasant will be available free of charge from
Mitchell Waycaster, Director of Investor Relations, Renasant
Corporation, 209 Troy Street, Tupelo, Mississippi 38804-4827, telephone: (662) 680-1215. Documents filed with the
SEC by M&F will be available free of charge from M&F by
contacting John G. Copeland, Chief Financial Officer, First M&F
Corporation, 134 West Washington Street, Kosciusko, Mississippi 39090,
telephone: (662) 289-8594.
Renasant,
M&F
and
certain
of
their
directors,
executive
officers
and
other
members
of
management
and
employees may be deemed to be participants in the solicitation of
proxies from the shareholders of Renasant and M&F in
connection with the proposed merger. Information about the
directors and executive officers of Renasant is included in the
proxy statement for its 2012 annual meeting of shareholders, which was
filed with the SEC on March 8, 2012. Information
about
the
directors
and
executive
officers
of
M&F
is
included
in
the
proxy
statement
for
its
2012
annual
meeting
of
shareholders, which was filed with the SEC on March 14, 2012.
Additional information regarding the interests of such
participants
and
other
persons
who
may
be
deemed
participants
in
the
transaction
will
be
included
in
the
joint
proxy
statement/prospectus
and
the
other
relevant
documents
filed
with
the
SEC
when
they
become
available.
Additional Information
|
 43
E. Robinson McGraw
Chairman
President and Chief Executive Officer
Kevin D. Chapman
Senior Executive Vice President and
Chief Financial Officer
Investor Inquiries 209 TROY
STREET
TUPELO, MS 38804-4827 PHONE:
1-800-680-1601
FACSIMILE: 1-662-680-1234
WWW.RENASANT.COM
WWW.RENASANTBANK.COM
|