Attached files
| file | filename |
|---|---|
| 8-K - 8-K - PHH CORP | a13-4761_18k.htm |
|
|
PHH Corporation Investor Presentation February 12, 2013 Exhibit 99.1 |

|
|
Forward-Looking Statements Certain statements in this presentation and in any accompanying oral remarks made in connection with this presentation are forward-looking statements within the meaning of the Private Securities Litigation Reform Act of 1995. Generally, forward looking-statements are not based on historical facts but instead represent only our current beliefs regarding future events. All forward-looking statements are, by their nature, subject to risks, uncertainties and other factors that could cause actual results, performance or achievements to differ materially from those expressed or implied in such forward-looking statements. Investors are cautioned not to place undue reliance on these forward-looking statements. Such statements may be identified by words such as “expects,” “anticipates,” “intends,” “projects,” “estimates,” “plans,” “may increase,” “may fluctuate” and similar expressions or future or conditional verbs such as “will,” “should,” “would,” “may” and “could.” You should understand that forward-looking statements are not guarantees of performance or results and are preliminary in nature. You should consider the areas of risk described under the heading “Cautionary Note Regarding Forward-Looking Statements” and “Risk Factors” in our periodic reports filed with the U.S. Securities and Exchange Commission, including our most recent Annual Report on Form 10-K and Quarterly Reports on Form 10-Q, in connection with any forward-looking statements that may be made by us or our businesses generally. Such periodic reports are available in the “Investors” section of our website at http://www.phh.com and are also available at http://www.sec.gov. Except for our ongoing obligations to disclose material information under the federal securities laws, applicable stock exchange listing standards and unless otherwise required by law, we undertake no obligation to release publicly any updates or revisions to any forward-looking statements or to report the occurrence or non-occurrence of anticipated or unanticipated events. Basis of Presentation of Financial Data Unless noted otherwise in this presentation, all reported financial data is being presented as of the period ended December 31, 2012. Summarized Content This presentation contains summarized information pertaining to the current performance and trends related to our business, including, without limitation, mortgage production margins and volumes, leverage ratios, loan repurchases and indemnifications, and foreclosure reserves. For a complete description of these and other topics, please see our filings with the U.S. Securities and Exchange Commission, including our most recent Annual Report on Form 10-K and Quarterly Reports on Form 10-Q. Non-GAAP Financial Measures Core earnings (loss) (pre-tax and after-tax), core earnings (loss) per share, adjusted cash flow, adjusted EBITDA, adjusted EBITDA after net investment in MSRs, tangible book value and tangible book value per share are financial measures that are not in accordance with GAAP. See Non-GAAP Financial Measures Disclosures beginning on slide 19 for reconciliations of these measures to the most directly comparable GAAP financial measures and other disclosures as required by Regulation G. Important Disclosures |
|
|
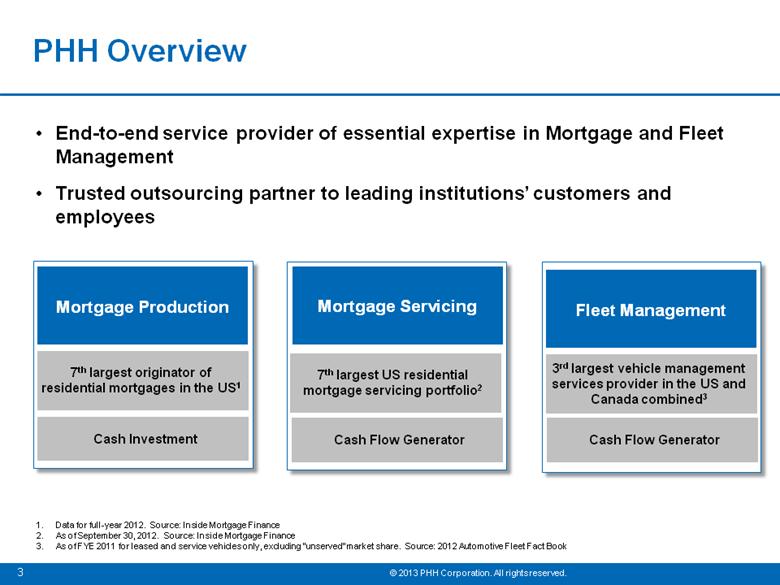
7th largest originator of residential mortgages in the US1 Mortgage Production 3rd largest vehicle management services provider in the US and Canada combined3 Fleet Management 7th largest US residential mortgage servicing portfolio2 Mortgage Servicing PHH Overview Cash Investment Cash Flow Generator Cash Flow Generator End-to-end service provider of essential expertise in Mortgage and Fleet Management Trusted outsourcing partner to leading institutions’ customers and employees 1. Data for full-year 2012. Source: Inside Mortgage Finance 2. As of September 30, 2012. Source: Inside Mortgage Finance 3. As of FYE 2011 for leased and service vehicles only, excluding “unserved” market share. Source: 2012 Automotive Fleet Fact Book |
|
|
Scale and Expertise Barriers to Entry Solid Liquidity Position High Quality Assets Well-Positioned to Take Advantage of Growth Opportunities Strong competitive position in our franchise platforms Customized end-to-end product and service offerings 30+ year track record Mortgage originations through trusted and respected institutions Limited credit risk and focus on prime quality mortgage originations Well-diversified fleet lease portfolio and high credit-quality lessees Increased regulation and complexity favor mortgage outsourcing Fleet vendor network and purchasing power Opportunities for increased penetration with existing clients Proven access to secured and unsecured debt markets Unencumbered asset coverage approaching target of 3.0x or better $829 million in unrestricted cash & cash equivalents at year-end 2012 |
|
|
Mortgage Market Evolving to Our Strengths Increasing regulation drives complexity Heightened scrutiny Increased cost to originate Stricter servicing standards Deep domain expertise in origination and servicing Intimate knowledge of mortgage regulatory framework Flexibility to meet changing regulations How the Residential Mortgage Market is Changing PHH Success Factors Regional and community banks may seek to outsource origination and/or servicing operations Mortgage production increasingly expensive for small banks Improving housing market drives purchase transactions Stricter GSE Rep & Warranty putback criteria Realogy relationship increasingly valuable, with access to an estimated 1 of every 4 home purchase transactions Focus on operational excellence and defect reduction should reduce mortgage quality-related costs PHH is well-positioned to benefit from developments in the residential mortgage market |
|
|
Credit enhancement to overall business Provides incremental liquidity Supports credit ratings Enhances access to credit markets Diversified lease portfolio of industry-leader lessees Nearly one-third of Fortune 500 in client base More than 50% of net investment in fleet leases to investment grade lessees No client represents more than 5% of portfolio Minimal lease residual and credit risk Approximately 98% of book value of leases comprised of “open-end” leases, as of December 31, 2012 Charge-offs averaged less than 3 basis points for the last 10 years Service-type vehicles a key driver of growth in net investment in leases Longer duration leases Typically use more services than passenger cars Comprise more than 70% of portfolio Fleet Consistently Provides Incremental Earnings and Operating Cash Flow |
|
|
Disciplined growth in franchise platforms Mortgage Private Label Services Channel Mortgage Real Estate Channel (Realogy relationship) Fleet Management Operational excellence Unwavering commitment to customer service In near term, liquidity, cash generation and deleveraging balance sheet Four Key Strategies Potential for Fleet and Mortgage to provide mid-teen ROEs Execution on these strategies should position us for growth and make us more competitive, more profitable, and more capital-efficient |
|
|
Disciplined Growth in Franchise Channels Strong operating performance in franchise channels in 2012 Retail mortgage originations up 28% in 2012, compared to 25% for the total market1 Total loan servicing portfolio up 1% year-over-year at December 31, 2012 Net investment in fleet leases up 3% year-over-year at December 31, 2012 Opportunity to increase penetration with existing clients and expand client base Access to network of nearly 5,000 branches and 45,000 financial advisors in Private Label channel Proprietary relationship with Realogy provides access to estimated 1 of every 4 home purchase transactions On-boarding new Private Label clients and continuing to expand and convert pipeline of client prospects Fleet penetration of new market segments and new services HSBC expected to be among our top PLS clients once fully ramped Originations and subservicing expected to commence in 2Q13 Expect to add approximately $50 billion in subservicing UPB Acquiring origination and servicing capacity from HSBC * See Non-GAAP Financial Measures in this presentation, starting on slide 19 Data for full-year 2012. Source: Inside Mortgage Finance |
|
|
Issued $250 million in convertible notes due 2017 and $275 million in senior notes due 2019 Closed multi-year revolving credit facilities $300 million multi-year unsecured US revolving credit facility C$125 million 3-year secured Canadian revolving credit facility Repaid $250 million in 2012 convertible debt and $421 million in 2013 medium-term notes Renewed or extended more than $6 billion of mortgage-related funding arrangements Issued $1.2 billion in Fleet term ABS debt and renewed $2.3 billion in Fleet lease conduit financing facilities Unsecured Debt Maturities as of 12/31/20121 Strong Execution on Liquidity Plans 2012 Financing Actions $829 million of unrestricted cash and cash equivalents Unencumbered assets to unsecured debt1 of 2.77x Target leverage of 3.0x or higher Tangible book value per share* of $25.80 Liquidity Position at 12/31/2012 Convertible debt represents only face amount of such debt and excludes any conversion premium. See our most recent quarterly report on Form 10-Q for more details. * See Non-GAAP Financial Measures in this presentation, starting on slide 19 2013 Liquidity Goals Minimize refinancing risk by: Maintaining appropriate liquidity cushion Extending and laddering unsecured debt maturities Meet target leverage of 3.0x unencumbered asset coverage Diversification of funding sources Manage both Fleet and Mortgage for positive cash flow Continue to deleverage while growing tangible book value per share Unrestricted cash and cash equivalents at 12/31/2012 exceeds |

|
|
Next Steps to Implement Our Strategy Franchise channels offer greatest and most capital efficient growth opportunities Increase penetration in PLS and Real Estate channels Expansion of client base Focused effort on subservicing Fleet growth from penetration of new market segments and services Operational excellence and customer service are keys to franchise expansion Continued defect reduction and process simplification “Raise the bar” on customer experience; eliminate variation Continued investment in technology to enhance operating capabilities Prioritize lowering our cost of capital Working toward credit rating upgrades Continuing to explore diversification of funding sources Maintaining a strong financial position is critical Mortgage a significant service provider to our PLS clients – all regulated institutions Creditworthiness continually evaluated by clients and their regulators |
|
|
Entering 2013 stronger from both a financial and operating standpoint Well-positioned to benefit from demand for outsourcing High quality mortgage servicing assets Rising interest rates likely to improve mortgage servicing segment profit and cash flow Long-term contracts and limited residual risk in Fleet create predictable cash flows Significantly improved liquidity and leverage positions Attractive Growth Prospects Both Mortgage and Fleet businesses have the long-term potential to achieve mid-teen core returns on equity |

|
|
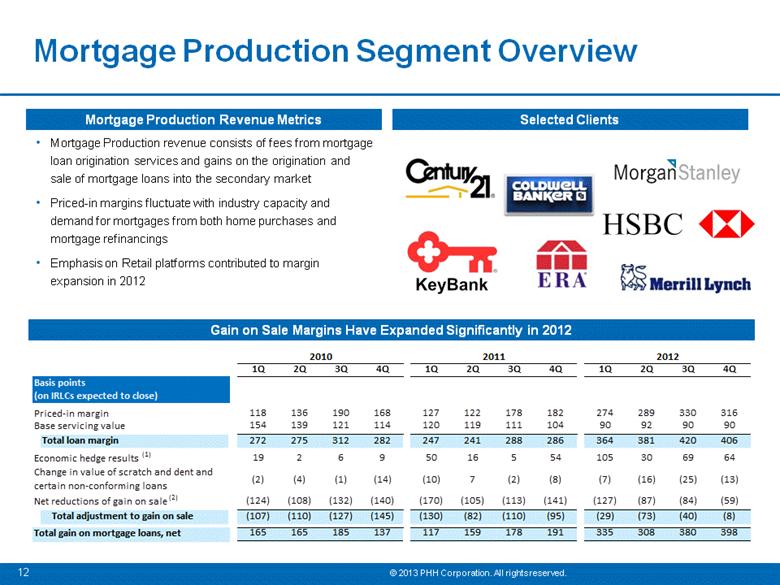
Mortgage Production revenue consists of fees from mortgage loan origination services and gains on the origination and sale of mortgage loans into the secondary market Priced-in margins fluctuate with industry capacity and demand for mortgages from both home purchases and mortgage refinancings Emphasis on Retail platforms contributed to margin expansion in 2012 Mortgage Production Segment Overview Selected Clients Gain on Sale Margins Have Expanded Significantly in 2012 Mortgage Production Revenue Metrics 1Q 2Q 3Q 4Q 1Q 2Q 3Q 4Q 1Q 2Q 3Q 4Q 118 136 190 168 127 122 178 182 274 289 330 316 154 139 121 114 120 119 111 104 90 92 90 90 Total loan margin 272 275 312 282 247 241 288 286 364 381 420 406 19 2 6 9 50 16 5 54 105 30 69 64 (124) (108) (132) (140) (170) (105) (113) (141) (127) (87) (84) (59) Total adjustment to gain on sale (107) (110) (127) (145) (130) (82) (110) (95) (29) (73) (40) (8) 165 165 185 137 117 159 178 191 335 308 380 398 2010 2011 2012 (2) (4) (1) (14) (10) 7 (2) (8) (7) (16) (25) (13) Net reductions of gain on sale (2) Total gain on mortgage loans, net Change in value of scratch and dent and certain non-conforming loans Basis points (on IRLCs expected to close) Priced-in margin Base servicing value Economic hedge results (1) |
|
|
PHH Loan Servicing Portfolio Reflects capitalized portfolio (excludes Home Equity lines of credit) Total delinquency based on UPB Includes an $8 billion reduction in 3Q12 due to a transfer of subservicing related to the termination of an agreement with Charles Schwab Weighted Avg. Interest Rate1 ($ in Billions) Capitalized MSR valuation is subject to non-cash GAAP earnings volatility due to interest rates, shape of the yield curve and other factors MSR asset valued at 73 bps of capitalized UPB, a 2.4x capitalized servicing multiple, at December 31, 2012 4.3% weighted average interest rate1 for 2009 and forward vintages at 12/31/12 – represents 65% of capitalized portfolio Mortgage Servicing Segment Overview Capitalized MSR Rate1 (bps) Delinquency ex-Foreclosure & REO2 3 Mortgage Servicing revenue consists of fees from servicing rights and subservicing agreements earned by providing various administrative services (e.g., collecting loan payments) Weighted-average servicing fee of 30 bps as of December 31, 2012 Mortgage Servicing Revenue Metrics Mortgage Servicing Rights 130 132 135 141 142 144 147 150 148 145 140 26 28 31 30 31 34 35 35 45 40 43 $156 $159 $166 $171 $174 $178 $182 $185 $193 $185 $184 $0 $50 $100 $150 $200 Q2 2010 5.4% 95 4.49% Q3 2010 5.3% 82 4.11% Q4 2010 5.2% 107 3.88% Q1 2011 5.1% 113 3.15% Q2 2011 5.0% 106 3.22% Q3 2011 4.9% 83 3.24% Q4 2011 4.9% 82 3.29% Q1 2012 4.8% 87 2.74% Q2 2012 4.7% 78 2.77% Q3 2012 4.6% 69 3.04% Q4 2012 4.5% 73 3.15% Capitalized Servicing Portfolio Subserviced Loans & Loans in Warehouse |
|
|
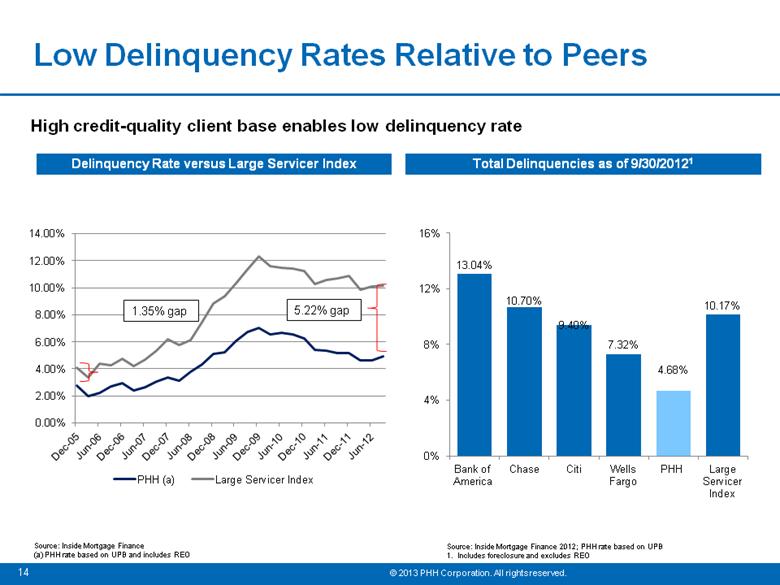
High credit-quality client base enables low delinquency rate Total Delinquencies as of 9/30/20121 Source: Inside Mortgage Finance 2012; PHH rate based on UPB 1. Includes foreclosure and excludes REO Delinquency Rate versus Large Servicer Index Source: Inside Mortgage Finance (a) PHH rate based on UPB and includes REO Low Delinquency Rates Relative to Peers Data Bank of America Chase Citi Wells Fargo PHH Large Service Provider |
|
|
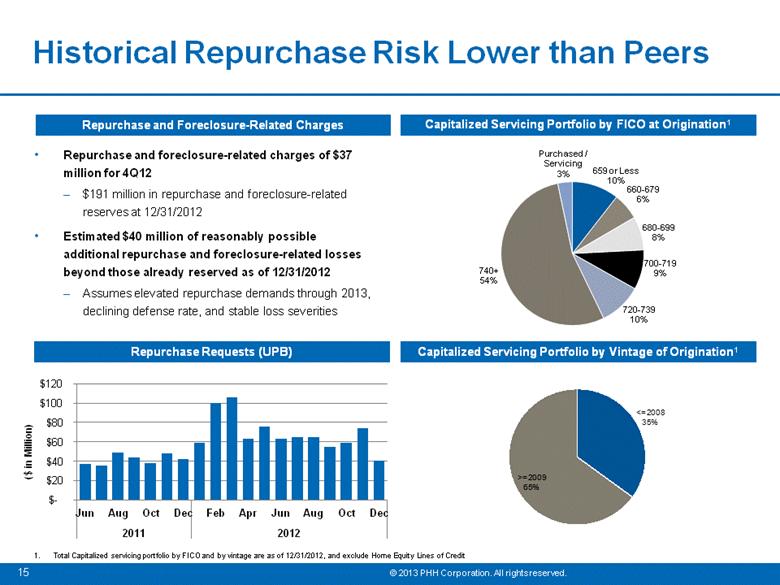
Repurchase and foreclosure-related charges of $37 million for 4Q12 $191 million in repurchase and foreclosure-related reserves at 12/31/2012 Estimated $40 million of reasonably possible additional repurchase and foreclosure-related losses beyond those already reserved as of 12/31/2012 Assumes elevated repurchase demands through 2013, declining defense rate, and stable loss severities Capitalized Servicing Portfolio by FICO at Origination1 Repurchase Requests (UPB) ($ in Million) Capitalized Servicing Portfolio by Vintage of Origination1 Historical Repurchase Risk Lower than Peers Repurchase and Foreclosure-Related Charges Total Capitalized servicing portfolio by FICO and by vintage are as of 12/31/2012, and exclude Home Equity Lines of Credit <=2008 35% >=2009 65% |
|
|
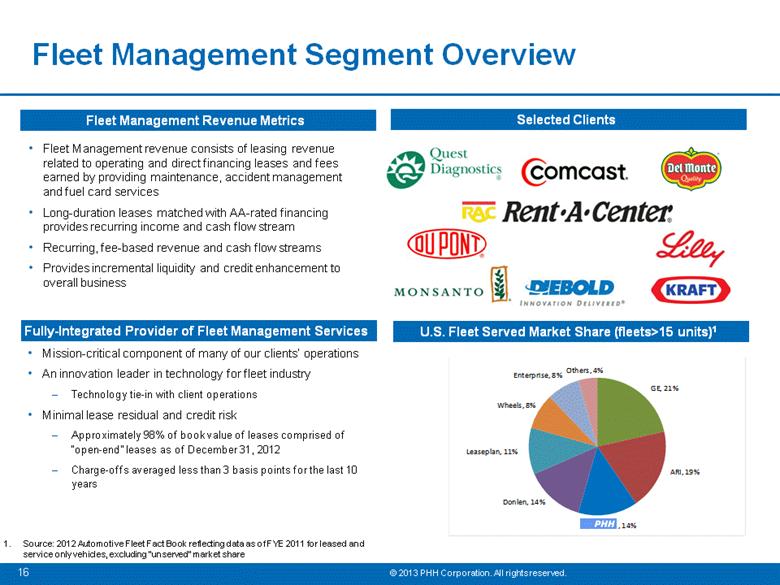
Fleet Management Segment Overview Mission-critical component of many of our clients’ operations An innovation leader in technology for fleet industry Technology tie-in with client operations Minimal lease residual and credit risk Approximately 98% of book value of leases comprised of “open-end” leases as of December 31, 2012 Charge-offs averaged less than 3 basis points for the last 10 years Fully-Integrated Provider of Fleet Management Services U.S. Fleet Served Market Share (fleets>15 units)1 1. Source: 2012 Automotive Fleet Fact Book reflecting data as of FYE 2011 for leased and service only vehicles, excluding "unserved" market share Selected Clients Fleet Management Revenue Metrics Fleet Management revenue consists of leasing revenue related to operating and direct financing leases and fees earned by providing maintenance, accident management and fuel card services Long-duration leases matched with AA-rated financing provides recurring income and cash flow stream Recurring, fee-based revenue and cash flow streams Provides incremental liquidity and credit enhancement to overall business GE, 21% ARI, 19% , 14% Donlen, 14% Leaseplan, 11% Wheels, 8% Enterprise, 8% Others, 4% |
|
|
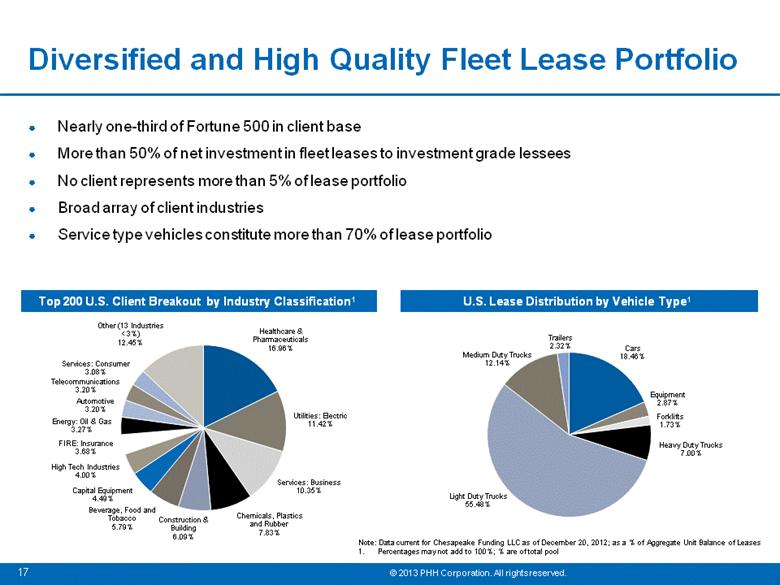
Diversified and High Quality Fleet Lease Portfolio Top 200 U.S. Client Breakout by Industry Classification1 U.S. Lease Distribution by Vehicle Type1 Nearly one-third of Fortune 500 in client base More than 50% of net investment in fleet leases to investment grade lessees No client represents more than 5% of lease portfolio Broad array of client industries Service type vehicles constitute more than 70% of lease portfolio Note: Data current for Chesapeake Funding LLC as of December 20, 2012; as a % of Aggregate Unit Balance of Leases Percentages may not add to 100%; % are of total pool |
|
|
Reconciliation of Non-GAAP Financial Measures |
|
|
Core earnings (loss) pre-tax involves differences from Mortgage Services Segment profit (loss) and Income (loss) before income taxes computed in accordance with GAAP. Core earnings (loss) (pre-tax) should be considered as supplementary to, and not as a substitute for, Mortgage Services Segment profit (loss) and Income (loss) before income taxes attributable to PHH Corporation computed in accordance with GAAP as a measure of the Company’s financial performance. Adjusted cash flow involves differences from Net increase (decrease) in cash and cash equivalents computed in accordance with GAAP. Adjusted cash flow should be considered as supplementary to, and not as a substitute for, Net increase (decrease) in cash and cash equivalents computed in accordance with GAAP as a measure of the Company’s net increase or decrease in cash and cash equivalents. Adjusted EBITDA and Adjusted EBITDA after net investment in MSRs involve differences from our results of operations computed in accordance with GAAP, and should be considered supplementary to, and not as a substitute for Income before income taxes. Additionally, these measures provide supplementary information pertaining to the Company’s results of operations and should not be used as substitute for cash flows from operations. Tangible book value and tangible book value per share involve differences from Total PHH Corporation stockholders’ equity computed in accordance with GAAP. Tangible book value and tangible book value per share should be considered as supplementary to, and not as a substitute for, Total PHH Corporation stockholders’ equity computed in accordance with GAAP as a measure of the Company’s financial position. The Company believes that these Non-GAAP financial measures can be useful to investors because they provide a means by which investors can evaluate the underlying key drivers and operating performance of the Company’s business, exclusive of certain adjustments and activities that investors may consider to be unrelated to or tend to obscure the underlying economic performance of the business for a given period. The Company also believes that any meaningful analysis of the Company’s financial performance by investors requires an understanding of the factors that drive the Company’s underlying operating performance which can be obscured by significant unrealized changes in value of the Company’s mortgage servicing rights, as well as any gain or loss on derivatives that are intended to offset market-related fair value adjustments on the Company’s mortgage servicing rights, in a given period that are included in Segment profit (loss), segment net revenue, Net income (loss) attributable to PHH Corporation and Basic earnings (loss) per share attributable to PHH Corporation in accordance with GAAP. Non-GAAP Financial Measures |
|
|
Non-GAAP Financial Measures (continued) Core earnings (loss) (pre-tax and after-tax) and core earnings (loss) per share Core earnings (loss) (pre-tax and after-tax) and core earnings (loss) per share measure the Company’s financial performance excluding unrealized changes in fair value of the Company’s mortgage servicing rights that are based upon projections of expected future cash flows and prepayments as well as realized and unrealized changes in the fair value of derivatives that are intended to offset changes in the fair value of mortgage servicing rights. The changes in fair value of mortgage servicing rights and related derivatives are highly sensitive to changes in interest rates and are dependent upon the level of current and projected interest rates at the end of each reporting period. Value lost from actual prepayments and recurring cash flows are recorded when actual cash payments or prepayments of the underlying loans are received, and are included in core earnings based on the current fair value of the mortgage servicing rights at the time the payments are received. The presentation of core earnings is designed to more closely align the timing of recognizing the actual value lost from prepayments in the mortgage servicing segment with the associated value created through new originations in the mortgage production segment. The Company believes that it will likely replenish most, if not all, realized value lost from changes in value from actual prepayments through new loan originations and actively manages and monitors economic replenishment rates to measure its ability to continue to do so. Therefore, management does not believe the unrealized change in value of the mortgage servicing rights is representative of the economic change in value of the business as a whole. Core earnings metrics are used in managing the Company’s mortgage business. The Company has also designed certain management incentives based upon the achievement of core earnings targets, subject to potential adjustments that may be made at the discretion of the Human Capital and Compensation Committee of the Company’s Board of Directors. Limitations on the use of Core Earnings Since core earnings (loss) (pre-tax and after-tax) and core earnings (loss) per share measure the Company’s financial performance excluding unrealized changes in value of mortgage servicing rights, such measures may not appropriately reflect the rate of value lost on subsequent actual payments or prepayments over time. As such, core earnings (loss) (pre-tax and after-tax) and core earnings (loss) per share may tend to overstate operating results in a declining interest rate environment and understate operating results in a rising interest rate environment, absent the effect of any offsetting gains or losses on derivatives that are intended to offset changes in fair value on the Company’s mortgage servicing rights. Due to changes in the Company’s mortgage servicing rights valuation model that became effective January 1, 2012, the Company no longer reports “Credit-related fair value adjustments” to MSRs as a discrete component of the change in value of MSRs. For periods ending after December 31, 2011, “Market-related fair value adjustments” in the accompanying Regulation G reconciliation include changes in MSR value due to the impact of estimated portfolio delinquencies and foreclosures. Accordingly, amounts previously classified as “Credit-related fair value adjustments” have been reclassified to “Market-related fair value adjustments” for periods ending on or before December 31, 2011. |
|
|
Adjusted Cash Flow Adjusted cash flow measures the Company’s Net increase (decrease) in cash and cash equivalents for a given period excluding changes resulting from the issuance of equity, the purchase of derivative securities related to the Company’s stock or the issuance or repayment of unsecured or other debt by PHH Corporation. The Company believes that Adjusted cash flow is a useful measure for investors because the Company’s ability to repay future unsecured debt maturities or return capital to equity holders is highly dependent on a demonstrated ability to generate cash. Accordingly, the Company believes that Adjusted cash flow may assist investors in determining the amount of cash and cash equivalents generated from business activities during a period that is available to repay unsecured debt or distribute to holders of the Company’s equity. Adjusted cash flow can be generated through a combination of earnings, more efficient utilization of asset-backed funding facilities, or an improved working capital position. Adjusted cash flow can vary significantly between periods based upon a variety of potential factors including timing related to cash collateral postings, mortgage origination volumes and margins, fleet vehicle purchases, sales, and related securitizations, etc. Adjusted cash flow is not a substitute for the Net increase (decrease) in cash and cash equivalents for a period and is not intended to provide the Company’s total sources and uses of cash or measure its change in liquidity. As such, it is important that investors review the Company’s consolidated statement of cash flows for a more detailed understanding of the drivers of net cash provided by (used in) operating activities, investing activities, and financing activities. Adjusted cash flow metrics are used in managing the Company’s mortgage and fleet businesses. The Company has also designed certain management incentives based upon the achievement of adjusted cash flow targets, subject to potential adjustments that may be made at the discretion of the Human Capital and Compensation Committee of the Company’s Board of Directors. Adjusted EBITDA and Adjusted EBITDA after Net Investment in MSRs Adjusted EBITDA measures the Company’s financial performance excluding (i) unrealized changes in fair value of the Company’s mortgage servicing rights that are based upon projections of expected future cash flows and prepayments, (ii) realized and unrealized changes in value of derivatives that are intended to offset changes in the fair value of mortgage servicing rights (iii) interest expense on unsecured debt (iv) provision for income taxes and (v) non-vehicle depreciation and amortization. Adjusted EBITDA also excludes the impact of certain significant unusual items that may not be reflective of the underlying operating performance of the business during the period. Non-GAAP Financial Measures (continued) |
|
|
Adjusted EBITDA after net investment in MSRs is further adjusted to exclude the value of initial capitalized mortgage servicing rights as well as the change in value of mortgage servicing rights due to prepayments and the receipt of recurring cash flows. Adjusted EBITDA and Adjusted EBITDA after net investment in MSRs are intended illustrate the Company’s operating profitability available to service unsecured debt obligations before and after considering its investment in mortgage servicing rights. Adjusted EBITDA includes the non-cash increase in value of originated MSRs in the period that is expected to be realized over time as well as the non-cash decline in value of MSRs due to the receipt of recurring cash flows and prepayments. Since Adjusted EBITDA after net investment in MSRs excludes the impact of mortgage servicing rights, it is more closely aligned with cash earnings realized during the period. Adjusted EBITDA and Adjusted EBITDA after net investment in MSRs are useful to equity investors and our creditors as a measure of the Company’s ability to generate returns that are available to fund principal and interest payments on unsecured debt or return capital to shareholders, on an operating basis. Adjusted EBITDA and Adjusted EBITDA after net investment in MSRs exclude items that can have a significant impact on our GAAP results. Furthermore, these measures exclude the impact of collateral posting agreements with respect to our derivative contracts, which can have a significant impact on our cash flows. Adjusted EBITDA and Adjusted EBITDA after net investment in MSRs involve differences from our results of operations computed in accordance with GAAP, and should be considered supplementary to, and not as a substitute for Income before income taxes. Additionally, these measures provide supplementary information pertaining to the Company’s results of operations and should not be used as substitute for cash flows from operations. Tangible book value and Tangible book value per share Tangible book value is a measure of Total PHH Corporation stockholders’ equity computed in accordance with GAAP excluding the value of goodwill and other intangible assets. Tangible book value per share is a measure of tangible book value, on a per share basis, using the number of shares of outstanding PHH Corporation common stock as of the applicable measurement date. Certain of the Company’s debt agreements contain indebtedness-to-tangible net worth ratio covenants, and such ratios are calculated using a measure of tangible net worth that is calculated on a basis similar to the Company’s calculation of tangible book value. Accordingly, the Company believes that tangible book value and tangible book value per share provide useful supplementary information to investors. Non-GAAP Financial Measures (continued) |
|
|
Non-GAAP Financial Measures Reconciliation – Core Earnings (1) Represents the Change in fair value of MSRs due to changes in market inputs and assumptions used in the valuation model. (2) Incremental effective tax rate of 41% was applied to the MSRs fair value adjustments to arrive at the net of taxes amounts. (in millions, except per share amounts) December 31, September 30, December 31, December 31, December 31, 2012 2012 2011 2012 2011 $ 99 $ (56) $ 21 $ 87 $ (202) 15 19 8 59 25 Segment profit (loss) 84 (75) 13 28 (227) (29) 150 68 223 521 Net derivative loss (gain) related to MSRs 10 (8) 4 5 3 Core earnings (pre-tax) $ 65 $ 67 $ 85 $ 256 $ 297 $ 58 $ (42) $ 13 $ 34 $ (127) (18) 89 40 131 307 Net derivative loss (gain) related to MSRs, net of taxes (2) 6 (5) 2 3 2 Core earnings (after-tax) $ 46 $ 42 $ 55 $ 168 $ 182 $ 1.01 $ (0.74) $ 0.22 $ 0.60 $ (2.26) (0.31) 1.57 0.72 2.31 5.46 Net derivative loss (gain) related to MSRs, net of taxes 0.11 (0.09) 0.04 0.05 0.03 Core earnings per share $ 0.81 $ 0.74 $ 0.98 $ 2.96 $ 3.23 56.957 56.842 56.504 56.815 56.349 calculating per-share amounts (in millions) Basic weighted-average common shares outstanding used in Basic earnings (loss) per share attributable to PHH Corporation - as reported Market-related fair value adjustments, net of taxes (1) Three Months Ended Year Ended Income (loss) before income taxes - as reported Less: net income attributable to noncontrolling interest Market-related fair value adjustments (1) Net loss attributable to PHH Corporation - as reported Market-related fair value adjustments, net of taxes (1)(2) |
|
|
Non-GAAP Financial Measures Reconciliation – Core Earnings by Segment (1) Represents the Change in fair value of MSRs due to changes in market inputs and assumptions used in the valuation model. (in millions) $ 99 $ (35) $ 20 ? $ $ 416 $ (462) $ 87 $ (13) ? (29) ? ? ? 223 ? ? ? 10 ? ? ? 5 ? ? Core earnings (loss) $ 99 $ (54) $ 20 ? $ $ 416 $ (234) $ 87 $ (13) $ 122 $ (205) $ 21 $ (13) ? 150 ? ? ? (8) ? ? Core earnings (loss) $ 122 $ (63) $ 21 $ (13) Mortgage Production Mortgage Servicing Fleet Management Services Other Mortgage Production Mortgage Servicing Fleet Management Services Other $ 86 $ (90) $ 19 $ (2) $ 258 $ (557) $ 75 $ (3) ? 68 ? ? ? 521 ? ? ? 4 ? ? ? 3 ? ? Core earnings (loss) $ 86 $ (18) $ 19 $ (2) $ 258 $ (33) $ 75 $ (3) Three Months Ended December 31, 2012 Three Months Ended September 30, 2012 Fleet Management Services Other Other Year Ended December 31, 2012 Mortgage Production Mortgage Servicing Fleet Management Services Fleet Management Services Segment profit (loss) Market-related fair value adjustments (1) Other Mortgage Production Mortgage Servicing Mortgage Production Mortgage Servicing Three Months Ended December 31, 2011 Year Ended December 31, 2011 Net derivative loss related to MSRs Segment profit (loss) Market-related fair value adjustments (1) Net derivative loss related to MSRs Net derivative gain related to MSRs Segment profit (loss) Market-related fair value adjustments (1) |
|
|
Non-GAAP Financial Measures Reconciliation – Adjusted Cash Flow and Adjusted EBITDA (in millions) December 31, September 30, December 31, December 31, December 31, 2012 2012 2011 2012 2011 Net (decrease) increase in Cash and cash equivalents $ 152 $ (23) $ 330 $ 415 $ 219 ? 144 (19) 153 (99) (4) (1) ? (5) (8) Adjusted cash flow $ 148 $ 120 $ 311 $ 563 $ 112 $ 99 $ (56) $ 21 $ 87 $ (202) 15 19 8 59 25 84 (75) 13 28 (227) (29) 150 68 223 521 10 (8) 4 5 3 $ 65 $ 67 $ 85 $ 256 $ 297 $ 32 $ 33 $ 31 $ 134 $ 128 6 7 6 25 25 ? ? ? ? (68) $ 103 $ 107 $ 122 $ 415 $ 382 $ 75 $ 75 $ 64 $ 274 $ 212 (66) (70) (142) (310) (499) $ 112 $ 112 $ 44 $ 379 $ 95 Adjusted EBITDA Less: Capitalization of originated MSRs Income (loss) before income taxes (as reported) Segment profit (loss) Market-related fair value adjustments Net derivative loss (gain) related to MSRs Less: Net income attributable to noncontrolling Other items (1) Adjusted EBITDA after net investment in MSRs and receipts of recurring cash flows Core earnings (pre-tax) Plus: Unsecured interest expense Plus: Other depreciation and amortization Adjusted EBITDA Plus: Change in MSR value due to actual Three Months Ended Adjustments: Year Ended Decrease (increase) in unsecured borrowings Issuances of common stock Adjusted cash flow |
|
|
Non-GAAP Financial Measures Reconciliation – Tangible Book Value ($ in millions, except per share amounts) 2012 2011 $ 1,526 $ 1,442 Goodwill (25) (25) Intangible assets (31) (33) $ 1,470 $ 1,384 56,975,991 56,361,155 $ 25.80 $ 24.56 December 31, Tangible Book Value Common shares issued and outstanding Tangible book value per share PHH Corporations stockholder's equity - as reported |