Attached files
| file | filename |
|---|---|
| 8-K - CURRENT REPORT INVESTOR PRESENTATION FEBRUARY 12, 2013 - SPIRE MISSOURI INC | a8-k_currentreportx02122013.htm |

1 T H E L A C L E D E G R O U P Investor Presentation F E B R U A R Y 2 0 1 3


3 T H E L A C L E D E G R O U P This presentation contains forward-looking statements within the meaning of the Private Securities Litigation Reform Act of 1995. Our forward-looking statements in this presentation speak only as of today, and we assume no duty to update them. Forward- looking statements are typically identified by words such as, but not limited to, “estimates,” expects,” “anticipates,” “intends,” and similar expressions. Although our forward-looking statements are based on reasonable assumptions, various uncertainties and risk factors may cause future performance or results to be different than those anticipated. A description of the uncertainties and risk factors can be found in our annual report on Form 10-K for fiscal 2012, and in our Form 10-Q filings made with the Securities and Exchange Commission in the “Risk Factors” section as well as under the “Forward-Looking Statements” heading. Note: Years shown in this presentation are fiscal years ended September 30. Investor Relations Contacts: Scott W. Dudley Jr. Steven P. Rasche Director, Investor Relations Senior Vice President, Finance & Accounting (314) 342-0878 (314) 342-0577 sdudley@thelacedegroup.com srasche@lacledegas.com Forward Looking Statements

4 T H E L A C L E D E G R O U P Financially strong, growing natural gas services provider The Laclede Group Today Laclede Service Territory Interstate Pipeline 2012 Net Economic Earnings1 $62.6 million 1See reconciliation of Net Economic Earnings (non-GAAP) to Income from Continuing Operations (GAAP) on Appendix page 31. $48.1 $12.3 $2.2 Propane and other non-regulated business Largest Missouri natural gas local distribution company 630,000 mostly residential customers 16,000+ miles of pipe Diversified gas supply Significant storage Diverse supply and customer base Profitable and cash generating Opportunities for growth in customers and service offerings Non-regulated natural gas services

5 T H E L A C L E D E G R O U P The Laclede Group in the Future Kansas City Jefferson City MO IL KS OK AR St. Louis Pro Forma MO Customer Mix 1 1 Interruptible customers account for <0.01% of customer mix. Note: Laclede Gas customer information at 9/30/2012, MGE customer information as of 12/31/2011 2011 MA Customer Mix Boston Providence MA RI Residential 92% Commercial & Industrial 7% Transportation 1% Residential 91% Commercial & Industrial 9%
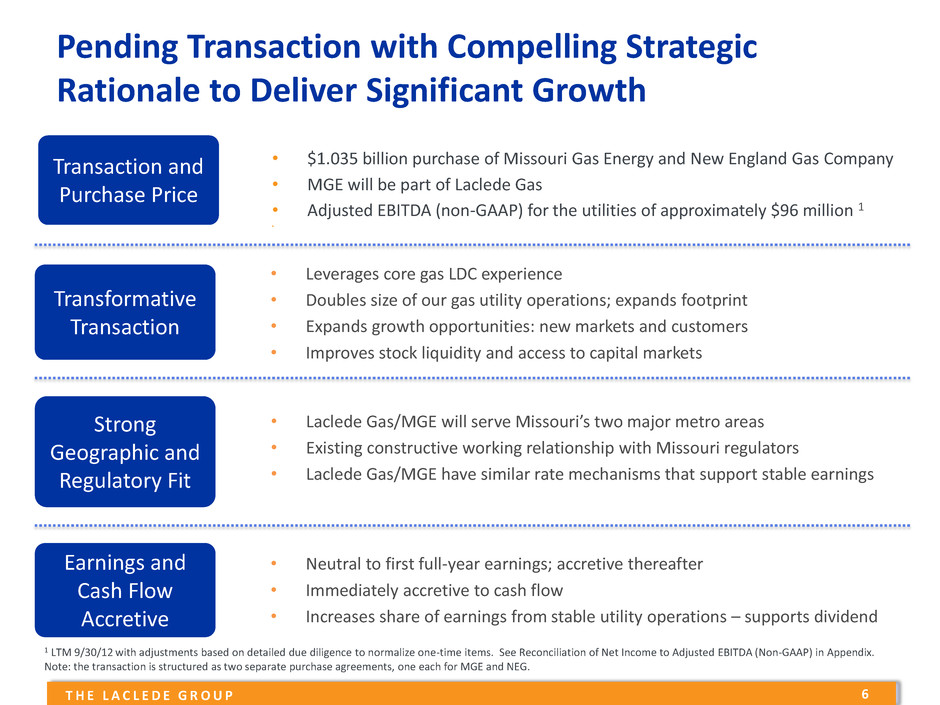
6 T H E L A C L E D E G R O U P • $1.035 billion purchase of Missouri Gas Energy and New England Gas Company • MGE will be part of Laclede Gas • Adjusted EBITDA (non-GAAP) for the utilities of approximately $96 million 1 • Transaction and Purchase Price 1 LTM 9/30/12 with adjustments based on detailed due diligence to normalize one-time items. See Reconciliation of Net Income to Adjusted EBITDA (Non-GAAP) in Appendix. Note: the transaction is structured as two separate purchase agreements, one each for MGE and NEG. Transformative Transaction • Leverages core gas LDC experience • Doubles size of our gas utility operations; expands footprint • Expands growth opportunities: new markets and customers • Improves stock liquidity and access to capital markets Strong Geographic and Regulatory Fit Earnings and Cash Flow Accretive • Laclede Gas/MGE will serve Missouri’s two major metro areas • Existing constructive working relationship with Missouri regulators • Laclede Gas/MGE have similar rate mechanisms that support stable earnings • Neutral to first full-year earnings; accretive thereafter • Immediately accretive to cash flow • Increases share of earnings from stable utility operations – supports dividend Pending Transaction with Compelling Strategic Rationale to Deliver Significant Growth

7 T H E L A C L E D E G R O U P Enhancing Our Scale (Pro Forma) Adjusted EBITDA 1 - $251 million Gas Utility Customers - 1.2 million 91% Regulated Adjusted EBITDA 1 See reconciliation of Net Income to Adjusted EBITDA (Non-GAAP) in Appendix. Note: Financials as of LTM 9/30/12; MGE and NEG EBITDA adjustments based on detailed due diligence to normalize one-time items; Laclede Gas customers as of 9/30/12, MGE and NEG customers as of 12/31/11 Gas Utility Customers – LDCs Gas Utility 4.5 3.2 1.8 1.2 1.1 1.0 0.7 0.6 0.6 0.5 0.4 GAS ATO SWX LG (pro forma) WGL PNY NWN LG MGE/NEG NJR SJI (in m illion s) 52% 35% 4% 9% 53% 42% 5% Gas Marketing

8 T H E L A C L E D E G R O U P Transaction Completion Timeline Q1 Fiscal 2013 Q2 Fiscal 2013 Q4 Fiscal 2013 Q3 Fiscal 2013 Announced December 17 Obtain Regulatory Approvals Hart-Scott-Rodino Clearance Received January 22 Missouri PSC Application Filed for MGE January 14 Massachusetts DPU Application Filed for NEG January 24 Closing Expected by Fiscal Year End (9/30/13) Integration Planning Debt and Equity Financing Dec Mar Jun Sep

9 T H E L A C L E D E G R O U P • Transaction supported by $1.02 billion bridge facility - Led by Wells Fargo Securities LLC - Syndicated to 9 financial institutions with deep utility experience • Permanent financing will include issuance of both equity and long-term debt • Existing revolving credit facility will be resized/extended • Interest rates are being hedged to mitigate risk Transaction Financing Debt Ratings Laclede Group Laclede Gas First Mortgage Bonds Laclede Gas Commercial Paper S&P A A A-1 Moody’s A2 P-2 Fitch A- A+ F1

1 0 T H E L A C L E D E G R O U P • Acquiring businesses that fit our operating model • Investing in infrastructure • Developing and investing in emerging technologies • Leveraging our competencies Growth Strategies
1 1 T H E L A C L E D E G R O U P • Well-defined, disciplined process in place - Based on appropriate returns for invested capital - Leveraging our expertise, experience and relationships • Investment opportunities – focused in natural gas industry - Local distribution companies - First and last mile pipeline • Delivering benefits to all stakeholders - Increased scale - Supporting continued dividend growth - Retaining targeted long-term business mix: 70% regulated Pursuing Acquisitions

1 2 T H E L A C L E D E G R O U P • Distribution system - Accelerated main replacement (41 miles in 2012); ISRS recoverable - Improves safety and reliability • Information technology - Multi-year project to replace core systems - Phase 1 implemented Q1 FY 2013; Phase 2 in process Gas Utility - Investing in Infrastructure 40 51 62 20 27 29 8 31 24 0 20 40 60 80 100 120 2011 2012 2013 (fcst) $ mil lio n s ISRS Recoverable Distribution, Equipment and Other Information Technology 68 109 115 Capital Expenditures

1 3 T H E L A C L E D E G R O U P • General rate case - Filed Dec. 2012 for $58.4 million gross revenue increase - Missouri Public Service Commission decision within 11 months of filing • Purchased Gas Adjustment - Reduced average residential customer bill by 6% November 2012 - Lowest gas cost in 9 years • Infrastructure System Replacement Surcharge (ISRS) - Current surcharge already recovered in customer rates - January ISRS 2013 filing; decision anticipated mid-March Net rate case annualized revenues after ISRS Gross revenue increase, as filed Gas Utility – Regulatory Update Laclede Gas - 2012 Rate Case Recap Annual Rev. ($ mil) 10.0$ 5.6 42.8 58.4$

1 4 T H E L A C L E D E G R O U P • Targeting opportunities in - NGV fueling stations - Combined heat and power (CHP) - Microturbines/fuel cells • Leveraging Laclede’s expertise - 30 years’ experience with NGVs - Operates NGV fueling station (15 yrs) - National thought leader on NGV - 50 NGV vehicles in fleet - Headquarters building utilizes CHP Investing in Emerging Technologies

1 5 T H E L A C L E D E G R O U P • Laclede + Siemens • Offering end-to-end NGV fueling solutions - Significant market opportunity across the US - Tailored to needs of anchor customers - Services: plan, design, build, operate, maintain - Primary targets: regional trucking, transit, waste Spire™ Natural Gas Fueling Solutions • Lambert-St. Louis International Airport - Build, own and operate NGV fueling station and supply fuel - Customers: commercial fleets; also public use - Completion during first half of fiscal 2014

1 6 T H E L A C L E D E G R O U P • Diverse supplier and customer base • Response to market conditions - Reduced transportation costs - Increased asset optimization • Risk managed - Daily monitoring of key risk metrics - Formal credit, counterparty and liquidity monitoring • Solidly profitable and cash generating • Growth opportunities - 1 Bcf of leased storage - Expanding customer base and service offerings Gas Marketing Michigan Henry Hub Chicago Perryville Hub St. Louis

1 7 T H E L A C L E D E G R O U P Financial Review

1 8 T H E L A C L E D E G R O U P Growing Utility Earnings 1See reconciliation of Net Economic Earnings Per Share (Non-GAAP) to Diluted EPS from Continuing Operations (GAAP) on Appendix page 31. 1.49 1.63 2.10 2.14 0.94 1.13 1.27 0.70 0.40 0.55 0.15 0.15 (0.02) 0.19 0.29 0.10 0.02 (0.03) 2.74 2.52 2.79 2.79 1.11 1.25 (0.10) 0.40 0.90 1.40 1.90 2.40 2.90 3.40 2009 2010 2011 2012 Q1 FY2012 Q1 FY2013 $ N et E co n omi c Ea rn in gs p er Sh ar e 1 Gas Utility Gas Marketing Propane and Other
1 9 T H E L A C L E D E G R O U P • Net Economic Earnings1 of $28.2 million ($1.25/share), up $3.3 million ($0.14/share) - Gas Utility earnings up 20% to $25.3 million • Higher ISRS revenues and margins on colder temperatures • Lower operating and maintenance costs - Gas Marketing earnings $3.3 million vs. $3.4 million • Significantly lower revenues and expenses reflecting net vs. gross reporting • Continued profitable performance despite market conditions • Acquisition costs reduced net income to $25.6 million ($1.14/share) - FY Q1 acquisition costs of $3.6 million ($0.10/share impact) - Additional expenses of $15 - $20 million prior to close - Excludes costs associated with debt and equity issuance Q1 Financial Highlights 1See reconciliation of Net Economic Earnings (Non-GAAP) to Income from Continuing Operations (GAAP) on Appendix page 31.

2 0 T H E L A C L E D E G R O U P • Dividend paid continuously since 1946 • Increased for 10 consecutive years • Top quartile dividend yield • Historical payout 55%-65%, supported by utility earnings Growing Dividends 1.54 1.58 1.62 1.66 1.70 1.30 1.35 1.40 1.45 1.50 1.55 1.60 1.65 1.70 2009 2010 2011 2012 2013 $ pe r Sha re
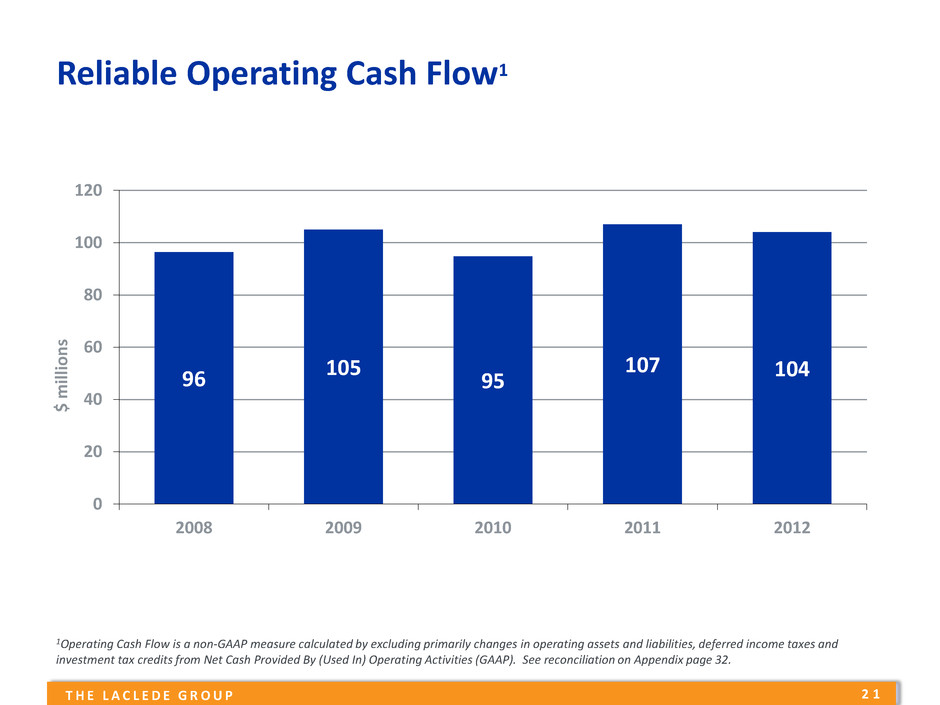
2 1 T H E L A C L E D E G R O U P Reliable Operating Cash Flow1 1Operating Cash Flow is a non-GAAP measure calculated by excluding primarily changes in operating assets and liabilities, deferred income taxes and investment tax credits from Net Cash Provided By (Used In) Operating Activities (GAAP). See reconciliation on Appendix page 32. 96 105 95 107 104 0 20 40 60 80 100 120 2008 2009 2010 2011 2012 $ mil lio n s

2 2 T H E L A C L E D E G R O U P • Consolidated equity capitalization of 63% at 12/31/12 • $350 million credit facility through 2016/17 • Q1 FY 2013: - Retired $25 million Laclede Gas 6.5% debt - Funded $25 million Laclede Group medium-term 3.31% debt • $100 million Laclede Gas debt funds March 2013 Strong Balance Sheet and Capital Capacity 50 25 55 100 55 80 55 45 0 20 40 60 80 100 120 140 2013 - 2015 2016 - 2020 2021 - 2025 2026 - 2030 2031 - 2035 2036 - 2040 $ M ill io n s Debt Maturity Debt Callable in 2013 Forward-Settling Debt Placements
2 3 T H E L A C L E D E G R O U P • Acquisition to deliver significant growth - Doubles our size; accretive to earnings and cash flow - Approvals, permanent financing, integration all well underway • Organic growth through infrastructure investments • Investment in emerging technologies – Spire™ • Supported by strong financial foundation - Solid balance sheet - Excellent liquidity and available capital • Track record of growing earnings to support dividend Delivering Shareholder Value


2 5 T H E L A C L E D E G R O U P Appendix

2 6 T H E L A C L E D E G R O U P • Currently largest LDC in Missouri, primarily serving St. Louis metro area - ~94% residential customers - Access to 7 pipelines (from Mid-Continent and Gulf Coast supply basins) - 27 Bcf of upstream contracted and in-market gas storage capacity - 3 Bcfe non-regulated propane storage • ~16,000 miles of mains and service lines 2012 Customer Mix 1 Residential 94% Commercial & Industrial 6% 1Transportation customers account for <0.02% of customer mix; information as of 9/30/12

2 7 T H E L A C L E D E G R O U P • 2nd largest LDC in Missouri, serving metro Kansas City, MO area and Joplin/Monett - ~88% residential customers - Access to 5 interstate pipelines (from Rockies and Mid-Continent supply basins) - 18 Bcf of contracted gas storage capacity • ~13,000 miles of main and service lines Key Statistics Net Utility Assets ($MM) $633 Allowed ROE 10.00% Customers 501,822 Employees 647 2011 Customer Mix 1 Residential 88% Commercial & Industrial 12% 1Transportation customers account for 0.02% of customer mix. Note: Net utility assets and employees as of 9/30/12; customers as of 12/31/11

2 8 T H E L A C L E D E G R O U P MA Boston Providence RI • LDC serving the Fall River and North Attleboro areas of SE Massachusetts - ~92% residential customers - Access to 5 interstate pipelines (from Gulf Coast and Appalachian supply basins) - 1 Bcf of storage capacity; ~150,000 Dth LNG storage facility • ~2,000 miles of mains and service lines Key Statistics Net Utility Assets ($MM) $76 Allowed ROE 9.45% Customers 52,738 Employees 131 Residential 92% Commercial & Industrial 7% Transportation 1% 2011 Customer Mix Note: Net utility assets and employees as of 9/30/12; customers as of 12/31/11

2 9 T H E L A C L E D E G R O U P Regulatory Mechanisms Stabilize Cash Flow 1 Missouri LDCs utilize the Infrastructure System Replacement Surcharge (ISRS); NEG has a similar recovery mechanism, the Targeted Infrastructure Replacement Factor (TIRF) 2 Source: Ratings of state regulatory environments for Missouri and Massachusetts by Regulatory Research Associates, January 2013 Regulatory Item Rate Design Weather-Mitigation Rates Straight-Fixed-Variable Rates Semi-Annual Decoupling Purchased Gas Adjustment Clause Infrastructure Cost Recovery Mechanisms1 Pension Cost Tracker Energy Efficiency / Conservation Regulatory Rating2 Missouri - Average MA - Average Acquisition Approval Standard No Net Detriment Net Benefits

3 0 T H E L A C L E D E G R O U P Access to Additional Gas Transportation

3 1 T H E L A C L E D E G R O U P Net Economic Earnings (Non-GAAP) to Income from Continuing Operations (GAAP) Reconciliation FY Ended FY Ended FY Ended FY Ended FY Ended FY Ended September 30, September 30, September 30, September 30, September 30, September 30, (Millions, except per share amounts) 2007 2008 2009 2010 2011 2012 Net economic earnings (Non-GAAP) 46.1$ 59.1$ 60.8$ 56.1$ 62.4$ 62.6$ Add: Unrealized gain (loss) on energy-related derivatives (1) (0.4) (1.6) 3.4 (2.1) 1.4 0.3 Add: Realized gain (loss) on economic hedges prior to sale of commodity (1) - - - - - (0.2) Add: Acquisition, divestiture and restructuring activities (1) - - - - - (0.1) Income from Continuing Operations (GAAP) 45.7$ 57.5$ 64.2$ 54.0$ 63.8$ 62.6$ Net economic earnings per share excluding propane sale (Non-GAAP) 2.13$ 2.70$ 2.74$ 2.36$ 2.52$ 2.79$ - - - 0.16 0.27 - Net economic earnings per share (Non-GAAP) 2.13 2.70 2.74 2.52 2.79 2.79 Add: Unrealized gain (loss) on energy-related derivatives (1) (0.02) (0.07) 0.15 (0.09) 0.07 0.02 Add: Realized gain (loss) on economic hedges prior to sale of commodity (1) - - - - - (0.01) Add: Acquisition, divestiture and restructuring activities (1) - - - - - (0.01) Diluted EPS from Continuing Operations (GAAP) 2.11$ 2.63$ 2.89$ 2.43$ 2.86$ 2.79$ inventories (2) Add: Sale of excess propane Amounts presented net of income taxes, which are calculated by applying federal, state, and local income tax rates applicable to ordinary income to the amounts of pre-tax reconciling items. Net economic earnings per share and net economic earnings per share excluding propane sale are calculated by replacing consolidated income from continuing operations with net economic earnings and net economic earnings excluding propane sale in the GAAP diluted earnings per share calculation. (1) For fiscal years 2011, 2010, 2009, 2008, and 2007, the amounts of income tax expense (benefit) included in the consolidated reconciling items above are $0.9 million, $(1.3) million, $2.2 million, $(1.0) million, and $(0.2) million, respectively. Such amount is negligible for fiscal 2012. (2) Income tax expense associated with the sale of excess propane inventories was $3.9 million and $2.3 million for fiscal years 2011 and 2010, respectively.

3 2 T H E L A C L E D E G R O U P Operating Cash Flow (Non-GAAP) to Net Cash Provided by (Used In) Operating Activities (GAAP) Reconciliation (Millions) 2008 2009 2010 2011 2012 Operating cash flow from continuing operations (excluding working capital) (Non-GAAP) 96.4$ 105.0$ 94.8$ 107.0$ 104.0$ Add (Deduct): Changes in operating assets and liabilities (118.2) 105.9 (20.7) 36.3 (6.5) Deferred income taxes and investment tax credits 5.8 17.9 32.8 23.9 30.6 Gain on sale of discontinued operations (44.4) - - - - Depreciation from discontinued operations 1.3 - - - - Certain FIN 48 tax benefits 2.2 - - - - Net cash provided by (used in) operating activities (GAAP) (36.5)$ 228.8$ 106.9$ 167.2$ 128.1$ Net cash provided by (used in) investing activities (GAAP) 26.9$ (52.3)$ (60.8)$ (67.0)$ (105.4)$ Net cash provided by (used in) financing activities (GAAP) (28.3)$ (116.8)$ (33.8)$ (143.8)$ (38.5)$ Fiscal Years Ended September 30 This presentation includes the non-GAAP measure of “operating cash flow from continuing operations (excluding working capital).” Management uses this non-GAAP measure internally when evaluating longer-term cash flow impacts. This measure excludes the effects of temporary changes in working capital, such as the effect of regulatory timing differences in the recovery of certain costs and the timing of cash payments for income taxes. Operating cash flow from continuing operations (excluding working capital) is calculated as income from continuing operations plus depreciation, amortization, and accretion expense (from continuing operations), plus certain non-cash charges (credits) to income (which are reflected in the “Other-net” line of the Statement of Cash Flows), minus certain tax-related benefits recorded pursuant to FIN 48 (as codified in ASC 740). Management believes that excluding these items provides a useful representation of the economic impact of longer-term cash flows generated from business activities. This internal non-GAAP measure should not be considered as an alternative to, or more meaningful than, GAAP measures such as net cash provided by (used in) operating activities.
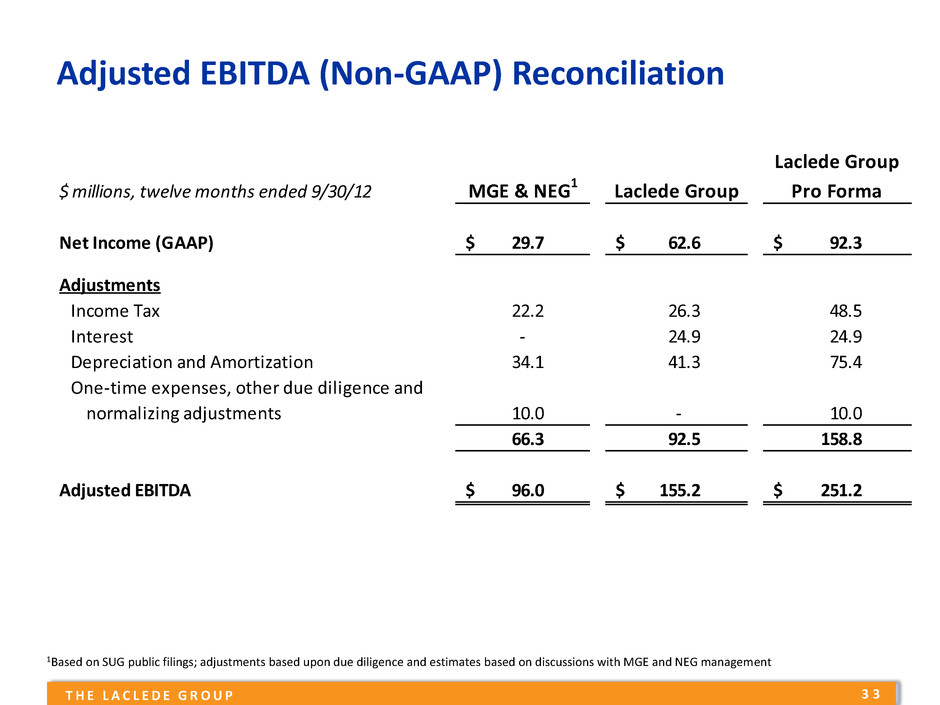
3 3 T H E L A C L E D E G R O U P Adjusted EBITDA (Non-GAAP) Reconciliation Laclede Group $ millions, twelve months ended 9/30/12 Laclede Group Pro Forma Net Income (GAAP) 29.7$ 62.6$ 92.3$ Adjustments Income Tax 22.2 26.3 48.5 Interest - 24.9 24.9 Depreciation and Amortization 34.1 41.3 75.4 One time expenses, other due diligence and normalizing adjustments 10.0 - 10.0 66.3 92.5 158.8 Adjusted EBITDA 96.0$ 155.2$ 251.2$ MGE & NEG1 1Based on SUG public filings; adjustments based upon due diligence and estimates based on discussions with MGE and NEG management
