Attached files
| file | filename |
|---|---|
| 8-K - FORM 8-K - HUNTINGTON BANCSHARES INC /MD/ | d482398d8k.htm |
Exhibit 99.1

| Credit Suisse Financial Services Forum February 12, 2013 |

| This document contains certain forward-looking statements, including certain plans, expectations, goals, projections, and statements, which are subject to numerous assumptions, risks, and uncertainties. Forward-looking statements may be identified by words such as expect, anticipate, believe, intend, estimate, plan, target, goal, or similar expressions, or future or conditional verbs such as will, may, might, should, would, could, or similar variations. While there is no assurance that any list of risks and uncertainties or risk factors is complete, below are certain factors which could cause actual results to differ materially from those contained or implied in the forward-looking statements: (1) worsening of credit quality performance due to a number of factors such as the underlying value of collateral that could prove less valuable than otherwise assumed and assumed cash flows may be worse than expected; (2) changes in economic conditions, including impacts from the implementation of the Budget Control Act of 2011 and the American Taxpayer Relief Act of 2012 as well as the continuing economic uncertainty in the US, the European Union, and other areas; (3) movements in interest rates; (4) competitive pressures on product pricing and services; (5) success, impact, and timing of our business strategies, including market acceptance of any new products or services implementing our "Fair Play" banking philosophy; (6) changes in accounting policies and principles and the accuracy of our assumptions and estimates used to prepare our financial statements; (7) extended disruption of vital infrastructure; (8) the final outcome of significant litigation; (9) the nature, extent, timing and results of governmental actions, examinations, reviews, reforms, and regulations including those related to the Dodd-Frank Wall Street Reform and Consumer Protection Act; and (10) the outcome of judicial and regulatory decisions regarding practices in the residential mortgage industry, including among other things the processes followed for foreclosing residential mortgages. Additional factors that could cause results to differ materially from those described above can be found in Huntington's 2011 Annual Report on Form 10-K, and documents subsequently filed by Huntington with the Securities and Exchange Commission. All forward-looking statements included in this document are based on information available at the time of the release. Huntington assumes no obligation to update any forward-looking statement. Forward Looking Statements 2 |

| Participants 3 Presenter Don Kimble Senior Executive Vice President - Chief Financial Officer Mary Navarro Senior Executive Vice President - Retail and Business Banking Director Also Present Todd Beekman Senior Vice President - Investor Relations Mark Muth Vice President - Investor Relations |
| 2012 Highlights & Kimble Strategic Plan Update Retail & Branch Philosophy, Navarro In-store Progress Report & Customer Update Performance vs. Peers & Kimble Important Messages Discussion Topics 4 |

| 1.15% return on average assets $0.71 earnings per share, up $0.12 from the prior year $204 MM, or 8%, increase in fully-taxable equivalent revenue $87 MM, or 5%, increase in fully-taxable equivalent net interest income, reflecting: $3.1 B, or 8%, growth in average core deposits (includes impact of $1.5 B of core CD runoff) $1.3 B, or 3%, growth in average total loans (includes impact of $2.5 B of auto loan sales) 3.41% net interest margin in 2012, up 3 basis points $117 MM, or 12%, increase in noninterest income $107 MM, or 6%, increase in noninterest expense Credit quality $94.6 MM, or 22%, decrease in net charge-offs (NCOs) $133.5 MM, or 25%, decrease in total nonaccrual loans (NALs) 199% ACL coverage of NALs, up from 187% in 2011 2012 Full Year Highlights 5 |

| Continued customer growth and OCR (1) success Consumer checking account households 12.2% growth since 4Q11 78.3% with 4+ products or services penetration, up from 73.5% in 4Q11 Commercial relationships 9.2% growth since 4Q11 35.0% with 4+ products or services penetration, up from 31.4% in 4Q11 Capital $230 MM of trust preferred redemptions 23 MM common shares repurchased at an average price of $6.36 per share 8.76% tangible common equity ratio, up 46 bp 10.47% Tier 1 common risk-based capital ratio up 47 bp 12.01% and 14.51% Tier 1 and Total risk-based capital ratios, down 10 and 26 bp, respectively Optimal Customer Relationship 2012 Highlights (cont'd) 6 |

| Recognized as one of the Best Banks in America 2012 by MONEY Magazine(1) Ranked highest in the nation by JD Power in the Small Business Banking Satisfaction Study Completed two auto loan securitizations totaling $2.3 B in assets Integration and conversion of Fidelity Bank successfully completed $0.8 B in assets acquired and $0.8 B in liabilities assumed 37, or 6%, net new branches opened since 4Q 2011 Includes the consolidation of 32, or 5%, traditional branches (1) From MONEY Magazine, October 2012 (c) 2012 Time Inc. MONEY is a registered trademark of Time Inc. and is used under license. MONEY and Time Inc. are not affiliated with, and do not endorse products or services of, Licensee. Other Highlights 7 |

| Refer to appendix slide "Reconciliation" Delivering Positive Operating Leverage 8 |
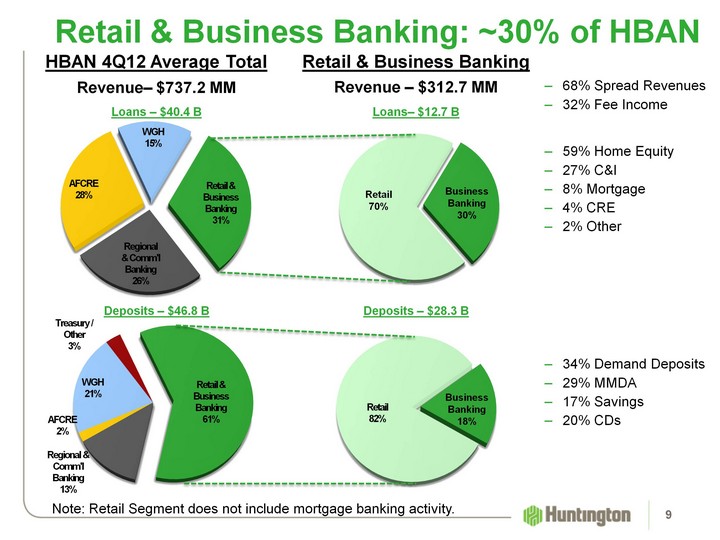
| (CHART) (CHART) (CHART) Loans - $40.4 B Loans- $12.7 B 59% Home Equity 27% C&I 8% Mortgage 4% CRE 2% Other Deposits - $46.8 B (CHART) Deposits - $28.3 B 34% Demand Deposits 29% MMDA 17% Savings 20% CDs Revenue - $312.7 MM Revenue- $737.2 MM 68% Spread Revenues 32% Fee Income HBAN 4Q12 Average Total Retail & Business Banking Retail & Business Banking: ~30% of HBAN 9 Note: Retail Segment does not include mortgage banking activity. |

| Retail Philosophy: Convenience Drives Retail Banking Source: Novantas 2012 Multi-Channel Survey, Huntington footprint states & HBAN Transaction Data What Customers Say Footprint Survey What Customers Do HBAN Transaction Data Over 65% of Huntington consumer customers have visited a branch in the last 30 days and the vast majority of customers behave as multi-channel users Heavy users of all channels (branch and remote) Generally hold larger deposit and loan balances Target for branch transaction migration as they already use remote channels today Multi- Channel 37% 60% Branch is primary channel for the majority of their service and sales interactions Value relationships with staff at the branch Branch Dominant 25% 17% Nearly all transactions are conducted virtually, through online, call center, or mobile Significantly lower cost to serve Digital Dominant 38% 23% 10 |

| Mixed Branch Only Customers Want Digital and Branches New Checking Customers Total Customer Portfolio Portfolio Portfolio Source: Novantas Analysis, Huntington Transaction Data Though digital segments will increase at the expense of branch dominant, the majority of customers prefer multi-channel convenience 11 |

| Preferred Channel by Transaction Type Sales Happen Face to Face (CHART) Source: Novantas 2012 Multi-Channel Survey, Huntington footprint states 12 Check Account Balance Research Bank Products Deposit Withdrawal Transfer Funds Pay Bills Replace a Card Resolve Issue Get Financial Advice Open New Account Mortgage Investments Insurance |

| Optimizing the Retail Network Branch, In-Store, High Function ATMs & Digital Branch, In-Store, High Function ATMs & Digital Branch, In-Store, High Function ATMs & Digital 1 2 |

| Why We Believe in In-Stores In-Store = Convenience = Acquisition Source: Huntington Transaction Data, Novantas Analysis & Opinion / Food Marketing Institute (FMI) 2012 U.S. Grocery Shopping Trends Source: Huntington Transaction Data, Novantas Analysis & Opinion / Food Marketing Institute (FMI) 2012 U.S. Grocery Shopping Trends -4% YOY 14 (CHART) +1% YOY Transactions Per Branch (000s) Industry HBAN Industry HBAN Industry HBAN Average Weekly Grocery Trips Stable to Increasing HBAN's household growth is more than offsetting the industry wide trend of declining branch transactions Grocery store foot traffic creates continued growth opportunities |

| Evolution of the In-Store Strategy Expected to be Breakeven in 2014 Expected to be Breakeven in 2014 Expected to be Breakeven in 2014 92 branches opened: 4 in 4Q10, 28 in 2011, 60 in 2012 Total in-store strategy: ~$20 MM negative PTPPI in 2012 Approximate annualized PTPPI contribution per in-store branch: ($186k) at 12 months $40k at 24 months $250k at 36 months Negative Contribution Positive Contribution 15 |
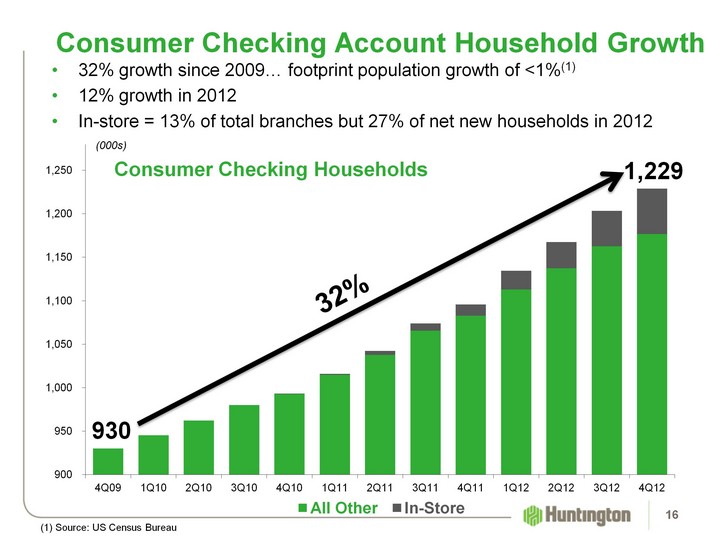
| Consumer Checking Account Household Growth (CHART) 32% growth since 2009... footprint population growth of <1%(1) 12% growth in 2012 In-store = 13% of total branches but 27% of net new households in 2012 Consumer Checking Households 32% (000s) (1) Source: US Census Bureau 16 |

| New Customers Compared to Footprint: Younger, Higher Income, More Educated Sources: www.census.gov, Acxiom demographics 17 New Traditional Branch Customers New In-Store Branch Customers |

| (CHART) Consumer Checking Household Revenue ($MM) Pre-Reg E 4Q12 exceeds pre-"Fair Play", Durbin, and Reg E levels Includes net interest income and noninterest income Post-Durbin 18 |
| Investments across all channels: Digital, ATM, traditional, & in-store Taking share by driving household growth Positive demographics with diverse mix Reduce delivery costs for services and sales Sales happen face to face Convenience Matters ... Be Where The Customers Are 19 |

| Challenge / Opportunity HBAN Economy Customer sentiment is influenced by the uncertainty in Washington Midwestern strength and soundness of HBAN strategy will drive growth. Interest Rates Prolonged low interest rate environment NIM is not expected to fall below the mid 3.30%'s. Loan Growth Economic uncertainty influenced by Washington remains a hurdle to solid loan growth C&I: continued growth - we expect growth will be more heavily weighted to the back half of the year when economic uncertainty driven by Washington is expected to be resolved. Indirect Automobile: On-balance sheet exposure is expected to increase and we anticipate two securitizations in 2013. Residential Mortgages and Home Equity: modest growth. CRE: expected to remain in the $5.0 and $5.5 B range. Noninterest Income Anticipated normalization in mortgage banking activity Continued benefits from growth in new customers, increased contribution from higher cross-sell, and the continued maturation of strategic investments. Relatively stable, excluding the impact of any automobile loan sales, any net MSR impact, and typical first quarter seasonality. Noninterest Expense At levels above our long-term expectations relative to revenue In response to changes in our economic outlook, we have moderated the pace and size of our planned investments in order to drive positive operating leverage in 2013. Credit Quality Continued improvement from current levels NCOs should approach normalized levels by the end of 2013. 2013 Expectations 20 |

| Positioned Well Relative to Peers More stable NIM & Loan Yields; Deposit Opportunity 21 (CHART) (CHART) Source: SNL Peers include ASBC, BBT, CMA, FHN, FITB, FNFG, KEY, MTB, PNC, RF, STI, & ZION. Refer to Appendix slide "Reconciliation" for purchase accounting adjustments (CHART) D bp D bp 4Q12 vs. HBAN Peer 4Q11 -22 -34 D bp D bp 4Q12 vs. HBAN Peer 4Q11 -16 -14 |

| Positioned Well Relative to Peers OCR-Driven Fee Growth, Better Fee Mix 22 (CHART) (CHART) Source: SNL Peers include ASBC, BBT, CMA, FHN, FITB, FNFG, KEY, MTB, PNC, RF, STI, & ZION. Mortgage data unavailable for ASBC (4Q12 only), CMA, KEY, PNC, & ZION. OCR & Relationship -Driven Fee Income Growth (Full Year 2012 vs. 2011): $19MM, or 8%, increase in service charges on deposits accounts $12MM, or 32%, increase in capital markets $4MM, or 2%, increase in trust and insurance $29MM, 26%, decrease in electronic banking (includes $56MM unfavorable impact from Durbin Amendment) |

| (CHART) 100 largest BHCs, ranked by assets ; data reflects 2012 vs. 2011 Source: SNL Financial, as of 2/8/13 Peer average includes ASBC, BBT, CMA, FHN, FITB, FNFG, KEY, MTB, PNC, RF, STI, and ZION. Top Quartile Second Quartile Third Quartile Bottom Quartile Best Worst Comparison of Selected Performance Metrics Among Top 100 Bank Holding Companies (1) 23 Strategy & Execution Differentiate Results |

| Important Messages Multi-year process of executing our long-term strategic plan Strategic investments added over $50 MM of pre-tax income in 2012 In-Store to be breakeven in 2014 Moderating level of investment given economic uncertainty Continuously looking for improving efficiencies / effectiveness of expenses Managing to a lower risk profile and consistent performance Opportunities exist in a low rate environment given current funding / deposit costs and relentless focus on loan yields High level of management and shareholder alignment 70% of executive team incentives are performance based Recently amended contracts to align with or exceed current best practices 50% of net equity awards must be held for duration of employment 24 |

| Use of non-GAAP financial measures This document may contain GAAP financial measures and non-GAAP financial measures where management believes it to be helpful in understanding Huntington's results of operations or financial position. Where non-GAAP financial measures are used, the comparable GAAP financial measure, as well as the reconciliation to the comparable GAAP financial measure, can be found in this document, the 2012 Fourth Quarter Performance Discussion and Quarterly Financial Review supplements, the 2012 fourth quarter earnings press release, or the Form 8-K related to this document, all of which can be found on Huntington's website at www.huntington-ir.com. Annualized data Certain returns, yields, performance ratios, or quarterly growth rates are presented on an "annualized" basis. This is done for analytical and decision-making purposes to better discern underlying performance trends when compared to full year or year-over-year amounts. For example, loan and deposit growth rates, as well as net charge-off percentages, are most often expressed in terms of an annual rate like 8%. As such, a 2% growth rate for a quarter would represent an annualized 8% growth rate. Fully-taxable equivalent interest income and net interest margin Income from tax-exempt earning assets is increased by an amount equivalent to the taxes that would have been paid if this income had been taxable at statutory rates. This adjustment puts all earning assets, most notably tax-exempt municipal securities and certain lease assets, on a common basis that facilitates comparison of results to results of competitors. Rounding Please note that columns of data in the presentation may not add due to rounding. Basis of Presentation Do we consolidate this and next slide? 25 |

| Earnings per share equivalent data Significant income or expense items may be expressed on a per common share basis. This is done for analytical and decision-making purposes to better discern underlying trends in total corporate earnings per share performance excluding the impact of such items. Investors may also find this information helpful in their evaluation of the company's financial performance against published earnings per share mean estimate amounts, which typically exclude the impact of Significant Items. Earnings per share equivalents are usually calculated by applying a 35% effective tax rate to a pre-tax amount to derive an after-tax amount, which is divided by the average shares outstanding during the respective reporting period. Occasionally, when the item involves special tax treatment, the after-tax amount is disclosed separately, with this then being the amount used to calculate the earnings per share equivalent. Pre-Tax, Pre-Provision Income One non-GAAP performance metric that Management believes is useful in analyzing underlying performance trends, is pre-tax, pre-provision income. This is the level of earnings adjusted to exclude the impact of: provision expense, which is excluded because its absolute level is elevated and volatile in times of economic stress; investment securities gains/losses, which are excluded because in times of economic stress securities market valuations may also become particularly volatile; amortization of intangibles expense, which is excluded because return on tangible common equity is a key metric used by Management to gauge performance trends; and certain items identified by Management (see Significant Items slide) which Management believes may distort the company's underlying performance trends. Basis of Presentation 26 |
| Significant Items From time to time, revenue, expenses, or taxes are impacted by items judged by Management to be outside of ordinary banking activities and/or by items that, while they may be associated with ordinary banking activities, are so unusually large that their outsized impact is believed by Management at that time to be infrequent or short term in nature. We refer to such items as "Significant Items". Most often, these Significant Items result from factors originating outside the company - e.g., regulatory actions/assessments, windfall gains, changes in accounting principles, one-time tax assessments/refunds, litigation actions, etc. In other cases they may result from Management decisions associated with significant corporate actions out of the ordinary course of business - e.g., merger/restructuring charges, recapitalization actions, goodwill impairment, etc. Even though certain revenue and expense items are naturally subject to more volatility than others due to changes in market and economic environment conditions, as a general rule volatility alone does not define a Significant Item. For example, changes in the provision for credit losses, gains/losses from investment activities, asset valuation write downs, etc., reflect ordinary banking activities and are, therefore, typically excluded from consideration as a Significant Item. Management believes the disclosure of "Significant Items", when appropriate, aids analysts/investors in better understanding corporate performance and trends so that they can ascertain which of such items, if any, they may wish to include/exclude from their analysis of the company's performance - i.e., within the context of determining how that performance differed from their expectations, as well as how, if at all, to adjust their estimates of future performance accordingly. To this end, Management has adopted a practice of listing "Significant Items" in its external disclosure documents (e.g., earnings press releases, quarterly performance discussions, investor presentations, Forms 10-Q and 10 K). "Significant Items" for any particular period are not intended to be a complete list of items that may materially impact current or future period performance. A number of items could materially impact these periods, including those described in Huntington's 2011 Annual Report on Form 10-K and other factors described from time to time in Huntington's other filings with the Securities and Exchange Commission. Basis of Presentation 27 |

| Reconciliation Significant Items Impacting Financial Performance Comparisons 28 Adjustments Related to Purchase Accounting |

| 29 |