Attached files
| file | filename |
|---|---|
| 8-K - 8-K - FLAGSTAR BANCORP INC | a8-kreportingevent.htm |
| EX-99.1 - EXHIBIT 99.1 - FLAGSTAR BANCORP INC | exhibit991.htm |

Highlights 1 • Financial performance: • Net loss applicable to common stockholders of ($94.2) million, or ($1.75) per diluted share. • Return on average assets of (2.51)% and return on average equity of (29.26)%. • Gain on loan sale income of $239.0 million. • Stable net interest income despite a smaller balance sheet. • Total provisions related to the representation and warranty reserve decreased by 75.2 percent from the prior quarter to $32.5 million. • Strengthened and de-risked the balance sheet: • Total repurchase pipeline decreased by $201.4 million from the prior quarter to $224.2 million, as the Company continued to work through the existing population of repurchase requests. • Continued to add reserves for pending and threatened litigation. • Entered into a definitive agreement to sell a substantial portion of Northeast-based commercial loan portfolio, which is expected to be capital accretive. • Non-performing loans were flat from prior quarter, but declined significantly from December 31, 2011: • Consumer non-performing loans increased by 13.4 percent from the prior quarter, driven primarily by an increase in performing nonaccrual TDRs, but declined by 19.1 percent from December 31, 2011. • Commercial non-performing loans declined by 29.5 percent from the prior quarter and 14.5 percent from December 31, 2011. 4th Quarter 2012 Earnings Presentation (1) See Non-GAAP reconciliation.

Condensed Income Statement 2 (1) The preferred stock dividend/accretion for the three months ended December 31, 2012 and September 30, 2012 and the year ended December 31, 2012, respectively, represents only the accretion. On January 27, 2012, the Company elected to defer payment of dividends and interest on the preferred stock. (2) The three months and year ended December 31, 2011 have been restated for a one-for-ten reverse stock split announced September 27, 2012 and began trading on October 11, 2012. Totals may not foot due to rounding 4th Quarter 2012 Earnings Presentation ($ in millions, except per share data) For the Year Ended Q4 2012 Q3 2012 Q42011 Dec. 31, 2012 Dec. 31, 2011 Net interest income $73.9 $73.1 $75.9 $297.2 $245.4 Provision for loan losses 50.4 52.6 63.5 276.0 176.9 Net interest income after provision for loan losses 23.6 20.5 12.3 21.2 68.4 Non-interest income 285.8 273.7 118.6 1,021.2 385.5 Non-Interest expense 398.0 233.5 205.8 990.0 634.7 Income (loss) before federal income taxes (88.6) 60.7 (74.9) 52.7 (180.7) Provision (Benefit) for federal income taxes 4.2 (20.4) 0.3 (15.6) 1.1 Net income (loss) (92.8) 81.1 (75.2) 68.4 (181.8) Preferred stock dividend/accretion (1) (1.4) (1.4) (3.0) (5.7) (17.2) Net income (loss) applicable to common stockholders ($94.2) $79.7 ($78.2) $62.7 ($198.9) Diluted Earnings (loss) per Share (2) ($1.75) $1.36 ($1.41) $0.87 ($3.62)

Summary of Financial Results 3 (1) Net servicing revenue includes net loan administration income and net gain (loss) on trading securities. (2) See Non-GAAP reconciliation. 4th Quarter 2012 Earnings Presentation ($ in millions, except per share data) For the Year Ended Q4 2012 Q3 2012 Q4 2011 Dec. 31, 2012 Dec. 31, 2011 Net Interest Income $73.9 $73.1 $75.9 $297.2 $245.4 Provision $50.4 $52.6 $63.5 $276.0 $176.9 Gain on Loan Sale $238.9 $334.4 $106.9 $990.9 $300.8 Net Servicing Revenue (1) $25.0 $11.3 $29.0 $98.0 $115.7 Net Income (Loss) Applicable to Common Shareholders ($94.2) $79.7 ($78.2) $62.7 ($198.9) Diluted Earnings / (Loss) per Share ($1.75) $1.36 ($1.41) $0.87 ($3.62) Total Assets $14,082.0 $14,899.2 $13,637.5 $14,082.0 $13,637.5 Total Stockholders' Equity $1,159.4 $1,250.6 $1,079.7 $1,159.4 $1,079.7 Book Value per Common Share $16.12 $17.76 $14.80 $16.12 $14.80 NPLs / Gross Loans HFI 7.16% 6.09% 6.94% 7.16% 6.94% NPAs / Total Assets (Bank) 3.70% 3.48% 4.43% 3.70% 4.43% ALLL / NPLs 76.28% 76.45% 65.11% 76.28% 65.11% ALLL / Gross Loans HFI 5.46% 4.65% 4.52% 5.46% 4.52% NPAs / Tier 1 Capital + Allowance for Loan Losses (2) 32.52% 30.77% 39.33% 32.52% 39.33% NPAs/ Loans HFI and Reposssed Assets 9.12% 7.77% 8.43% 9.12% 8.43% Tier 1 Capital to Adjusted Total Assets Ratio 9.26% 9.31% 8.95% 9.26% 8.95% Total Risk Based Capital Ratio 17.18% 17.58% 16.64% 17.18% 16.64% Total Equity / Total Assets 8.23% 8.39% 7.92% 8.23% 7.92%

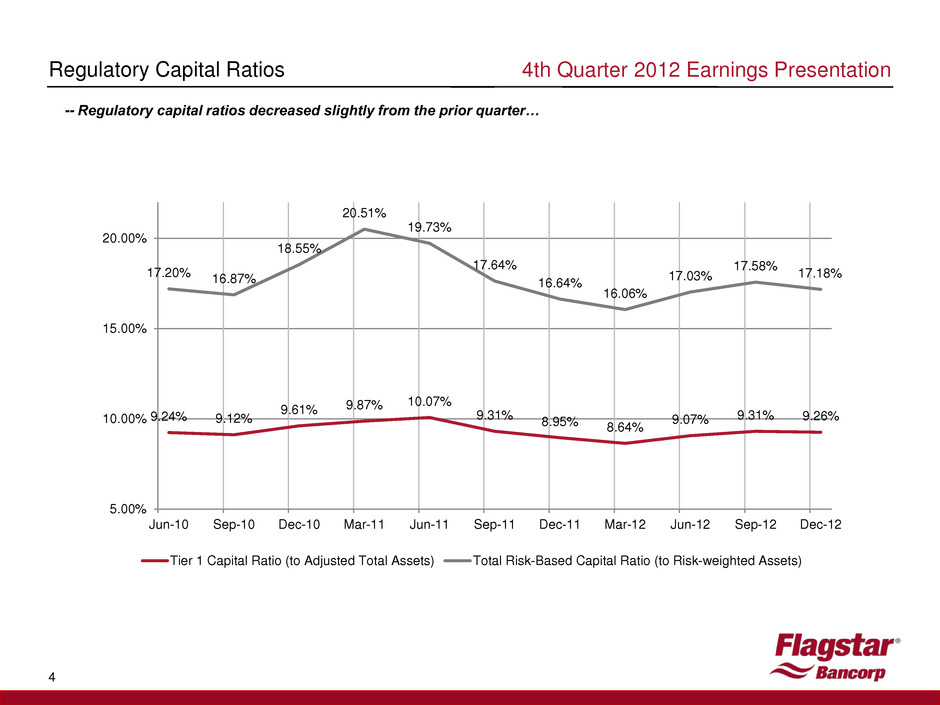
4 Regulatory Capital Ratios -- Regulatory capital ratios decreased slightly from the prior quarter… 4th Quarter 2012 Earnings Presentation 9.24% 9.12% 9.61% 9.87% 10.07% 9.31% 8.95% 8.64% 9.07% 9.31% 9.26% 17.20% 16.87% 18.55% 20.51% 19.73% 17.64% 16.64% 16.06% 17.03% 17.58% 17.18% 5.00% 10.00% 15.00% 20.00% Jun-10 Sep-10 Dec-10 Mar-11 Jun-11 Sep-11 Dec-11 Mar-12 Jun-12 Sep-12 Dec-12 Tier 1 Capital Ratio (to Adjusted Total Assets) Total Risk-Based Capital Ratio (to Risk-weighted Assets)

4th Quarter 2012 Earnings Presentation 5 Non – GAAP Reconciliation $ in millions Dec 31, 2012 Sep 30, 2012 Dec 31, 2011 Non-performing assets $520.6 $518.4 $603.1 Tier 1 Capital 1,295.8 1,379.7 1,215.2 Allowance for Loan Losses 305.0 305.0 318.0 Tier 1 Capital + Allowance for Loan Losses $1,600.8 $1,684.7 $1,533.2 Non-performing assets/ Tier 1 Capital + Allowance for Loan Losses 32.52% 30.77% 39.33% Totals may not foot due to rounding
