Attached files
| file | filename |
|---|---|
| 8-K - FORM 8-K - EVANS BANCORP INC | d485174d8k.htm |
 Sterne
Agee Financial Institutions Investor Conference
February 12-13, 2013
NYSE MKT: EVBN
Gary A. Kajtoch
Executive Vice President & CFO
David J. Nasca
President & CEO
©
2013 by Evans Bancorp
Exhibit 99 |
 ©
2013 by Evans Bancorp
Safe Harbor Statement
Safe Harbor Statement
2
This presentation includes "forward looking statements" within the meaning of
the Private Securities Litigation Reform Act of 1995. Such statements include,
but are not limited to, statements concerning future business, revenue and
earnings. These statements are not historical facts or guarantees of future
performance, events or results. There are risks, uncertainties and other
factors that could cause the actual results of the Company to differ materially
from the results expressed or implied by such forward-looking statements.
Information on factors that could affect the Company's business and results is
discussed in the Company's periodic reports filed with the Securities and
Exchange Commission. Forward looking statements speak only as of the date
they are made. The Company undertakes no obligation to publicly update or
revise forward looking information, whether as a result of new, updated
information, future events or otherwise. |
 ©
2013 by Evans Bancorp
Recent Price
$17.15
52 week range
$12.90-18.70
Market
Capitalization
Total Shares Outstanding
4.17 million
Ownership
–
Insider
5.9%
Institutional
32.2%
3
Dividend Yield
2.8%
Total Assets
$809.7 million
Total
Gross
Loans
(excluding
Leases)
$581.3 million
Total Deposits
$679.0 million
Total Common Equity
$ 74.8 million
Tangible Book Value
$15.92
Evans Bancorp, Inc.
Evans Bancorp, Inc. (NYSE MKT: EVBN)
Market data as of February 06, 2013 (Source: Bloomberg); Financial data as of
December 31, 2013; Ownership as of most recent filing
$71.3
million
Community-based financial services company
Provides banking, insurance and investment services in WNY
Relationship-focused organization; serves as a trusted advisor
Easy to interact with; an excellent work environment for top talent
|
 ©
2013 by Evans Bancorp
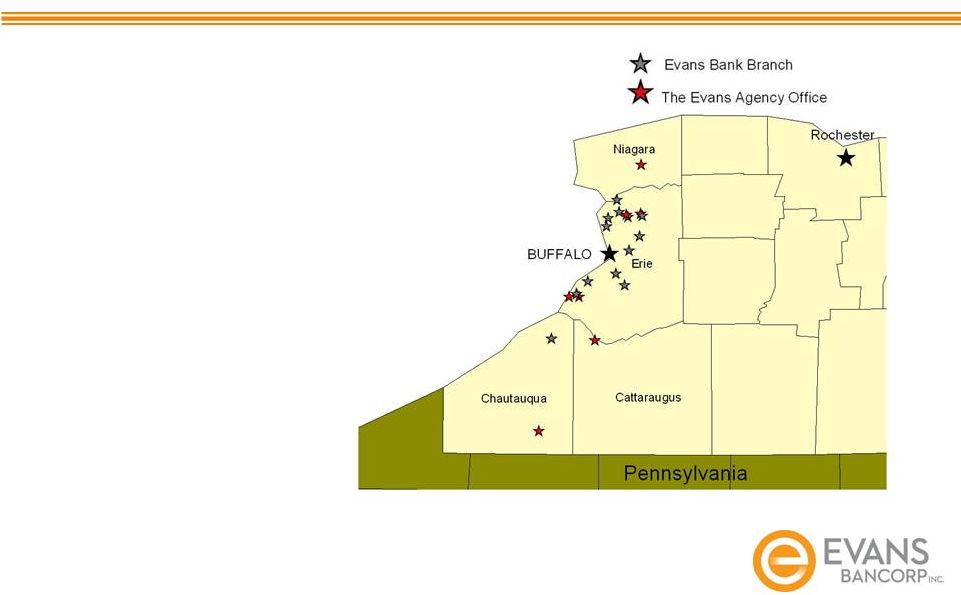
Geographic Reach
Geographic Reach
As of December 31, 2012
Evans Established: 1920
Bank Branches: 13
Insurance Agency Locations: 7
|
 ©
2013 by Evans Bancorp
Diversified Financial Services Company
Diversified Financial Services Company
5
Diversified Revenue Sources
2012: $40.6 million
Approximately 32% of
revenue from non-interest
sensitive relationships
Significant insurance agency
presence in WNY
Focus on commercial
lending and portfolio
diversification
68%
17%
15%
Net Interest Income
Insurance & Investment Services Fee Income
Other Non-interest Income |
 Organic
Growth
Scalable
Organization
Capital
Sufficiency
Commercial
Portfolio
Branding
Talent
Management
Non-Interest
Income Focus
Foundation for Growth
Foundation for Growth
6
©
2013 by Evans Bancorp |
 ©
2013 by Evans Bancorp
Market Strategies
Market Strategies
Laser-focused upon WNY market
Proactive customer acquisition and sales efforts
Loan portfolio diversification leads the way
Alternative channels: Strong web presence, mobile banking and first to
market with remote deposit capture
Incent value-added and solution-based cross-sales and referrals
Optimize fee-based solutions to deepen customer profitability and loyalty
Significant presence, involvement and visibility as a community partner
Operational Excellence:
Ease of access and doing business = outstanding customer experience
Opportunistic Acquisitions
7 |
 ©
2013 by Evans Bancorp
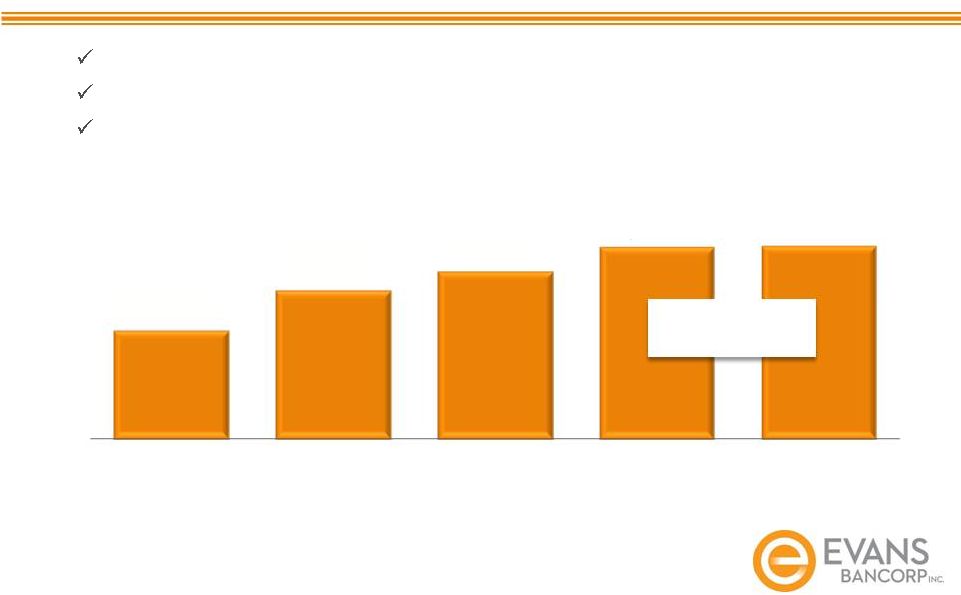
8
Successful Performance
Successful Performance
($ in millions)
Expanded asset base through organic loan growth and acquisition
Increased future earnings power potential
Assets expanded 83% since restructuring balance sheet in 2007
11.2% CAGR
(2008 –
2012)
Asset growth of 53%
$529.0
$619.4
$671.5
$740.9
$809.7
2008
2009
2010
2011
2012 |
 ©
2013 by Evans Bancorp
Source: FDIC, as of June
30, 2011 and 2012
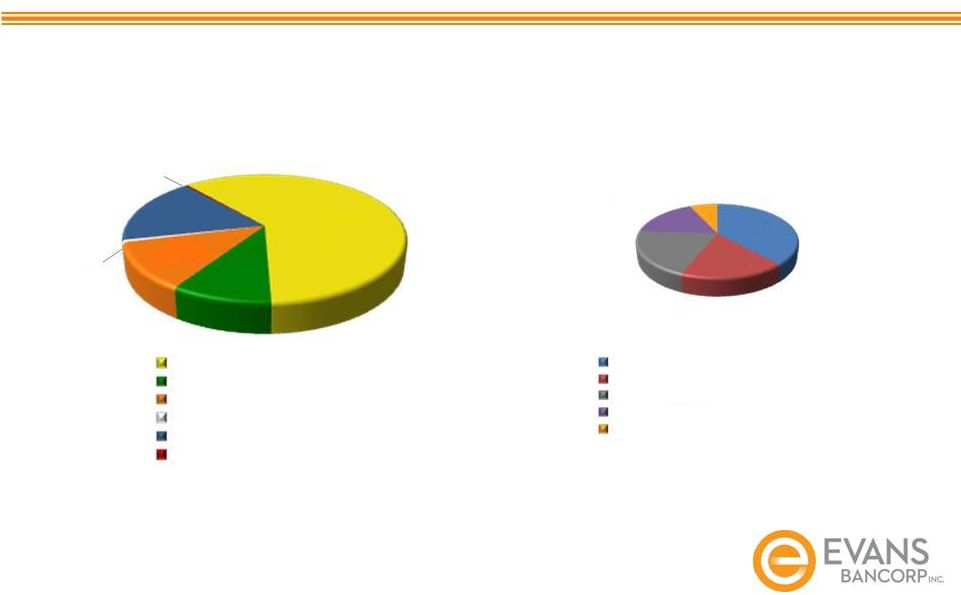
Opportunity for Expansion
Opportunity for Expansion
9
Market Share by Deposits
$26.2B Total Deposits
HSBC
19.6%
M&T
39.0%
Key
Bank
9.6%
First
Niagara
15.8%
Evans
2.1%
Citizens
5.3%
Bank of
America
4.43%
All
Others
4.3%
2012
$32.3B Total Deposits
HSBC
8.8%
M&T
42.7%
Key
Bank
8.3%
First
Niagara
26.2%
Evans
1.9%
Citizens
4.6%
Bank of
America
3.8%
All
Others
3.7%
2011
1.1%
1.5%
1.7%
2.1%
1.9%
2008
2009
2010
2011
2012 |
 Financial Highlights
and Results
©
2013 by Evans Bancorp |
 ©
2013 by Evans Bancorp
Core Banking: Loan Growth
Core Banking: Loan Growth
11
High quality in-market commercial loans
Capturing strong credits from larger banks
Supports core business strategy
($ in millions)
$349.1
$458.1
$512.5
$577.4
$581.3
2008
2009
2010
2011
2012
13.6% CAGR
(2008 –
2012) |
 ©
2013 by Evans Bancorp
As of December 31, 2012
Diverse Loan and Lease Portfolio
Diverse Loan and Lease Portfolio
* Includes construction loans
Commercial Loans
Total Loans and Lease Portfolio:
$582.9 million
12
60.5%
9.7%
11.8%
0.6%
17.1%
0.3%
Commercial Mortgages*
Home Equities
Residential Mortgages*
Consumer
Commercial & Industrial
Leases
38.4%
17.6%
20.2%
17.0%
6.8%
Non-owner occupied CRE
Owner occupied CRE
C&I
Multi-family
Construction / Land Development |
 ©
2013 by Evans Bancorp
13
NPAs to Total Loan + OREO
* Peer data per SNL
Booking high quality
assets
Solid underwriting
discipline
Strong customer
relationships
EVBN
(GAAP) Banks > $500 Million and < $1 Billion in Assets*
0.89%
2.65%
2.64%
2.60%
1.41%
0.00%
1.00%
2.00%
3.00%
4.00%
5.00%
6.00%
2008
2009
2010
2011
2012
1.11%
EVBN without
ENL & WVB
Asset Quality
Asset Quality
- Evans National Leasing
ENL
-
Waterford Village Bank (FDIC assisted acquisition) WVB |
 ©
2013 by Evans Bancorp
14
Conservative Credit Quality
Conservative Credit Quality
Allowance for Loan Loss / Non-Accruals
Q4 2012
* Peer data per SNL
Allowance to
Loan Ratio
(as of 12/31/2012)
1.67%
** Allowance for ENL: $47 thousand; Allowance for WVB: $119 thousand
118.3%
154.1%
96.1%
EVBN (GAAP)
EVBN with ENL & WVB**
Banks <$1B*
-
Evans National Leasing
ENL
-
Waterford Village Bank (FDIC assisted acquisition) WVB |
 ©
2013 by Evans Bancorp
Q4 2012 Non-Performing Loans by Portfolio
($ in millions)
15
Asset Quality
Asset Quality
NPL Ratios by Portfolio
$1.4
$4.3
$0.7
$0.6
$0.9
$0.04
Residential Mortgage (2.12%)
Commercial & Multi-Family (1.33%)
Construction (2.45%)
Home Equity (1.10%)
Commercial Loans (0.91%)
Consumer (1.36%) |
 ©
2013 by Evans Bancorp
16
Low Cost Core Deposits
Low Cost Core Deposits
($ in millions)
13.9% CAGR
(2008 –
2012)
13.4% increase since December 31, 2011 in regular savings, demand deposits
and NOW deposits
Deposit Composition:
$679.0 million
$404.0
$499.5
$544.5
$616.2
$679.0
2008
2009
2010
2011
2012
56.1%
16.0%
27.9%
Savings & Money Market
Time Deposits
Demand & NOW |
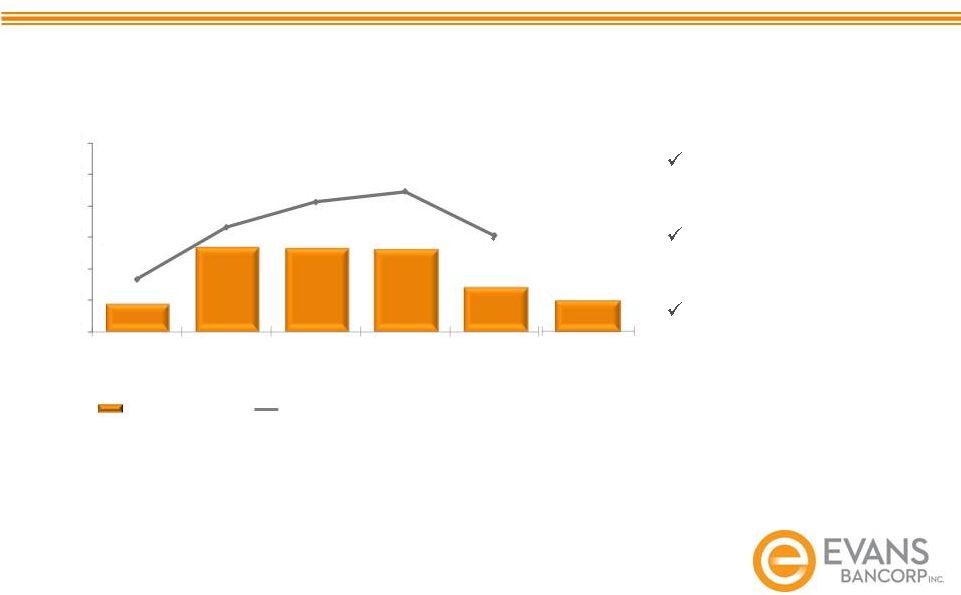
 ©
2013 by Evans Bancorp
* Excludes $0.7 million gain on bargain purchase
17
Strong Margins and Revenue Growth
Strong Margins and Revenue Growth
Net Interest Margin
Comparison
Q4 2012
Revenue
* Peer data per SNL
**Q4 Net Interest Margin includes loan prepayment fees.
Q4 2012 NIM excluding these fees equals 3.69%.
($ in millions)
$30.9
$36.0
$37.1
$38.4
$40.6
2008
2009*
2010
2011
2012
7.1% CAGR
(2008
–
2012)
3.78%
3.66%
Banks <$1B*
EVBN** |
 ©
2013 by Evans Bancorp
18
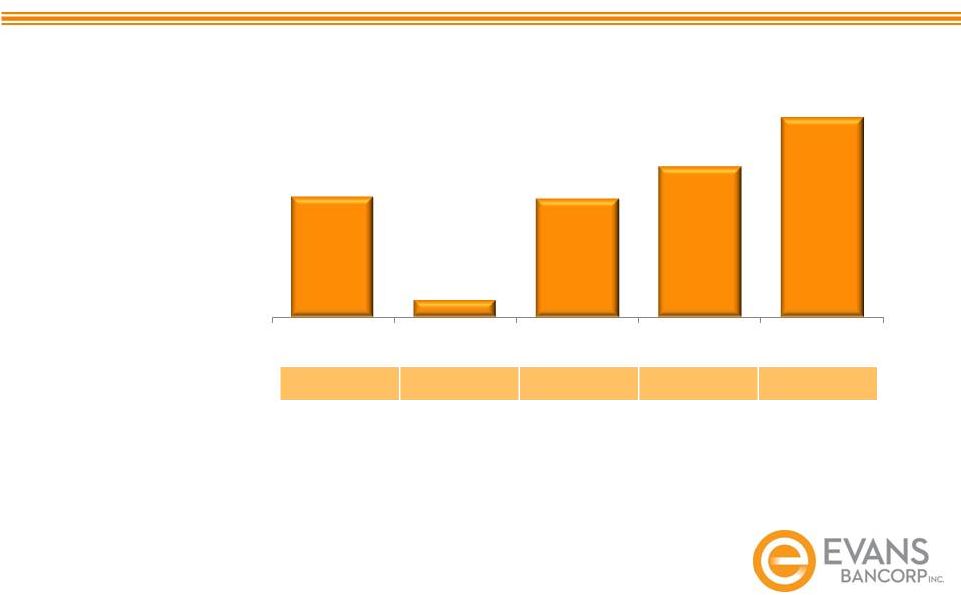
Fee income less rate sensitive
Capitalize on relationship management
Insurance 54% of 2012 non-interest income
Focusing on growing commercial lines
2.3% CAGR
(2008 –
2012)
Non-Interest Income
Non-Interest Income
* Excludes $0.7 million gain on bargain purchase.
($ in millions)
$11.7
$13.4
$12.6
$12.4
$12.8
2008
2009*
2010
2011
2012 |
 ©
2013 by Evans Bancorp
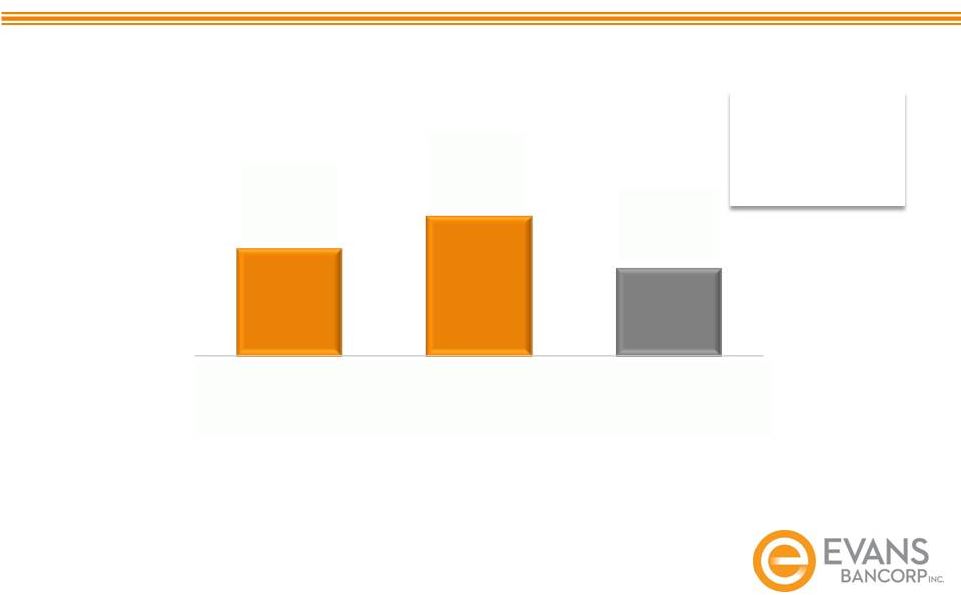
Bottom-line Results
Bottom-line Results
($ in millions)
Net Income
$ 1.78
$ 0.25
$ 1.34
$ 1.49
$ 1.95
Earnings Per Share
*
(diluted)
* 2009 and 2010 EPS include leasing losses of $(1.35) and $(0.09),
respectively 19
$4.9
$0.7
$4.8
$6.1
$8.1
2008
2009*
2010*
2011
2012 |
 ©
2013 by Evans Bancorp
Fourth
Fourth
Quarter
Quarter
2012
2012
–
–
Core Business Strength
Core Business Strength
($ in millions, except per share data; % y-o-y)
Net Interest Income
Non-Interest Income
Non-Interest Expense
Net Income
Earnings Per Share
(diluted)
20
Increased
3.0%
Increased
14.7%
Increased
1.9%
Increased
58.6%
Increased
56.1%
$7.1
$3.3
$7.2
Q4 2012
Q4 2012
Q4 2012
$2.1
Q4 2012
$0.51
Q4 2012 |
 ©
2013 by Evans Bancorp
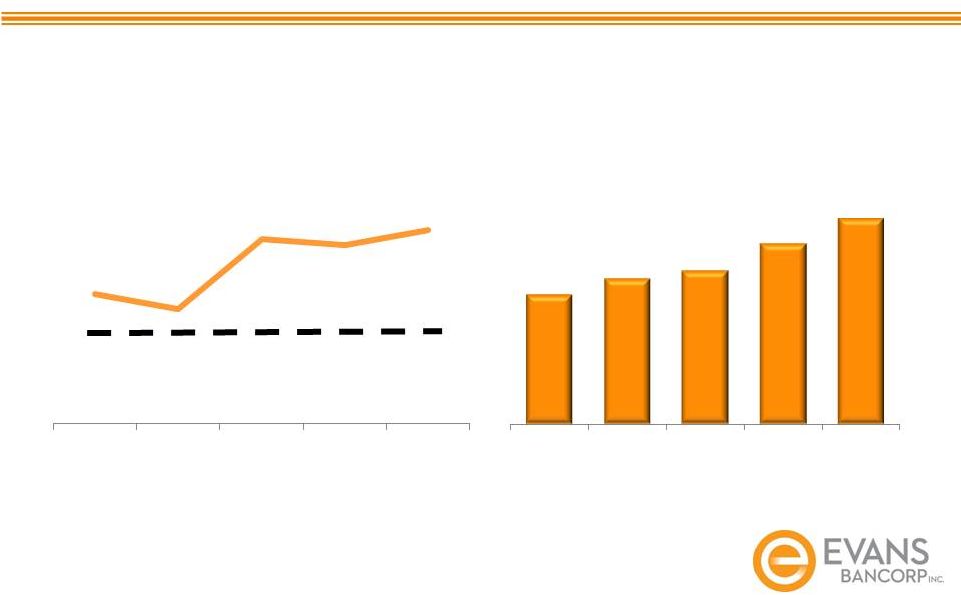
10% Regulatory guideline
Tangible Book Value
Building Return on Capital
Building Return on Capital
21
11.8%
11.2%
14.3%
14.0%
14.7%
2008
2009
2010
2011
2012
$11.90
$12.72
$13.18
$14.60
$15.92
2008
2009
2010
2011
2012
Total Risk Based Capital |
 Driving Growth
Managing Risk
©
2013 by Evans Bancorp |
 23
©
2013 by Evans Bancorp
Why Growth is Important
Why Growth is Important
Competitive Pressures
Margin Compression
Regulatory Burden Expansion
Requirements for Increased Capital |
 ©
2013 by Evans Bancorp
Opportunity: Organic and Human Capital
24
Market Disruption Created Opportunity
Market Disruption Created Opportunity |
 ©
2013 by Evans Bancorp
EVBN outperformed
Local Banks & High
Performing Peer
groups since 1/1/12
Stock Market Performance
Stock Market Performance
25
44%
EVBN
(through 2/6/2013)
EVBN
SNL Bank
High Performing Peers
Local
-3%
2%
7%
12%
17%
22%
27%
32%
37%
42%
47%
Dec-11
Feb-12
Apr-12
Jun-12
Aug-12
Oct-12
Dec-12 |
 ©
2013 by Evans Bancorp
Investment Highlights
Investment Highlights
26
Diverse revenue mix, strong operating fundamentals
Strong and growing franchise in WNY
Sophisticated / experienced management team
Solid capital base
Quality core deposit growth
Low risk balance sheet
Shareholder return orientation
Historically reasonable valuation |
 NYSE
MKT: EVBN Sterne Agee Financial Institutions
Investor Conference
February 12-13, 2013
©
2013 by Evans Bancorp |
 Supplemental Information
©
2013 by Evans Bancorp |
 ©
2013 by Evans Bancorp
Executive Compensation
Base Salary :
–
Benchmarked against peer group
–
Scope and complexity of position
–
Market value of job
–
Level of expertise
–
Performance in position
–
Company performance factors
Short-Term Cash Incentives:
–
Performance compared to financial, operational and strategic goals
–
Based on net income threshold
–
Individual performance and attainment of assigned goals
Long-Term Equity Incentives:
–
Aligns interests of participants and shareholders
–
Focuses on Company performance over a longer period of time
–
Stock options and restricted stock
29 |