Attached files
| file | filename |
|---|---|
| 8-K - FORM 8-K - Ameris Bancorp | d483284d8k.htm |
 Exhibit 99.1 |
 2
Cautionary Statements
This presentation contains certain performance measures
determined by methods other than in accordance with accounting
principles generally accepted in the United States of America
(“GAAP”). Management of Ameris Bancorp (the “Company”) uses
these non-GAAP measures in its analysis of the Company’s
performance. These measures are useful when evaluating the
underlying performance and efficiency of the Company’s operations
and balance sheet. The Company’s management believes that these
non-GAAP measures provide a greater understanding of ongoing
operations, enhance comparability of results with prior periods and
demonstrate the effects of significant gains and charges in the
current period. The Company’s management believes that investors
may use these non-GAAP financial measures to evaluate the
Company’s financial performance without the impact of unusual
items that may obscure trends in the Company’s underlying
performance. These disclosures should not be viewed as a
substitute for financial measures determined in accordance with
GAAP, nor are they necessarily comparable to non-GAAP
performance measures that may be presented by other companies.
Tangible common equity and Tier 1 capital ratios are non-GAAP
measures. The Company calculates the Tier 1 capital using current
call report instructions. The Company’s management uses these
measures to assess the quality of capital and believes that investors
may find them useful in their evaluation of the Company. These
capital measures may, or may not be necessarily
comparable to similar capital measures that may be presented by other
companies.
This presentation may contain statements that constitute
“forward-looking statements” within the meaning of
Section 27A of the Securities Act of 1933, as amended, and
Section 21E of the Securities Exchange Act of 1934, as
amended. The words “believe”, “estimate”, “expect”,
“intend”, “anticipate” and similar expressions and variations
thereof identify certain of such forward-looking statements, which
speak only as of the dates which they were made. The
Company undertakes no obligation to publicly update or revise
any forward-looking statements, whether as a result of new
information, future events or otherwise. Readers are cautioned
that any such forward-looking statements are not guarantees
of future performance and involve risks and uncertainties and
that actual results may differ materially from those indicated in
the forward-looking statements as a result of various factors.
Readers are cautioned not to place undue reliance on these
forward-looking statements and are referred to the Company’s
periodic filings with the Securities and Exchange Commission
for a summary of certain factors that may impact the
Company’s results of operations and financial condition.
|
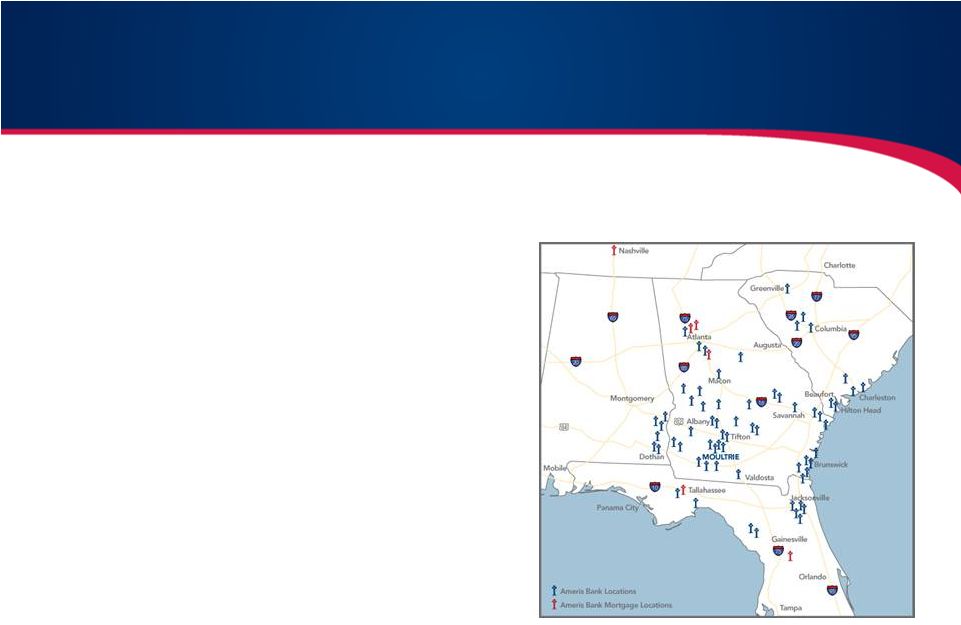 •
Headquartered in Moultrie, Georgia
•
Founded in 1971 as American Banking
Company
•
Historically grown through acquisitions of
smaller banks in areas close to existing
operations
•
Recent growth through de novo expansion
strategy and 10 FDIC-assisted transactions
•
Four state footprint with 66 offices
•
Approximately 740 FTEs managing 200,000
core customer accounts (132 FTEs in Ameris Bank
Mortgage)
•
Assets –
$3.0 billion
Loans –
$2.0 billion
Deposits –
$2.6 billion
Corporate Profile
3 |
 4
Management and Board Ownership of Approximately 7%
Experienced Management Team
Name, Position
Experience
(Banking / Ameris)
Previous Experience
Edwin W. Hortman Jr.
Chief Executive Officer
32/14
Colony Bankcorp, Inc.
Andrew B. Cheney
EVP & Chief Operating Officer
36/3
Barnett Bank, Mercantile Bank
Dennis J. Zember
Jr.
EVP & Chief Financial Officer
19/7
Flag Financial Corporation
Jon S. Edwards
EVP & Chief Credit Officer
28/13
NationsBank, Federal Reserve
Stephen A. Melton
EVP, Chief Risk Officer
32/2
Columbus Bank & Trust
(lead bank SNV)
Cindi H. Lewis
EVP, Chief Administrative Officer
36/36
Officer at Ameris Bank since 1987
T. Stan Limerick
EVP, Chief Information Officer
7/1
Whitney National Bank |
 5
Current Focus
Realize
the
positive
impacts
of
our
Earnings
Strategies
•
Continue to drive double digit growth in loans and low-cost/no-cost funding.
•
Design and implement strategies to build more efficient banking platform. Rationalize
branch network and position Bank for faster growth in assets.
•
quartile of our peer group. Leverage premier mortgage platform for better
profitability. •
Recognize a reduction in credit related expenses commensurate with the significant reduction
in classified and non-accrual assets.
Position
Ameris
Bank
as
a
Consolidator
in
our
4
Southeastern
States
•
of potential deals. Interest in both Strategic (builds market share) and Financial
(builds excess TCE and T1 capital).
•
thinly capitalized institutions.
Continue
Improving
Credit
Quality
•
Continue to manage strategies that restore historic quality to our Balance Sheet.
•
Reduce credit-related operating expenses incrementally throughout 2013.
Traditional
M&A
–
Early
stages
of
a
growing
pipeline
of
opportunities
in
our
footprint
on
larger,
–
Slowing
pipeline
of
opportunities
but
our
markets
still
have
majority
Build
additional
non-interest
income
lines
of
businesses
to
drive
revenue
towards
the
top
FDIC
Assisted
acquisitions |
 6
(1)
Excludes covered assets, where applicable
Fourth Quarter Update
dollars in millions, except per share data
Q4 '11
Q1 '12
Q2 '12
Q3 '12
Q4 '12
Change
BALANCE SHEET
Assets
$2,994
$3,043
$2,920
$2,949
$3,008
0.47
%
Loans, net
1,868
1,949
1,941
2,015
2,007
7.44
Tang Common Equity / Assets
7.96%
7.95%
8.41%
8.27%
8.23%
3.39
Tangible Book Value
$10.06
$10.15
$10.29
$10.23
$10.39
3.28
PERFORMANCE
Pre-tax, pre-credit earnings
$15,030
$13,634
$14,700
$13,728
$13,728
(8.66)
%
as a percentage of average assets
2.01%
1.84%
1.99%
1.86%
1.83%
Revenue (ex acquisition gains)
$35,259
$34,954
$37,756
$38,069
$40,672
15.35
as a percentage of average assets
4.71%
4.59%
5.17%
5.16%
5.41%
OPEX (ex credit costs)
$20,926
$21,507
$23,200
$25,104
$24,993
19.44
as a percentage of average assets
2.80%
2.83%
3.18%
3.41%
3.32%
Diluted earnings per share
0.01
0.19
0.07
0.04
0.15
> 100%
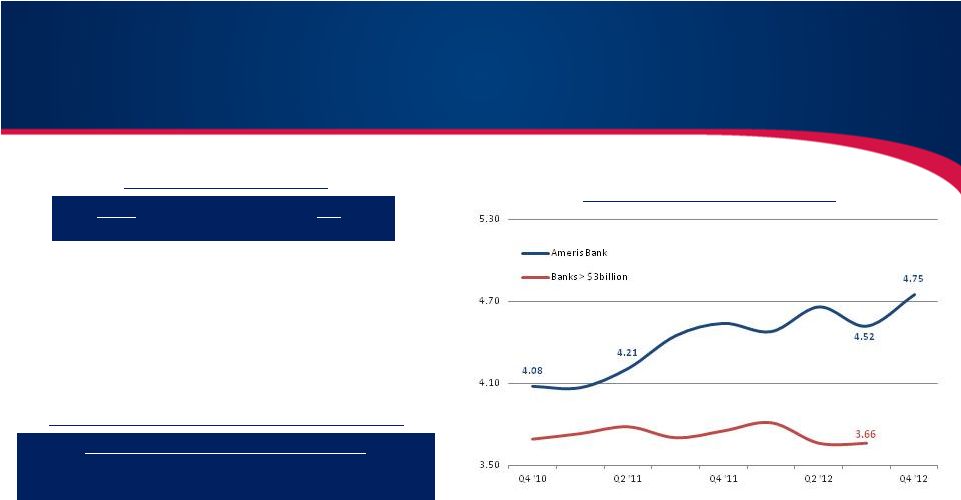
Net interest margin (TE)
5.21 %
4.48 %
4.66 %
4.52 %
4.72 %
(9.40)
Efficiency ratio (ex credit costs)
59.35%
61.53%
61.45%
75.68%
65.70%
10.71
CREDIT QUALITY
(1)
NPAs / Assets
4.05%
3.03%
2.89%
2.58%
2.61%
(35.56)
%
Classified Assets / Capital
43.93
35.07
32.05
31.44
33.45
(23.86)
Reserves / Loans
2.64
2.17
1.92
1.80
1.63
(38.26)
Reserves / NPLs
49.64
54.90
58.98
67.76
60.67
22.22 |
 •
Diversified loan portfolio across five regions
–
Inland Georgia –
51%
–
Coastal Georgia –
15%
–
Alabama –
8%
•
In-house lending limit of $7.5 million versus $75 million legal limit
–
5 loans greater than $5 million
•
Loan participations less than 1.00% of total loans
•
Aggressive management of concentrations of credit
•
Top
25
relationships
are
only
9.6%
of
total
loans
7
–
South Carolina –
13%
–
Florida –
13%
Loan Type
Average Loan
Size
Average Rate
Investor CRE
$ 425,335
5.15 %
C&D
100,350
5.25
Residential
71,248
5.64
C&I
59,384
4.98
O/O CRE
306,921
5.50
Covered loans
143,720
6.68
1
Consumer
6,579
6.56
Agriculture
110,196
5.70
Total
$ 80,464
5.44 %
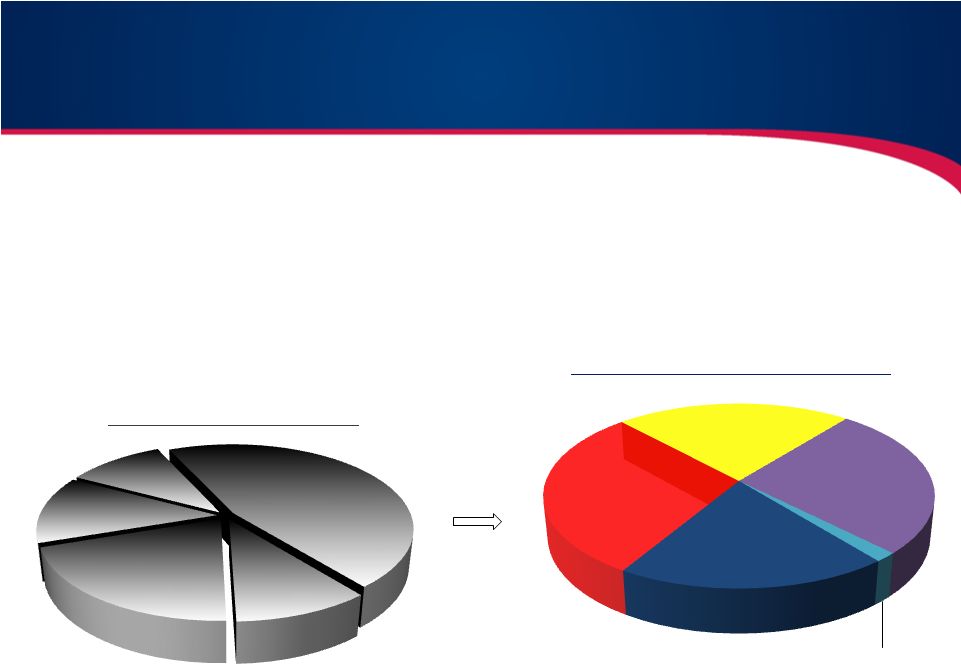
Loan Portfolio Detail
Loan Portfolio Detail –
12/31/12
1 –
Average Rate on covered loans includes accretable yield.
Agriculture
9%
C&I
7%
Construction
6%
Non-owner
occupied CRE
15%
Owner
Occupied CRE
15%
Consumer
Installment &
Residential
20%
Covered
28% |
 •
Leveraging presence in new markets (top five
markets account for 70% of pipeline: Atlanta,
Jacksonville, Columbia, Savannah, Charleston
•
Upgrading production positions in key markets:
limited changes to expense base but higher levels
of quality production
•
Expanding Mortgage Strategy: Jumbo mortgages,
wholesale, warehouse LOC
•
Expanding
Agricultural
expertise:
better
yields
than in CRE due to limited competition
•
Yields on current production approximately
5.11%
•
2/3
rds
of production is with existing customers –
higher rates (40bps-50bps from relationships)
•
Diversified
loan
types
–
not
solely
chasing
CRE
or competing with low rates that do not
compensate for term or quality
8
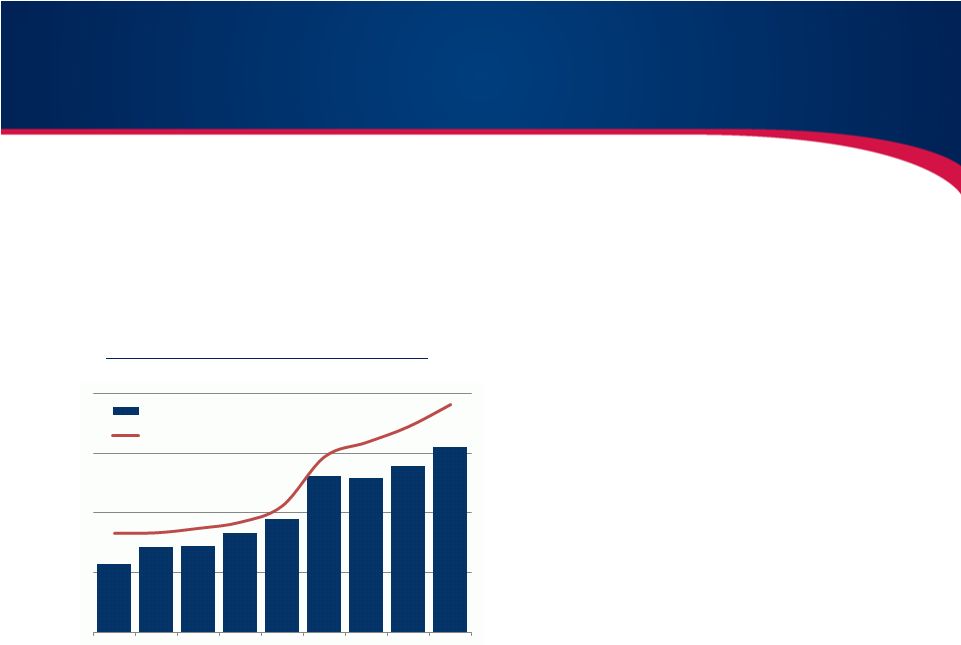
Loan Portfolio –
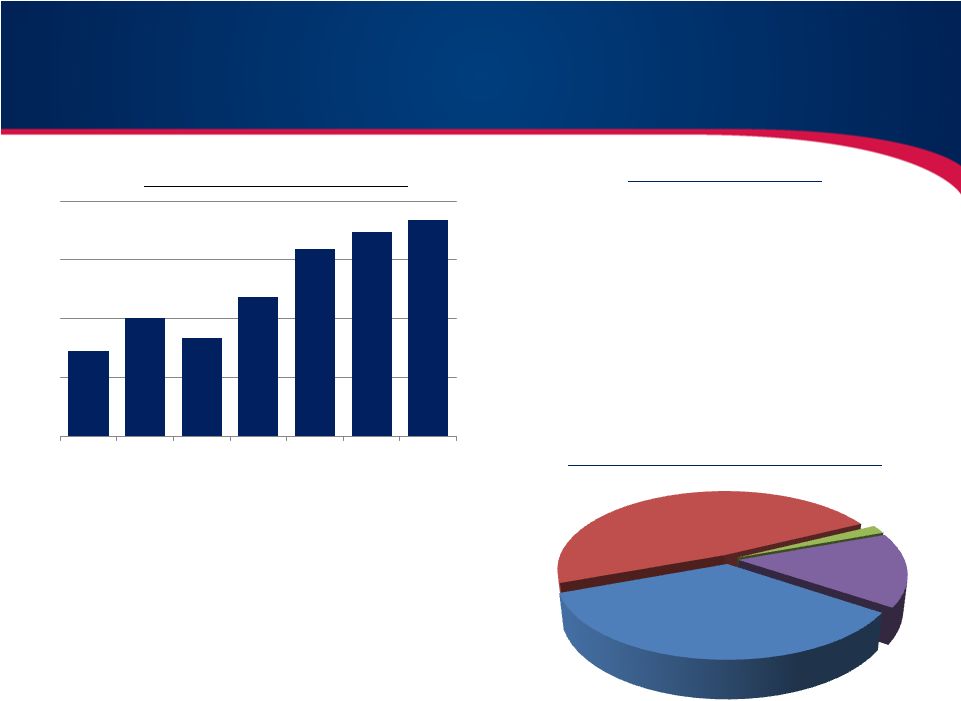
strong loan pipelines
Lending
Strategies
Pipeline
Opportunities
by
Type
1 –
Loan pipeline amounts consist of all loans management has deemed a 75% or better likelihood of
closing. $57.9
$80.8
$67.2
$95.0
$127.4
$139.0
$147.2
$0
$40
$80
$120
$160
2Q 11
3Q 11
4Q 11
1Q 12
2Q 12
3Q 12
4Q 12
Loan Pipeline EOQ (in millions)
Comm'l, Finc'l
& Agriculture,
34.9%
Commercial
R/E, 48.3%
Construction,
1.8%
Residential
R/E, 15.0%
Growth in Loan Pipelines
1 |
 9
•
$11.5 million
-
Largest Relationship has over 3.0x debt coverage, backed by taxing authority of one of
our local markets.
•
1.75x
–
Weighted average debt coverage of our 25 largest relationships.
•
64% -
Weighted average loan to value on our 25 largest relationships.
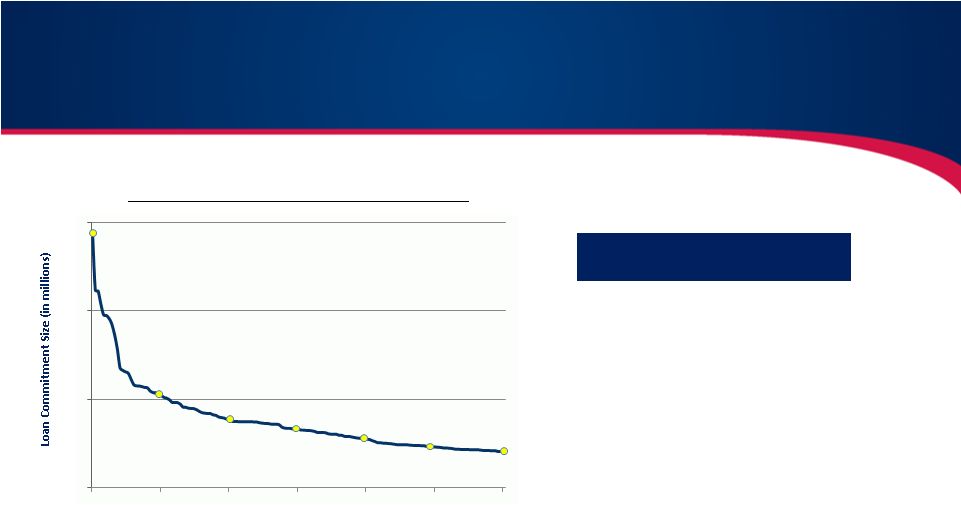
Loan Portfolio
Diversified through smaller relationships as well
Portfolio
comprised
of
smaller
relationships
Relationship
Totals
in
Legacy
Portfolio
(in
millions)
Rank
Total O/S
% of total
Top 10
$ 81.81
5.64%
Top 50
$ 242.53
16.72%
Top 100
$ 376.12
25.93%
Top 200
$ 544.95
37.57%
Top 300
$ 659.13
45.44%
$11.53
$4.23
$3.11
$2.24
$1.69
$0
$4
$8
$12
25
50
75
100
125
150
Number of Loan Relationships |
 10
•
29.2%
-
Growth rate in Non-interest Bearing Demand during last 12 months
•
68.0%
-
Percentage of deposits in retail oriented transaction style accounts
•
98.0%
-
Percentage
of
Bank’s
total
funding
through
deposits
that
“walks
through
our
front
doors”
(4Q
‘12)
“Zero”
cost deposits include non-interest bearing checking, NOW accounts and Savings accounts that
cost less than 0.25% and are deemed to have very little sensitivity to changing interest
rates.. Significant Value in Deposit Portfolio
Low cost funding for loan growth
“Zero”
Cost
Deposits
–
12/31/12
•
M&A -
Focused on Acquiring / retaining
high quality deposit portfolios that will
drive our rate sensitive deposits below 50%
•
Low
or
No
Premium
-
Current
market
undervalues low-cost deposits (as seen in
deposit premiums)
•
Investment
-
Coupling
these
low
cost,
less
sensitive balances with asset production
efforts produces expanding margin
opportunity.
$630
$685
$688
$734
$779
$922
$916
$958
$1,021
26%
16.0%
24.0%
32.0%
40.0%
$400
$600
$800
$1,000
$1,200
4Q 10
1Q 11
2Q 11
3Q 11
4Q 11
1Q 12
2Q 12
3Q 12
4Q 12
Non-Rate Sensitive Deposits
% of total deposits |
 11
•
$0.44 per share –
Additional earnings embedded in today’s Balance Sheet vs. 2008.
Today’s deposit mix would have reduced interest expense by 30% in 2008, or $16.0
million. •
Built significant value in our core deposit base
•
Focused largely on “Non-Rate Sensitive”
deposits
Significant Value in Deposit Portfolio
Future revenue opportunity is large, and growing
Deposit Composition –
12/31/12
Deposit
Composition
–
12/31/08
DDA, 10%
NOW &
Savings, 20%
MMDA, 13%
Brokered,
10%
Retail Time,
46%
DDA, 19%
NOW &
Savings, 29%
MMDA, 23%
Retail Time,
27%
Brokered, 2% |
 Slower
Growth
in
Total
Assets
Will
Support
Expansion
of
TCE
/
TA
ratio
12
•
Current Strategy and earnings forecasts afford
significant expansion in capital ratios as the
balance sheet efforts are focused on “re-mixing”
asset mix more so than “growing”
total assets
•
EPS upside from successful redeployment is
approximately $0.65 per share.
•
Adds asset sensitivity protection in rising rate
scenarios.
Capital Growth
–
Expansion/Remix of Total Assets
Tangible
Common
/
Tangible
Assets
•
Strong capital ratios supported by high PTPP
earnings
•
Anticipate repaying remaining portions of TARP
before rate adjustment in Feb 2014.
•
Consider re-instituting cash dividend with
continued growth in earnings, capital ratios and
preferred redemptions.
7.35%
7.51%
7.78%
7.96%
7.99%
7.95%
8.41%
8.27%
8.20%
5.00%
7.00%
9.00%
4Q 09
1Q 10
2Q 10
3Q 10
4Q 10
1Q 11
2Q 11
3Q 11
4Q 11
Redeploy into Traditional
E/A mix
Balance
(000’s)
Type of low yielding asset
$78,735
Legacy NPAs
88,273
Covered OREO
198,440
Covered NPLs
159,724
FDIC receivable
110,217
S/T assets
$635,389
Total Low Yielding Assets |
 13
FDIC Indemnification Asset
Managing towards the end of loss share protection
1-
Months remaining to collect remainder of indemnification asset is a weighted average based on
the indemnification asset at 12/31/2012.
2 -
Current
Estimate
of
losses
includes
all
losses
incurred
to
date
as
well
as
reimbursable expenses
plus expected losses not incurred for which there is a corresponding indemnification
asset. Bank
Acquisition
Date
Original
Indemnification
Asset (000's)
Current
Indemnification
Asset (000's)
% of Original
Indem
Asset
Remaining
Months remaining
to collect
remainder
Original Estimate
of Total Losses
(000's)
Current Estimate
of Total
Losses
(
000's)
Current
Losses as a % of
Original
American United
Oct-09
24,200
2,157
8.9%
20.9
30,250
13,815
45.7%
United Security
Nov-09
21,640
2,068
9.6%
21.9
27,050
34,564
127.8%
Satilla Comm
May-10
22,400
3,547
15.8%
27.9
28,000
25,031
89.4%
First Bank Jax
Nov-10
11,307
5,801
51.3%
33.9
14,134
10,803
76.4%
Tifton Banking
Dec-10
22,807
5,972
26.2%
34.9
28,509
27,098
95.1%
Darby B&T
Dec-10
112,404
37,305
33.2%
34.9
160,577
144,747
90.1%
High Trust
Jul-11
49,485
16,482
33.3%
41.8
61,856
52,439
84.8%
One Georgia
Jul-11
45,488
15,601
34.3%
41.8
56,860
37,875
66.6%
Central Bank Ga
Feb-12
52,664
30,324
57.6%
48.9
65,830
47,630
72.4%
362,395
119,255
32.9%
39.6
473,066
394,002
83.3%
2
of
Estimate
1 |
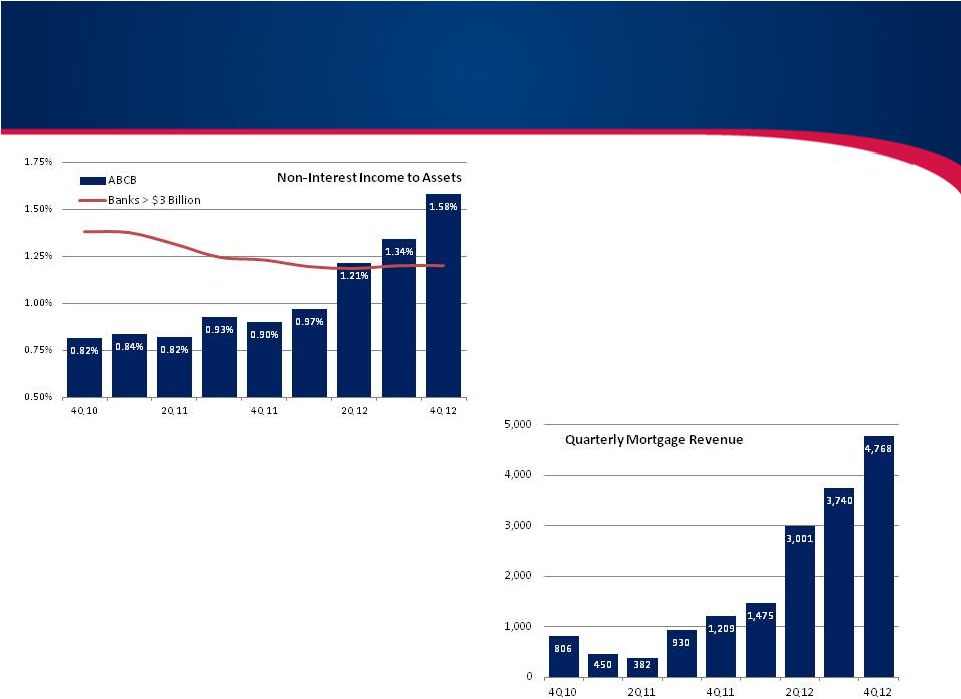
 Revenue
growth through this cycle with opportunistic strategies:
•
>30% -
CGR for mortgage related
revenue
•
>21% -
CGR for debit interchange
fees
•
>8% -
CGR for analysis and
overdraft fees
•
2012
revenue
gains
boosted
by
growing
loan
portfolio
and
success
in
non-
interest income strategies.
•
2013-2015 strategy demands:
•
Diversification of revenue with more emphasis on highly profitable
non-interest income LOB’s that enhance ROA and reduce burden on
capital leverage
•
Protect our advantage from strong net interest margins with emphasis on
creating a highly favorable funding mix
14
Earnings –
Continued Growth in Revenue
•
16.5%
compounded
annual
growth
rate
in
total
revenue over the last three years
•
Revenue has grown faster than earning assets
•
Significant amount of assets that will be deployed
over the next 3 years that will significantly boost
revenue and earnings |
 15
(1)
Maturity and Repricing Opportunity are amounts and yields maturing in the designated
quarter (2)
Ameris Bank net interest margin on a fully taxable-equivalent basis, excludes H/C level
TRUPs .
Loans
CDs
Quarter
Yield
Quarter
Yield
Q3 '11
5.62%
Q3 '11
0.96%
Q4 '11
5.38%
Q4 '11
0.67%
Q1 '12
5.48%
Q1 '12
0.65%
Q2 '12
5.45%
Q2 '12
0.54%
Q3 '12
5.28%
Q3 '12
0.51%
Q4 '12
5.11%
Q4 '12
0.44%
Upcoming
Maturities
and
Expected
Renewals:
Quarter
Loans -
Balance
Maturing
Yield
Quarter
CDs -
Balance
Maturing
Cost
Q1 '13
$ 122,174
5.69%
Q1 '13
$ 186,092
0.70%
Q2 '13
$ 91,862
5.63%
Q2 '13
$ 177,081
0.69%
•
79.6% of lost revenue from loan repricing covered by CD renewal savings.
•
Management expects limited dilution (5-10bps) in NIM from balance sheet repricing and
believes volume expansion can more than offset revenue impacts.
Earnings -
Net Interest Margin
Net
Interest
Margin
(2)
(%)
Maturity
&
Repricing
Opportunity
(1)
“Acquisition Yields” |
 •
Still hiring highly experienced, high volume teams
•
Current retail production is $30mm per month, potential
and platform to double in 12-18 months
Started wholesale activities in 2Q 2012
•
Hiring experienced relationship managers from large
wholesale players
•
Larger volume opportunity in wholesale relative to retail
activities
16
Serious about building strength and diversification in non-
interest income sources
•
Moving away from deposit charges
•
Researching unique lines of business
•
Momentum in our numbers coming from mortgage
revenue; we believe we can duplicate that strategy
with other LOBs by hiring expertise
Peer group comparison are banks greater than $3 billion
•
BOLI income expected to incr by $1mm in 2013
Earnings –
Non-Interest Income
–
Significant
growth
in
mortgage
revenue
currently
all
from
retail
activities |
 17
Earnings -
Corporate Restructure & Improved Efficiency
Details regarding the recently announced Corporate Restructuring:
Closing 20% of our retail branch locations, either in smaller markets or areas where our
market share is not sufficient to drive desired profitability.
“At-risk”
loans and non-CD deposits in these branches are $59.4 million and $104 million. We
expect to retain 71% of the loans and 35% of the deposits.
Total OPEX for these 13 branches in 2012 were $6.45 million. Non-interest income
totaled $1.39 million. Total expected improvement in operating expenses is $4.9
million in 2013 and $6.5 million in 2014.
Restructuring sales and sales efforts in the bank to focus on larger, longer tenured
commercial clients Expected savings of $3.6 million resulting mainly from consolidation
of 50 positions. Re-distributing certain clerical & support functions to the
field Restructuring credit administration and approval process to streamline approval
and support of smaller credits.
Expected savings of $2.4 million resulting mainly from consolidation of 38 positions.
Branch Rationalization –
Restructuring line divisions –
Re-distribution of corporate functions – |
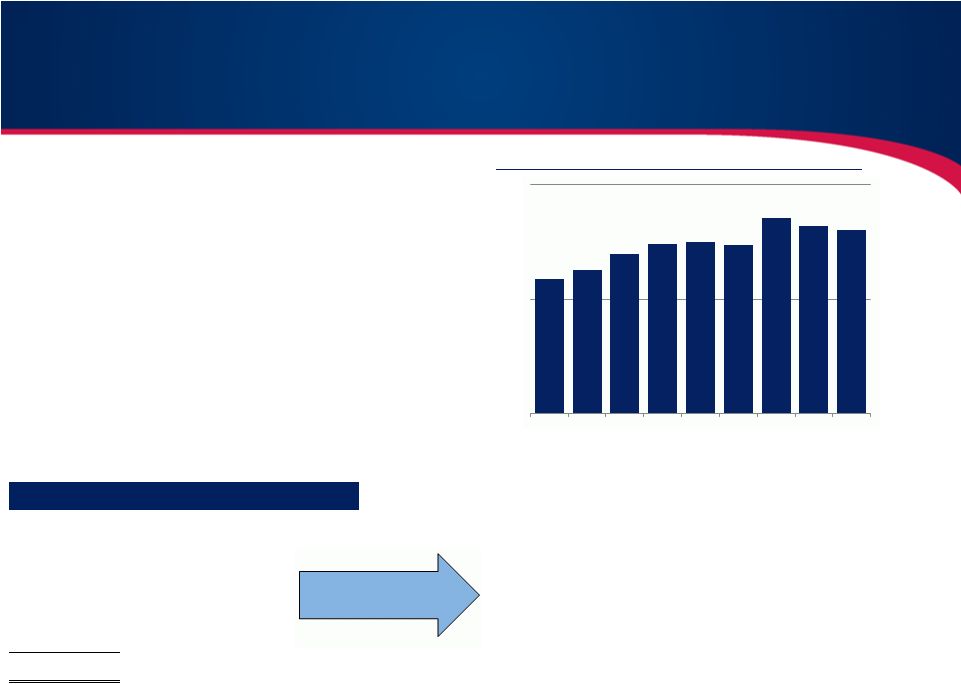
 •
Improvement driven by heavy
spending that is not anticipated in
coming years:
•
NPLs down 60% from their peak levels over
in 2Q ’10
•
Risk in remaining assets much better than
24 -36 months ago when appraisal updates
showed significant devaluation.
•
Anticipate continued reduction in NPAs but
at slower pace during 2013.
18
Trends in NPA’s
Year
Credit Costs
(000's)
Net C/O's
2010
69,536
3.33%
2011
58,083
2.23%
2012
54,224
2.76%
2013 should benefit from significant improvement in 2012
Credit Quality
$92
$88
$79
$68
$61
$59
$70
$52
$44
$38
$39
$41
$49
$52
$57
$59
$51
$47
$37
$36
$37
$40
0
25
50
75
100
Q2 '10
Q4 '10
Q2 '11
Q4 '11
Q2 '12
Q4 '12
NPLs
OREO |
 19
M&A Opportunities
(Significant opportunity building in our 4-State Footprint)
Seasoned
acquirer
–
Ameris
Bank
has
completed
29
M&A
Ameris Bank is positioned to capitalize on an
anticipated consolidation in the Southeast:
Excellent reputation with regulatory authorities
Strong
capital
position
–
Parent
capital
structure
is
mostly
Strong
core
earnings
supports
capital
expansion
without
public market access –
median analyst earnings estimates
for the next 24 months indicate TCE growth of 24% and an
expansion of the TCE/TA ratio to 9.31%.
common (82%), with Total tier 1 leverage of 10.4%.
strong reputation with regulatory decision makers for
management during recent downturn, operating trends,
execution of multiple strategies, speed at integrating M&A
opportunities.
transactions since 1980, including 10 failed bank transactions
that increased our core assets by approximately 50%.
595
–
Banks headquartered in our four states
564
–
Number of banks smaller than Ameris Bank
The Numbers indicate Consolidation is necessary:
–
23%
–
banks
without
adequate
capital
to
grow
(less than 8% leverage)
24%
–
banks
that
still
have
serious
credit
issues
(Texas Ratios over 75%)
31%
–
banks
without
enough
earnings
to
recapitalize themselves
(2012 ROAA of less than 0.25%)
54%
–
banks
without
the
right
operating
efficiency
to survive this low margin environment
(efficiency ratios still over 75%) |
 |