Attached files
| file | filename |
|---|---|
| 8-K - 8-K - ACCURIDE CORP | a13-4975_18k.htm |
Exhibit 99.1
|
|
BB&T Capital Markets Transportation Conference February 13, 2012 |

|
|
Forward Looking Statements Statements contained in this disclosure that are not purely historical are forward-looking statements within the meaning of Section 27A of the Securities Act of 1933, as amended, and Section 21E of the Securities Exchange Act of 1934, as amended, including statements regarding Accuride’s expectations, hopes, beliefs and intentions with respect to future results. Such statements are subject to the impact on Accuride’s business and prospects generally of, among other factors, market demand in the commercial vehicle industry, general economic, business and financing conditions, labor relations, governmental action, competitor pricing activity, expense volatility and other risks detailed from time to time in Accuride’s Securities and Exchange Commission filings, including those described in Item 1A of Accuride’s Annual Report on Form 10-K for the fiscal year ended December 31, 2011. Any forward-looking statement reflects only Accuride’s belief at the time the statement is made. Although Accuride believes that the expectations reflected in these forward-looking statements are reasonable, it cannot guarantee its future results, levels of activity, performance or achievements. Except as required by law, Accuride undertakes no obligation to update any forward-looking statements to reflect events or developments after the date of this news release. 2 |
|
|
1. Strengthen Organization 2. Fix Gunite Business 3. Strengthen Steel Wheel Business 4. Grow Aluminum Wheel Business 5. Pursue Strategic Opportunities 3 Accuride Top Five Priorities |
|
|
Business Summary: Uncompetitive Approximately 27 percent of Accuride consolidated revenues <5% Adjusted EBITDA >50,000 units past due to customers; 6-8 week lead times Three manufacturing facilities with old, uncompetitive equipment Per customers, had become uncompetitive in regards to quality, delivery, cost “Bare bones” leadership and technical teams Option One: Fix Upgrade leadership team Address commercial issues Invest capital of $45-55 million Re-establish quality systems Reduce manufacturing footprint Initiate cost-reduction programs Fix scheduling & ERP systems Regain customer confidence Option Two: Divest or Exit One-time charge >$100 million Cash outlay including pensions and other post-employment benefits >$50 million Gunite Situation – Early 2011 4 Fixing the business was the clear choice |
|
|
Phase 1: Commercial Activity Ongoing AM & OES OEM Phase 2: Operational Stabilization 95% Complete Upgrade Organization Fix Scheduling & Inventory Systems Re-establish Quality Systems Improve daily production Reduce cost structure Phase 3: Machining and Assembly Investment 85% Complete Drum Machining (2Q/3Q12) Slack Assembly (3Q12) Hub Machining (4Q12/1Q13) Mothball Elkhart and Brillion Machining facilities (1Q13) Phase 4: Foundry and Facility Improvements 80% Complete Repair/Upgrade Rockford foundry Re-establish control of casting processes Gunite “Fix & Grow” Plan Update Two-year “Fix & Grow” Restructuring Plan on track operationally 5 |
|
|
Gunite Drum Machining 6 The last Bullard...... New Machine Line |
|
|
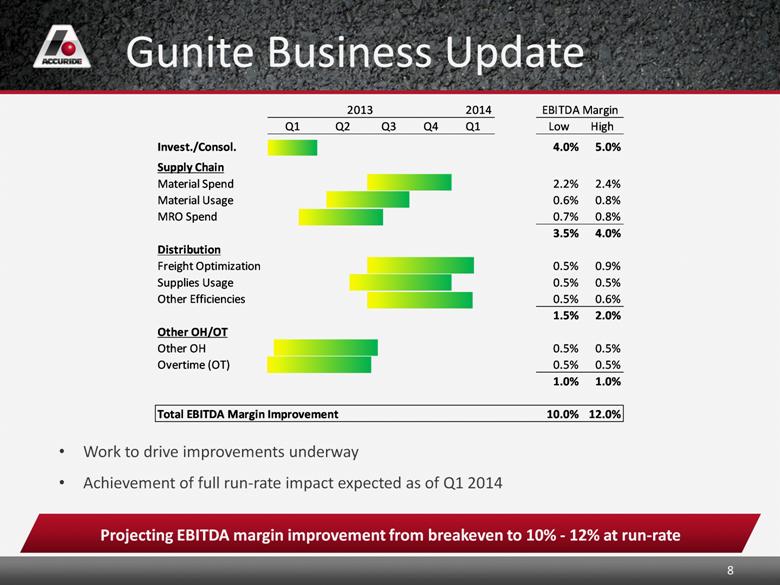
7 Gunite Business Update Cost reductions are projected to improve margins by 10 to 12 pts. Cost Reduction Initiatives Established a focused strategy to drive towards Adjusted EBITDA margins of 10% to 12% Targets include: Supply chain savings of 3.5 to 4 margin pts. Distribution efficiencies of 1.5 to 2 margin pts. Other OH and OT savings of 1 margin pt. Total margin improvement off of post-consolidation base (~4.5%) of another 5.5 to 7.5 margin pts. |
|
|
8 Gunite Business Update Work to drive improvements underway Achievement of full run-rate impact expected as of Q1 2014 Projecting EBITDA margin improvement from breakeven to 10% - 12% at run-rate 2013 2014 EBITDA Margin Q1 Q2 Q3 Q4 Q1 Low High Invest./Consol. 4.0% 5.0% Supply Chain Material Spend 2.2% 2.4% Material Usage 0.6% 0.8% MRO Spend 0.7% 0.8% 3.5% 4.0% Distribution Freight Optimization 0.5% 0.9% Supplies Usage 0.5% 0.5% Other Efficiencies 0.5% 0.6% 1.5% 2.0% Other OH/OT Other OH 0.5% 0.5% Overtime (OT) 0.5% 0.5% 1.0% 1.0% Total EBITDA Margin Improvement 10.0% 12.0% |
|
|
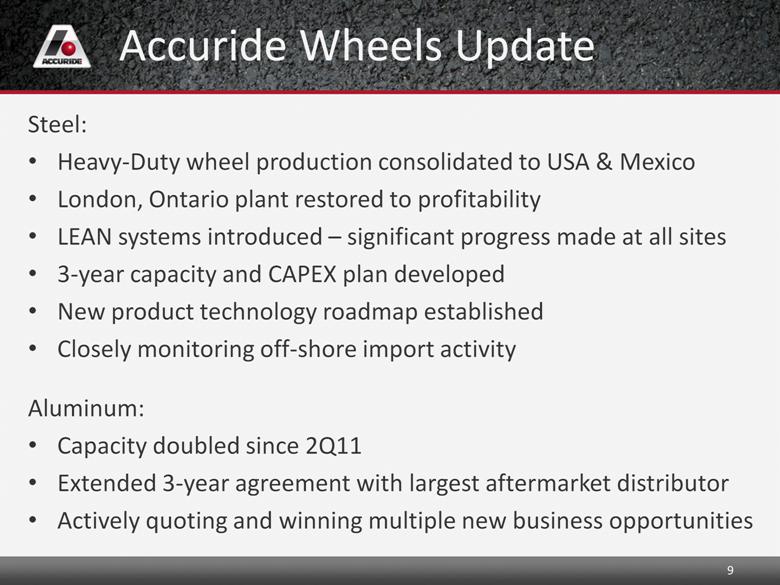
Steel: Heavy-Duty wheel production consolidated to USA & Mexico London, Ontario plant restored to profitability LEAN systems introduced – significant progress made at all sites 3-year capacity and CAPEX plan developed New product technology roadmap established Closely monitoring off-shore import activity Aluminum: Capacity doubled since 2Q11 Extended 3-year agreement with largest aftermarket distributor Actively quoting and winning multiple new business opportunities Accuride Wheels Update 9 |
|
|
Old Sales Model (Push Product) Accuride OEM Aftermarket Fleets 10 Focus was on selling to OEMs and Distributors |
|
|
Fleets Continuing to call on OEMs and Distributors Regional Sales Force and Accuride Executives now call on fleets directly to have them specify Accuride products on their equipment and component buys New Sales Model (Pull Through) Accuride OEM Aftermarket 11 Fleets Spec Products New sales model and focus is driving results! |
|
|
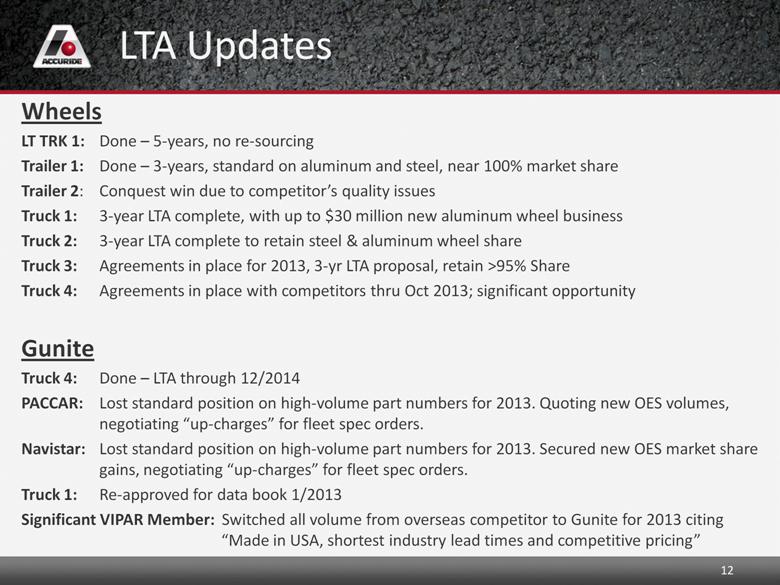
Wheels LT TRK 1: Done – 5-years, no re-sourcing Trailer 1: Done – 3-years, standard on aluminum and steel, near 100% market share Trailer 2: Conquest win due to competitor’s quality issues Truck 1: 3-year LTA complete, with up to $30 million new aluminum wheel business Truck 2: 3-year LTA complete to retain steel & aluminum wheel share Truck 3: Agreements in place for 2013, 3-yr LTA proposal, retain >95% Share Truck 4: Agreements in place with competitors thru Oct 2013; significant opportunity Gunite Truck 4: Done – LTA through 12/2014 PACCAR: Lost standard position on high-volume part numbers for 2013. Quoting new OES volumes, negotiating “up-charges” for fleet spec orders. Navistar: Lost standard position on high-volume part numbers for 2013. Secured new OES market share gains, negotiating “up-charges” for fleet spec orders. Truck 1: Re-approved for data book 1/2013 Significant VIPAR Member: Switched all volume from overseas competitor to Gunite for 2013 citing “Made in USA, shortest industry lead times and competitive pricing” LTA Updates 12 |
|
|
2012 Preliminary Results Takeaway 2012 results in line with previous guidance 13 $ Millions 2012 Guidance 2012 Full Year Net Sales $900 - $925 $929.8 Adjusted EBITDA $60 - $65 $63.4 Free Cash Flow $(40) - $(35) $(31.2) Year-end liquidity $66.1 Note: 2012 results are unaudited |

|
|
2013 Class 8 Build Projections Sources: ACT, FTR 14 Accuride’s 2013 plan will trend with FTR’s more conservative forecast 2013 FTR 52,300 60,800 62,100 64,800 2013 ACT 58,305 66,006 68,506 71,506 264,323 |
|
|
Strategic Objectives Accuride Vision: Accuride will be the premier supplier of wheel-end system solutions to the global commercial vehicle industry #1-2 globally in wheel-end systems ROIC > 20% through a cycle >80% of revenue from CORE products Balanced geographical revenues: 40% North America 30% Asia 20% Europe 10% South America >25% of annual revenues from new & evolutionary products >95% retention of personnel Maximize ACW share price OUR FOCUS 15 |
|
|
Accuride Wheels business is in great shape for industry upturn: Adequate capacity to meet industry demand - Steel & Aluminum Wheel LTAs and new business pending Gunite operational turn-around almost complete: ~ $35M CAPEX invested in business Improved operating performance: 95% on time delivery; 1-2 week lead times (shortest in industry) <50 PPM past six months (world class levels) Drum Machining & Slack Assembly lines installed and launched Consolidation of hub machining operations complete Headcount reduction of over 290 positions by 1Q13 Significant upgrade to casting operations and facility; more to do in ’13-14 Targeting EBITDA margins of 10 to 12% at $180 to $220 million revenue Non-Core Assets – multiple options under consideration Accuride “Fix & Grow” Summary Takeaway 2-year “Fix & Grow” restructuring plan on track operationally 16 |
|
|
Questions |

|
|
Appendix |

|
|
Preliminary Net Income to Adjusted EBITDA Reconciliation Takeaway 19 Note: Preliminary 2012 results are unaudited & do not include any potential impact from ongoing impairment analysis |