Attached files
| file | filename |
|---|---|
| 8-K - 8-K - ACCURAY INC | a13-4092_28k.htm |
| EX-99.2 - EX-99.2 - ACCURAY INC | a13-4092_2ex99d2.htm |
Exhibit 99.1
|
|
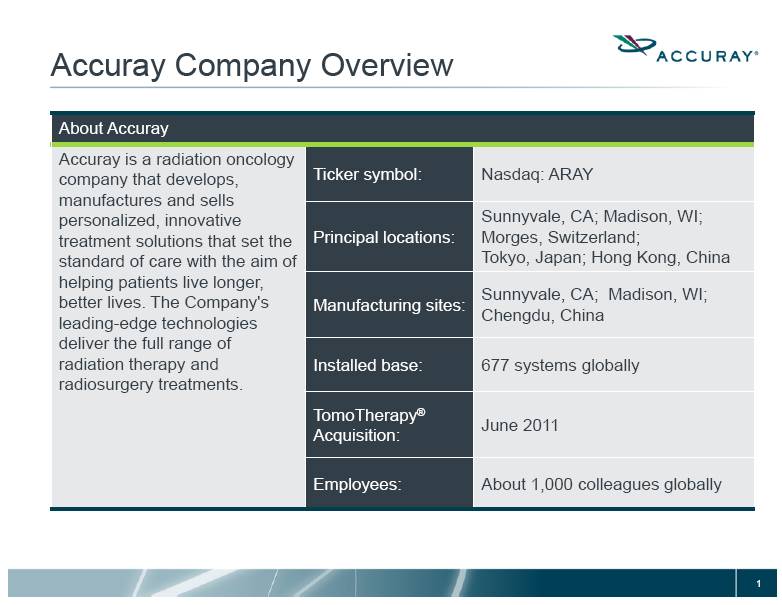
Accuray Company Overview About Accuray Accuray is a radiation oncology company that develops, manufactures and sells personalized, innovative treatment solutions that set the standard of care with the aim of helping patients live longer, better lives. The Company's leading-edge technologies deliver the full range of radiation therapy and radiosurgery treatments. Ticker symbol: Nasdaq: ARAY Principal locations: Sunnyvale, CA; Madison, WI; Morges, Switzerland; Tokyo, Japan; Hong Kong, China Manufacturing sites: Sunnyvale, CA; Madison, WI; Chengdu, China Installed base: 677 systems globally TomoTherapy® Acquisition: June 2011 Employees: About 1,000 colleagues globally |
|
|
Safe Harbor Statement Forward Looking Statement Statements in this presentation (including the oral commentary that accompanies it) that are not statements of historical fact are forward-looking statements and are subject to the "safe harbor” provisions of the Private Securities Litigation Reform Act of 1995. Forward-looking statements in this presentation relate, but are not limited, to the company’s future order growth, revenue growth, and sustained profitability; anticipated trends in gross margins and operating expenses; as well as impact of release of new technologies. Forward-looking statements are subject to risks and uncertainties that could cause actual results to differ materially from expectations, including but not limited to: the extent of market acceptance for the company’s products and services; the company’s ability to develop and bring to market new or enhanced products; the company’s ability to convert backlog to revenue; the success of its worldwide sales and marketing efforts; continuing uncertainty in the global economic environment; and other risks detailed from time to time under the heading "Risk Factors" in the company’s report on Form 10-K for fiscal 2012 filed September 10, 2012, our Form 10-Qs filed on November 8, 2012, and February 6, 2013, and as updated from time to time in our other filings with the Securities and Exchange Commission. Forward-looking statements speak only as of the date the statements are made and are based on information available to the company at the time those statements are made and/or management’s good faith belief as of that time with respect to future events. The company assumes no obligation to update forward-looking statements to reflect actual performance or results, changes in assumptions or changes in other factors affecting forward-looking information, except to the extent required by applicable securities laws. Accordingly, investors should not put undue reliance on any forward-looking statements. |
|
|
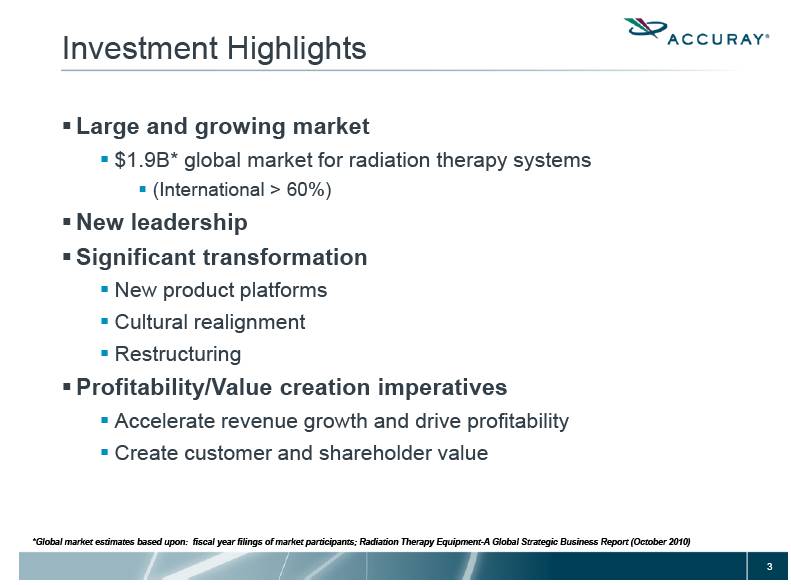
Large and growing market $1.9B* global market for radiation therapy systems (International > 60%) New leadership Significant transformation New product platforms Cultural realignment Restructuring Profitability/Value creation imperatives Accelerate revenue growth and drive profitability Create customer and shareholder value Investment Highlights *Global market estimates based upon: fiscal year filings of market participants; Radiation Therapy Equipment-A Global Strategic Business Report (October 2010) |
|
|
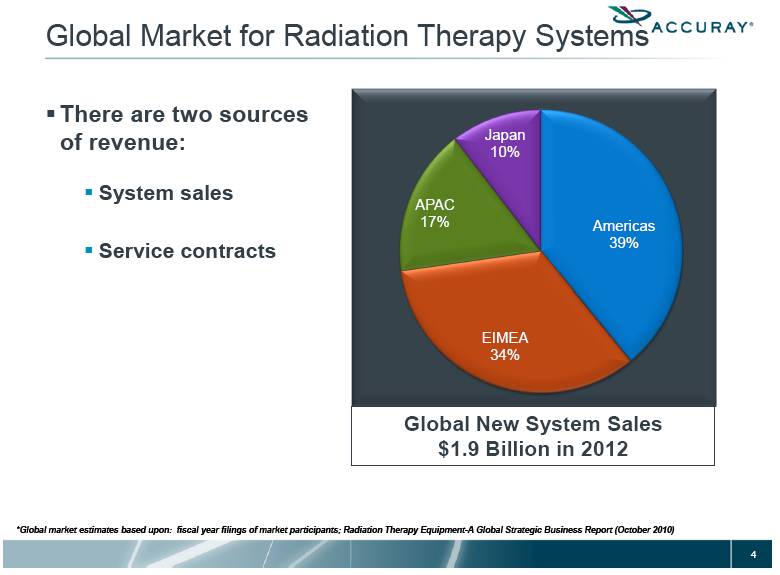
Global Market for Radiation Therapy Systems Global New System Sales $1.9 Billion in 2012 *Global market estimates based upon: fiscal year filings of market participants; Radiation Therapy Equipment-A Global Strategic Business Report (October 2010) There are two sources of revenue: System sales Service contracts |
|
|
Accuray in Transition Past: Technology and R&D focus Features and capabilities limited our products to niche market segments Future: Customer focus Prioritize and enable commercial strategy The new TomoTherapy® product portfolio enables access to mainstream market The new CyberKnife® with MLC option expands functionality and broadens patient treatment universe Technology and R&D – Strategic focus |
|
|
Strategic Imperatives New Product Cycle – Greatly Expands Market Opportunity TomoTherapy® New TomoTherapy® H™ Series capabilities transitions product from niche position to mainstream CyberKnife® New CyberKnife® M6™ Series is the premier solution for full-body radiosurgery plus expanded range of treatable patients Improve Sales & Marketing Execution Demonstrate enhanced value proposition of new models for customers Focus resources on downstream marketing to support field sales Improve selling processes and management Restructuring Right-size operating expenses Reinvest in key commercial activities to position the company to accelerate revenue growth |

|
|
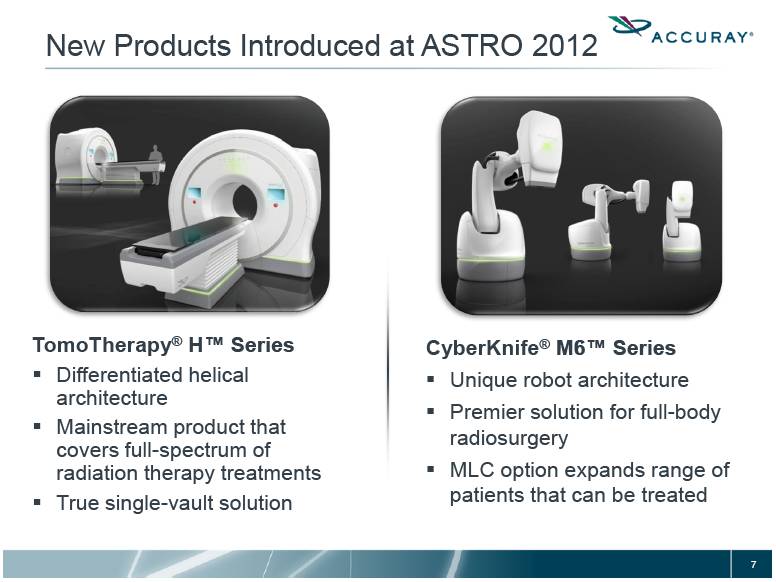
New Products Introduced at ASTRO 2012 CyberKnife® M6™ Series Unique robot architecture Premier solution for full-body radiosurgery MLC option expands range of patients that can be treated TomoTherapy® H™ Series Differentiated helical architecture Mainstream product that covers full-spectrum of radiation therapy treatments True single-vault solution |
|
|
TomoTherapy® System PRE-ASTRO Meeting October 2012 TomoTherapy® was seen as a specialty system used to deliver IMRT for complex and difficult cases Niche position in market POST-ASTRO Meeting October 2012 TomoTherapy® H™ Series New designs for many components Treatments cover entire spectrum of radiation therapy patients Faster treatment times, better throughput New version includes all reliability improvements VoLO™ treatment planning system significantly cuts prep time Helical delivery enhanced – improves accuracy that spares healthy tissue Ready for mainstream position in market |
|
|
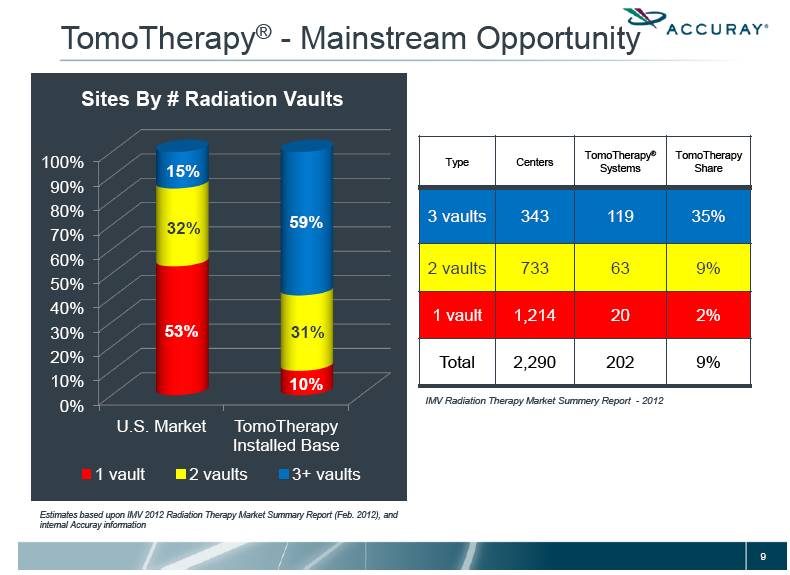
Estimates based upon IMV 2012 Radiation Therapy Market Summary Report (Feb. 2012), and internal Accuray information TomoTherapy® - Mainstream Opportunity IMV Radiation Therapy Market Summery Report - 2012 Type Centers TomoTherapy® Systems TomoTherapy Share 3 vaults 343 119 35% 2 vaults 733 63 9% 1 vault 1,214 20 2% Total 2,290 202 9% |
|
|
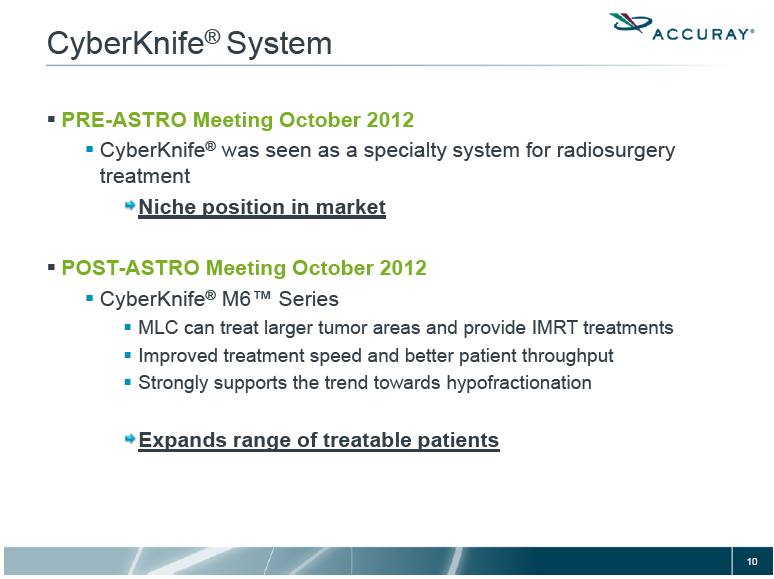
CyberKnife® System PRE-ASTRO Meeting October 2012 CyberKnife® was seen as a specialty system for radiosurgery treatment Niche position in market POST-ASTRO Meeting October 2012 CyberKnife® M6™ Series MLC can treat larger tumor areas and provide IMRT treatments Improved treatment speed and better patient throughput Strongly supports the trend towards hypofractionation Expands range of treatable patients |
|
|
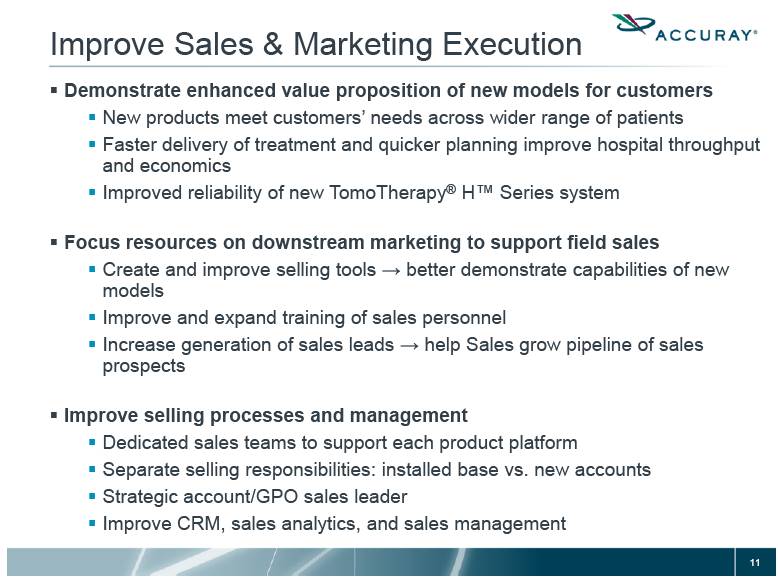
Improve Sales & Marketing Execution Demonstrate enhanced value proposition of new models for customers New products meet customers’ needs across wider range of patients Faster delivery of treatment and quicker planning improve hospital throughput and economics Improved reliability of new TomoTherapy® H™ Series system Focus resources on downstream marketing to support field sales Create and improve selling tools better demonstrate capabilities of new models Improve and expand training of sales personnel Increase generation of sales leads help Sales grow pipeline of sales prospects Improve selling processes and management Dedicated sales teams to support each product platform Separate selling responsibilities: installed base vs. new accounts Strategic account/GPO sales leader Improve CRM, sales analytics, and sales management |
|
|
Restructuring Establish new cost structure to position company to achieve sustained profitability Rationalize R&D and G&A costs Reallocate resources to better support key commercial activities Drive order and revenue momentum Transform our company culture Align culture with new business strategy Improve cross-functional alignment to better support commercial execution Drive performance required to create customer and shareholder value |

|
|
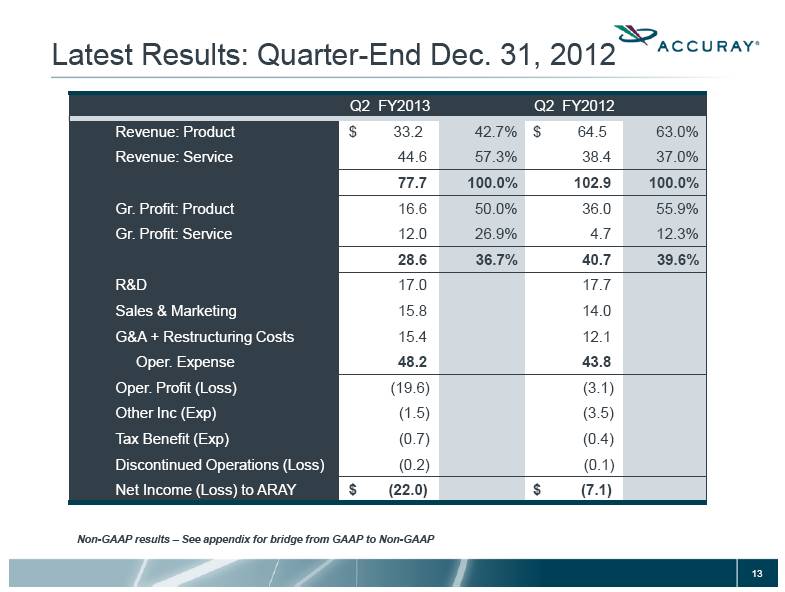
Latest Results: Quarter-End Dec. 31, 2012 Q2 FY2013 Q2 FY2012 Revenue: Product $ 33.2 42.7% $ 64.5 63.0% Revenue: Service 44.6 57.3% 38.4 37.0% 77.7 100.0% 102.9 100.0% Gr. Profit: Product 16.6 50.0% 36.0 55.9% Gr. Profit: Service 12.0 26.9% 4.7 12.3% 28.6 36.7% 40.7 39.6% R&D 17.0 17.7 Sales & Marketing 15.8 14.0 G&A + Restructuring Costs 15.4 12.1 Oper. Expense 48.2 43.8 Oper. Profit (Loss) (19.6) (3.1) Other Inc (Exp) (1.5) (3.5) Tax Benefit (Exp) (0.7) (0.4) Discontinued Operations (Loss) (0.2) (0.1) Net Income (Loss) to ARAY $ (22.0) $ (7.1) Non-GAAP results – See appendix for bridge from GAAP to Non-GAAP |
|
|
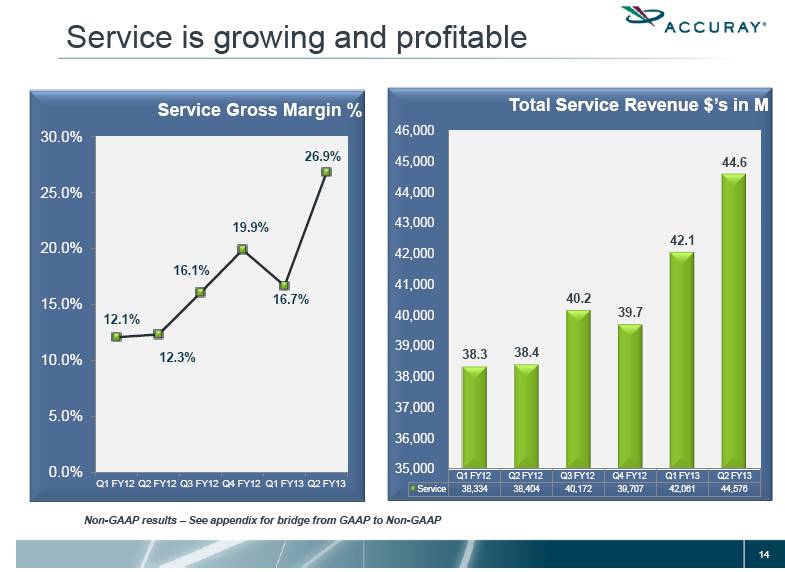
Service is growing and profitable Non-GAAP results – See appendix for bridge from GAAP to Non-GAAP |
|
|
Reduce operating expenses Reduce operating expenses by approximately $40M from the level originally reported for FY2012 Result: Positions company for profitability and growth Continue to grow service revenue Continue to increase recurring revenue from growth in installed base Continue to improve gross profit margin from improvements in reliability of TomoTherapy® systems Result: Combination provided quarterly service gross profit of $12M* in Q2FY13 Generate increased product revenue Drive improvement in new order momentum and backlog conversion Maintain historical gross profit margin Anticipated Result: Achieve revenue and margin to return to profitability Shareholder Value Creation Model *Non-GAAP results – See appendix for bridge from GAAP to Non-GAAP Non-GAAP results |
|
|
APPENDIX |
|
|
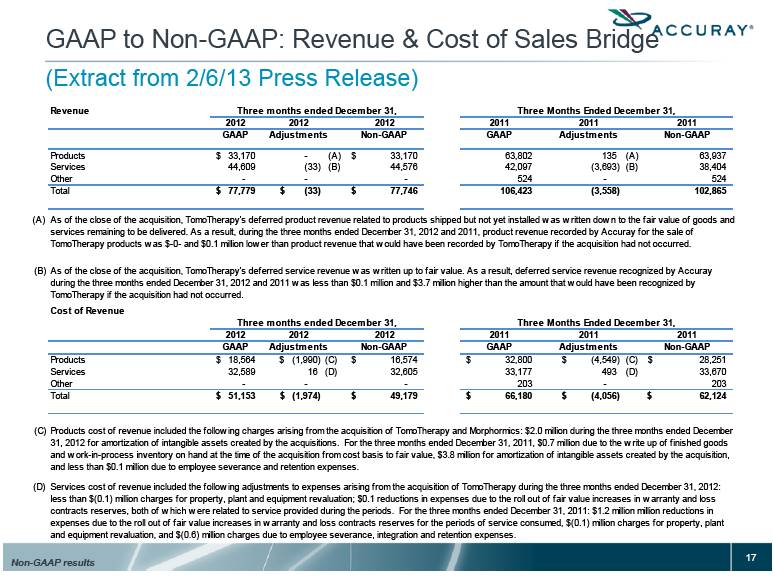
GAAP to Non-GAAP: Revenue & Cost of Sales Bridge (Extract from 2/6/13 Press Release) Non-GAAP results Revenue 2012 2012 2012 2011 2011 2011 GAAP Adjustments Non-GAAP GAAP Adjustments Non-GAAP Products 33,170 $ - (A) 33,170 $ 63,802 135 (A) 63,937 Services 44,609 (33) (B) 44,576 42,097 (3,693) (B) 38,404 Other - - - 524 - 524 Total 77,779 $ (33) $ 77,746 $ 106,423 (3,558) 102,865 (A) (B) Cost of Revenue 2012 2012 2012 2011 2011 2011 GAAP Adjustments Non-GAAP GAAP Adjustments Non-GAAP Products 18,564 $ (1,990) $ (C) 16,574 $ 32,800 $ (4,549) $ (C) 28,251 $ Services 32,589 16 (D) 32,605 33,177 493 (D) 33,670 Other - - - 203 - 203 Total 51,153 $ (1,974) $ 49,179 $ 66,180 $ (4,056) $ 62,124 $ (C) (D) As of the close of the acquisition, TomoTherapy’s deferred product revenue related to products shipped but not yet installed was written down to the fair value of goods and services remaining to be delivered. As a result, during the three months ended December 31, 2012 and 2011, product revenue recorded by Accuray for the sale of TomoTherapy products was $-0- and $0.1 million lower than product revenue that would have been recorded by TomoTherapy if the acquisition had not occurred. As of the close of the acquisition, TomoTherapy’s deferred service revenue was written up to fair value. As a result, deferred service revenue recognized by Accuray during the three months ended December 31, 2012 and 2011 was less than $0.1 million and $3.7 million higher than the amount that would have been recognized by TomoTherapy if the acquisition had not occurred. Products cost of revenue included the following charges arising from the acquisition of TomoTherapy and Morphormics: $2.0 million during the three months ended December 31, 2012 for amortization of intangible assets created by the acquisitions. For the three months ended December 31, 2011, $0.7 million due to the write up of finished goods and work-in-process inventory on hand at the time of the acquisition from cost basis to fair value, $3.8 million for amortization of intangible assets created by the acquisition, and less than $0.1 million due to employee severance and retention expenses. Services cost of revenue included the following adjustments to expenses arising from the acquisition of TomoTherapy during the three months ended December 31, 2012: less than $(0.1) million charges for property, plant and equipment revaluation; $0.1 reductions in expenses due to the roll out of fair value increases in warranty and loss contracts reserves, both of which were related to service provided during the periods. For the three months ended December 31, 2011: $1.2 million million reductions in expenses due to the roll out of fair value increases in warranty and loss contracts reserves for the periods of service consumed, $(0.1) million charges for property, plant and equipment revaluation, and $(0.6) million charges due to employee severance, integration and retention expenses. Three months ended December 31, Three Months Ended December 31, Three months ended December 31, Three Months Ended December 31, |
|
|
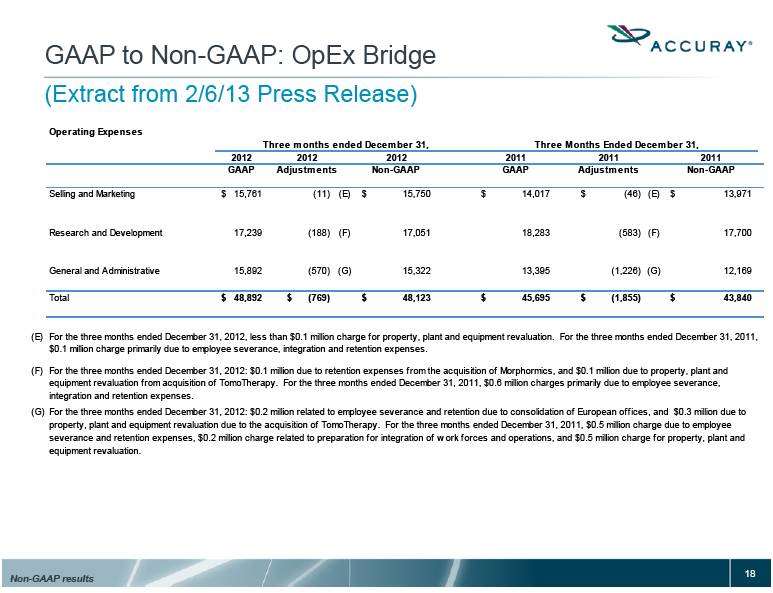
GAAP to Non-GAAP: OpEx Bridge (Extract from 2/6/13 Press Release) Non-GAAP results Operating Expenses 2012 2012 2012 2011 2011 2011 GAAP Adjustments Non-GAAP GAAP Adjustments Non-GAAP Selling and Marketing 15,761 $ (11) (E) 15,750 $ 14,017 $ (46) $ (E) 13,971 $ Research and Development 17,239 (188) (F) 17,051 18,283 (583) (F) 17,700 General and Administrative 15,892 (570) (G) 15,322 13,395 (1,226) (G) 12,169 Total 48,892 $ (769) $ 48,123 $ 45,695 $ (1,855) $ 43,840 $ (E) (F) (G) For the three months ended December 31, 2012, less than $0.1 million charge for property, plant and equipment revaluation. For the three months ended December 31, 2011, $0.1 million charge primarily due to employee severance, integration and retention expenses. For the three months ended December 31, 2012: $0.1 million due to retention expenses from the acquisition of Morphormics, and $0.1 million due to property, plant and equipment revaluation from acquisition of TomoTherapy. For the three months ended December 31, 2011, $0.6 million charges primarily due to employee severance, integration and retention expenses. For the three months ended December 31, 2012: $0.2 million related to employee severance and retention due to consolidation of European offices, and $0.3 million due to property, plant and equipment revaluation due to the acquisition of TomoTherapy. For the three months ended December 31, 2011, $0.5 million charge due to employee severance and retention expenses, $0.2 million charge related to preparation for integration of work forces and operations, and $0.5 million charge for property, plant and equipment revaluation. Three Months Ended December 31, Three months ended December 31, |
|
|
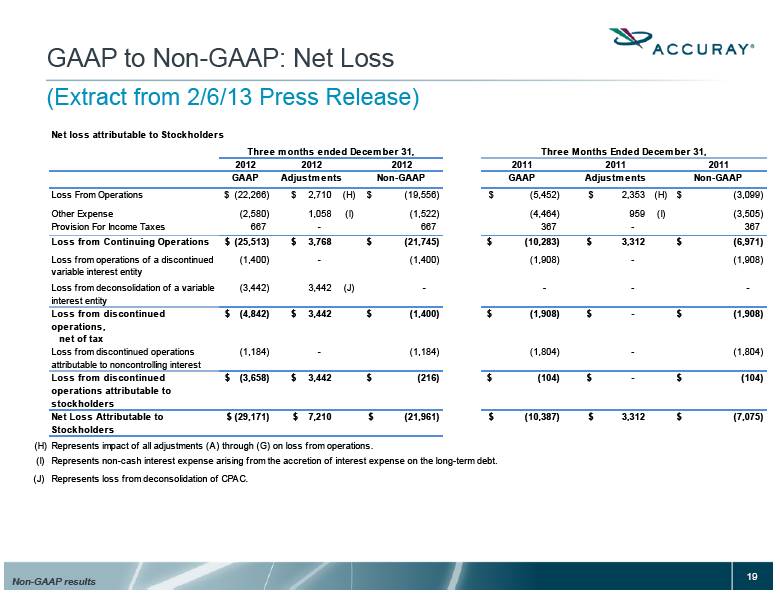
GAAP to Non-GAAP: Net Loss (Extract from 2/6/13 Press Release) Non-GAAP results 2012 2012 2012 2011 2011 2011 GAAP Adjustments Non-GAAP GAAP Adjustments Non-GAAP Loss From Operations $ (22,266) 2,710 $ (H) (19,556) $ (5,452) $ 2,353 $ (H) (3,099) $ Other Expense (2,580) 1,058 (I) (1,522) (4,464) 959 (I) (3,505) Provision For Income Taxes 667 - 667 367 - 367 Loss from Continuing Operations (25,513) $ 3,768 $ (21,745) $ (10,283) $ 3,312 $ (6,971) $ Loss from operations of a discontinued variable interest entity (1,400) - (1,400) (1,908) - (1,908) Loss from deconsolidation of a variable interest entity (3,442) 3,442 (J) - - - - Loss from discontinued operations, net of tax (4,842) $ 3,442 $ (1,400) $ (1,908) $ - $ (1,908) $ Loss from discontinued operations attributable to noncontrolling interest (1,184) - (1,184) (1,804) - (1,804) Loss from discontinued operations attributable to stockholders (3,658) $ 3,442 $ (216) $ (104) $ - $ (104) $ Net Loss Attributable to Stockholders (29,171) $ 7,210 $ (21,961) $ (10,387) $ 3,312 $ (7,075) $ (H) (I) (J) Three months ended December 31, Three Months Ended December 31, Net loss attributable to Stockholders Represents loss from deconsolidation of CPAC. Represents impact of all adjustments (A) through (G) on loss from operations. Represents non-cash interest expense arising from the accretion of interest expense on the long-term debt. |
|
|
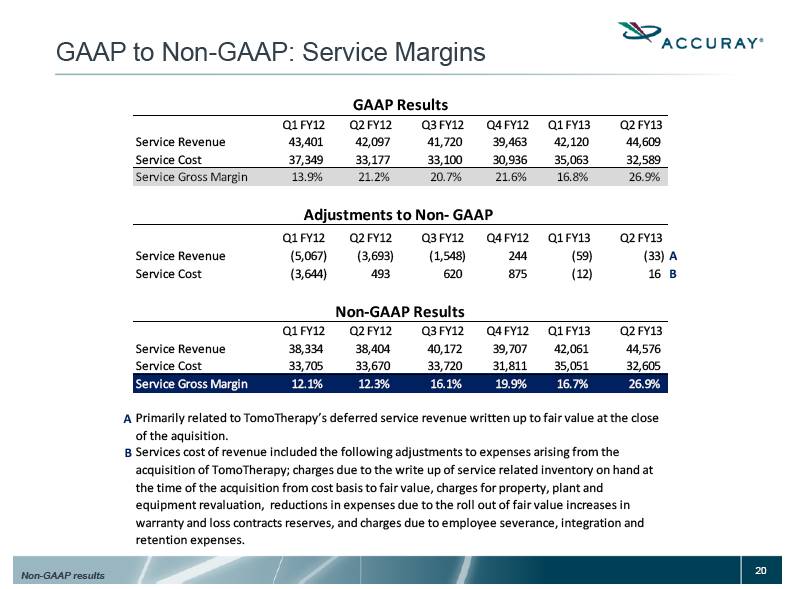
GAAP to Non-GAAP: Service Margins Non-GAAP results Q1 FY12 Q2 FY12 Q3 FY12 Q4 FY12 Q1 FY13 Q2 FY13 Service Revenue 43,401 42,097 41,720 39,463 42,120 44,609 Service Cost 37,349 33,177 33,100 30,936 35,063 32,589 Service Gross Margin 13.9% 21.2% 20.7% 21.6% 16.8% 26.9% Q1 FY12 Q2 FY12 Q3 FY12 Q4 FY12 Q1 FY13 Q2 FY13 Service Revenue (5,067) (3,693) (1,548) 244 (59) (33) A Service Cost (3,644) 493 620 875 (12) 16 B Q1 FY12 Q2 FY12 Q3 FY12 Q4 FY12 Q1 FY13 Q2 FY13 Service Revenue 38,334 38,404 40,172 39,707 42,061 44,576 Service Cost 33,705 33,670 33,720 31,811 35,051 32,605 Service Gross Margin 12.1% 12.3% 16.1% 19.9% 16.7% 26.9% A B GAAP Results Adjustments to Non- GAAP Non-GAAP Results Primarily related to TomoTherapy’s deferred service revenue written up to fair value at the close of the aquisition. Services cost of revenue included the following adjustments to expenses arising from the acquisition of TomoTherapy; charges due to the write up of service related inventory on hand at the time of the acquisition from cost basis to fair value, charges for property, plant and equipment revaluation, reductions in expenses due to the roll out of fair value increases in warranty and loss contracts reserves, and charges due to employee severance, integration and retention expenses. |