Attached files
| file | filename |
|---|---|
| EX-99.1 - EXHIBIT 99.1 - Xylem Inc. | d481798dex991.htm |
| 8-K - FORM 8-K - Xylem Inc. | d481798d8k.htm |
 Q4
2012 Earnings Release February 7, 2013
Exhibit 99.2 |
 Forward
Looking Statements 2
This
document
contains
information
that
may
constitute
“forward-looking
statements.”
Forward-looking
statements
by
their
nature
address
matters
that
are,
to
different
degrees,
uncertain.
Generally,
the
words
“anticipate,”
“estimate,”
“expect,”
“project,”
“intend,”
“plan,”
“believe,”
“target”
and similar expressions identify forward-looking statements, which
generally are not historical in nature. However, the absence of these words or
similar expressions does not mean that a statement is not
forward-looking. These forward-looking statements include, but are
not limited to, statements about the separation of Xylem Inc. (the
“Company”) from ITT Corporation in 2011, capitalization of the Company,
future strategic plans and other statements that describe the Company’s
business strategy, outlook, objectives, plans, intentions or goals, and any discussion of
future operating or financial performance. All statements that address operating
performance, events or developments that
we
expect
or
anticipate
will
occur
in
the
future —
including
statements
relating
to
orders,
revenues,
operating
margins
and
earnings
per
share
growth,
and
statements
expressing
general
views
about
future
operating
results
—
are
forward-looking statements.
Caution should be taken not to place undue reliance on any such forward-looking
statements because they involve risks, uncertainties and other factors that
could cause actual results to differ materially from those expressed or implied
in, or reasonably inferred from, such statements. The Company undertakes no
obligation to publicly update or revise any forward-looking statements,
whether as a result of new information, future events or otherwise, except as required
by law. In addition, forward-looking statements are subject to certain risks
and uncertainties that could cause actual results to differ materially from
the Company’s historical experience and our present expectations or projections. These
risks and uncertainties include, but are not limited to, those set forth in Item 1A
of our Annual Report on Form 10-K, and those described from time to time
in subsequent reports filed with the Securities and Exchange Commission. |
 Q4’12 Financial Highlights
•
Orders: $926 Million; up 3% (Constant Currency*)
•
Revenue: $969 Million, down 3%
•
Gross Margin: 39.4%, up 150 bps
•
Operating Margin: 13.4%*, up 140 bps
•
EPS: $0.47*, up +21% on Normalized Basis
Full Year 2012 Financial Highlights
•
Orders: $3.8 Billion; Backlog $647 million
•
Revenue: $3.8 Billion, up 2.5% (Constant Currency*)
•
Gross Margin: 39.6%, up 120 bps
•
Operating Margin: 12.9%*, up 100 bps on a
Normalized Basis
•
EPS: $1.77*, up +7% on Normalized Basis
•
FCF: $312 Million*, 100% Conversion
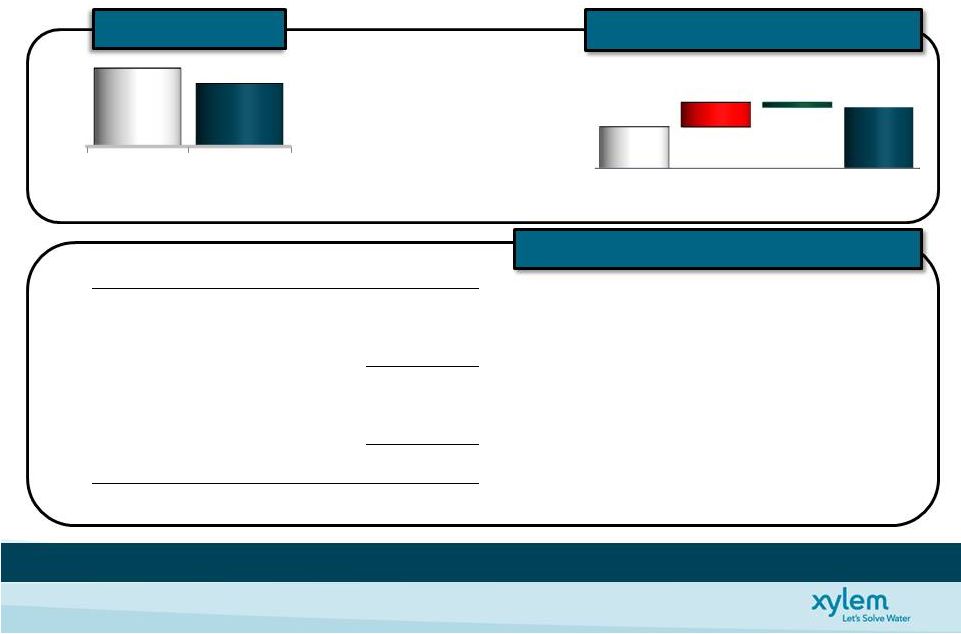
Business Update
3
Delivered Strong Operating Performance Despite Macro Challenges
Delivered Strong Operating Performance Despite Macro Challenges
* See Appendix for Non-GAAP Reconciliations
Advancing Our Strategic Position
•
PIMS Group Acquisition Enhances Global
Aftermarket & Services Business
•
MJK & Heartland Pump Integrations
Underway; EPS Neutral in 2012
•
Significant Restructuring & Realignment
Actions to Primarily Reposition European
Business +$0.13 EPS in 2013
Deploying Innovative New Product
Applications & Services
•
2012 Vitality Index +25% from 2011
•
Middle East Expansion –
Transport,
Treatment, Dewatering & Analytics
Applications
Dividend Increase +15% |
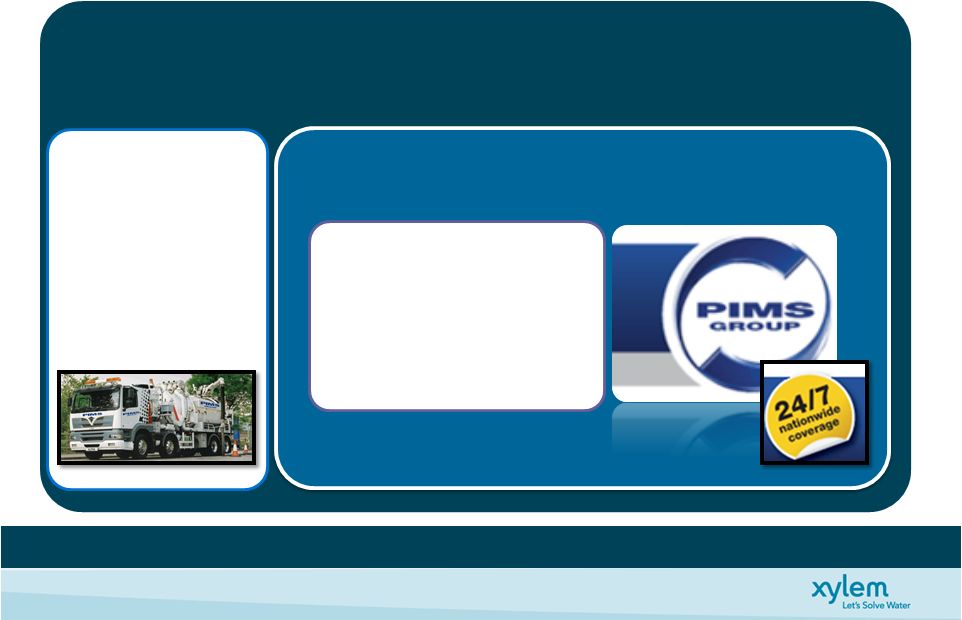 Acquisition Overview
4
Overview
-
Purchase Price $57M
-
‘12 Rev $38M
-
220 Employees
-
Installation &
Private Sectors
Maintenance Services
-
Enhances Global AM&S
-
Accelerates Expansion into
Contract Services
-
Increases Regional Scale &
Served Market
Strategic Rationale
PIMS Group
Enhances Xylem’s Global Aftermarket Services
-
24/7 Support >10K Sites
-
Municipal, Industrial & |
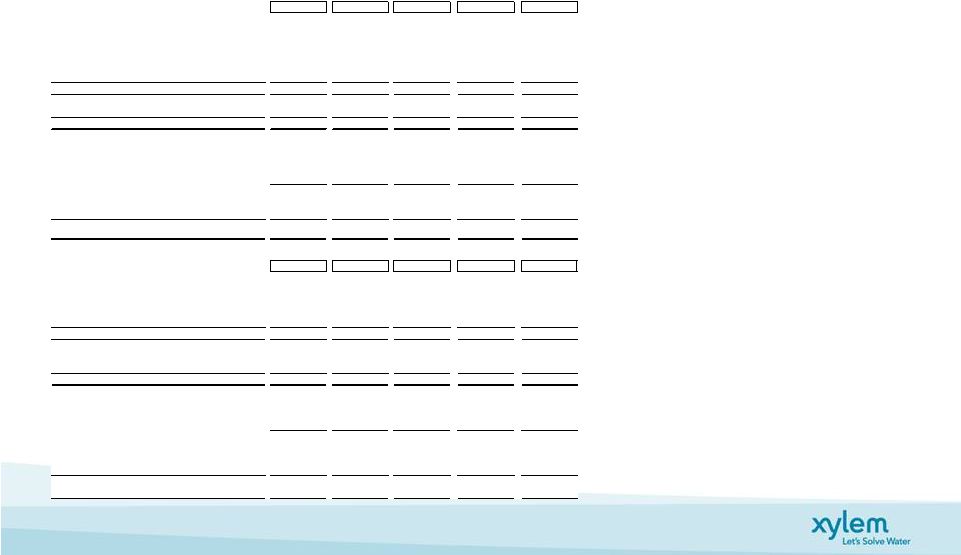
 Operating Income *
Q4 Growth
Organic
-3%
Acquisition
0%
Constant Currency
-3%
FX
0%
Total
-3%
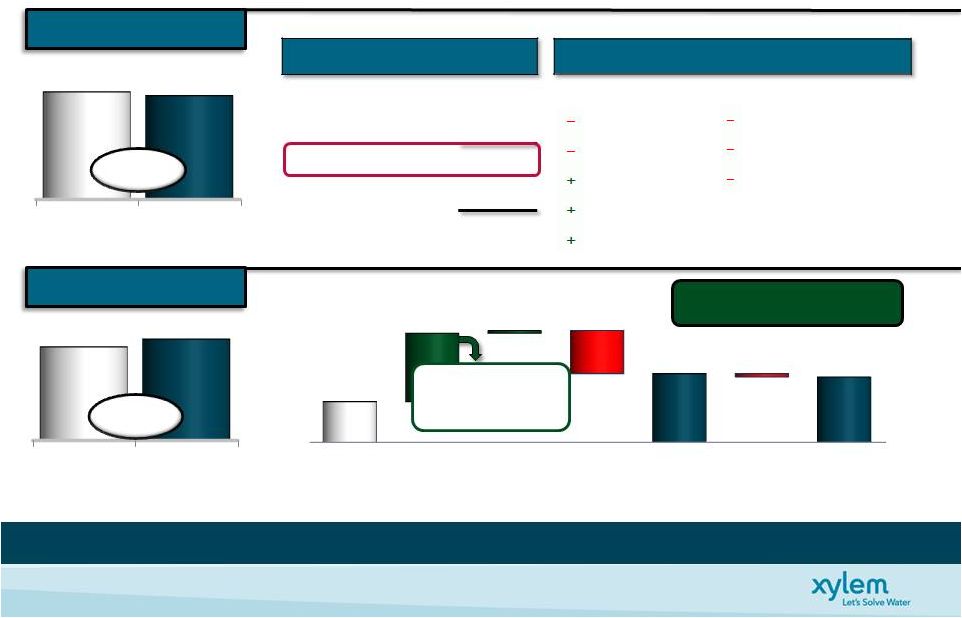
Q4’12 Xylem Performance
5
-3%
* See appendix for non-GAAP reconciliations
(Dollars, In Millions)
(Dollars, In Millions)
Organic Performance
By End Market
By Geography
Industrial
Europe
Public Utility
U.S.
Commercial
Emerging Markets
Residential
Agriculture
Operating Margin Expansion +140 Bps
Cost Reductions
Price
Acquisitions
Vol/Mix/Invest
Cost Reductions Drive
Cost Reductions Drive
Significant Margin Expansion
Significant Margin Expansion
Q4'11
Op Margin*
Operations
FX
Material,
Labor,
& OH
Inflation
Q4'12
Op Margin
Before Stand-
Alone Costs*
Stand-
Alone
Costs
Q4'12
Op Margin*
12.0%
13.6%
13.4%
2.9%
0.2%
4.3%
0.2%
Q4'11
Q4'12
1,003
969
Q4'11
Q4'12
120
130
+8%
+3.9%
+1.1%
-0.1%
-0.6%
Revenue |
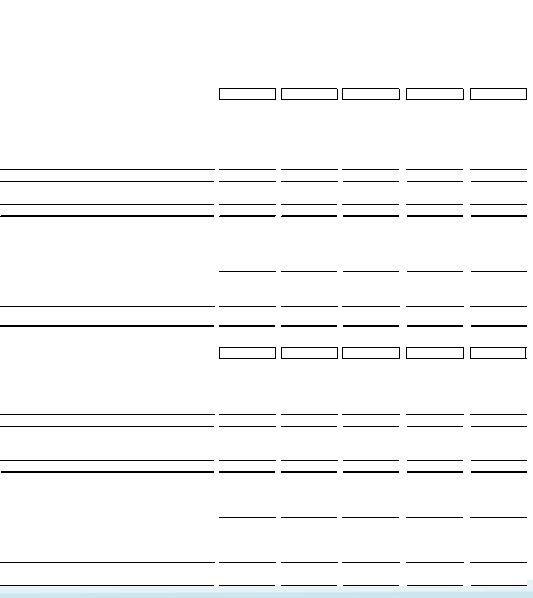
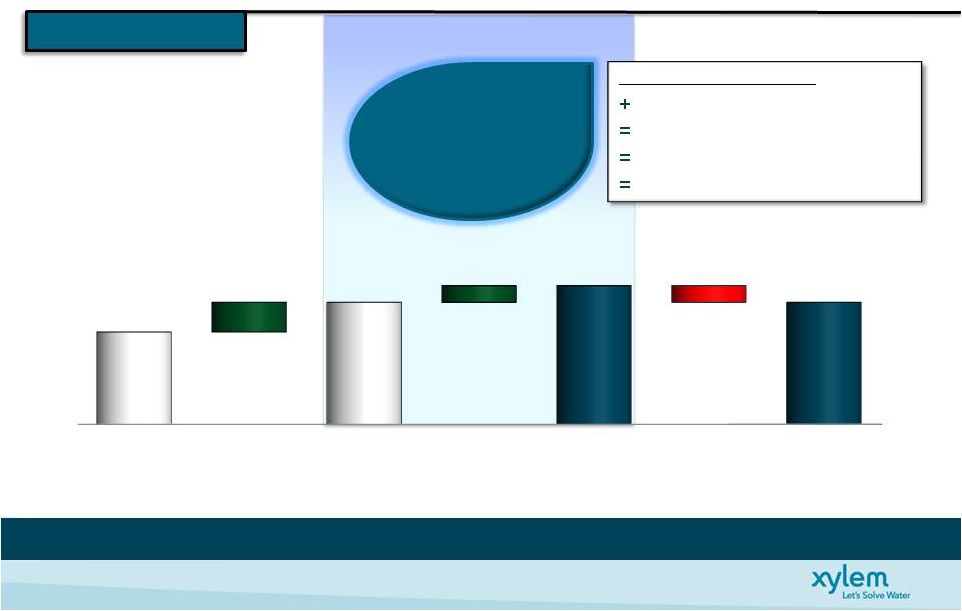 Q4’12 Xylem Performance
6
Operations Drives Strong EPS Performance +21%
Stand-Alone
Separation Costs
Special Tax
Q4’12 EPS *
+21% Normalized
+21% Normalized
EPS Performance
EPS Performance
* See Appendix for Non-GAAP Reconciliations
Operational Performance:
Core Operations
Acquisitions
FX Translation
Operating Tax Rate
Separation Costs
($0.03)
Restruct. &
Realign. Costs
($0.07)
Special Tax
$0.02
Q4'11
GAAP EPS
Adjustments
Normalized
Q4'11 EPS
Operational
Performance
Adjusted
Q4'12 EPS
Adjustments
Q4'12
GAAP EPS
$0.28
$0.39
$0.47
$0.39
$0.08
$0.11
$0.08
($0.01)
$0.10
$0.02
$0.08
$ -
$ -
$ - |
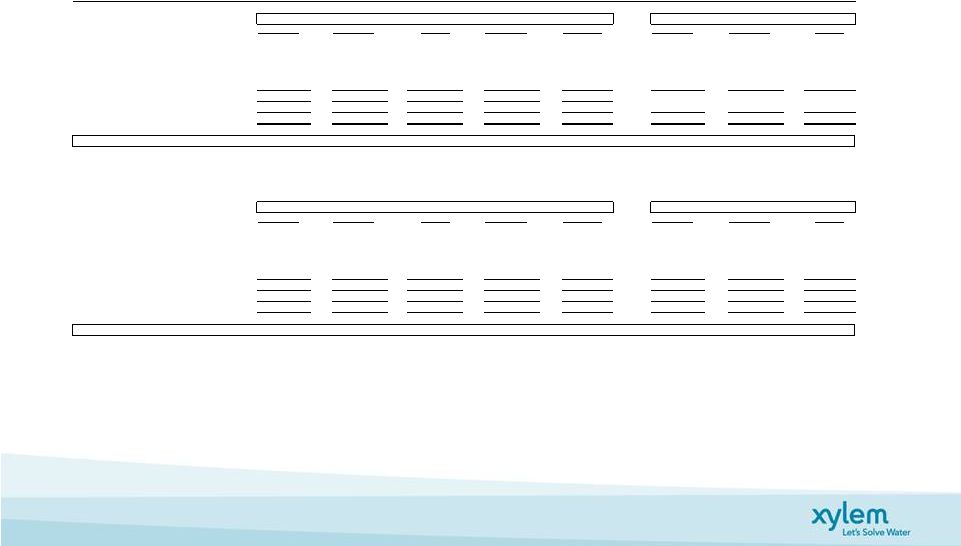
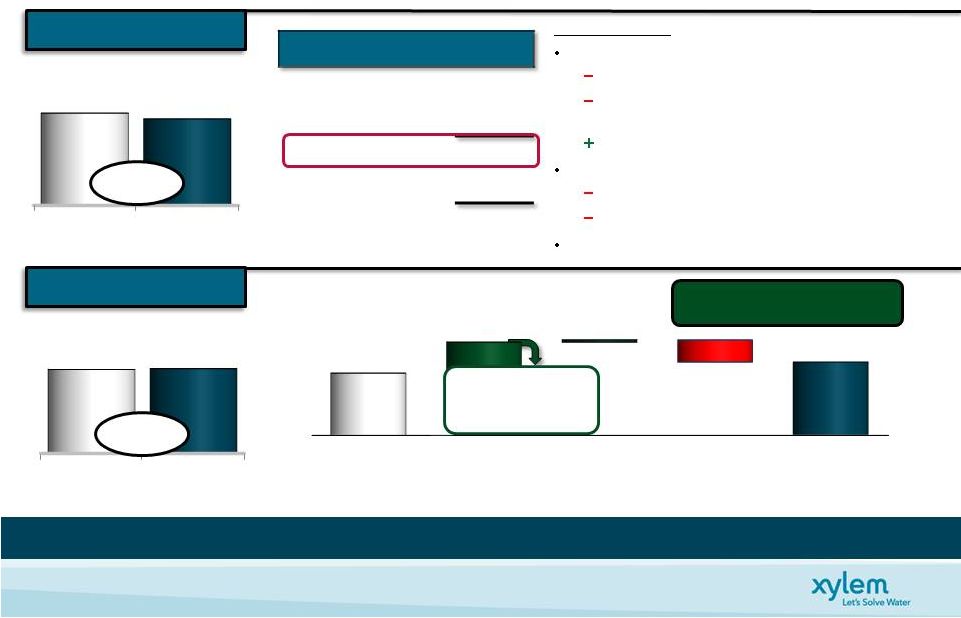 7
Operating Income *
* See Appendix for Non-GAAP Reconciliations
(Dollars, In Millions)
(Dollars, In Millions)
Q4 Growth
Q4 Growth
Organic
-7%
Acquisition
+2%
Constant Currency
-5%
FX
-1%
Total
-6%
(Organic Performance)
Transport -5%
Public Utility …
Weak Capital Project Market
Industrial Dewatering Down …
U.S. Drought & Lower
Demand for Fracking Applications
Disaster Recovery for Super Storm Sandy
Public Utility …
Weak Capital Project Market
Industrial …
Tough PY Comp
Cost Reductions
Price
Acquisition
Vol/Mix/Invest
Operating Margin Expansion +120 Bps
Q4’12 Water Infrastructure Performance
Q4'11
Op Margin*
Operations
FX
Material,
Labor,
& OH
Inflation
Q4'12
Op Margin*
15.3%
16.5%
2.7%
3.6%
0.3%
Cost Reductions Drive
Cost Reductions Drive
Significant Margin Expansion
Significant Margin Expansion
Q4'11
Q4'12
104
105
+1%
Q4'11
Q4'12
679
637
-6%
Treatment -18%
Test +1%
+3.8%
Revenue
+0.7%
-0.2%
-0.7% |
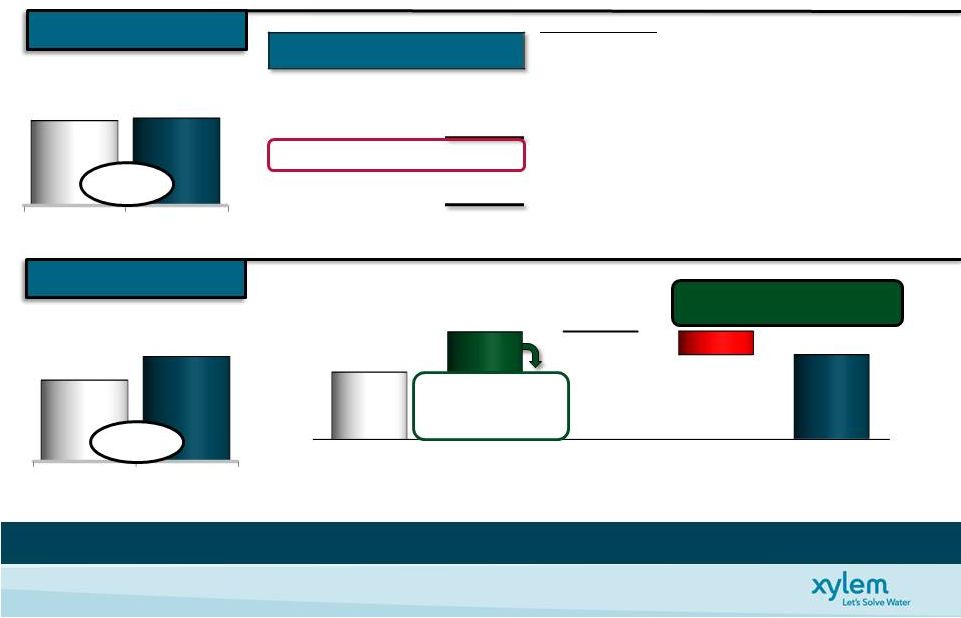 8
Operating Margin Expansion +240 Bps
Operating Income *
* See Appendix for Non-GAAP Reconciliations
(Dollars, In Millions)
(Dollars, In Millions)
(Organic Performance)
•
Building Services 2%
+
U.S. Residential & Commercial
+
Super Storm Sandy
–
Europe/Middle East Market Weakness
•
Industrial Water +6%
+
Favorable Across Most Regions
+
Timing of Shipments …
F&B/O&G Strength
•
Irrigation +4%
+
Europe Improvement off of a Low Base
Q4 Growth
Organic
+4%
Acquisition
-%
Constant Currency
+4%
FX
-1%
Total
+3%
Cost Reductions
Price
Vol/Mix/Invest
Cost Reductions Drive
Cost Reductions Drive
Significant Margin Expansion
Significant Margin Expansion
Q4’12 Applied Water Performance
+4.0%
+1.8%
-
0.3%
Q4'11
Op Margin
Operations
FX
Material,
Labor,
& OH
Inflation
Q4'12
Op Margin *
9.2%
11.6%
3.2%
5.5%
0.1%
Q4'11
Q4'12
336
346
+3%
Q4'11
Q4'12
31
+29%
40
Revenue |
 2012
Xylem Financial Position 9
Strong Cash Flow Performance …
Healthy Balance Sheet Provides Flexibility
Free Cash Flow *
•
Free Cash Flow Growth
•
Higher Cash Taxes
•
Full Year of Interest
•
Stand-Alone Costs
•
Capex > 1 reinvestment ratio
Capital Summary/Liquidity
•
Strong cash position
•
No Significant Debt Maturities Until 2016
•
25% Net Debt to Net Capital
•
1.1x Net Debt/Adj. TTM EBITDA
•
$600M
Revolving
Credit
Facility
-
Unutilized
•
Access
to
Commercial
Paper
-
Unutilized
Working Capital as % Revenue **
FCF%
111%
100%
December 31, 2012
Cash
504
Debt
1,205
Net Debt
701
Shareholders’
Equity
2,074
Net Capital
2,775
Net Debt to Net Capital
25%
(Dollars, In Millions)
(Dollars, In Millions)
* See Appendix for Non-GAAP Reconciliations
** (AR+INV-AP-Customer Advances) / Revenue (Adjusted for Acquisitions)
2011
FX
Operations
2012
21.7%
22.5%
0.2%
1.0%
2011
2012
388
312 |
 2013 Guidance |
 2013
Key Focus Areas 11
Drive
Growth
Initiatives
Improve
Business
Sustainability
Deliver
Customer
Value
•
Deploy Innovative
Solutions
•
Invest in Growth
Platforms
•
Accelerate
Geographic
Expansion
•
Cost Structure
Optimization
•
Business
Simplification
•
Operational
Excellence
•
Customer
Excellence
•
Xylem Total Care
•
Application
Expertise
Balanced Goals to Position Xylem for Sustained Profitable Growth
Balanced Goals to Position Xylem for Sustained Profitable Growth
|
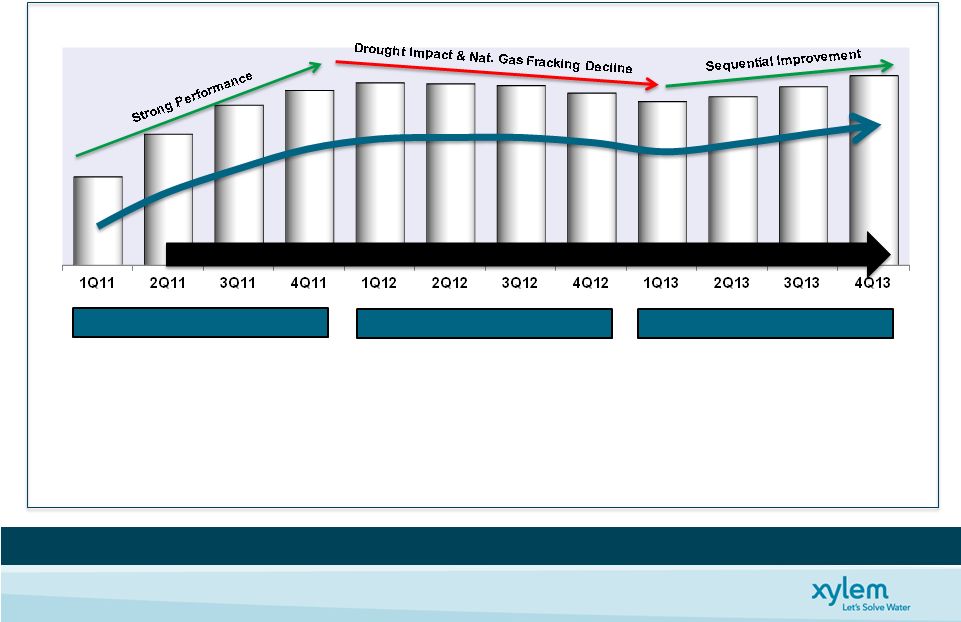 Revenue Profile
12
•
Total Growth +19%
•
Organic Revenue +7%
•
Acquisitions +8%
•
Project Orders Start to Slow
•
Organic Revenue Flat
•
Weak End Markets
•
Europe Resilient
•
U.S. Industrial Slows in 2H
•
Cap Project Delays
•
1Q -
Down MSD
•
1H -
Down LSD; 2H -
Up LSD
•
Europe Remains Stable
•
U.S. Strengthening in 2H
•
Emerging Markets +HSD
•
European Crisis
•
Fiscal Cliff /
Super Storm Sandy
•
U.S. Industrial Slows
TTM Revenues
As Reported
* See Appendix for Non-GAAP Reconciliations
------------
Public Utility Large Capital Project Delays
------------ 2011
2012
2013
Gaining Momentum Through 2013 |
 •
U.S. Slight 2H Improvement
•
Europe Challenged
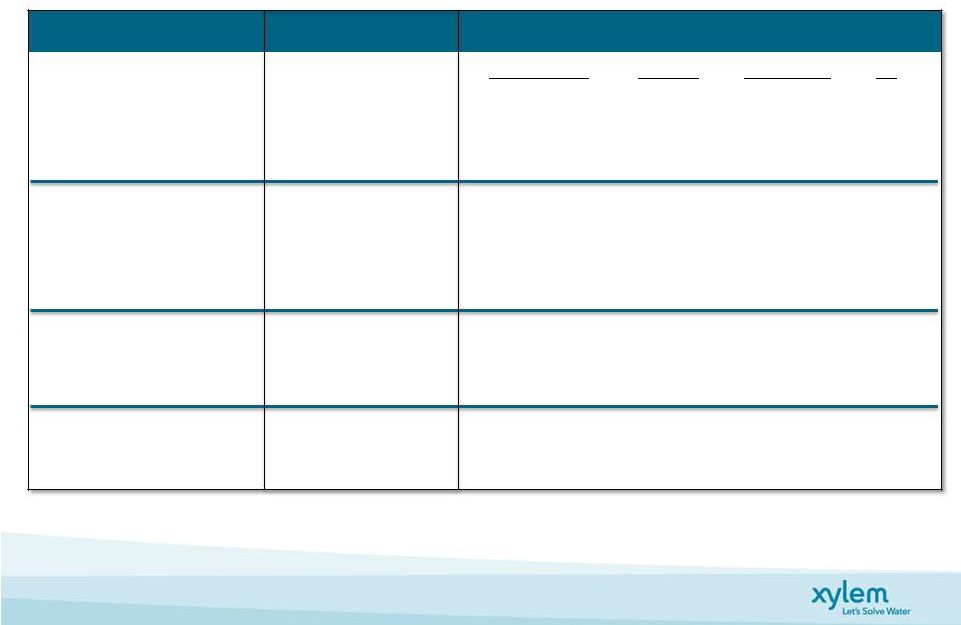
End Markets
13
•
Stable OPEX Market
•
No Change in Capital Projects
•
U.S. Flat Through 3Q of ’13
•
Europe Challenged
•
Continued Slow Growth Environment
•
U.S. Driven by Replacement
•
Tough 2012 Compare in U.S.
Driven by Drought Conditions
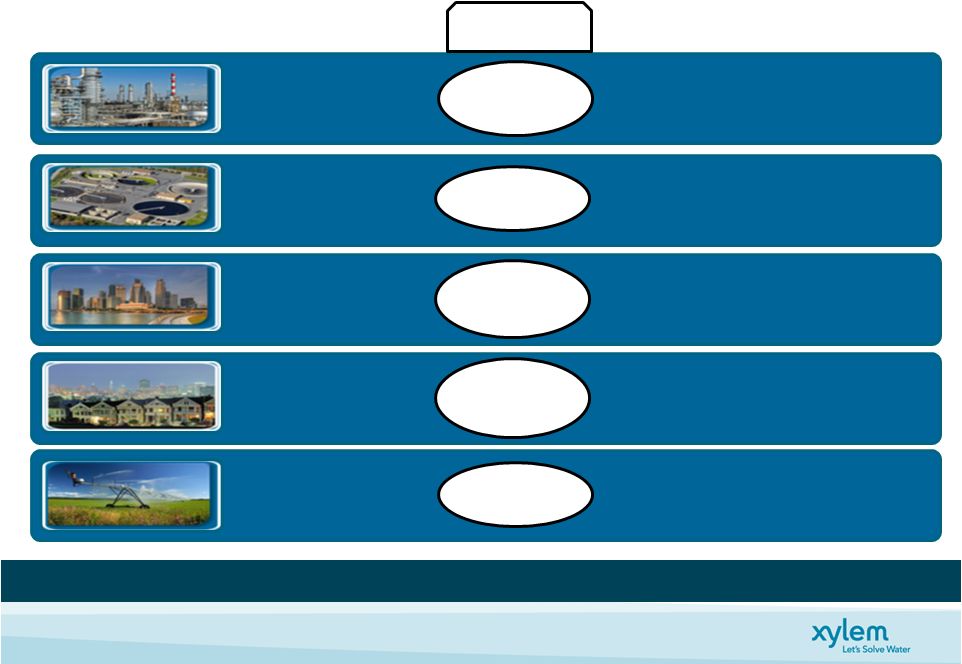
(~ 43% of ’12 Revenue)
(~ 35% of ’12 Revenue)
(~ 11% of ’12 Revenue)
(~ 8% of ’12 Revenue)
(~ 3% of ’12 Revenue)
Industrial
Public Utility
Commercial
Residential
Agriculture
Flat
Flat to Up
Low Single
Digit
Flat to Up
Low Single
Digit
Flat
Flat to Up
Low Single
Digit
Projected ‘13
XYL Growth
Challenging Market Conditions Exiting 2012 |
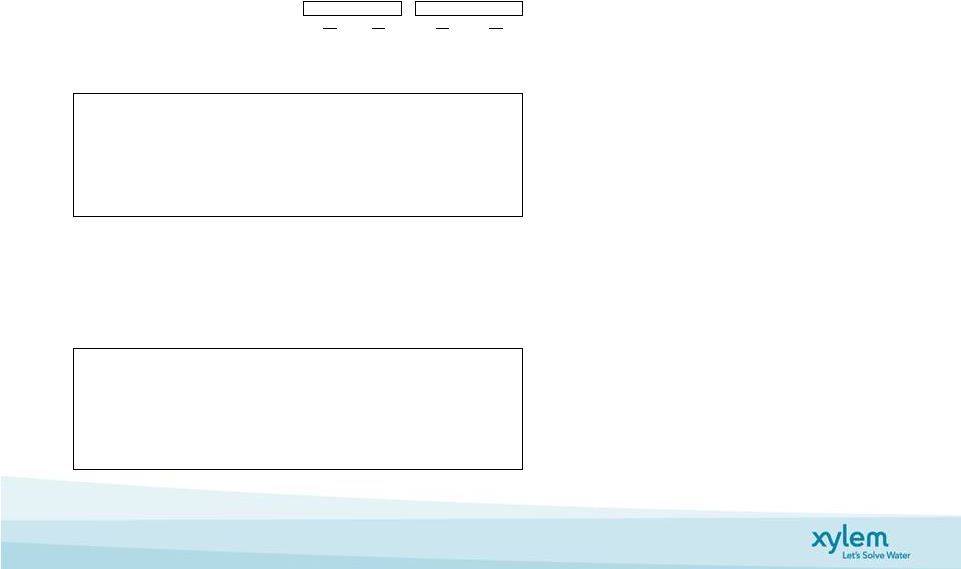
 2013
Financial Guidance Summary 14
2013 Full Year
2013 Full Year
Financial Outlook
Financial Outlook
Growth
Growth
2013E vs. 2012
2013E vs. 2012
Revenue
(Mid-Point)
Total Growth
Organic
Acquisition
FX
Xylem Consolidated
~$3,915M
~3 -
4%
0 -
1%
2% 1%
Water Infrastructure
~$2,530M
~4 -
5%
0 -
1%
3% 1%
Applied Water
~$1,450M
~1 -
2%
0 -
1%
0% 1%
Segment Margin *
13.8% -
14.3%
-50 bps to Flat
Operating Margin *
12.3% -
12.8%
-60 to -10 bps
EPS *
$1.80 -
$1.90
$1.85 Mid Point
Free Cash Flow Conversion
~95%
Restructuring Pmts, Realignment Capex, & CHQ Relocation
Guidance Assumptions:
Operating Tax Rate
~21%
1H’13 Rate: ~22%; 2H’13 Rate: ~20%
Share Count
~186.4M
Share Repurchase Program to Maintain Current Share Count
Items Excluded from EPS:
Restructuring &
Realignment Costs
~$60M -
$70M
Restructuring Costs: ~$40M to $50M
* See Appendix for Non-GAAP Reconciliations |
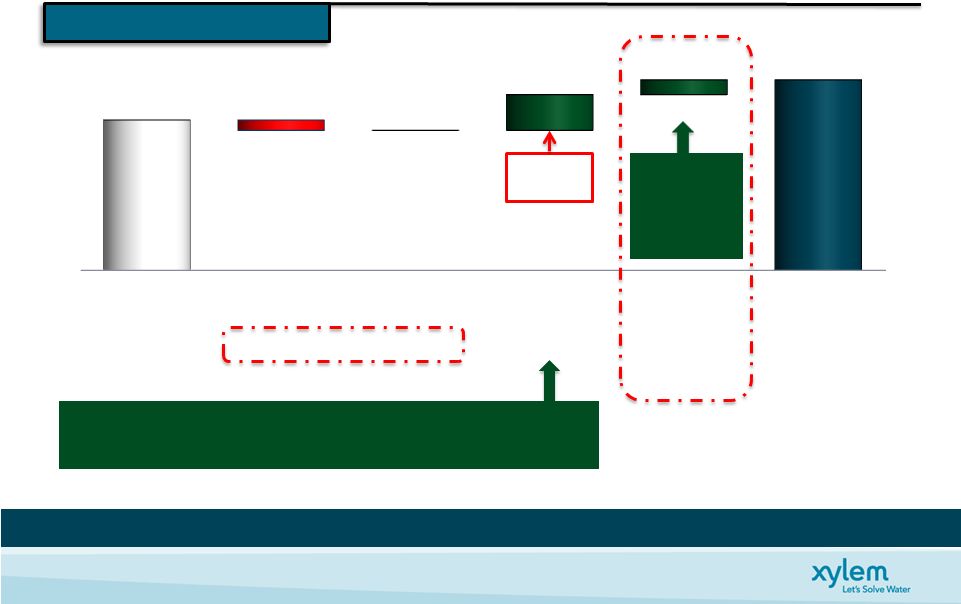 2013
Guidance 15
OI%
12.9%
(10) bps
(40) bps
50 bps
(30) bps
12.6%
Run Rate
Costs
(Guidance Mid-Point)
* See Appendix for Non-GAAP Reconciliations
Higher
Pension
Costs $(0.02)
Net EPS
Benefit
Driven by
Tax Rate
Reduction
Cost Savings Initiatives & Productivity Drive
50 bps Core Margin Expansion
Realignment Delivers Additional EPS Growth …
Top Line Provides Upside
$1.77
$-
$0.07
$0.03
$1.85
EPS* & Operating Margin *
Remaining
1xSpin Costs
FX/Acq
Core
Operations
European
Realignment
Adjusted
FY’13 EPS
Adjusted
FY’12 EPS
$0.02 |
 Summary
16
2012 Performance
•
Advanced Our Strategic Position
•
Deployed Innovative New Products & Services
•
Delivered Strong Financial Performance Despite Macro Challenges
Looking Ahead to 2013
•
Investing for Long-Term Growth
•
Restructuring & Realignment Actions Improve Competitive Position
& Increase Efficiency & Effectiveness
•
Strong Financial Position Provides Flexibility |
 Appendix |
 Quarterly Financial Performance
18
($M, Except
EPS)
FY’10
Q1’11
Q2’11
Q3’11
Q4’11
FY’11
Q1’12
Q2’12
Q3’12
Q4’12
FY’12
Revenue
3,202
890
971
939
1,003
3,803
925
966
931
969
3,791
COGS
1,988
553
592
574
623
2,342
562
583
557
587
2,289
Gross Profit
1,214
337
379
365
380
1,461
363
383
374
382
1,502
SG&A
737
210
219
215
233
877
231
220
231
232
914
R&D
74
24
26
23
27
100
28
28
24
26
106
Separation Costs
-
3
18
46
20
87
5
6
4
7
22
Restructuring &
Asset Impairment
Charges, net
15
-
-
2
-
2
-
-
4
13
17
Op Income
388
100
116
79
100
395
99
129
111
104
443
Interest Expense
-
-
1
1
15
17
14
13
14
14
55
Other Non-Op
-
1
-
4
-
5
(1)
(1)
3
(1)
-
Income before Tax
388
101
115
82
85
383
84
115
100
89
388
Tax
59
23
43
5
33
104
21
26
28
16
91
Net Income
329
78
72
77
52
279
63
89
72
73
297
EPS –
Diluted *
$1.78
$0.42
$0.39
$0.42
$0.28
$1.50
$0.34
$0.48
$0.38
$0.39
$1.59
* On October 31, 2011, Xylem Inc. completed the spin-off through a tax-free stock dividend to
ITT Corporation’s shareholders. ITT Corporation shareholders received one share of
our common stock for each share of ITT common stock. As a result on October 31, 2011, we
had 184.6 million shares of common stock outstanding and this share amount is being utilized to calculate earnings per share
for all periods presented prior to the spin-off. |
 Non-GAAP Measures
19
Management views key performance indicators including revenue, gross margins, segment operating
income and margins, orders growth, free cash flow, working capital, and backlog, among
others. In addition, we consider certain measures to be useful to management and investors evaluating our operating
performance for the periods presented, and provide a tool for evaluating our ongoing
operations, liquidity and management of assets. This information can assist
investors in assessing our financial performance and measures our ability to generate capital for deployment among competing strategic alternatives and
initiatives. These metrics, however, are not measures of financial performance under
GAAP and should not be considered a substitute for revenue, operating income,
net
income,
earnings
per
share
(basic
and
diluted)
or
net
cash
from
operations
as
determined
in
accordance
with
GAAP.
We
consider
the
following
non-GAAP measures, which may
not be comparable to similarly titled measures reported by other companies, to be key performance indicators:
“Organic revenue" and "Organic orders”
defined as revenue and orders, respectively, excluding the impact of foreign currency
fluctuations, intercompany transactions,
and
contributions
from
acquisitions
and
divestitures.
Divestitures
include
sales
of
portions
of
our
business that did not meet
the
criteria
for
classification as a discontinued operation or insignificant portions of our business that we
did not classify as a discontinued operation. The period-over-period change resulting from foreign currency fluctuations assumes no change in exchange rates from the prior period.
“Constant currency”
defined as financial results adjusted for currency translation impacts by translating current
period and prior period activity using the same currency conversion rate. This
approach is used for countries whose functional currency is not the U.S. dollar.
“EBITDA”
defined as earnings before interest, taxes, depreciation, amortization expense, and share-based compensation.
“Adjusted EBITDA” reflects
the adjustment to EBITDA to exclude for non-recurring separation costs associated with the Xylem spin-off from ITT
Corporation as well as
non-recurring restructuring
and realignment costs. "Adjusted
Operating
Income",
"Adjusted
Segment
Operating
Income",
and
“Adjusted
EPS”
defined
as
operating
income
and
earnings
per
share,
adjusted
to
exclude non-recurring
separation costs associated with the Xylem spin-off from ITT Corporation, non-recurring restructuring and realignment
costs and tax-related
special items. “Normalized EPS”
defined as adjusted earnings per share, as well as adjustments to reflect the incremental
current period amount of interest expense and stand alone costs in the prior comparable
period. “Free Cash Flow”
defined as net cash from operating activities, as reported in the Statement of Cash Flow,
less capital expenditures as well as adjustments for other significant items that
impact current results which management believes are not related to our ongoing operations and performance. Our definition of free
cash flows does not consider
non-discretionary cash payments, such as debt. |
 Non-GAAP Reconciliation:
Organic & Constant Currency Revenue Growth
20
Constant Currency
(A)
(B)
(C)
(D)
(E)
(F) = B+C+D+E
(G) = F/A
(H) = (B + D) / A
Change
% Change
Change
% Change
Revenue
Revenue
2012 v. 2011
2012 v. 2011
FX Contribution
Eliminations
Adj. 2012 v. 2011
Adj. 2012 v. 2011
2012
2011
Year Ended December 31, 2012
Xylem Inc.
3,791
3,803
(12)
-0.3%
(94)
108
-
2
0.1%
2.5%
Water infrastructure
2,425
2,416
9
0.4%
(94)
80
(1)
(6)
-0.2%
3.7%
Applied Water
1,424
1,444
(20)
-1.4%
-
32
(3)
9
0.6%
0.8%
Quarter Ended December 31, 2012
Xylem Inc.
969
1,003
(34)
-3.4%
(7)
7
-
(34)
-3.4%
-2.7%
Water Infrastructure
637
679
(42)
-6.2%
(7)
5
(1)
(45)
-6.6%
-5.4%
Applied Water
346
336
10
3.0%
-
2
-
12
3.6%
3.6%
Quarter Ended September 30, 2012
Xylem Inc.
931
939
(8)
-0.9%
(21)
38
-
9
1.0%
3.2%
Water infrastructure
595
584
11
1.9%
(21)
28
-
18
3.1%
6.7%
Applied Water
350
368
(18)
-4.9%
-
12
(2)
(8)
-2.2%
-1.6%
Quarter Ended June 30, 2012
Xylem Inc.
966
971
(5)
-0.5%
(32)
49
-
12
1.2%
4.5%
Water infrastructure
609
602
7
1.2%
(32)
37
(1)
11
1.8%
7.3%
Applied Water
373
385
(12)
-3.1%
-
13
(1)
-
0.0%
0.3%
Quarter Ended March 31, 2012
Xylem Inc.
925
890
35
3.9%
(34)
14
-
15
1.7%
5.5%
Water infrastructure
584
551
33
6.0%
(34)
10
1
10
1.8%
7.8%
Applied Water
355
355
-
0.0%
-
5
-
5
1.4%
1.4%
Note: Due to rounding the sum of segment amounts may not agree to Xylem totals.
Acquisitions /
Divestitures
Xylem Inc. Non-GAAP Reconciliation
Reported vs. Organic & Constant Currency Revenue
($ Millions)
(As Reported -
GAAP)
(As Adjusted -
Organic) |
 Non-GAAP Reconciliation:
Organic & Constant Currency Order Growth
21
Constant Currency
(A)
(B)
(C)
(D)
(E)
(F) = B+C+D+E
(G) = F/A
(H) = (B + D) / A
Change
% Change
Change
% Change
Orders
Orders
2012 v. 2011
2012 v. 2011
FX Contribution
Eliminations
Adj. 2012 v. 2011
Adj. 2012 v. 2011
2012
2011
Year Ended December 31, 2012
Xylem Inc.
3,782
3,847
(65)
-1.7%
(95)
114
-
(46)
-1.2%
1.3%
Water infrastructure
2,421
2,454
(33)
-1.3%
(95)
87
1
(40)
-1.6%
2.2%
Applied Water
1,423
1,452
(29)
-2.0%
-
31
(8)
(6)
-0.4%
0.1%
Quarter Ended December 31, 2012
Xylem Inc.
926
905
21
2.3%
(7)
6
-
20
2.2%
3.0%
Water infrastructure
602
589
13
2.2%
(7)
5
1
12
2.0%
3.1%
Applied Water
337
330
7
2.1%
-
1
-
8
2.4%
2.4%
Quarter Ended September 30, 2012
Xylem Inc.
882
966
(84)
-8.7%
(21)
39
-
(66)
-6.8%
-4.7%
Water infrastructure
564
621
(57)
-9.2%
(21)
29
-
(49)
-7.9%
-4.5%
Applied Water
334
358
(24)
-6.7%
-
12
(5)
(17)
-4.7%
-3.4%
Quarter Ended June 30, 2012
Xylem Inc.
970
998
(28)
-2.8%
(30)
51
-
(7)
-0.7%
2.3%
Water infrastructure
617
632
(15)
-2.4%
(30)
40
-
(5)
-0.8%
4.0%
Applied Water
370
383
(13)
-3.4%
-
13
(2)
(2)
-0.5%
0.0%
Quarter Ended March 31, 2012
Xylem Inc.
1,004
978
26
2.7%
(37)
18
-
7
0.7%
4.5%
Water infrastructure
638
612
26
4.2%
(37)
13
-
2
0.3%
6.4%
Applied Water
382
381
1
0.3%
-
5
(1)
5
1.3%
1.6%
Note:
Due
to
rounding
the
sum
of
segment
amounts
may
not
agree
to
Xylem
totals.
Acquisitions /
Divestitures
Xylem Inc. Non-GAAP Reconciliation
Reported vs. Organic & Constant Currency Order Growth
($ Millions)
(As Reported -
GAAP)
(As Adjusted -
Organic) |
  Non-GAAP Reconciliation: Adjusted Diluted EPS
22
Q1 2012
Q2 2012
Q3 2012
Q4 2012
YTD 2012
Net Income
63
89
72
73
297
Separation Costs, Net of Tax
4
4
3
5
16
Restructuring & Realignment, Net of Tax
-
-
4
13
17
Adjusted Net Income before Special Tax Items
67
93
79
91
330
Special Tax Items
-
(1)
4
(3)
-
Adjusted Net Income
67
92
83
88
330
Diluted Earnings per Share
$0.34
$0.48
$0.38
$0.39
$1.59
Separation Costs per Share
$0.02
$0.02
$0.02
$0.03
$0.09
Restructuring & Realignment Costs per Share
$0.00
$0.00
$0.02
$0.07
$0.09
Adjusted Diluted EPS before Special Tax Items
$0.36
$0.50
$0.42
$0.49
$1.77
Special Tax Items per Share
$0.00
($0.01)
$0.02
($0.02)
$0.00
Adjusted Diluted EPS
$0.36
$0.49
$0.44
$0.47
$1.77
Q1 2011
Q2 2011
Q3 2011
Q4 2011
YTD 2011
Net Income
78
72
77
52
279
Separation Costs, Net of Tax
2
27
25
18
72
Adjusted Net Income before Special Tax Items
80
99
102
70
351
Special Tax Items
-
4
(1)
4
7
Adjusted Net Income
80
103
101
74
358
Diluted Earnings per Share
$0.42
$0.39
$0.42
$0.28
$1.50
Separation Costs per Share
$0.01
$0.15
$0.13
$0.10
$0.39
Adjusted Diluted EPS before Special Tax Items
$0.43
$0.54
$0.55
$0.38
$1.89
Special Tax Items per Share
$0.00
$0.02
($0.01)
$0.02
$0.04
Adjusted Diluted EPS
$0.43
$0.56
$0.54
$0.40
$1.93
Adjusted Diluted EPS
2012 and 2011
($ Millions, except per share amounts)
Xylem Inc. Non-GAAP Reconciliation
Note: YTD EPS amounts may not equal the sum of the quarterly EPS
amounts due to rounding. |
 Non-GAAP Reconciliation: Normalized and Adjusted EPS
23
Q4 2011
Q4 2012
As Reported
Adjustments
Adjusted
Adjustments
Normalized
As Reported
Adjustments
Adjusted
Total Revenue
1,003
1,003
1,003
969
969
Operating Income
100
20
a
120
(2)
c
118
104
26
f
130
Operating Margin
10.0%
12.0%
11.8%
10.7%
13.4%
Interest Expense
(15)
(15)
(15)
(14)
(14)
Other Non-Operating Income (Expense)
-
-
-
(1)
(1)
Income before Taxes
85
20
105
(2)
103
89
26
115
Provision for Income Taxes
(33)
2
b
(31)
0
e
(31)
(16)
(11)
g
(27)
Net Income
52
22
74
(2)
72
73
15
88
Diluted Shares
185.3
185.3
185.3
186.5
186.5
Diluted EPS
0.28
$
0.12
$
0.40
$
(0.01)
$
0.39
$
0.39
$
0.08
$
0.47
$
YTD 2011
YTD 2012
As Reported
Adjustments
Adjusted
Adjustments
Normalized
As Reported
Adjustments
Adjusted
Total Revenue
3,803
3,803
3,803
3,791
3,791
Operating Income
395
87
a
482
(28)
c
454
443
46
f
489
Operating Margin
10.4%
12.7%
11.9%
11.7%
12.9%
Interest Expense
(17)
(17)
(39)
d
(56)
(55)
(55)
Other Non-Operating Income (Expense)
5
5
5
-
-
Income before Taxes
383
87
470
(67)
403
388
46
434
Provision for Income Taxes
(104)
(8)
b
(112)
16
e
(96)
(91)
(13)
g
(104)
Net Income
279
79
358
(51)
307
297
33
330
Diluted Shares
185.3
185.3
186.2
186.2
Diluted EPS
1.50
$
0.43
$
1.93
$
(0.27)
$
1.66
$
1.59
$
0.18
$
1.77
$
a
One time separation costs
b
Net tax impact of above items, plus the addition of 2011 special tax items
c
Incremental stand alone costs incurred in 2012
d
Incremental interest expense on long-term debt incurred in 2012
e
Incremental interest expense and stand alone costs incurred in 2012 tax affected using the 2011
effective tax rate, as adjusted f
One time separation, restructuring & realignment costs
g
Tax impact of one time separation, restructuring & realignment costs and special tax items
Xylem Inc. Non-GAAP Reconciliation
Normalized and Adjusted Diluted EPS
($ Millions, except per share amounts)
185.3 |
 24
Non-GAAP Reconciliation: Operating Income
Q4
YTD
'12
'11
'12
'11
Total Revenue
• Total Xylem
969
1,003
3,791
3,803
• Water Infrastructure
637
679
2,425
2,416
• Applied Water
346
336
1,424
1,444
Operating Income
• Total Xylem
104
100
443
395
• Water Infrastructure
89
98
342
343
• Applied Water
35
27
170
160
Operating Margin
• Total Xylem
10.7%
10.0%
11.7%
10.4%
• Water Infrastructure
14.0%
14.4%
14.1%
14.2%
• Applied Water
10.1%
8.0%
11.9%
11.1%
Separation Costs
• Total Xylem
7
20
22
87
• Water Infrastructure
1
6
4
16
• Applied Water
-
4
2
13
Restructuring & Realignment Costs
• Total Xylem
19
-
24
-
• Water Infrastructure
15
-
19
-
• Applied Water
5
-
5
-
Adjusted Operating Income*
• Total Xylem
130
120
489
482
• Water Infrastructure
105
104
365
359
• Applied Water
40
31
177
173
Adjusted Operating Margin*
• Total Xylem
13.4%
12.0%
12.9%
12.7%
• Water Infrastructure
16.5%
15.3%
15.1%
14.9%
• Applied Water
11.6%
9.2%
12.4%
12.0%
*Adjusted Operating Income excludes non-recurring separation, restructuring &
realignment costs Xylem Inc. Non-GAAP Reconciliation
Adjusted Operating Income
($ Millions) |
  Non-GAAP Reconciliation: Free Cash Flow
25
2012
2011
Net Cash - Operating Activities
396
449
Capital Expenditures
(112)
(126)
Free Cash Flow, including separation costs
284
323
Cash Paid for Separation Costs (incl. Capex)
28
65
Free Cash Flow, excluding separation costs
312
388
Net Income
297
279
Separation Costs, net of tax (incl. tax friction)
16
72
Adjusted Net Income
313
351
Free Cash Flow Conversion
100%
111%
Xylem Inc. Non-GAAP Reconciliation
Net Cash - Operating Activities vs. Free Cash Flow
Years Ended December 31, 2012 and 2011
($ Millions)
Year Ended |
  26
Non-GAAP Reconciliation: Xylem EBITDA & Adj. EBITDA
Q1
Q2
Q3
Q4
YTD
Income Before Taxes
84
115
100
89
388
Interest Expense (Income),
net 13
13
12
13
51
Depreciation
23
21
24
26
94
Amortization
11
12
12
13
48
Stock
Compensation 5
5
6
6
22
EBITDA
136
166
154
147
603
Separation Costs
5
6
4
7
22
Restructuring &
Realignment Costs -
-
5
19
24
Adjusted EBITDA
141
172
163
173
649
Revenue
925
966
931
969
3,791
Adjusted EBITDA Margin
15.2%
17.8%
17.5%
17.9%
17.1%
Q1
Q2
Q3
Q4
YTD
Income Before Taxes
101
115
82
85
383
Interest Expense (Income),
net -
-
1
16
17
Depreciation
22
25
25
21
93
Amortization
11
10
11
12
44
Stock
Compensation 3
2
2
6
13
EBITDA
137
152
121
140
550
Separation Costs
3
18
46
20
87
Adjusted EBITDA
140
170
167
160
637
Revenue
890
971
939
1,003
3,803
Adjusted EBITDA Margin
15.7%
17.5%
17.8%
16.0%
16.7%
2011
Xylem Inc. Non-GAAP Reconciliation
EBITDA and Adjusted EBITDA by Quarter
Total Xylem
($ Millions)
2012 |
  27
Non-GAAP Reconciliation: Water Infrastructure EBITDA & Adj. EBITDA
Q1
Q2
Q3
Q4
YTD
Income Before Taxes
75
93
86
88
342
Interest Expense (Income),
net -
-
(1)
-
(1)
Depreciation
16
15
17
20
68
Amortization
10
9
10
10
39
Stock
Compensation 1
1
3
-
5
EBITDA
102
118
115
118
453
Separation Costs
2
1
-
1
4
Restructuring & Realignment Costs
-
-
4
15
19
Adjusted EBITDA
104
119
119
134
476
Revenue
584
609
595
637
2,425
Adjusted EBITDA Margin
17.8%
19.5%
20.0%
21.1%
19.6%
Q1
Q2
Q3
Q4
YTD
Income Before Taxes
65
93
88
99
345
Interest Expense (Income),
net -
-
(1)
-
(1)
Depreciation
16
19
19
14
68
Amortization
9
9
9
9
36
Stock
Compensation -
-
1
1
2
EBITDA
90
121
116
123
450
Separation Costs
-
2
8
6
16
Adjusted EBITDA
90
123
124
129
466
Revenue
551
602
584
679
2,416
Adjusted EBITDA Margin
16.3%
20.4%
21.2%
19.0%
19.3%
2011
Xylem Inc. Non-GAAP Reconciliation
EBITDA and Adjusted EBITDA by Quarter
Water Infrastructure
($ Millions)
2012 |
  28
Non-GAAP Reconciliation: Applied Water EBITDA & Adj. EBITDA
Q1
Q2
Q3
Q4
YTD
Income Before Taxes
40
52
43
35
170
Interest Expense (Income),
net -
-
-
-
-
Depreciation
6
6
6
5
23
Amortization
1
1
1
2
5
Stock
Compensation 1
-
2
(1)
2
EBITDA
48
59
52
41
200
Separation Costs
1
-
1
-
2
Restructuring & Realignment Costs
-
-
-
5
5
Adjusted
EBITDA 49
59
53
46
207
Revenue
355
373
350
346
1,424
Adjusted EBITDA Margin
13.8%
15.8%
15.1%
13.3%
14.5%
Q1
Q2
Q3
Q4
YTD
Income Before Taxes
46
51
37
25
159
Interest Expense (Income),
net -
-
-
-
-
Depreciation
6
6
6
7
25
Amortization
2
1
2
1
6
Stock
Compensation -
-
1
1
2
EBITDA
54
58
46
34
192
Separation Costs
-
-
9
4
13
Adjusted EBITDA
54
58
55
38
205
Revenue
355
385
368
336
1,444
Adjusted EBITDA Margin
15.2%
15.1%
14.9%
11.3%
14.2%
2011
Xylem Inc. Non-GAAP Reconciliation
EBITDA and Adjusted EBITDA by Quarter
Applied Water
($ Millions)
2012 |
 Non-GAAP Reconciliation: Guidance
29
Illustration of Mid Point Guidance
2013 Guidance
FY '12
FY '13
As Reported
Adjustments
Adjusted
As Projected
Adjustments
Adjusted
Total Revenue
3,791
3,791
3,915
3,915
Segment Operating Income
512
30
a
542
487
65
d
552
Segment Operating Margin
13.5%
14.3%
12.4%
14.1%
Corporate Expense
69
(16)
b
53
59
-
59
Operating Income
443
46
489
428
65
493
Operating Margin
11.7%
12.9%
10.9%
12.6%
Interest Expense
(55)
(55)
(55)
(55)
Other Non-Operating Income (Expense)
-
-
(2)
(2)
Income before Taxes
388
46
434
371
65
436
Provision for Income Taxes
(91)
(13)
c
(104)
(73)
(19)
c
(92)
Net Income
297
33
330
298
46
344
Diluted Shares
186.2
186.2
186.4
186.4
Diluted EPS
1.59
$
0.18
$
1.77
$
1.60
0.25
1.85
a
One time separation, restructuring and realignment costs incurred at the segment level
b
One time separation, restructuring and realignment costs incurred at the corporate level
c
Net tax impact of above items, plus the addition of special tax items
d
Restructuring and realignment costs incurred at the segment level
Xylem Inc. Non-GAAP Reconciliation
Guidance
($ Millions, except per share amounts)
$
$
$
|
 Non-GAAP Reconciliation: Adj. Operating Income & Margin
30
Mid Point Guidance
2008
2009
2010
2011
2012
2013E
Revenue
3,291
2,849
3,202
3,803
3,791
3,915
Operating Income
315
276
388
395
443
428
Operating Margin
9.6%
9.7%
12.1%
10.4%
11.7%
10.9%
Restructuring & Realignment
41
31
15
-
24
65
Separation Costs
-
-
-
87
22
-
Adjusted Operating Income
356
307
403
482
489
493
Adjusted Operating Margin
10.8%
10.8%
12.6%
12.7%
12.9%
12.6%
Standalone Costs
-
-
-
5
28
-
Adj. Operating Income, excl. Standalone
Costs 356
307
403
487
517
493
Adjusted Operating Margin, excl.
Standalone Costs 10.8%
10.8%
12.6%
12.8%
13.6%
12.6%
Xylem Inc. Non-GAAP Reconciliation
Adjusted Operating Income
($ Millions) |
 31
NYSE: XYL
Phil De Sousa, Investor Relations Officer
(914) 323-5930
Janice Tedesco, Investor Relations Coordinator
(914) 323-5931
http://investors.xyleminc.com
You may scan the QR code for direct
access to the Xylem IR app for iPad®
mobile devices.
Apple and iPad are registered trademarks
of Apple Inc. ` |