Attached files
| file | filename |
|---|---|
| 8-K - CURRENT REPORT - GOLUB CAPITAL BDC, Inc. | v334035_8k.htm |
| EX-99.1 - PRESS RELEASE - GOLUB CAPITAL BDC, Inc. | v334035_ex99-1.pdf |
Golub Capital BDC, Inc. Investor Presentation
Quarter Ended December 31, 2012
www.golubcapitalbdc.com

Disclaimer
Some of the statements in this presentation constitute forward-looking statements, which relate to future events or our future performance or financial condition. The forward-looking statements contained in this presentation involve risks and uncertainties, including statements as to: our future operating results; our business
prospects and the prospects of our portfolio companies; the effect of investments that we expect to make; our contractual arrangements and relationships with third parties; actual and potential conflicts of interest with GC Advisors LLC ("GC Advisors"), our investment adviser, and other affiliates of Golub Capital Incorporated and Golub Capital LLC (collectively, "Golub Capital"); the dependence of our future success on the general economy and its effect on the industries in which we invest; the ability of our portfolio companies to achieve their objectives; the use of borrowed money to finance a portion of our investments; the adequacy of our financing sources and working capital; the timing of cash flows, if any, from the operations of our portfolio companies; the ability of GC Advisors to locate suitable investments for us and to monitor and administer our investments; the ability of GC Advisors or its affiliates to attract and retain highly talented professionals; our ability to qualify and maintain our qualification as a regulated investment company and as a business development company; the impact on our business of the Dodd-Frank Wall Street Reform and Consumer Protection Act and the rules and regulations issued thereunder; and the effect of changes to tax legislation and our tax position.
Such forward-looking statements may include statements preceded by, followed by or that otherwise include the words “may,” “might,” “will,” “intend,” “should,” “could,” “can,” “would,” “expect,” “believe,” “estimate,” “anticipate,” “predict,” “potential,” “plan” or similar words.
We have based the forward-looking statements included in this presentation on information available to us on the date of this presentation, and we assume no obligation to update any such forward-looking statements. Actual results could differ materially from those implied or expressed in our forward-looking statements for any reason, and future results could differ materially from historical performance. Although we undertake no obligation to revise or update any forward-looking statements, whether as a result of new information, future events or otherwise, you are advised to consult any additional disclosures that we may make directly to you or through reports that we have filed or in the future may file with the Securities and Exchange Commission (“SEC”), including annual reports on Form 10-K, quarterly reports on Form 10-Q and current reports on Form 8-K.
This presentation contains statistics and other data that have been obtained from or compiled from information made available by third-party service providers. We have not independently verified such statistics or data.
Summary of Quarterly Results
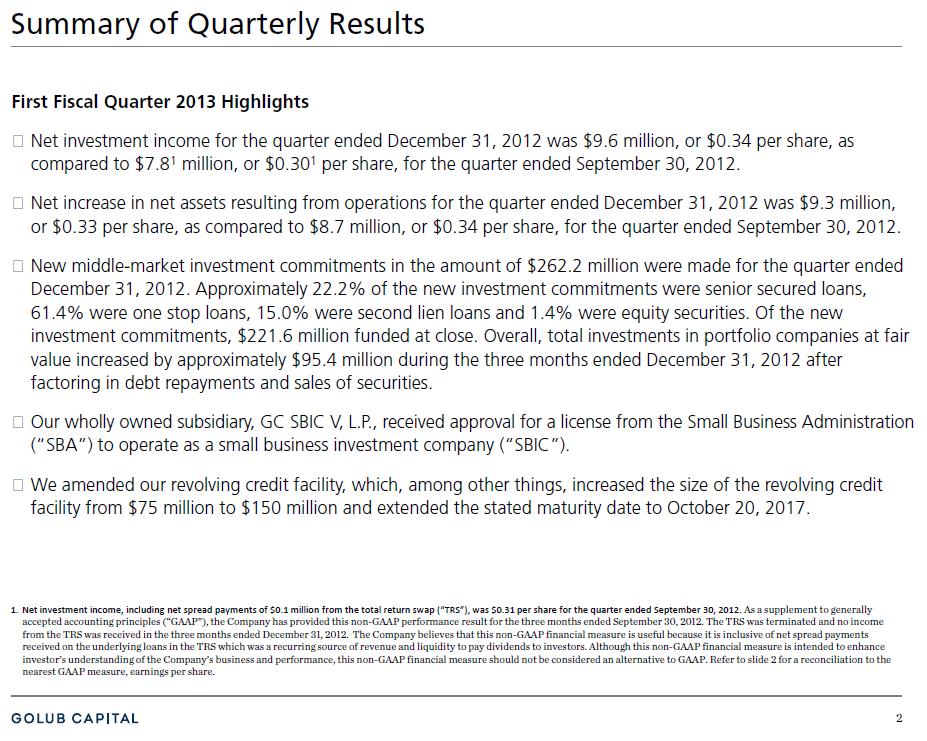
First Fiscal Quarter 2013 Highlights
Net investment income for the quarter ended December 31, 2012 was $9.6 million, or $0.34 per share, as compared to $7.81 million, or $0.301 per share, for the quarter ended September 30, 2012.
Net increase in net assets resulting from operations for the quarter ended December 31, 2012 was $9.3 million, or $0.33 per share, as compared to $8.7 million, or $0.34 per share, for the quarter ended September 30, 2012.
New middle-market investment commitments in the amount of $262.2 million were made for the quarter ended December 31, 2012. Approximately 22.2% of the new investment commitments were senior secured loans, 61.4% were one stop loans, 15.0% were second lien loans and 1.4% were equity securities. Of the new investment commitments, $221.6 million funded at close. Overall, total investments in portfolio companies at fair value increased by approximately $95.4 million during the three months ended December 31, 2012 after factoring in debt repayments and sales of securities.
Our wholly owned subsidiary, GC SBIC V, L.P., received approval for a license from the Small Business Administration (“SBA”) to operate as a small business investment company (“SBIC”).
We amended our revolving credit facility, which, among other things, increased the size of the revolving credit facility from $75 million to $150 million and extended the stated maturity date to October 20, 2017.
| 1. | Net investment income, including net spread payments of $0.1 million from the total return swap (“TRS”), was $0.31 per share for the quarter ended September 30, 2012. As a supplement to generally accepted accounting principles (“GAAP”), the Company has provided this non-GAAP performance result for the three months ended September 30, 2012. The TRS was terminated and no income from the TRS was received in the three months ended December 31, 2012. The Company believes that this non-GAAP financial measure is useful because it is inclusive of net spread payments received on the underlying loans in the TRS which was a recurring source of revenue and liquidity to pay dividends to investors. Although this non-GAAP financial measure is intended to enhance investor’s understanding of the Company’s business and performance, this non-GAAP financial measure should not be considered an alternative to GAAP. Refer to slide 2 for a reconciliation to the nearest GAAP measure, earnings per share. |
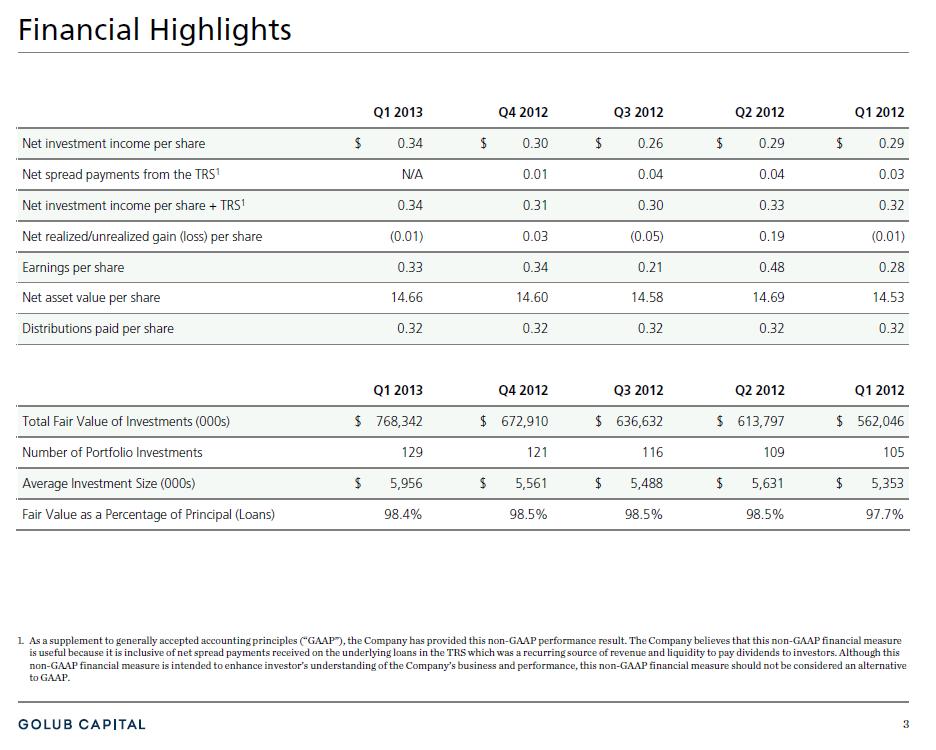
Financial Highlights
As a supplement to generally accepted accounting principles (“GAAP”), the Company has provided this non-GAAP performance result. The Company believes that this non-GAAP financial measure is useful because it is inclusive of net spread payments received on the underlying loans in the TRS which was a recurring source of revenue and liquidity to pay dividends to investors. Although this non-GAAP financial measure is intended to enhance investor’s understanding of the Company’s business and performance, this non-GAAP financial measure should not be considered an alternative to GAAP.
Summary of Portfolio Highlights
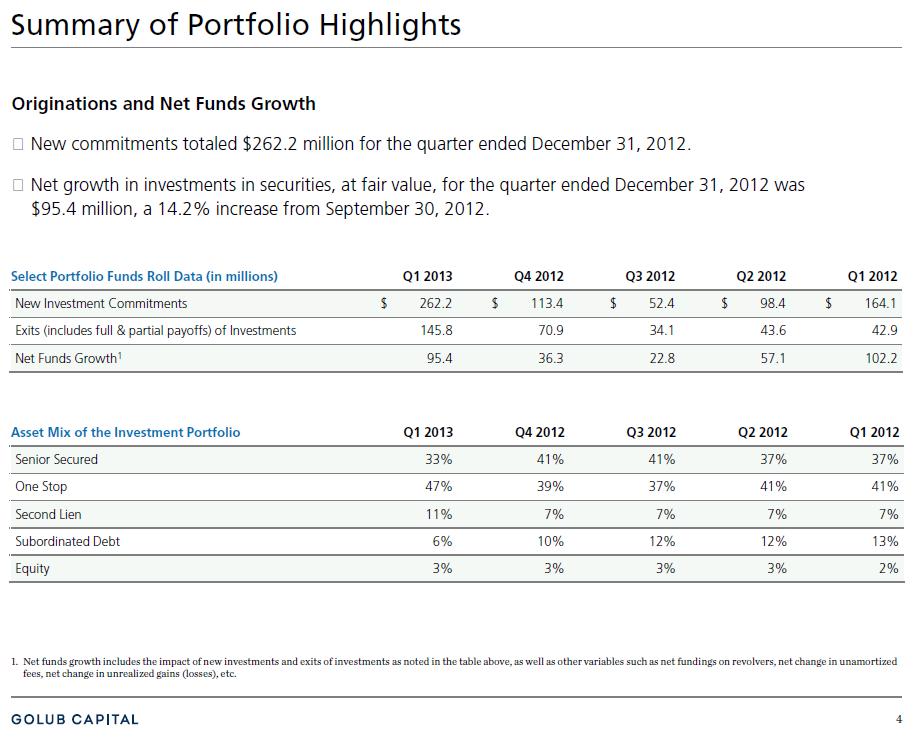
Originations and Net Funds Growth
New commitments totaled $262.2 million for the quarter ended December 31, 2012.
Net growth in investments in securities, at fair value, for the quarter ended December 31, 2012 was $95.4 million, a 14.2% increase from September 30, 2012.
Net funds growth includes the impact of new investments and exits of investments as noted in the table above, as well as other variables such as net fundings on revolvers, net change in unamortized fees, net change in unrealized gains (losses), etc.
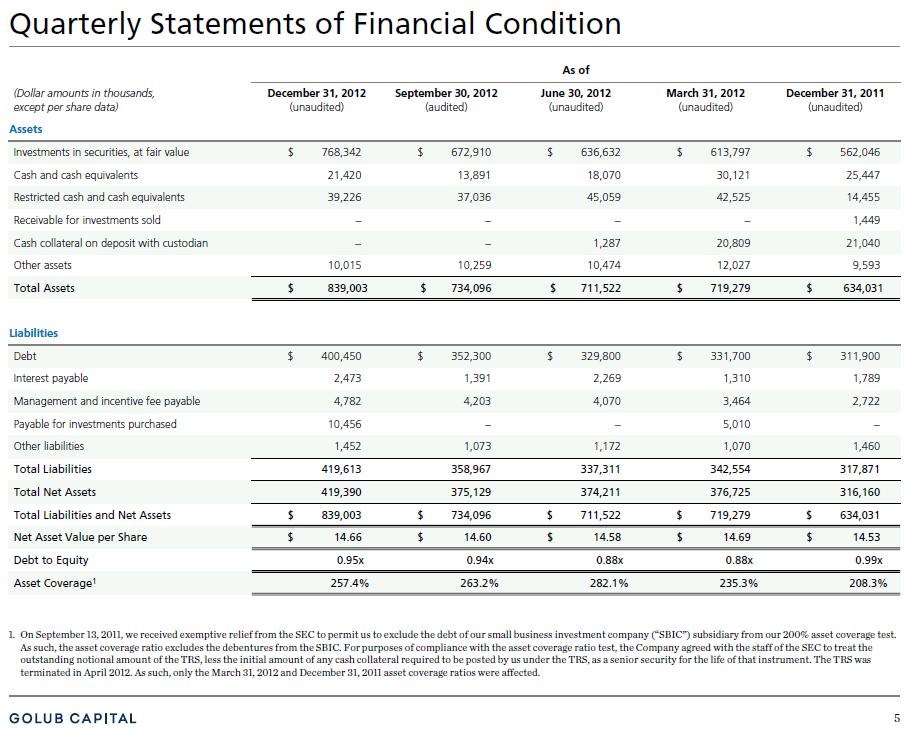
Quarterly Statements of Financial Condition
On September 13, 2011, we received exemptive relief from the SEC to permit us to exclude the debt of our small business investment company (“SBIC”) subsidiary from our 200% asset coverage test. As such, the asset coverage ratio excludes the debentures from the SBIC. For purposes of compliance with the asset coverage ratio test, the Company agreed with the staff of the SEC to treat the outstanding notional amount of the TRS, less the initial amount of any cash collateral required to be posted by us under the TRS, as a senior security for the life of that instrument. The TRS was terminated in April 2012. As such, only the March 31, 2012 and December 31, 2011 asset coverage ratios were affected.
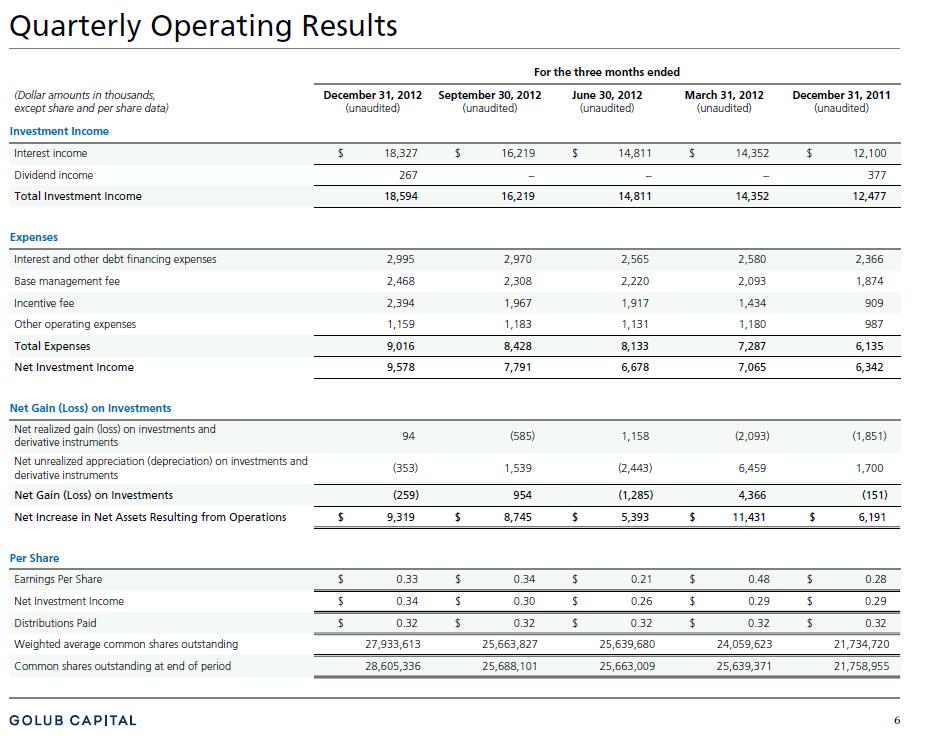
Quarterly Operating Results
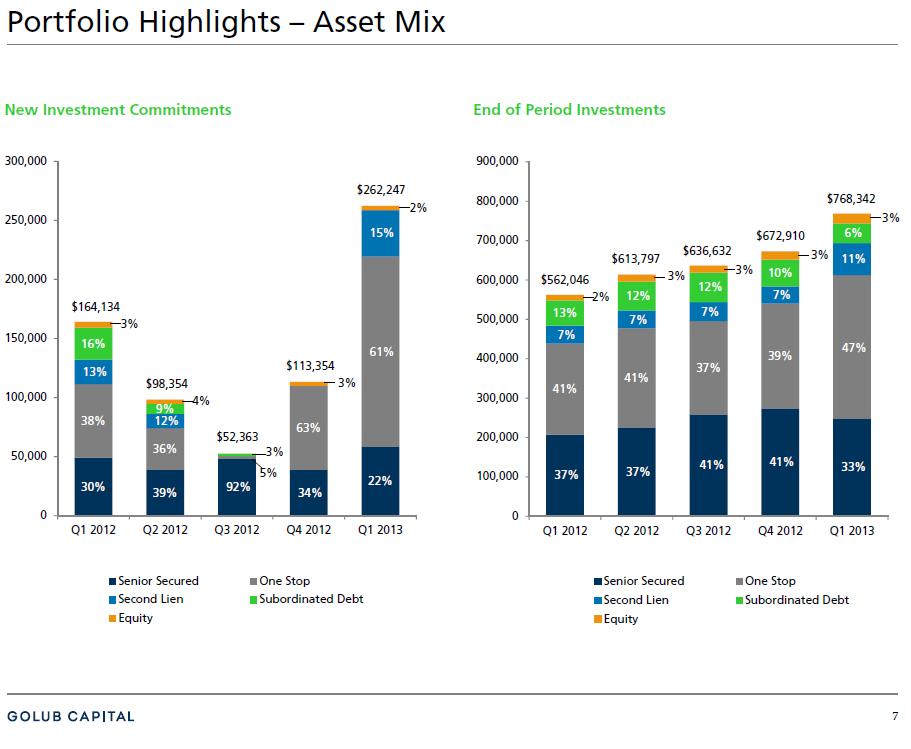
Portfolio Highlights – Asset Mix
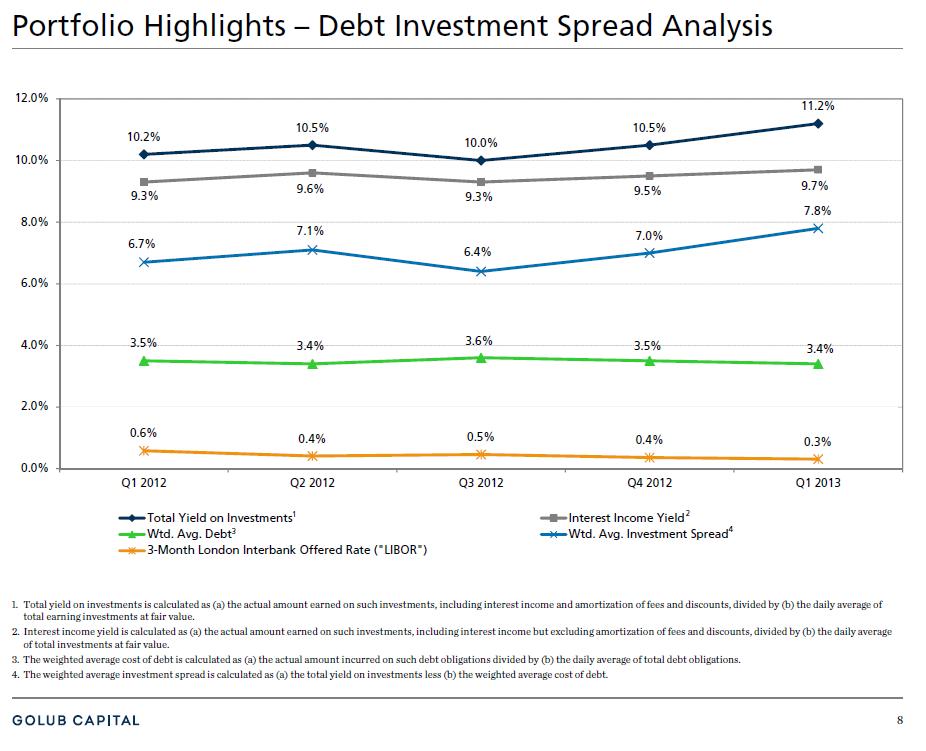
Portfolio Highlights – Debt Investment Spread Analysis
| 1. | Total yield on investments is calculated as (a) the actual amount earned on such investments, including interest income and amortization of fees and discounts, divided by (b) the daily average of total earning investments at fair value. |
| 2. | Interest income yield is calculated as (a) the actual amount earned on such investments, including interest income but excluding amortization of fees and discounts, divided by (b) the daily average of total investments at fair value. |
| 3. | The weighted average cost of debt is calculated as (a) the actual amount incurred on such debt obligations divided by (b) the daily average of total debt obligations. |
4. The weighted average investment spread is calculated as (a) the total yield on investments less (b) the weighted average cost of debt.
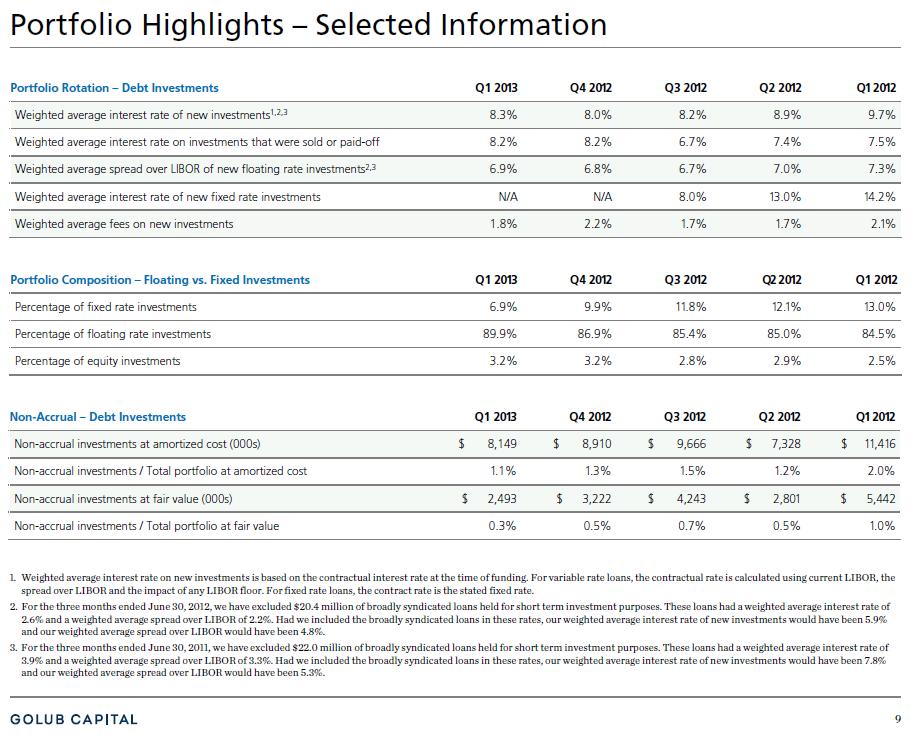
Portfolio Highlights – Selected Information
| 1. | Weighted average interest rate on new investments is based on the contractual interest rate at the time of funding. For variable rate loans, the contractual rate is calculated using current LIBOR, the spread over LIBOR and the impact of any LIBOR floor. For fixed rate loans, the contract rate is the stated fixed rate. |
| 2. | For the three months ended June 30, 2012, we have excluded $20.4 million of broadly syndicated loans held for short term investment purposes. These loans had a weighted average interest rate of 2.6% and a weighted average spread over LIBOR of 2.2%. Had we included the broadly syndicated loans in these rates, our weighted average interest rate of new investments would have been 5.9% and our weighted average spread over LIBOR would have been 4.8%. |
3. For the three months ended June 30, 2011, we have excluded $22.0 million of broadly syndicated loans held for short term investment purposes. These loans had a weighted average interest rate of 3.9% and a weighted average spread over LIBOR of 3.3%. Had we included the broadly syndicated loans in these rates, our weighted average interest rate of new investments would have been 7.8% and our weighted average spread over LIBOR would have been 5.3%.
Credit Quality
Credit Quality – Investment Portfolio
Fundamental credit quality remains strong with non-earning assets as a percentage of total investments at fair value improving from 0.5% at September 30, 2012 to 0.3% at December 31, 2012.
Performance ratings on the investment portfolio have remained stable for the past several quarters and over 90.0% of the investments in our portfolio had a risk rating of 4 or higher as of December 31, 2012.
The fair value of debt investments as a percentage of principal amount remained stable at 98.4% for the period ended December 31, 2012.
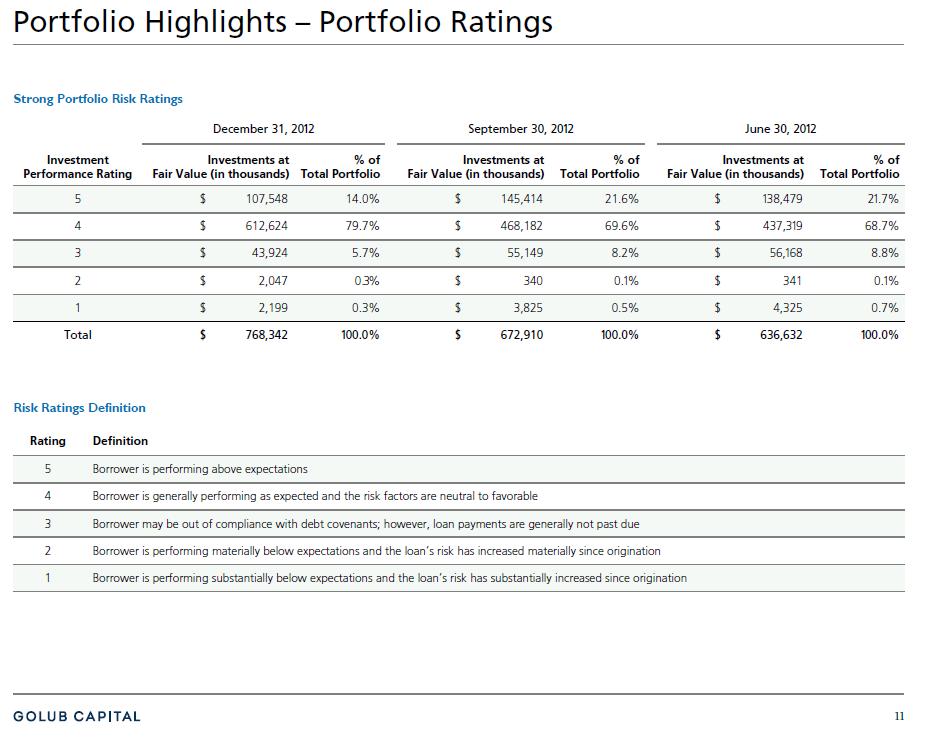 Portfolio Highlights –
Portfolio Ratings
Portfolio Highlights –
Portfolio Ratings
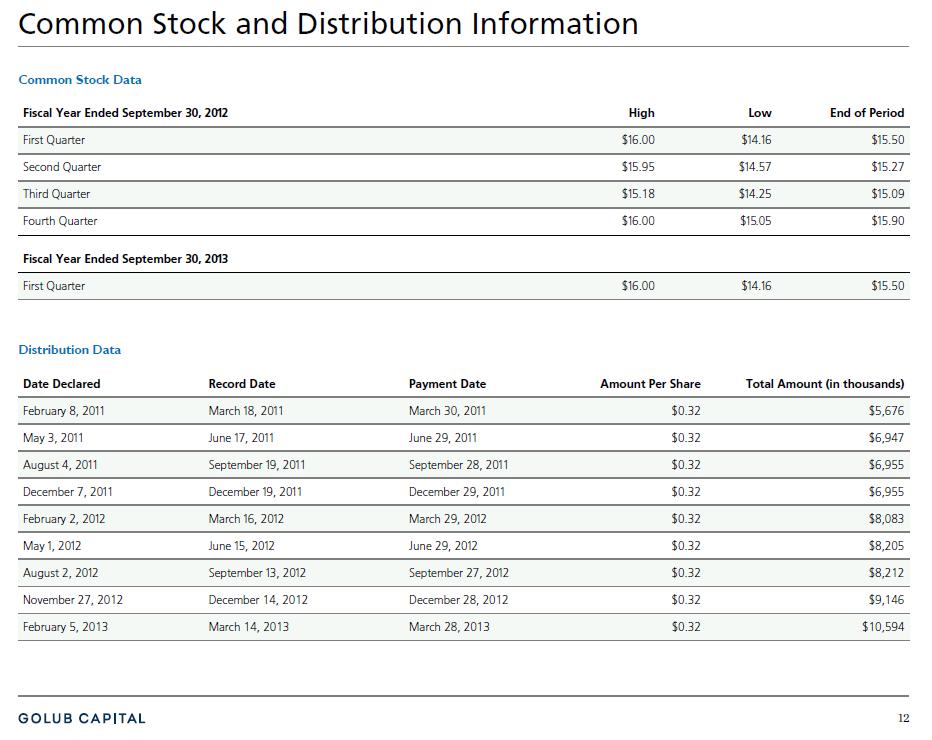
Common Stock and Distribution Information

Liquidity and Investment Capacity
Cash and Cash Equivalents
Unrestricted cash totaled $21.4 million as of December 31, 2012.
Restricted cash totaled $39.2 million as of December 31, 2012. Restricted cash was held in our securitization vehicle, SBIC subsidiaries and our revolving credit facility and is available for new investments that qualify for acquisition by these entities.
Senior Secured Revolving Credit Facility
The revolving credit facility was amended effective October 21, 2012 to extend the reinvestment period through October 21, 2013 and extend the maturity date to October 20, 2017. On December 13, 2012, the revolving credit facility was amended to increase the size from $75.0 million to $150.0 million.
As of December 31, 2012, subject to leverage and borrowing base restrictions, we had approximately $58.5 million available for additional borrowings on our revolving credit facility.
SBIC Financing
As of December 31, 2012, we had $15.0 million in approved and available debentures through our wholly-owned subsidiary, GC SBIC IV, L.P. The commitment may be drawn upon subject to customary Small Business Association (“SBA”) approval procedures. After this commitment is fully drawn, GC SBIC IV, L.P. will have $150.0 million in debentures outstanding which is the current regulatory limit for an SBIC licensed entity
SBIC Financing (continued)
On December 5, 2012, our wholly owned subsidiary, GC SBIC V, L.P., received approval for a license from the SBA to operate as an SBIC. This is the second SBIC license granted to the Company through its SBIC subsidiaries. This second SBIC license will provide the Company with up to an additional $75.0 million of attractive long-term debt capital based on current regulatory limits.
On January 4, 2013, GC SBIC V, L.P. received a $37.5 million debenture capital commitment from the SBA. The commitment may be drawn upon subject to customary regulatory requirements including, but not limited to, an examination by the SBA.
Public Offerings
On October 16, 2012, we priced a public offering of 2,600,000 shares of our common stock at a public offering price of $15.58 per share, raising approximately $40.5 million in gross proceeds. Wells Fargo Securities, LLC and UBS Securities LLC acted as joint book-running managers for the offering. On October 19, 2012, the transaction closed, the shares were issued, and proceeds, net of offering costs but before expenses, of $39.4 million were received. On November 14, 2012, we sold an additional 294,120 shares pursuant to the underwriters’ partial exercise of the over-allotment option and we received net proceeds, before expenses, of $4.4 million.
On January 15, 2013, we priced a public offering of 4,500,000 shares of its common stock at a public offering price of $15.87 per share, raising approximately $71.4 million in gross proceeds. Wells Fargo Securities, Morgan Stanley and UBS Investment Bank acted as joint book-running managers for the offering. The co-managers were RBC Capital Markets and Stifel Nicolaus Weisel. On January 18, 2013, the transaction closed, the shares were issued, and proceeds, net of offering costs but before expenses, of $69.1 million were received. We have also granted the underwriters an option to purchase up to an additional 675,000 shares of common stock to cover over-allotments, if any.

Other Matters
A trust organized by Golub Capital for the purpose of awarding incentive compensation purchased an aggregate of $3.0 million of shares in our October 2012 offering and $1.0 million of shares in our January 2013 offering at the respective public offering prices.