Attached files
| file | filename |
|---|---|
| 8-K - FORM 8-K - EXELON GENERATION CO LLC | d477195d8k.htm |
| EX-99.1 - EXHIBIT 99.1 - EXELON GENERATION CO LLC | d477195dex991.htm |
 Earnings Conference Call
4 Quarter 2012
February 7
, 2013
th
th
Exhibit 99.2 |
 Cautionary Statements Regarding
Forward-Looking Information
1
2012 4Q Earnings Release Slides
This presentation contains certain forward-looking statements within the
meaning of the Private Securities Litigation Reform Act of 1995, that
are subject to risks and uncertainties. The factors that could cause actual
results to differ materially from the forward-looking statements made by
Exelon Corporation, Commonwealth Edison Company, PECO Energy Company,
Baltimore Gas and Electric Company and Exelon Generation Company, LLC
(Registrants) include those factors discussed herein, as well as the items discussed in (1) Exelon’s 2011
Annual Report on Form 10-K in (a) ITEM 1A. Risk Factors, (b) ITEM 7.
Management’s Discussion and Analysis of Financial Condition and
Results of Operations and (c) ITEM 8. Financial Statements and Supplementary Data:
Note 18; (2) Constellation Energy Group’s 2011 Annual Report on Form
10-K in (a) ITEM 1A. Risk Factors, (b) ITEM 7. Management’s
Discussion and Analysis of Financial Condition and Results of Operations and (c) ITEM 8.
Financial
Statements
and
Supplementary
Data:
Note
12;
(3)
the
Registrants’
Third
Quarter
2012
Quarterly
Report on Form 10-Q in (a) Part II, Other Information, ITEM 1A. Risk
Factors; (b) Part 1, Financial Information, ITEM 2. Management’s
Discussion and Analysis of Financial Condition and Results of Operations and (c) Part I,
Financial Information, ITEM 1. Financial Statements: Note 16; and (4) other
factors discussed in filings with the SEC
by
the
Registrants.
Readers
are
cautioned
not
to
place
undue
reliance
on
these
forward-looking
statements,
which apply only as of the date of this presentation. None of the Registrants
undertakes any obligation to publicly release any revision to its
forward-looking statements to reflect events or circumstances after the date
of this presentation.
2012 4Q Earnings Release Slides |
 •
Realized
$170M
of
O&M
synergies
and
on
track
to
achieve
$550M
in
O&M
synergies starting in 2014
•
Closed on Maryland asset divestitures
related to merger commitments in 4Q
2012
•
ICC re-hearing in October granted
recovery on pension asset; ComEd
appeal ongoing for other disallowed
items
•
Worked with PJM and stakeholders to
propose MOPR modifications
•
Rate case progressing at BGE
•
Exemplary storm restoration efforts at
PECO and BGE in response to
Hurricane Sandy
•
2012 nuclear capacity factor of
92.7%
•
Q4 2012 operating EPS of $0.64 per
share
(1)
•
2012 operating EPS of $2.85 per
share
(1)
in line with expectations
•
Challenging power market conditions
2012 4Q Earnings Release Slides
2
2012 In Review
2013 Expectations:
•
Expect
to
deliver
full-year
2013
operating
earnings
within
guidance
range
of
$2.35
-
$2.65/share
(1)
•
Expect
1Q
2013
operating
earnings
within
guidance
range
of
$0.60
-
$0.70/share
(1)
•
Strengthen
credit
metrics
and
balance
sheet
•
Complete
remaining
integration
activities,
primarily
IT
related
Regulatory
Process
Financial
Summary
Merger
Execution
Operating
Excellence
(1)
Refer to Earnings Release Attachments for additional details and to the
Appendix for a reconciliation of adjusted (non-GAAP) operating EPS to GAAP EPS. |
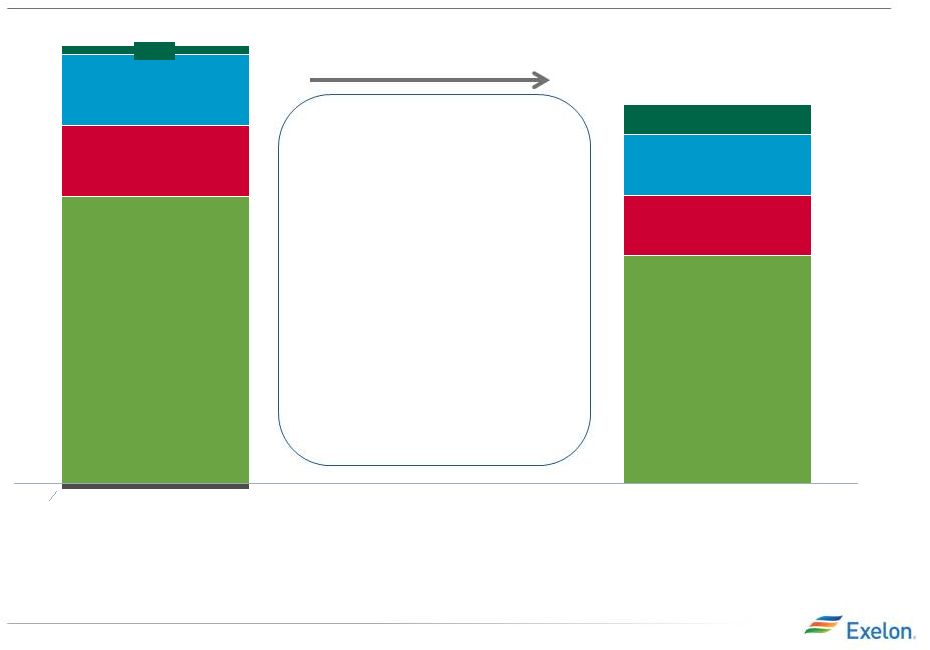
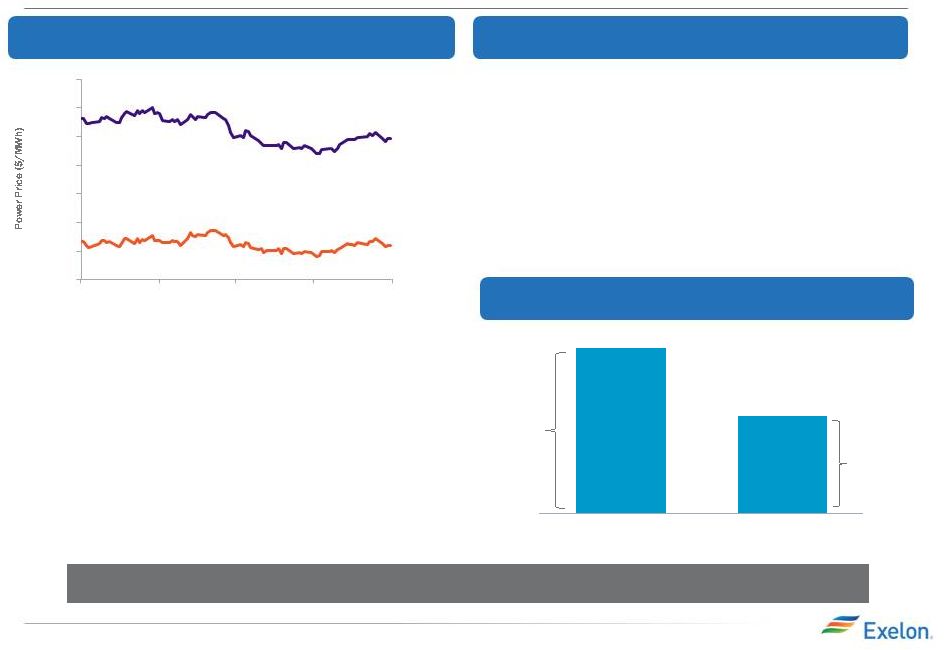 Exelon’s Revised Dividend
•
Continue to believe in $3-$6/MWh
upside in PJM but timing of upside is
difficult to predict
•
Expected heat rate upside from coal
retirements not yet reflected in forward
prices
2012 4Q Earnings Release Slides
3
Power market upside has not yet materialized
Sizing dividend to align with business mix
•
Continue to pay a healthy, sustainable
dividend
•
Provide balance sheet strength to remain
investment-grade through stressed
commodity cycles
•
Provide capacity to invest in growth
•
Provide flexibility to hedging to better
align with market liquidity
Sustainable dividend of $1.24/share on an annualized basis
$0.31
Starting in 2Q 2013
1Q 2013
$0.525
Dividend rate change beginning in 2Q 2013
Dividend per
share payable
on March 8,
2013 to
holders as of
February 19,
2013
Quarterly
dividend
per share
rate
beginning
2Q 2013
(1)
(1)
Dividend declaration is subject to Board of Directors approval.
$44.00
$42.00
$40.00
$38.00
$36.00
$34.00
$32.00
$30.00
2/1/2013
1/1/2013
12/1/2012
11/1/2012
10/1/2012
2015 PJM-W
2015 NiHub
$32.41
$32.66
$39.87
$41.28 |
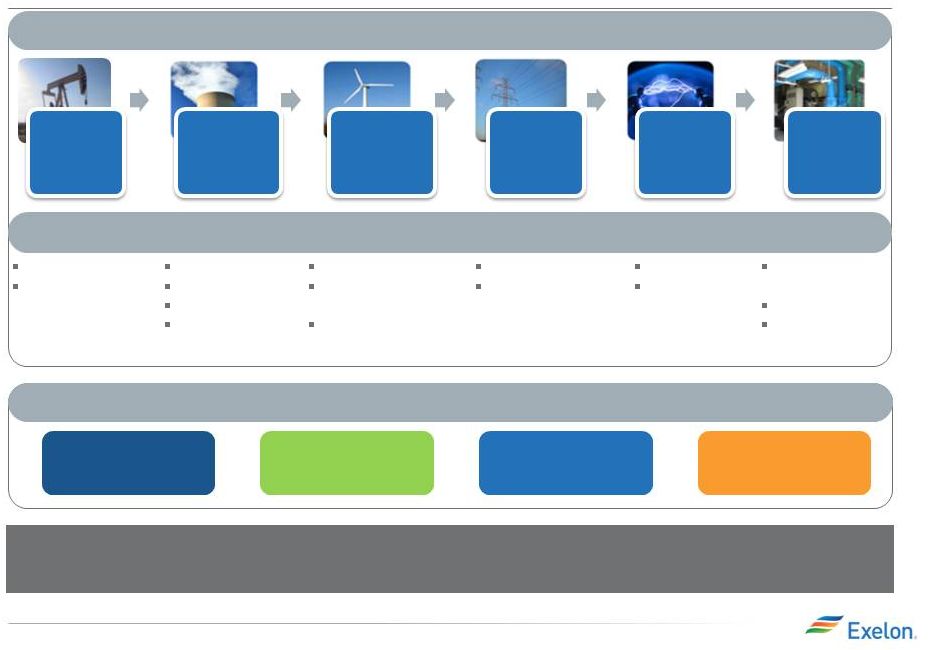 Presence across the entire energy value chain
Unique Combination of Scale, Scope and Flexibility to Invest
Across The Value Chain with Metrics Oriented Operational Model
Operational
Excellence
Regulatory
Advocacy
Disciplined Growth
& Investment
Financial
Discipline
Leverage platform to create value through core competencies
2012 4Q Earnings Release Slides
4
Upstream Gas
Downstream Gas
(Pipelines and
Storage)
Wolf Hollow
Navasota
Boston Gen
Nuclear Uprates
AVSR1
~750 MW of John
Deere Wind
Greater than 500
MW of organic build
Smart Grid
Chicago West
Loop Transmission
MX Energy
StarTex
Demand
Response
Energy Efficiency
Rooftop solar
Available cash to be opportunistically invested across the value
chain in
sustainable growth
Track record of successful investment
Fuels
Conventional
Generation
Renewable
Generation
Electric &
Gas Utilities
Retail
Beyond The
Meter |
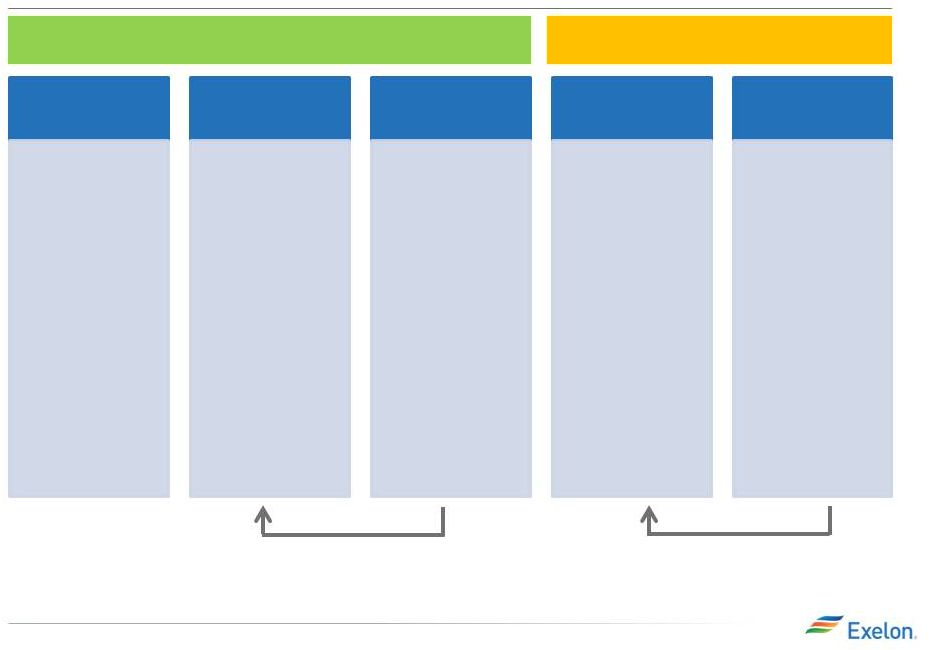
 Sizing Exelon’s Dividend to Fit the Business Model
Financial Priorities
#1: Remain
investment grade
•
Maintain key credit metrics above target ranges under both market and
stress conditions to maintain investment grade ratings
•
Shareholder value of maintaining investment grade:
•
Increases ability to participate in commercial business opportunities
•
Lowers collateral requirements
•
Reliable and cost efficient access to the capital markets
•
Increases business and financial flexibility
#2: Creating value for
shareholders
(less)
(less)
equals
Cash from Operations
Base CapEx / Nuclear Fuel
Dividend
Available Cash and Balance Sheet Capacity
Use remaining cash flow and capacity to invest in
growth and return value to shareholders
5
2012 4Q Earnings Release Slides
Dividend sized to satisfy key financial priorities under a range
of market outcomes
2012 4Q Earnings Release Slides |
 6
Dividend Policy
Enables
Exelon
and
its
operating
companies
to
maintain
investment
grade
credit
ratings
Is
sustainable
through
all
points
in
the
commodity
cycle,
particularly
the
stress
cases
Is
supported
and
funded
by
cash
flows
from
both
the
regulated
utilities
and
unregulated
business
Provides
room
to
grow
the
company
through
investments
in
value-enhancing
growth
opportunities
Provides
opportunities
to
grow
the
dividend
over
time,
supported
largely
by
investments
and
associated
growth
in
the
earnings
power
of
the
regulated
utilities
(subject
to
Board
discretion)
Allows
for
a
competitive
value
proposition
that,
coupled
with
earnings
growth,
delivers
compelling
shareholder returns over time
(1)
Free cash flow defined as Cash from Operations less Capex and Dividend.
2012 4Q Earnings Release Slides
Stress Scenario Considerations
Dividend Sizing Objectives
•
Constant $3/mmbtu natural gas
o
Power prices at or below those experienced
during August 2012
•
Commercial and new business risks
•
Other one-time significant financial or
operational risks
•
Utilities: Long-term payout target of 65-70%,
which is in-line with regulated utility peers
•
ExGen:
o
Credit metrics supportive of mid to high BBB
rating
o
Free Cash Flow positive
(1) |
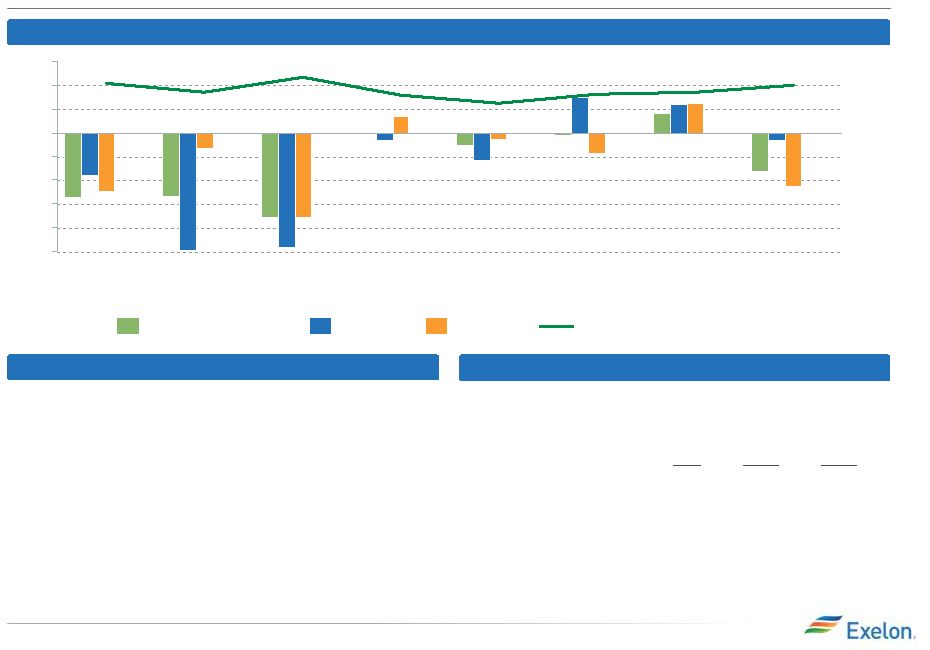
 2013 Operating Earnings Guidance
Key Year-over-Year Drivers
•
2012 Stub Earnings: $0.12
•
Lower ExGen RNF primarily due to
prices, offset by non-power revenue,
capacity revenue and growth projects:
$(0.27)
•
Higher ComEd RNF primarily from DST
revenues due to formula rate: $0.05
•
Higher BGE RNF: $0.06
•
Higher O&M primarily at ExGen driven by
inflation, pension, and non-power cost of
sales, offset by synergies: $(0.10)
•
Higher depreciation primarily at ExGen
due to new projects placed in service:
$(0.08)
•
Share dilution
(3)
: $(0.13)
7
2012 4Q Earnings Release Slides
PECO
BGE
ExGen
ComEd
PECO
BGE
2013 Guidance
$2.35 -
$2.65
(2)
$1.40 -
$1.60
$0.35 -
$0.45
$0.35 -
$0.45
$0.15 -
$0.25
HoldCo
ExGen
ComEd
2012 Actual
$2.85
(1)
1.89
$0.47
$0.47
$0.06
(1)
2012 results include Constellation Energy and BGE earnings for March 12 –
December 31. Based on expected 2012 average outstanding shares of 819M.Refer to
Earnings Release Attachments for additional details and to the Appendix for a
reconciliation of adjusted (non-GAAP) operating EPS to GAAP EPS.
(2)
2013 earnings guidance based on expected average outstanding shares of 860M.
Earnings guidance for OpCos may not add up to consolidated EPS guidance.
(3)
Shares Outstanding (diluted) are 819M in 2012 and 860M in 2013. 2013 represents
full-year of shares outstanding resulting from March 2012 merger with
Constellation. |
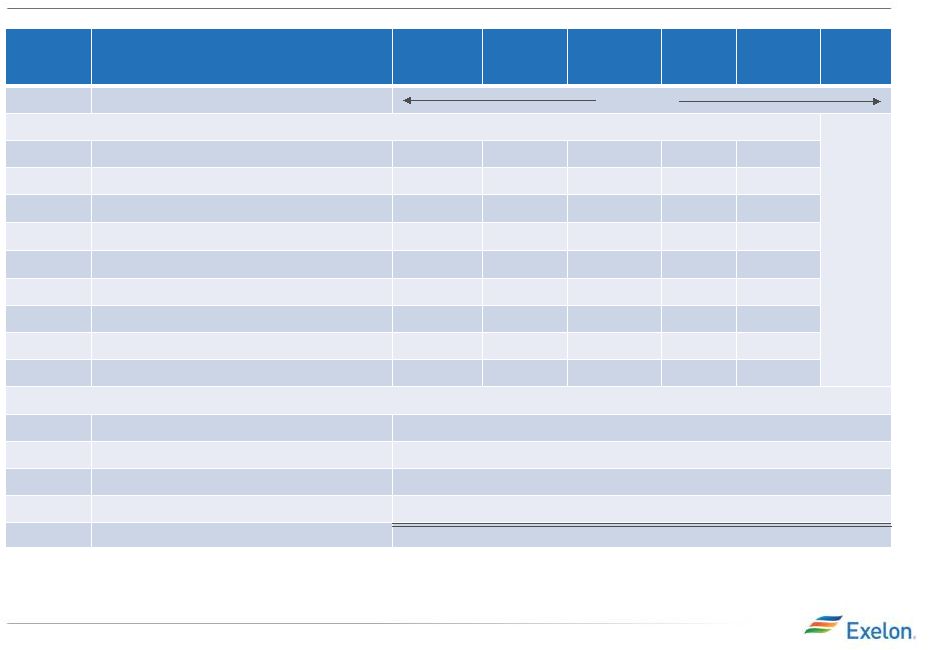
 8
Exelon Generation: Gross Margin Update
December 31, 2012
September 30, 2012
Gross Margin Category ($M)
(1) (2)
2013
2014
2015
2013
2014
2015
Open Gross Margin
(3)
(including South, West, Canada hedged gross margin)
$5,550
$5,900
$6,050
$5,750
$6,050
$6,200
Mark-to-Market of Hedges
(3,4)
$1,650
$650
$300
$1,350
$500
$250
Power New Business / To Go
$400
$650
$850
$500
$750
$950
Non-Power Margins Executed
$200
$100
$50
$150
$100
$50
Non-Power New Business / To Go
$400
$500
$550
$450
$500
$550
Total Gross Margin
$8,200
$7,800
$7,800
$8,200
$7,900
$8,000
Key Highlights of 4Q 2012
•
Forward
power
markets
experienced
further
downward
pressure
during
the
4
quarter
–
Forward
power
prices
still
do
not
reflect
the
upside
that
we
are
forecasting
–
Continue
to
optimize
our
hedging
of
the
portfolio
by
falling
behind
ratable
in
the
Midwest
and
utilizing
cross-commodity and option hedges
•
Power New Business To-Go has been lowered by a combination of executing on
targets and further reductions to our retail load volumes and margins,
the result of heightened competition and low market volatility
2012 4Q Earnings Release Slides
1)
Gross margin rounded to nearest $50M.
2)
Gross margin does not include revenue related to decommissioning, gross
receipts tax, Exelon Nuclear Partners and entities consolidated solely
as a result of the application of FIN 46R.
3)
Includes CENG Joint Venture.
4)
Mark to Market of Hedges assumes mid-point of hedge percentages. th |
 9
2013 Cash Flow Summary
•
Expect Cash from Operations of ~$6.0B in 2013
–
Includes $550M for pension/OPEB contribution
•
CapEx in line with estimates provided at 2012 EEI Conference
–
Higher nuclear fuel CapEx of $75M in 2013 related to discounted buying
opportunity accelerated from 2014
–
ExGen CapEx includes ~$350M of Fukushima-
related costs for 2013-2017.
Does not include estimate of $15 -
20 million per unit for filtered vents at
eleven mark 1 and 2 units, if required.
•
Financing plan for utilities comprised of debt refinancing
•
ExGen financing plan includes retirement of $450M hybrid security, DOE
loan draws for AVSR1 and project financing for existing wind assets
2012 4Q Earnings Release Slides |
 10
Exelon Generation Disclosures
December 31, 2012
2012 4Q Earnings Release Slides |
 11
Portfolio Management Strategy
Protect Balance Sheet
Ensure Earnings Stability
Create Value
Exercising Market Views
Purely ratable
Actual hedge %
Market views on timing, product
allocation and regional spreads
reflected in actual hedge %
High End of Profit
Low End of Profit
% Hedged
Open Generation
with LT Contracts
Portfolio Management &
Optimization
Portfolio Management Over Time
Align Hedging & Financials
Establishing Minimum Hedge Targets
2012 4Q Earnings Release Slides
Strategic Policy Alignment
•Aligns hedging program with
financial policies and financial
outlook
•Establish minimum hedge targets
to meet financial objectives of the
company (dividend, credit rating)
•Hedge enough commodity risk to
meet future cash requirements
under a stress scenario
Three-Year Ratable Hedging
•Ensure stability in near-term cash
flows and earnings
•Disciplined approach to hedging
•Tenor aligns with customer
preferences and market liquidity
•Multiple channels to market that
allow us to maximize margins
•Large open position in outer years
to benefit from price upside
Bull / Bear Program
Ability to exercise fundamental
market views to create value within
the ratable framework
•Modified timing of hedges versus
purely ratable
•Cross-commodity hedging (heat
rate positions, options, etc.)
•Delivery locations, regional and
zonal spread relationships
Credit Rating
Capital &
Operating
Expenditure
Dividend
Capital
Structure
• |
 12
Components of Gross Margin Categories
Margins move from new business to MtM of hedges over
the course of the year as sales are executed
Margins move from “Non power new business”
to
“Non power executed”
over the course of the year
Gross margin linked to power production and sales
Gross margin from
other business activities
2012 4Q Earnings Release Slides
Open Gross
Margin
•Generation Gross
Margin at current
market prices,
including capacity
& ancillary
revenues, nuclear
fuel amortization
and fossils fuels
expense
•Exploration and
Production
•PPA Costs &
Revenues
•Provided at a
consolidated level
for all regions
(includes hedged
gross margin for
South, West &
Canada
(1)
)
MtM of
Hedges
(2)
•MtM
of power,
capacity and
ancillary hedges,
including cross
commodity, retail
and wholesale load
transactions
•Provided directly at
a consolidated
level for five major
regions. Provided
indirectly for each
of the five major
regions via EREP,
reference price,
hedge %, expected
generation
“Power”
New
Business
•Retail, Wholesale
planned electric
sales
•Portfolio
Management new
business
•Mid marketing new
business
“Non Power”
Executed
•Retail, Wholesale
executed gas sales
•Load Response
•Energy Efficiency
•BGE Home
•Distributed Solar
“Non Power”
New Business
•Retail, Wholesale
planned gas sales
•Load Response
•Energy Efficiency
•BGE Home
•Distributed Solar
•Portfolio
Management /
origination fuels
new business
•Proprietary
trading
(3)
(1) Hedged gross margins for South, West & Canada region will be included
with Open Gross Margin, and no expected generation, hedge %, EREP or reference prices provided for this region.
(2) MtM of hedges provided directly for the five larger regions. MtM of hedges
is not provided directly at the regional level but can be easily estimated using EREP, reference price and hedged MWh.
(3) Proprietary trading gross margins will remain within “Non Power”
New Business category and not move to “Non Power” Executed category.
|
 13
ExGen Disclosures
Gross Margin Category ($M)
(1,2)
2013
2014
2015
Open Gross Margin
(including South, West & Canada hedged GM)
(3)
$5,550
$5,900
$6,050
Mark to Market of Hedges
(3,4)
$1,650
$650
$300
Power New Business / To Go
$400
$650
$850
Non-Power Margins Executed
$200
$100
$50
Non-Power New Business / To Go
$400
$500
$550
Total Gross Margin
$8,200
$7,800
$7,800
2012 4Q Earnings Release Slides
(1)
Gross margin does not include revenue related to decommissioning, gross
receipt tax, Exelon Nuclear Partners and entities consolidated solely as
a result of the application of FIN 46R.
(2)
Gross margin rounded to nearest $50M.
(3)
Includes CENG Joint Venture.
(4)
Mark to Market of Hedges assumes mid-point of hedge percentages.
(5)
Based on December 31, 2012 market conditions.
Reference Prices
(5)
2013
2014
2015
Henry Hub Natural Gas ($/MMbtu)
$3.54
$4.03
$4.23
Midwest: NiHub ATC prices ($/MWh)
$30.12
$30.94
$31.87
Mid-Atlantic: PJM-W ATC prices ($/MWh)
$36.88
$38.00
$39.17
ERCOT-N ATC Spark Spread ($/MWh)
HSC Gas, 7.2HR, $2.50 VOM
$6.80
$7.82
$8.05
New York: NY Zone A ($/MWh)
$34.22
$34.96
$35.66
New England: Mass Hub ATC Spark Spread($/MWh)
ALQN Gas, 7.5HR, $0.50 VOM
$4.61
$3.46
$3.18 |
 14
ExGen Disclosures
Generation and Hedges
2013
2014
2015
Exp. Gen (GWh)
(1)
218,000
211,100
207,300
Midwest
97,500
97,400
97,000
Mid-Atlantic
(2)
74,900
72,300
70,600
ERCOT
17,400
16,600
16,600
New York
(2)
14,000
11,000
9,300
New England
14,200
13,800
13,800
% of Expected Generation Hedged
(3)
94-97%
62-65%
27-30%
Midwest
92-95%
61-64%
25-28%
Mid-Atlantic
(2)
97-100%
66-69%
33-36%
ERCOT
90-93%
67-70%
36-39%
New York
(2)
92-95%
57-60%
23-26%
New England
92-95%
53-56%
12-15%
Effective Realized Energy Price ($/MWh)
(4)
Midwest
$38.50
$35.50
$35.00
Mid-Atlantic
(2)
$48.00
$46.00
$48.50
ERCOT
(5)
$10.00
$6.50
$5.50
New York
(2)
$35.00
$35.00
$47.50
New England
(5)
$7.00
$4.50
$3.50
2012 4Q Earnings Release Slides
(1) Expected generation represents the amount of energy estimated to be
generated or purchased through owned or contracted for capacity. Expected generation is based upon a simulated
dispatch model that makes assumptions regarding future market conditions, which
are calibrated to market quotes for power, fuel, load following products, and options. Expected generation
assumes 12 refueling outages in 2013 and 14 refueling outages in 2014 and 2015
at Exelon-operated nuclear plants ,Salem and CENG. Expected generation assumes capacity factors of
93.5%, 93.8%, and 93.3% in 2013, 2014 and 2015 at Exelon-operated nuclear
plants excluding Salem and CENG. These estimates of expected generation in 2013, 2014 and 2015 do not
represent guidance or a forecast of future results as Exelon has not completed
its planning or optimization processes for those years. (2) Includes CENG Joint Venture. (3) Percent of expected
generation hedged is the amount of equivalent sales divided by expected
generation. Includes all hedging products, such as wholesale and retail sales of power, options and swaps. Uses
expected value on options. (4) Effective realized energy price is
representative of an all-in hedged price, on a per MWh basis, at which expected generation has been hedged. It is developed by
considering the energy revenues and costs associated with our hedges and by
considering the fossil fuel that has been purchased to lock in margin. It excludes uranium costs and RPM
capacity revenue, but includes the mark-to-market value of capacity
contracted at prices other than RPM clearing prices including our load obligations. It can be compared with the reference
prices used to calculate open gross margin in order to determine the
mark-to-market value of Exelon Generation's energy hedges. (5) Spark spreads shown for ERCOT and New England.
|
 15
ExGen Hedged Gross Margin Sensitivities
Gross Margin Sensitivities (With Existing Hedges)
(1, 2)
2013
2014
2015
Henry Hub Natural Gas ($/Mmbtu)
$10
$305
$590
$(15)
$(230)
$(520)
NiHub ATC Energy Price
$30
$245
$410
$(30)
$(240)
$(410)
PJM-W ATC Energy Price
$15
$130
$260
$0
$(125)
$(250)
NYPP Zone A ATC Energy Price
$5
$25
$35
$(5)
$(25)
$(35)
Nuclear Capacity Factor
(3)
+/-
$40
+/-
$45
+/-
$45
2012 4Q Earnings Release Slides
+ $1/Mmbtu
+ $5/MWh
-
$5/MWh
+ $5/MWh
-
$5/MWh
+ $5/MWh
-
$5/MWh
+/-
1%
-
$1/Mmbtu
2012 4Q Earnings Release Slides
(1) Based on December 31, 2012 market conditions and hedged position. Gas price
sensitivities are based on an assumed gas-power relationship derived from an
internal model that is updated periodically. Power prices sensitivities are
derived by adjusting the power price assumption while keeping all other prices inputs constant.
Due to correlation of the various assumptions, the hedged gross margin impact
calculated by aggregating individual sensitivities may not be equal to the hedged gross
margin impact calculated when correlations between the various assumptions are
also considered. (2) Sensitivities based on commodity exposure which includes open
generation and all committed transactions. (3) Includes CENG Joint
Venture. |
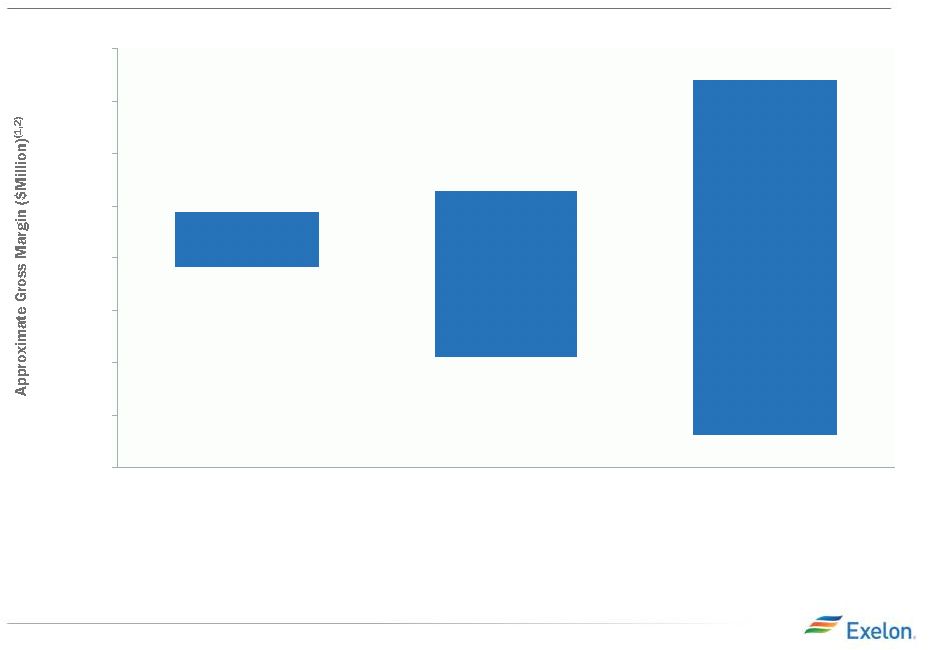 16
Exelon Generation Hedged Gross Margin Upside/Risk
2015
$9,700
2014
$8,650
2013
$8,450
2012 4Q Earnings Release Slides
2012 4Q Earnings Release Slides
Note: Due to a clerical error, the top end of the 2015 Exelon Generation Hedge
Gross Margin shown in the graph on slide 20 of the 3rd Quarter 2012 Earnings Conference Call presentation
dated November 1, 2012 should have been $10,350M, and is comparable to the
$9,700M value in the chart above. No other values or estimates in the 3rd Quarter 2012 presentation were
impacted as a result of this error.
(1) Represents an approximate range of expected gross margin, taking into
account hedges in place, between the 5th and 95th percent confidence levels assuming all unhedged supply is sold
into the spot market. Approximate gross margin ranges are based upon an
internal simulation model and are subject to change based upon market inputs, future transactions and potential
modeling changes. These ranges of approximate gross margin in 2014 and 2015 do
not represent earnings guidance or a forecast of future results as Exelon has not completed its planning or
optimization processes for those years. The price distributions that generate
this range are calibrated to market quotes for power, fuel, load following products, and options as of December 31,
2012 (2) Gross Margin Upside/Risk based on commodity exposure which includes
open generation and all committed transactions. $7,050
$6,000
$6,500
$7,000
$7,500
$8,000
$8,500
$9,000
$9,500
$10,000
$7,900
$6,300 |
 17
Illustrative Example of Modeling Exelon
Generation
2014 Gross Margin
Row
Item
Midwest
Mid-
Atlantic
ERCOT
New
England
New York
South,
West &
Canada
(A)
Start with fleet-wide open gross margin
$5.9 billion
(B)
Expected Generation (TWh)
97.4
72.3
16.6
13.8
11.0
(C)
Hedge % (assuming mid-point of range)
62.5%
67.5%
68.5%
54.5%
58.5%
(D=B*C)
Hedged Volume (TWh)
60.9
48.8
11.4
7.5
6.4
(E)
Effective Realized Energy Price ($/MWh)
$35.50
$46.00
$6.50
$4.50
$35.00
(F)
Reference Price ($/MWh)
$30.94
$38.00
$7.82
$3.46
$34.96
(G=E-F)
Difference ($/MWh)
$4.56
$8.00
($1.32)
$1.04
$0.04
(H=D*G)
Mark-to-market value of hedges ($ million)
$280 million
$390 million
($15) million
$10 million
$0 million
(I=A+H)
Hedged Gross Margin ($ million)
$6,550 million
(J)
Power New Business / To Go ($ million)
$650 million
(K)
Non-Power Margins Executed ($ million)
$100 million
(L)
Non-
Power New Business / To Go ($ million)
$500 million
(N=I+J+K+L)
Total Gross Margin
$7,800 million
(1) Mark-to-market rounded to the nearest $5 million.
2012 4Q Earnings Release Slides
2012 4Q Earnings Release Slides
(1) |
 18
Additional Disclosures
December 31, 2012
2012 4Q Earnings Release Slides
2012 4Q Earnings Release Slides |
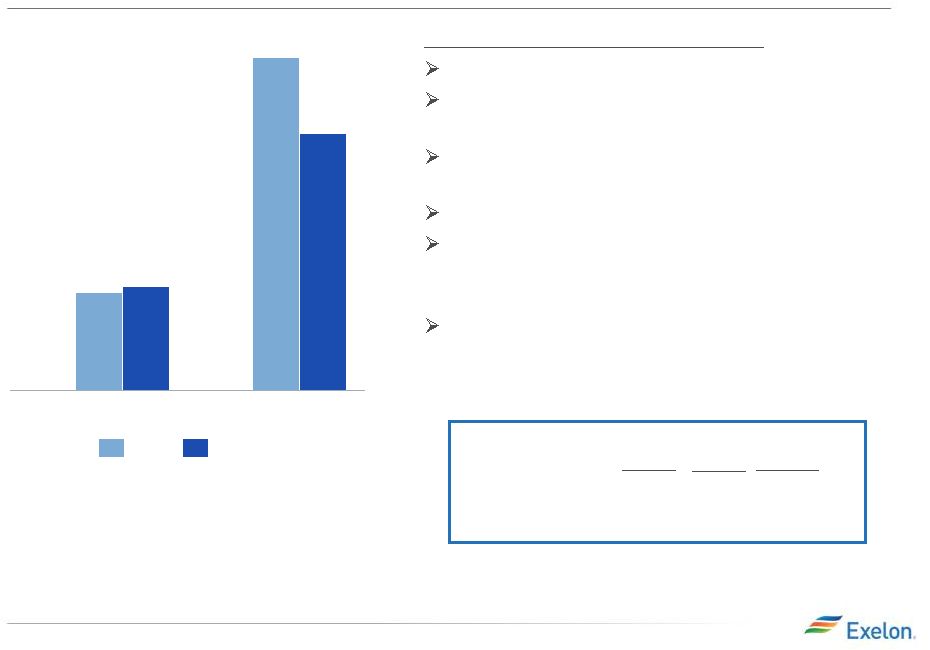
 Operating O&M Forecast
•
2013 O&M forecast of $6.9B
–
Includes merger synergies of $355M
–
Excludes costs to achieve which are considered non-operating
•
Expect O&M CAGR of ~0.5% for 2013-2015
$375
2013E
$6,900
(2)
-$75
$4,425
$1,200
$700
$650
2012 Actuals
$6,775
(1) (2)
-$50
$4,050
$1,150
$700
$550
(in $M)
ExGen
ComEd
ComEd
PECO
PECO
BGE
Corp
~0.5% CAGR for 2013-2015
ExGen
BGE
Stub O&M
19
Key Year-over-Year Drivers
•
Merger synergies:
$185M
•
PECO and BGE Storm
Costs: $80M
•
Inflation: $150M
•
Pension/OPEB: $25M
•
ExGen Non-Power Costs,
offset in RNF: $70M
•
Other ExGen O&M: $55M
•
Other Utilities O&M, including
BGE Reliability and ComEd
EIMA: $90M
2012 4Q Earnings Release Slides
(1)
O&M for 2012 includes CEG and BGE costs from merger close date.
(2)
O&M for utilities excludes regulatory O&M that are P&L neutral.
ExGen O&M excludes P&L neutral decommissioning costs and the impact from
O&M related to entities consolidated solely as a result of the application
of FIN 46R.
|
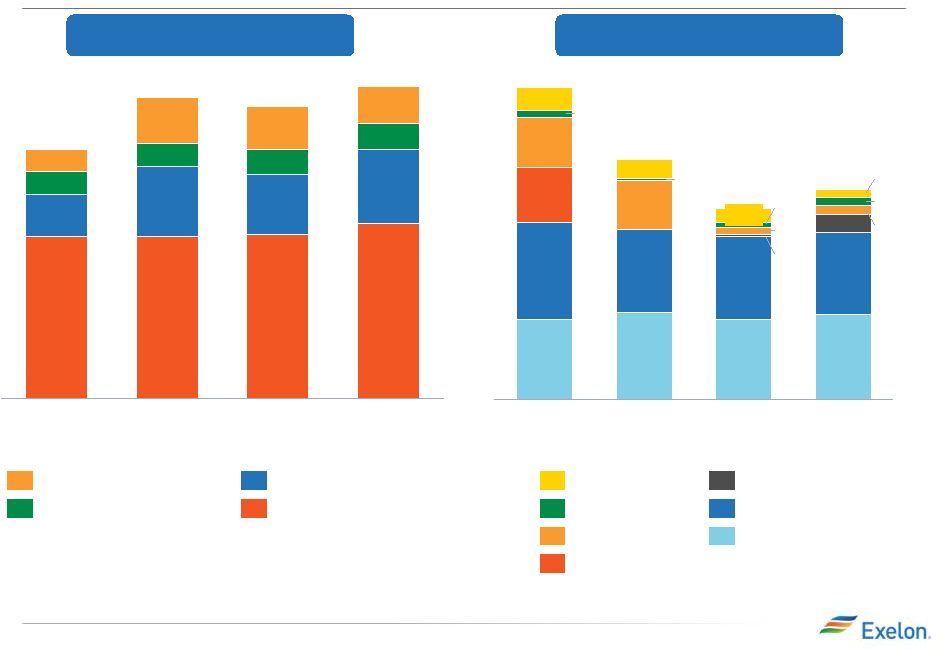 Capital Expenditure Expectations
275
225
25
100
100
100
50
25
75
100
950
975
175
2013
2,850
1,025
1,000
575
2015
2,500
1,000
975
225
2014
2,275
2012
(1)
3,700
950
1,150
650
600
Base Capex
(3)
Nuclear Fuel
(2)
MD Commitments
Wind
Solar
Upstream Gas
Nuclear Uprates
325
2014
2,575
1,450
525
225
375
2013
2,650
1,425
625
200
2015
2,750
1,550
650
225
400
2012
(1)
2,200
1,425
375
200
200
Electric Distribution
Electric Transmission
Gas Delivery
Smart Grid/Smart Meter
(in $M)
(in $M)
20
2012 4Q Earnings Release Slides
Exelon Utilities
Exelon Generation
(1)
2012 CapEx includes CEG and BGE from merger close date.
(2)
Nuclear fuel is at ownership and includes Salem.
(3)
ExGen base capex includes $350 million of Fukushima response costs for
2013-2017. Does not include estimate of $15-20 million per unit, at eleven
Mark 1 and 2 units, cost for filtered vents, if required. |
 2013 Projected Sources and Uses of Cash
(1)
Exelon beginning cash balance as of 12/31/12. Excludes counterparty
collateral activity. (2)
Cash Flow from Operations primarily includes net cash flows provided by
operating activities and net cash flows used in investing activities other than
capital expenditures.
(3)
Dividends are subject to declaration by the Board of Directors.
(4)
Excludes PECO’s $210 million Accounts Receivable (A/R) Agreement with Bank
of Tokyo. PECO’s A/R Agreement was extended in accordance with its
terms through August 30, 2013.
(5)
“Other”
includes proceeds from options and expected changes in short-term
debt. (6)
Includes cash flow activity from Holding Company, eliminations, and other
corporate entities. ($ in millions)
2012 4Q Earnings Release Slides
21
Beginning Cash Balance
(1)
$1,575
Cash Flow from Operations
(2)
550
1,225
625
3,600
5,950
CapEx (excluding other items below):
(550)
(1,300)
(400)
(1,025)
(3,325)
Nuclear Fuel
n/a
n/a
n/a
(1,000)
(1,000)
Dividend
(3)
(1,250)
Nuclear Uprates
n/a
n/a
n/a
(225)
(225)
Wind
n/a
n/a
n/a
--
0
Solar
n/a
n/a
n/a
(575)
(575)
Upstream
n/a
n/a
n/a
(25)
(25)
Utility Smart Grid/Smart Meter
(125)
(100)
(175)
n/a
(400)
Net Financing (excluding Dividend):
Debt Issuances
(4)
350
250
250
--
850
Debt Retirements
(400)
(250)
(300)
(450)
(1,400)
Project Finance/Federal Financing Bank
Loan
n/a
n/a
n/a
1,000
1,000
Other
(5)
75
275
--
--
400
Ending Cash Balance
(1)
$1,575
(6) |
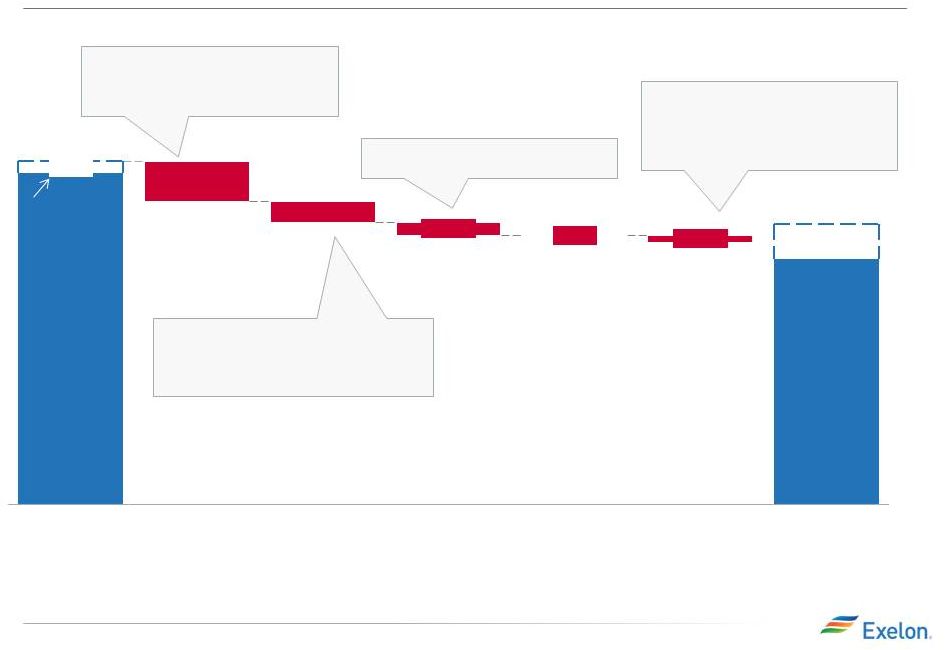 ExGen Operating EPS Bridge 2012 to 2013
($0.39) Lower Generation RNF primarily due to
prices as well as lower retail unit margins, offset by
growth projects
$0.06 Non-power revenue
$0.05 Capacity revenue
$0.11 Primarily ITC and PTC tax credits
($0.03) 2012 decommissioning realized gains due
to rebalancing
($0.08) Share Dilution
$1.96
$1.89
$0.07
2013
$1.40-$1.60
Other
($0.01)
Interest
$0.00
Depreciation &
Amortization
($0.08)
O&M
($0.10)
RNF
($0.27)
2012
Stub
22
2012 4Q Earnings Release Slides
Note: Drivers add up to mid-point of 2013 EPS range.
RNF = Revenue Net Fuel
(1) Financials exclude P&L neutral items (including decommissioning
costs, gross receipts tax and entities consolidated solely as a result of the application of FIN 46R).
(2) Shares Outstanding (diluted) are 819M in 2012 and 860M in 2013. 2013
represents full-year of shares outstanding resulting from March 2012 merger with Constellation.
($0.07) Inflation
($0.05) Higher cost of sales related to non-power revenue
($0.02) Pension and OPEB
($0.05) Other
$0.09 Synergies ($0.08) Primarily new wind projects, portions of AVSR
and other assets in service |
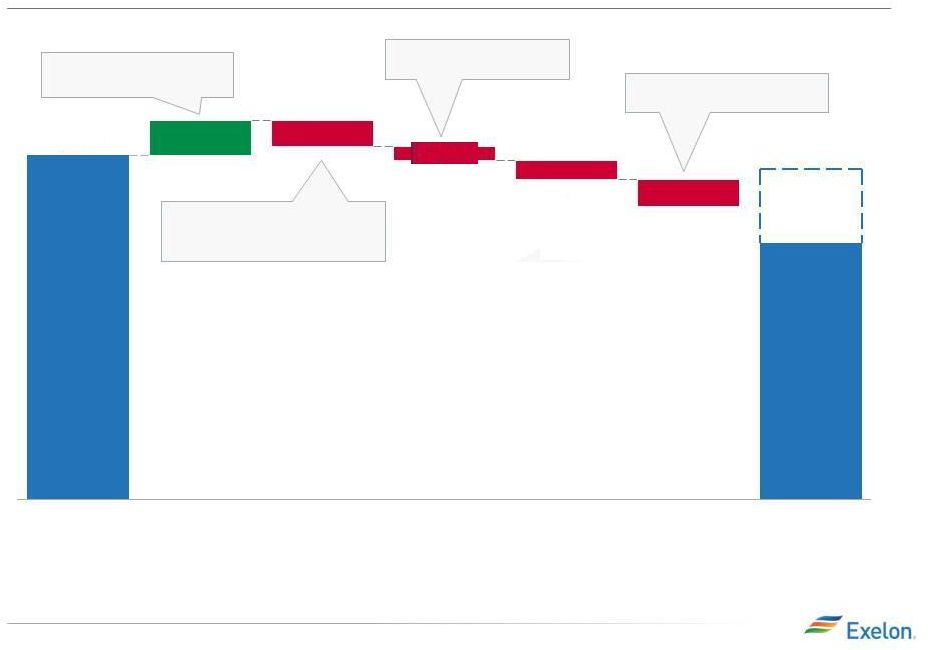 2013
Other
Depreciation &
Amortization
O&M
(1)
($0.03)
RNF
$0.05
2012
ComEd Operating EPS Bridge 2012 to 2013
$0.07 DST Revenue primarily
due to formula rate
($0.02) Weather
($0.02) Depreciation Expense
($0.02) Share Dilution
(2)
$0.35
-
$0.45
Interest
($0.02) EIMA O&M
($0.02) Inflation
$0.02 Synergies
23
2012 4Q Earnings Release Slides
$0.47
Note: Drivers add up to mid-point of 2013 EPS range.
RNF = Revenue Net Fuel
(1) Financials exclude regulatory items that are P&L neutral.
(2) Shares Outstanding (diluted) are 819M in 2012 and 860M in 2013. 2013
represents full-year of shares outstanding resulting from March 2012 merger with Constellation.
($0.01) Effective Tax Rate Change
($0.02)
($0.05)
($0.02) |
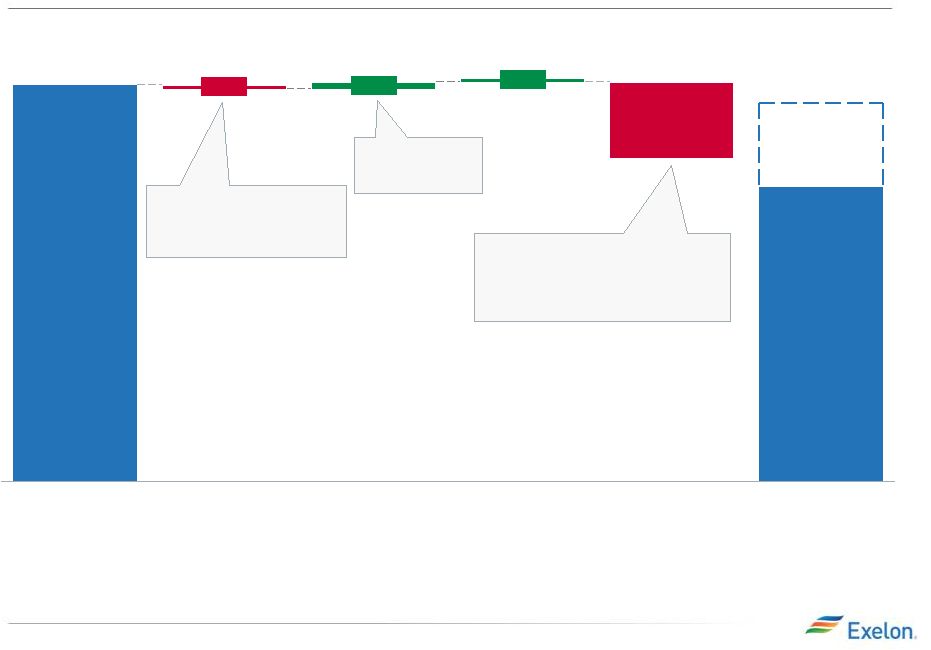 $0.47
2013
$0.35 -
$0.45
Other
($0.09)
Interest
$0.01
O&M
$0.01
RNF
$0.00
2012
PECO Operating EPS Bridge 2012 to 2013
$0.02 Weather
($0.01) Load Growth/Customer mix
($0.01) Transmission
$0.01 Storm
$0.01 Synergies
($0.01) Inflation
($0.03) Electric and Gas Tax Repairs
($0.02) Share Dilution
(2)
($0.01) Taxes Other Than Income in 2012
($0.01) Other Effective Tax Rate Change
24
2012 4Q Earnings Release Slides
Note: Drivers add up to mid-point of 2013 EPS range.
RNF = Revenue Net Fuel
(1) Financials exclude regulatory items that are P&L neutral.
(2)
Shares
Outstanding
(diluted)
are
819M
in
2012
and
860M
in
2013.
2013
represents
full-year
of
shares
outstanding
resulting
from
March
2012
merger
with
Constellation.
2012 4Q Earnings Release Slides |
 Depreciation &
Amortization
0.01
O&M
0.02
RNF
0.06
2012
$0.11
$0.06
Stub: $0.05
2013
$0.15-
$0.25
Other
0.00
BGE Operating EPS Bridge 2012 to 2013
($0.01) PSC Mandated Reliability Spend
($0.01) Inflation
$0.04 Storm
$0.01 Synergies
($0.01) Share Dilution
(2)
$0.01 Other including tax rate
changes
$0.06 Higher RNF
25
2012 4Q Earnings Release Slides
2012 4Q Earnings Release Slides
Note: Drivers add up to mid-point of 2013 EPS range.
RNF = Revenue Net Fuel
(1) Financials exclude regulatory items that are P&L neutral.
(2)
Shares
Outstanding
(diluted)
are
819M
in
2012
and
860M
in
2013.
2013
represents
full-year
of
shares
outstanding
resulting
from
March
2012
merger
with
Constellation. |
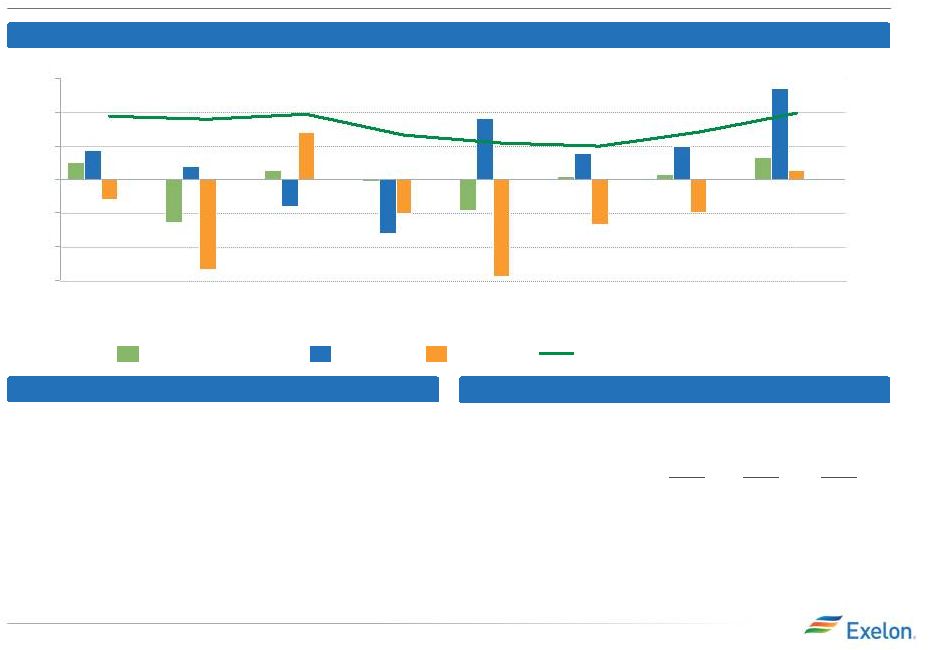 ComEd Load Trends
4Q13
3Q13
2Q13
1Q13
4Q12
3Q12
2Q12
1Q12
Gross Metro Product
Residential
Large C&I
All Customer Classes
Notes: C&I = Commercial & Industrial. ComEd load activity impacts net
income to the extent that it does not result in an ROE outside of the collar, which ensures that the earned
ROE is within 0.5% of the allowed ROE.
Weather-Normalized Electric Load Year-over-Year
Key Economic Indicators
Weather-Normalized Electric Load
(1)
Source: U.S. Dept. of Labor (December 2012) and Illinois Department of
Security (December 2012)
(2)
Source: Global Insight (November 2012)
(3)
Not adjusted for leap year
Chicago
U.S.
Unemployment rate
(1)
8.9%
2012 annualized growth in
gross domestic/metro product
(2)
1.8%
26
2012 4Q Earnings Release Slides
4Q12
2012
(3)
2013E
(3)
Average Customer Growth
0.3%
0.3%
0.4%
Average Use-Per-Customer
(1.3)%
(0.9)%
(1.7)%
Total Residential
(1.0)%
(0.6)%
(1.2)%
Small C&I
1.8%
0.2%
(0.5)%
Large C&I
(1.6)%
(0.3)%
1.6%
All Customer Classes
(0.1)%
(0.1)%
(0.0)%
-3%
-2%
-1%
0%
1%
2%
3%
2.1%
7.8% |
 27
PECO Load Trends
-5%
-4%
-3%
-2%
-1%
0%
1%
2%
3%
4Q13
3Q13
2Q13
1Q13
4Q12
3Q12
2Q12
1Q12
Gross Metro Product
Residential
Large C&I
All Customer Classes
Note: C&I = Commercial & Industrial.
Weather-Normalized Electric Load Year-over-Year
Key Economic Indicators
Weather-Normalized Electric Load
(1)
Source:
U.S.
Dept.
of
Labor
(December
2012)
-
US
US
Dept
of
Labor
prelim.
data
(October
2012)
-
Philadelphia
(2)
Source: Global Insight (November 2012)
(3)
4Q12 LCI does not include 64 GWh for a change in prior period
estimates.
(4)
Not adjusted for leap year
Philadelphia
U.S.
Unemployment rate
(1)
8.0%
2012 annualized growth in
gross domestic/metro product
(2)
1.9%
2.1% 2012 4Q Earnings Release
Slides 4Q12
(3)
2012
(4)
2013E
(4)
Average Customer Growth
0.2%
0.3%
0.2%
Average Use-Per-Customer
0.5%
(2.0)%
(0.7)%
Total Residential
0.7%
(1.7)%
(0.5)%
Small C&I
(0.5)%
(2.3)%
(1.3)%
Large C&I
(0.3)%
(2.7)%
(0.1)%
All Customer Classes
(0.1)%
(2.2)%
(0.5)%
7.8% |
 28
BGE Load Trends
-5%
-4%
-3%
-2%
-1%
0%
1%
2%
3%
4Q13
3Q13
2Q13
1Q13
4Q12
3Q12
2Q12
1Q12
Gross Metro Product
Residential
Large C&I
All Customer Classes
Weather-Normalized Electric Load Year-over-Year
Key Economic Indicators
Weather-Normalized Electric Load
(1)
Source:
U.S.
Dept.
of
Labor
(December
2012)
-
US
US
Dept
of
Labor
prelim.
data
(November
2012)
-
Baltimore
(2)
Source:
Global
Insight
(November
2012)
(3)
Not
adjusted
for
leap
year
Baltimore
U.S.
Unemployment rate
(1)
6.8%
2012 annualized growth in
gross domestic/metro product
(2)
1.4%
2.1% 2012 4Q Earnings Release
Slides 4Q12
2012
(3)
2013E
(3)
Average Customer Growth
0.0%
0.0%
0.6%
Average Use-Per-Customer
(1.9)%
(3.4)%
(2.3)%
Total Residential
(1.9)%
(3.4)%
(1.7)%
Small C&I
(0.6)%
(3.0)%
(1.1)%
Large C&I
2.1%
1.5%
1.2%
All Customer Classes
(3.3)%
(2.2)%
(1.7)%
7.8%
Note: C&I = Commercial & Industrial. 2012 quarterly and
full year data is adjusted for timing of PJM settlements. Impact of RG Steel is only reflected in “All Customer Classes” and
not in “Large C&I” amounts. |
 29
Additional 2013 ExGen and CENG Modeling
P&L Item
2013 Estimate
ExGen
Model
Inputs
(1)
O&M
$4,425M
Taxes Other Than Income (TOTI)
$300M
Depreciation & Amortization
(4)
$825M
Interest Expense
$375M
CENG
Model
Inputs
(at
ownership)
(5)
Gross Margin
Included in ExGen Disclosures
O&M / TOTI
$400M-$450M
Depreciation & Amortization / Accretion
$100M-$150M
2012 4Q Earnings Release Slides
2012 4Q Earnings Release Slides
(1)
ExGen amounts for O&M, TOTI and Depreciation & Amortization
exclude the impacts of CENG. CENG impact is reflected in “Equity earnings of unconsolidated affiliates”
in the Income Statement.
(2)
ExGen O&M excludes P&L neutral decommissioning costs and the impact
from O&M related to entities consolidated solely as a result of the application of FIN 46R.
(3)
TOTI excludes gross receipts tax for retail.
(4)
ExGen Depreciation & Amortization excludes the impact of P&L neutral
decommissioning.
(5)
CENG has not concluded its financial planning process for 2013. The CENG model
inputs are intended to support ExGen’s guidance range and do not represent CENG’s
final estimates.
(3)
(2) |
 2013 Key Assumptions
Utility Statistics
2013 Estimate
Electric Delivery Growth (%)
(3)
ComEd
(0.0)%
PECO
(0.5)%
BGE
(1.7)%
Effective Tax Rate -
Operating (%)
2013 Estimate
ComEd
40.0%
PECO
31.0%
BGE
38.7%
ExGen
33.4%
Exelon
34.4%
30
(1)
Excludes Salem and CENG.
(2)
Reflects forward market prices as of December 31, 2012.
(3)
Weather-normalized load growth.
(4)
O&M rounded to the nearest $25M.
(5)
ExGen O&M excludes P&L neutral decommissioning costs and the
impact from O&M related to entities consolidated solely as a result of the application of FIN 46R.
.
Generation Statistics
2013 Estimate
(2)
Nuclear Capacity Factor (%)
(1)
93.5%
Total Expected Generation(GWh)
218,000
Henry Hub Natural Gas ($/MMbtu)
$3.54
Midwest: NiHub ATC Price
$30.12
Mid-Atlantic: PJM-W ATC Price
$36.88
ERCOT-N ATC Spark Spread
$6.80
New York: NY Zone A ATC Price
$34.22
New England: Mass Hub Spark Spread
$4.61
2013 O&M
(4)
Reconciliation (in $M)
ExGen
ComEd
PECO
BGE
Other
Exelon
GAAP O&M
$4,550
$1,400
$825
$650
$(75)
$7,350
Decommissioning and FIN 46R O&M
(5)
$(50)
-
-
-
-
$(50)
Regulatory O&M
-
$(200)
$(125)
-
-
$(325)
Merger/Integration costs
$(75)
-
-
-
-
$(75)
Operating O&M (as shown on slide 19)
$4,425
$1,200
$700
$650
$(75)
$6,900
2012 4Q Earnings Release Slides
2012 4Q Earnings Release Slides |
 Sufficient Liquidity
(1)
Excludes commitments from Exelon’s Community and Minority Bank Credit
Facility. (2)
Available Capacity Under Facilities represents the unused commitments under the
borrower’s credit agreements net of outstanding letters of credit and
facility
draws.
The
amount
of
commercial
paper
outstanding
does
not
reduce
the
available
capacity
under
the
credit
agreements.
($ in Millions)
Available Capacity Under Bank Facilities as of January 30, 2013
Exelon Corp, ExGen, PECO and BGE facilities were amended and extended on August
10, 2012 to align maturities of facilities and secure liquidity
and pricing through 2017 31
2012 4Q Earnings Release Slides
Aggregate Bank Commitments
(1)
600
1,000
600
5,675
8,375
Outstanding Facility Draws
–
–
–
–
Outstanding Letters of Credit
(1)
(1,729)
(1,732)
Available Capacity Under Facilities
(2)
600
1,000
599
3,946
6,643
Outstanding Commercial Paper
Available Capacity Less Outstanding
Commercial Paper
600
1,000
599
3,946
6,643
–
–
–
–
–
–
–
– |
 ComEd Operating EPS Contribution
Key
Drivers
–
4Q12
vs.
4Q11
(1)
Share differential: $(0.04)
Impact of the 2011 allowed recovery of certain
storm costs pursuant to EIMA
(2):
: $(0.04)
Lower distribution revenue primarily due to
lower allowed ROE
(3):
$(0.02)
Lower income tax: $0.01
Lower interest expense primarily due to the
settlement of the 1999-2001 income tax
returns: $0.02
Other impacts of EIMA, primarily related to the
2012 ICC rehearing order for the allowed
recovery of pension asset costs: $0.07
4Q12
Heating Degree-Days
1,832
2,030 2,293 Cooling
Degree-Days 14
3
11 4Q11
Full Year
4Q
2012
2011
32
2012 4Q Earnings Release Slides
2012 4Q Earnings Release Slides
(1)
Refer to the Earnings Release Attachments for additional details and to the
Appendix for a reconciliation of adjusted (non-GAAP) operating EPS to GAAP EPS.
(2)
The Energy Infrastructure Modernization Act. (3) Due to the true-up mechanism in the
distribution formula rate, the primary driver of year-over-year change in earnings will be due to changes in the allowed ROE,
rate base and capital structure. $0.61
$0.18
$0.47
$0.19
Normal
Actual
Actual |
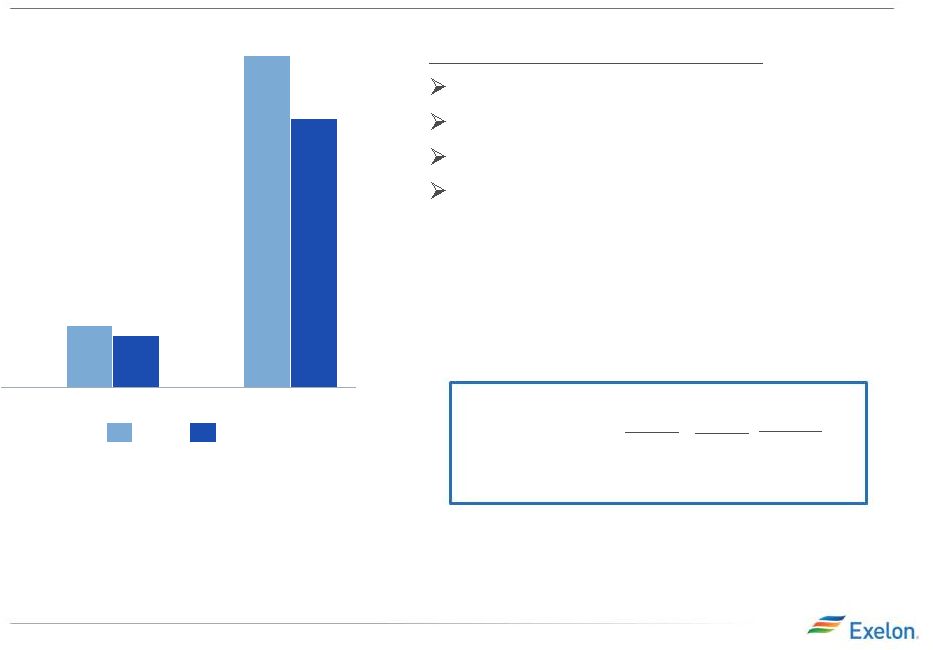 PECO Operating EPS Contribution
Key
Drivers
–
4Q12
vs.
4Q11
(1)
Increased storm costs: $(0.04)
Share differential: $(0.02)
Weather: $0.02
Lower income tax primarily due to gas
distribution tax repairs deduction: $0.02
4Q12
Heating Degree-Days
1,302 1,482 1,629
Cooling
Degree-Days 14
31
19 4Q11
33
2012 4Q Earnings Release Slides
Full Year
4Q
2012
2011
2012 4Q Earnings Release Slides
(1)
Refer to the Earnings Release Attachments for additional details and to the
Appendix for a reconciliation of adjusted (non-GAAP) operating EPS to GAAP EPS.
$0.58
$0.11
$0.47
$0.09
Normal
Actual
Actual |
 4Q GAAP EPS Reconciliation
NOTE: All amounts shown are per Exelon share and represent contributions
to Exelon's EPS. Amounts may not add due to rounding. 2012 4Q
Earnings Release Slides 34
Three Months Ended December 31, 2012
ExGen
ComEd
PECO
BGE
Other
Exelon
2012 Adjusted (non-GAAP) Operating Earnings Per Share
$0.33
$0.19
$0.09
$0.02
$0.00
$0.64
Mark-to-market impact of economic hedging activities
0.17
-
-
-
(0.03)
0.14
Plant retirements and divestitures
(0.05)
-
-
-
-
(0.05)
Asset retirement obligation
0.01
-
-
-
-
0.01
Constellation merger and integration costs
(0.04)
(0.00)
(0.00)
(0.00)
(0.00)
(0.05)
Amortization of commodity contract intangibles
(0.24)
-
-
-
-
(0.24)
Non-cash remeasurement of deferred income taxes
(0.01)
-
-
-
0.01
0.00
Midwest Generation bankruptcy charges
(0.01)
-
-
-
-
(0.01)
4Q 2012 GAAP Earnings (Loss) Per Share
$0.16
$0.19
$0.09
$0.02
$(0.02)
$0.44
Three Months Ended December 31, 2011
ExGen
ComEd
PECO
Other
Exelon
2011 Adjusted (non-GAAP) Operating Earnings (Loss) Per Share
$0.54
$0.18
$0.11
$(0.02)
$0.82
Mark-to-market impact of economic hedging activities
0.07
-
-
-
0.07
Unrealized gains related to nuclear decommissioning trust funds
0.07
-
-
-
0.07
Plant retirements and divestitures
(0.01)
-
-
-
(0.01)
Constellation merger and integration costs
(0.01)
-
(0.00)
(0.02)
(0.03)
Non-cash remeasurement of deferred income taxes
0.01
-
-
(0.02)
(0.01)
4Q 2011 GAAP Earnings (Loss) Per Share
$0.67
$0.18
$0.11
$(0.05)
$0.91 |
 Full Year GAAP EPS Reconciliation
NOTE: All amounts shown are per Exelon share and represent contributions
to Exelon's EPS. Amounts may not add due to rounding. 2012 4Q
Earnings Release Slides 35
Twelve Months Ended December 31, 2012
ExGen
ComEd
PECO
BGE
Other
Exelon
2012 Adjusted (non-GAAP) Operating Earnings (Loss) Per Share
$1.89
$0.47
$0.47
$0.06
$(0.04)
$2.85
Mark-to-market impact of economic hedging activities
0.38
-
-
-
0.00
0.38
Unrealized gains related to nuclear decommissioning trust funds
0.07
-
-
-
-
0.07
Plant retirements and divestitures
(0.29)
-
-
-
-
(0.29)
Constellation merger and integration costs
(0.20)
(0.00)
(0.01)
(0.01)
(0.09)
(0.31)
Maryland commitments
(0.03)
-
-
(0.10)
(0.15)
(0.28)
Amortization of commodity contract intangibles
(0.93)
-
-
-
-
(0.93)
FERC settlement
(0.21)
-
-
-
-
(0.21)
Reassessment of state deferred income taxes
0.00
-
-
-
0.14
0.14
Amortization of the fair value of certain debt
0.01
-
-
-
-
0.01
Midwest Generation bankruptcy charges
(0.01)
-
-
-
(0.01)
FY 2012 GAAP Earnings (Loss) Per Share
$0.69
$0.46
$0.46
$(0.05)
$(0.14)
$1.42
Twelve Months Ended December 31, 2011
ExGen
ComEd
PECO
Other
Exelon
2011 Adjusted (non-GAAP) Operating Earnings (Loss) Per Share
$3.01
$0.61
$0.58
$(0.05)
$4.16
Mark-to-market impact of economic hedging activities
(0.27)
-
-
-
(0.27)
Plant retirements and divestitures
(0.05)
-
-
-
(0.05)
Asset retirement obligation
(0.03)
-
0.00
-
(0.02)
Constellation merger and integration costs
(0.01)
-
(0.00)
(0.06)
(0.07)
Other acquisitions costs
(0.01)
-
-
-
(0.01)
Wolf Hollow acquisition
0.03
-
-
-
0.03
Recovery of costs pursuant to the 2011 distribution rate case order
-
0.03
-
-
0.03
Non-cash remeasurement of deferred income taxes
0.01
-
-
(0.02)
(0.01)
Non-cash charge resulting from Illinois tax rate change legislation
(0.03)
(0.01)
-
(0.00)
(0.04)
FY 2011 GAAP Earnings (Loss) Per Share
$2.66
$0.63
$0.58
$(0.12)
$3.75 |
 GAAP to Operating Adjustments
•
Exelon’s 2013 adjusted (non-GAAP) operating earnings outlook excludes
the earnings effects of the following:
–
Mark-to-market adjustments from economic hedging activities
–
Financial impacts associated with the planned retirement of fossil generating
units and the sale in the fourth quarter of 2012 of three generating
stations as required by the merger –
Certain costs incurred related to the Constellation merger and integration
initiatives –
Non-cash amortization of intangible assets, net, related to commodity
contracts recorded at fair value at the merger date
–
Non-cash amortization of certain debt recorded at fair value at the merger
date expected to be retired in 2013
–
Significant impairments of assets, including goodwill
–
Other unusual items
–
Significant changes to GAAP
2012 4Q Earnings Release Slides
36 |