Attached files
| file | filename |
|---|---|
| 8-K - FORM 8-K - American Railcar Industries, Inc. | d482194d8k.htm |
Exhibit 99.1
| Forward Looking Disclaimer Safe Harbor Statement This presentation contains statements relating to expected financial performance, objectives, long-term strategies and/or future business prospects, events and plans that are forward-looking statements. Forward-looking statements represent the Company's estimates and assumptions only as of the date of this presentation. Such statements include, without limitation, statements regarding customer demand for the Company's products, the Company's strategic objectives and long-term strategies, the growth of the Company's leasing business, anticipated future production rates, the Company's joint ventures, the Company's backlog and any implication that the Company's backlog may be indicative of future sales. These forward-looking statements are subject to known and unknown risks and uncertainties that could cause actual results to differ materially from the results described in or anticipated by the Company's forward-looking statements. Other potential risks and uncertainties include, among other things: the impact of an economic downturn, adverse market conditions and restricted credit markets; ARI's reliance upon a small number of customers that represent a large percentage of revenues and backlog; the health of and prospects for the overall railcar industry; prospects in light of the cyclical nature of the railcar manufacturing business and the current economic environment; anticipated trends relating to shipments, leasing, railcar services, revenues, financial condition or results of operations; the Company's ability to manage overhead and variations in production rates; the highly competitive nature of the railcar manufacturing industry; fluctuating costs of raw materials, including steel and railcar components and delays in the delivery of such raw materials and components; fluctuations in the supply of components and raw materials that ARI uses in railcar manufacturing; anticipated production schedules for products and the anticipated financing needs, construction and production schedules of ARI's joint ventures; the risks associated with potential joint ventures, potential acquisitions or new business endeavors; the implementation, integration with other systems or ongoing management of the Company's new enterprise resource planning system; the international economic and political risks related to ARI's joint ventures' current and potential international operations; the risk of the lack of acceptance of new railcar offerings by ARI's customers and the risk of initial production costs for the Company's new railcar offerings being significantly higher than expected; the sufficiency of the Company's liquidity and capital resources; the conversion of ARI's railcar backlog into revenues; compliance with covenants contained in the Company's lease fleet financing; the impact and anticipated benefits of any acquisitions ARI may complete; the impact and costs and expenses of any litigation ARI may be subject to now or in the future; the ongoing benefits and risks related to the Company's relationship with Mr. Carl Icahn (the chairman of the Company's board of directors and, through his holdings of Icahn Enterprises L.P., the Company's principal beneficial stockholder) and certain of his affiliates; and the additional risk factors described in ARI's filings with the Securities and Exchange Commission. The Company expressly disclaims any duty to provide updates to any forward-looking statements made in this presentation, whether as a result of new information, future events or otherwise. |
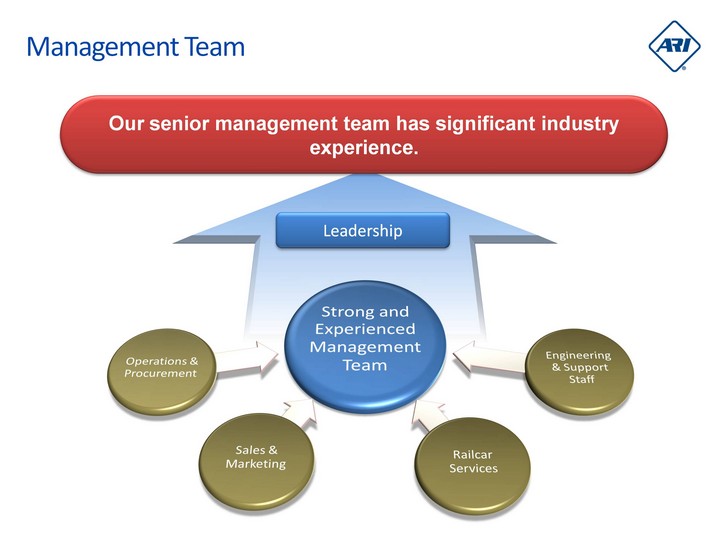
| Our senior management team has significant industry experience. Management Team Leadership |
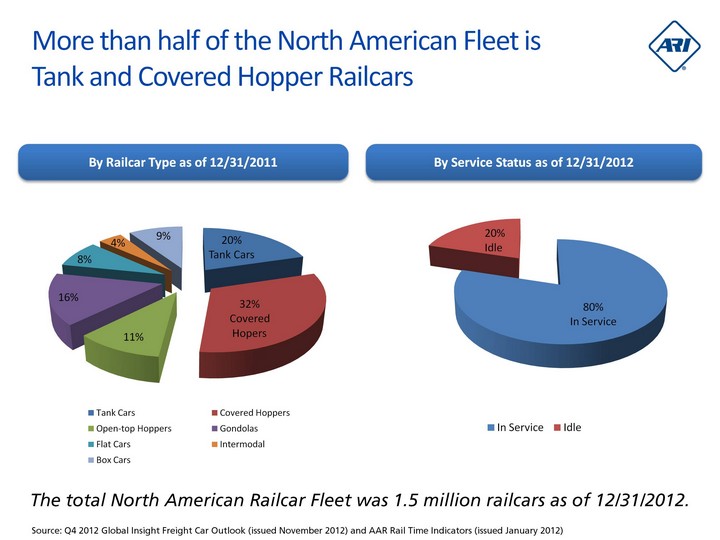
| More than half of the North American Fleet is Tank and Covered Hopper Railcars The total North American Railcar Fleet was 1.5 million railcars as of 12/31/2012. By Railcar Type as of 12/31/2011 By Service Status as of 12/31/2012 Source: Q4 2012 Global Insight Freight Car Outlook (issued November 2012) and AAR Rail Time Indicators (issued January 2012) (CHART) (CHART) |
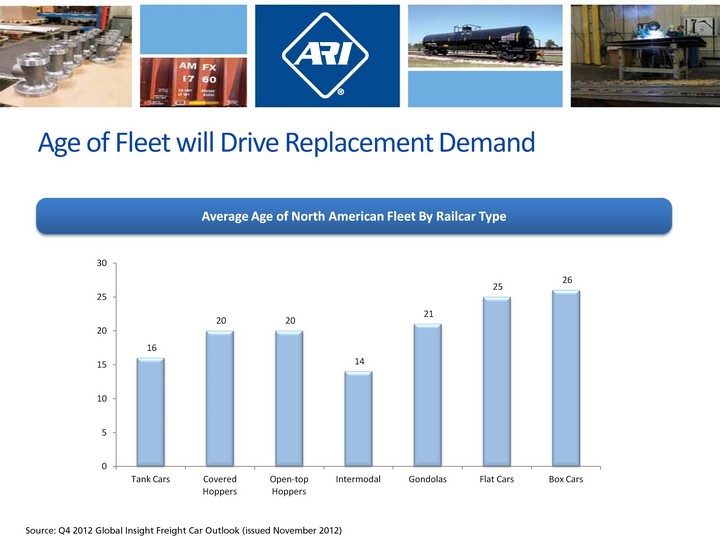
| Age of Fleet will Drive Replacement Demand Average Age of North American Fleet By Railcar Type Source: Q4 2012 Global Insight Freight Car Outlook (issued November 2012) (CHART) |
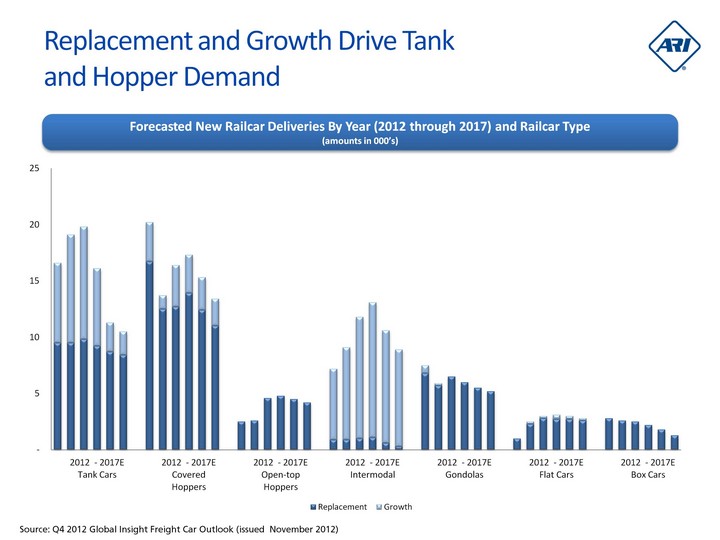
| Replacement and Growth Drive Tank and Hopper Demand Forecasted New Railcar Deliveries By Year (2012 through 2017) and Railcar Type (amounts in 000's) Source: Q4 2012 Global Insight Freight Car Outlook (issued November 2012) (CHART) |
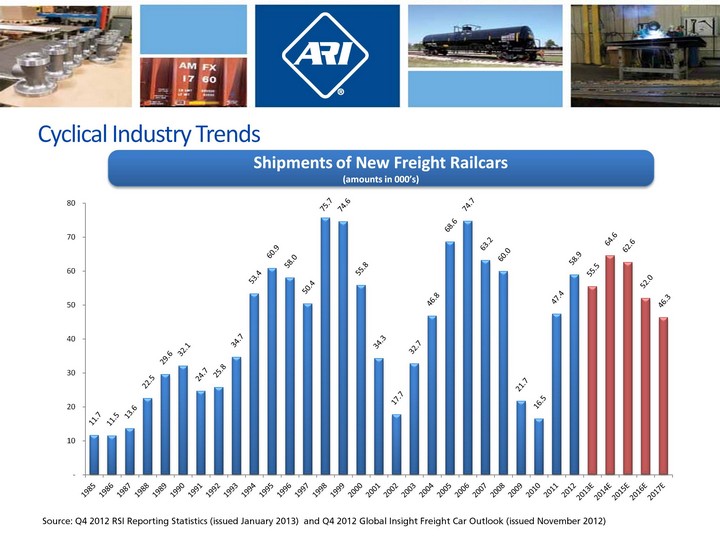
| Cyclical Industry Trends Source: Q4 2012 RSI Reporting Statistics (issued January 2013) and Q4 2012 Global Insight Freight Car Outlook (issued November 2012) (CHART) Shipments of New Freight Railcars (amounts in 000's) |
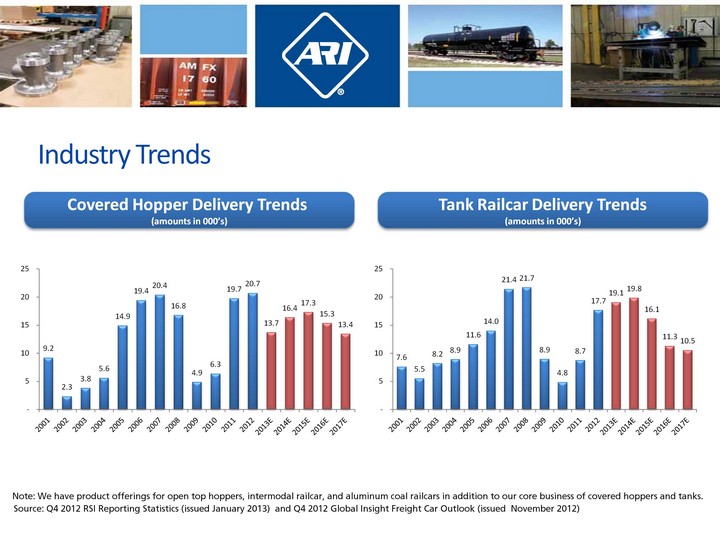
| Industry Trends (CHART) (CHART) Note: We have product offerings for open top hoppers, intermodal railcar, and aluminum coal railcars in addition to our core business of covered hoppers and tanks. Covered Hopper Delivery Trends (amounts in 000's) Tank Railcar Delivery Trends (amounts in 000's) Source: Q4 2012 RSI Reporting Statistics (issued January 2013) and Q4 2012 Global Insight Freight Car Outlook (issued November 2012) |
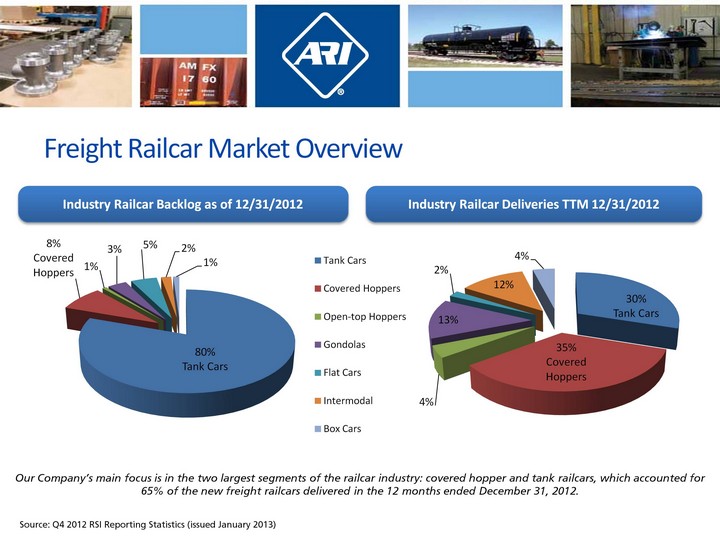
| Freight Railcar Market Overview Our Company's main focus is in the two largest segments of the railcar industry: covered hopper and tank railcars, which accounted for 65% of the new freight railcars delivered in the 12 months ended December 31, 2012. Industry Railcar Backlog as of 12/31/2012 Industry Railcar Deliveries TTM 12/31/2012 Source: Q4 2012 RSI Reporting Statistics (issued January 2013) (CHART) (CHART) |
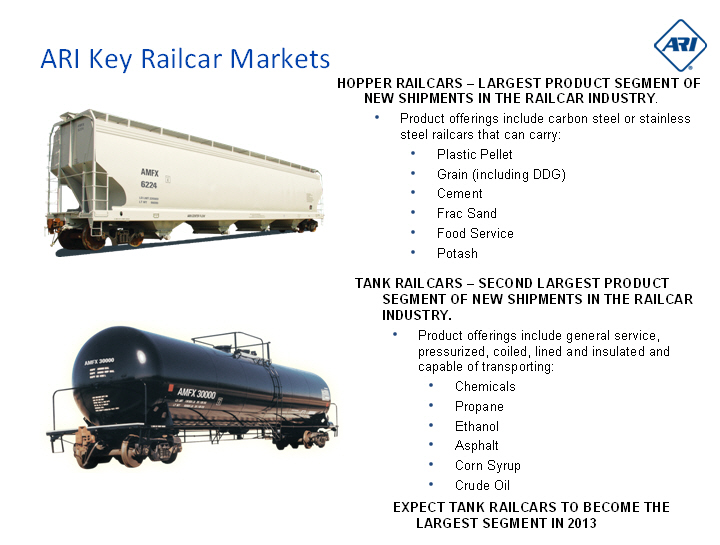
| ARI Key Railcar Markets HOPPER RAILCARS - LARGEST PRODUCT SEGMENT OF NEW SHIPMENTS IN THE RAILCAR INDUSTRY. Product offerings include carbon steel or stainless steel railcars that can carry: Plastic Pellet Grain (including DDG) Cement Frac Sand Food Service Potash TANK RAILCARS - SECOND LARGEST PRODUCT SEGMENT OF NEW SHIPMENTS IN THE RAILCAR INDUSTRY. Product offerings include general service, pressurized, coiled, lined and insulated and capable of transporting: Chemicals Propane Ethanol Asphalt Corn Syrup Crude Oil EXPECT TANK RAILCARS TO BECOME THE LARGEST SEGMENT IN 2013 |
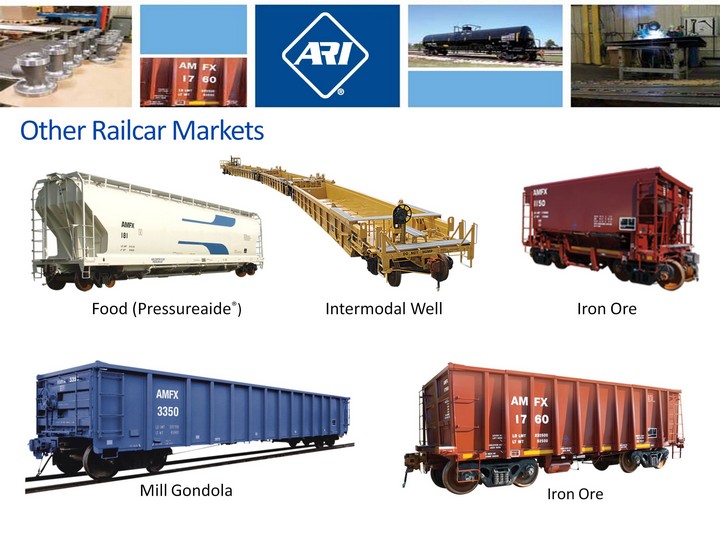
| Other Railcar Markets Food (Pressureaide(r)) Intermodal Well Iron Ore Mill Gondola Iron Ore |
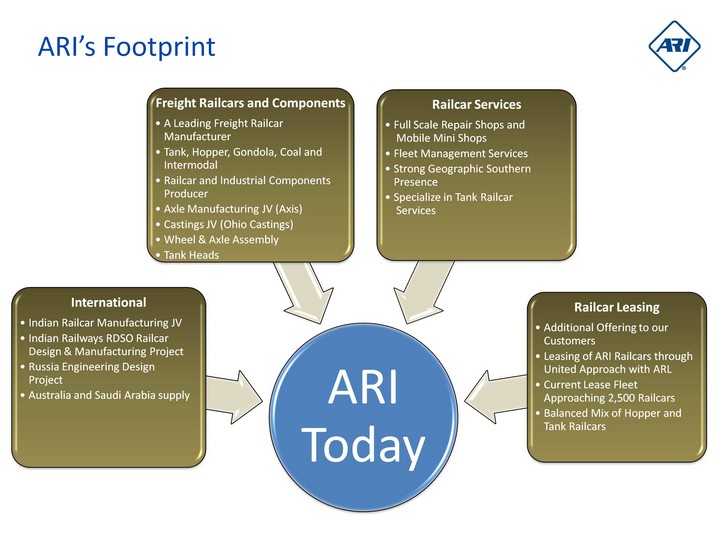
| ARI's Footprint |
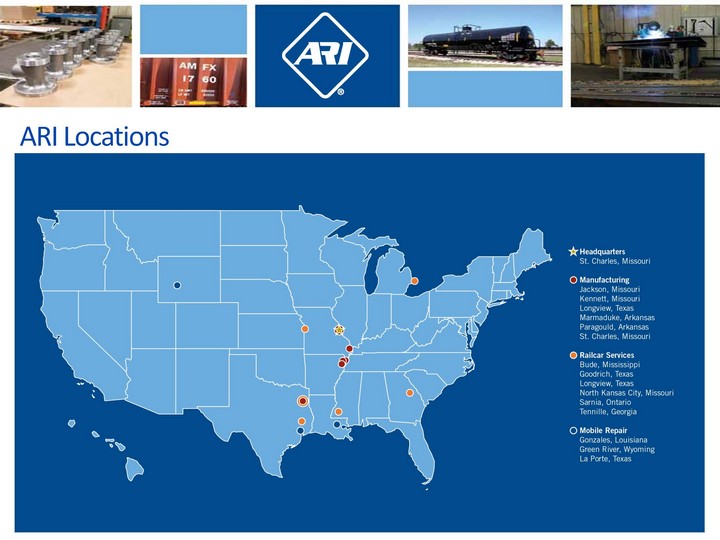
| ARI Locations |
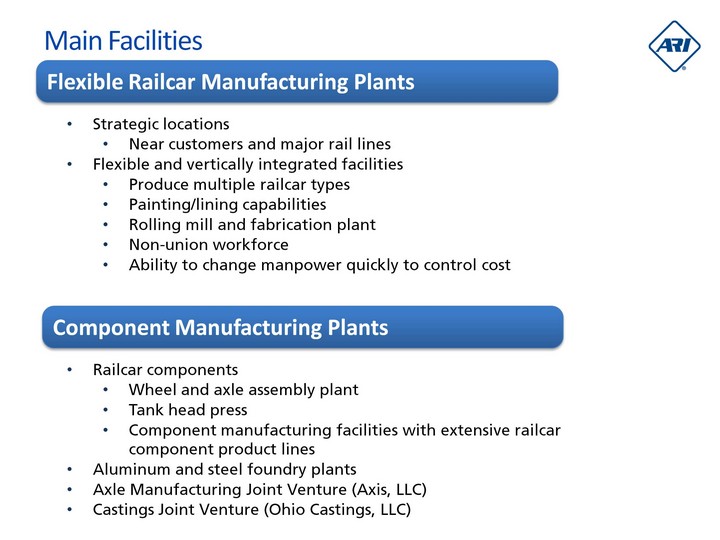
| Main Facilities Strategic locations Near customers and major rail lines Flexible and vertically integrated facilities Produce multiple railcar types Painting/lining capabilities Rolling mill and fabrication plant Non-union workforce Ability to change manpower quickly to control cost Railcar components Wheel and axle assembly plant Tank head press Component manufacturing facilities with extensive railcar component product lines Aluminum and steel foundry plants Axle Manufacturing Joint Venture (Axis, LLC) Castings Joint Venture (Ohio Castings, LLC) Flexible Railcar Manufacturing Plants Component Manufacturing Plants |
| ARI entered into the railcar leasing market in second half 2011 Lease fleet at the end of 2012 is approximately 2,500 railcars Plan to allocate 20-25% of future production to railcars for lease ARI formed the wholly-owned subsidiary, Longtrain Leasing I, LLC to complete a $199.8 million financing of our railcar lease fleet on December 21, 2012 Railcar Leasing |
| Complementary Railcar Services to Diversify Revenue Mix Integrated offering provides ARI with insights into customers' needs and a revenue stream not dependent on railcar production cycle RAILCAR REPAIR & REFURBISHMENT Light/heavy railcar repairs Exterior painting Interior lining and cleaning Safety valve testing Railcar inspections Wheel and axle replacement Railcar certification On-site customer repairs ARI Railcar Services Offering Railcar fleet management services Mileage accounting Rolling stock taxes Regulatory compliance Engineering services Online service access Maintenance planning |
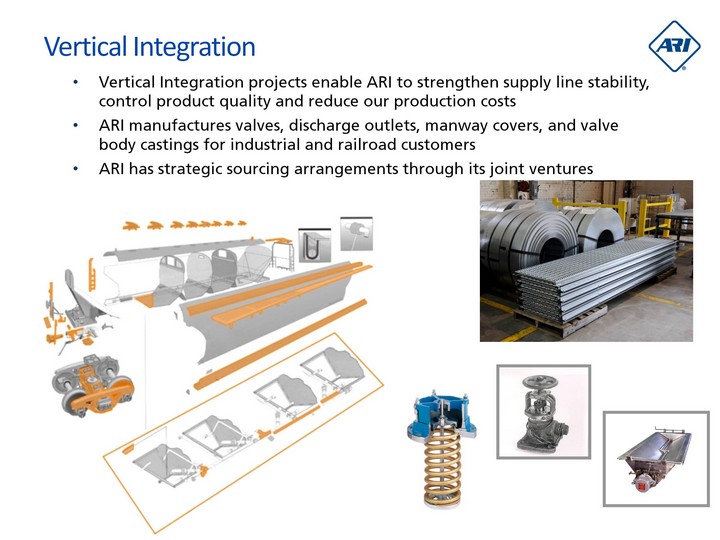
| Vertical Integration Vertical Integration projects enable ARI to strengthen supply line stability, control product quality and reduce our production costs ARI manufactures valves, discharge outlets, manway covers, and valve body castings for industrial and railroad customers ARI has strategic sourcing arrangements through its joint ventures |
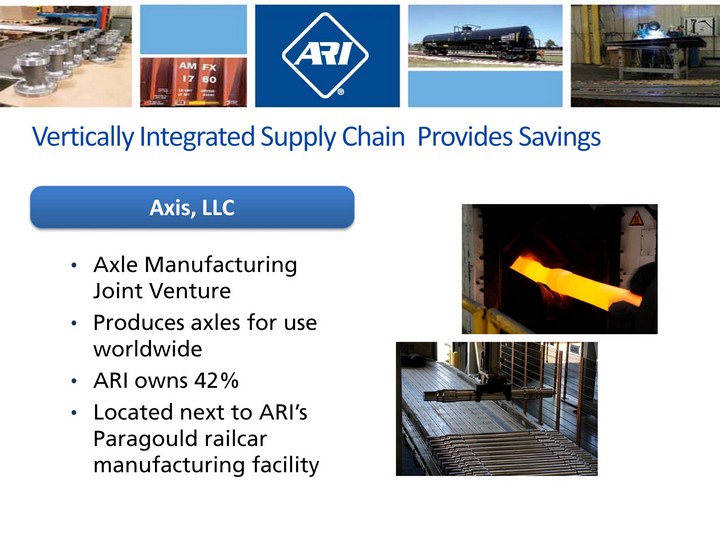
| Vertically Integrated Supply Chain Provides Savings Axle Manufacturing Joint Venture Produces axles for use worldwide ARI owns 42% Located next to ARI's Paragould railcar manufacturing facility Axis, LLC |
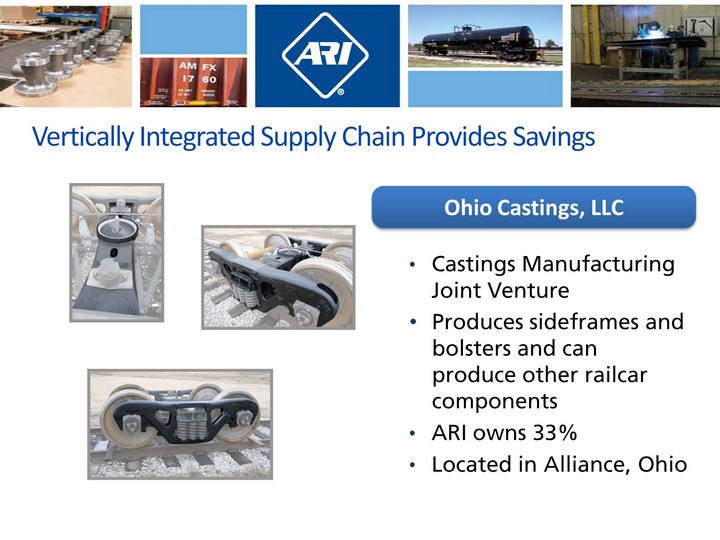
| Vertically Integrated Supply Chain Provides Savings Castings Manufacturing Joint Venture Produces sideframes and bolsters and can produce other railcar components ARI owns 33% Located in Alliance, Ohio Ohio Castings, LLC |
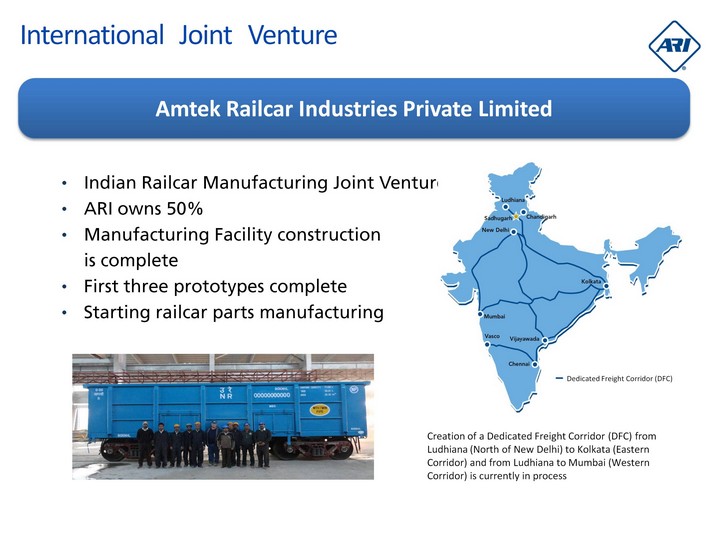
| International Joint Venture Indian Railcar Manufacturing Joint Venture ARI owns 50% Manufacturing Facility construction is complete First three prototypes complete Starting railcar parts manufacturing Amtek Railcar Industries Private Limited Creation of a Dedicated Freight Corridor (DFC) from Ludhiana (North of New Delhi) to Kolkata (Eastern Corridor) and from Ludhiana to Mumbai (Western Corridor) is currently in process Dedicated Freight Corridor (DFC) |
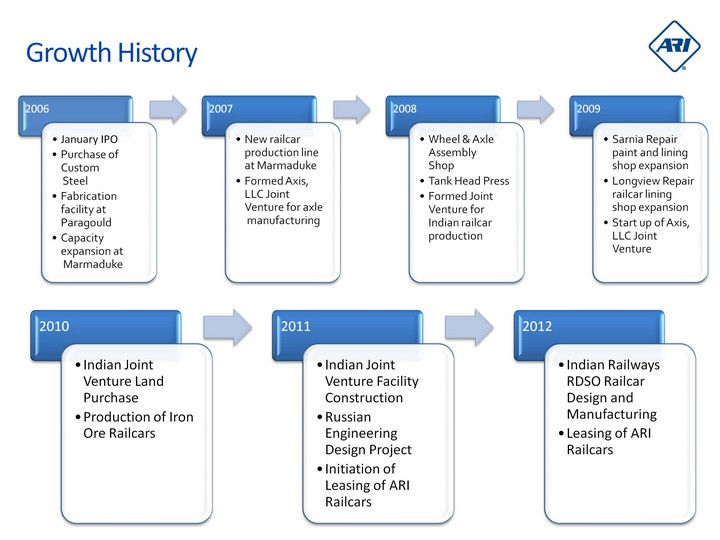
| Growth History |
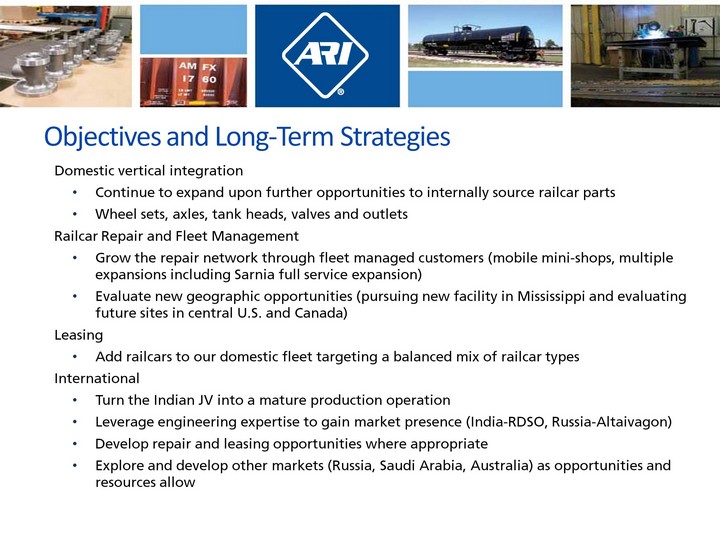
| Objectives and Long-Term Strategies Domestic vertical integration Continue to expand upon further opportunities to internally source railcar parts Wheel sets, axles, tank heads, valves and outlets Railcar Repair and Fleet Management Grow the repair network through fleet managed customers (mobile mini-shops, multiple expansions including Sarnia full service expansion) Evaluate new geographic opportunities (pursuing new facility in Mississippi and evaluating future sites in central U.S. and Canada) Leasing Add railcars to our domestic fleet targeting a balanced mix of railcar types International Turn the Indian JV into a mature production operation Leverage engineering expertise to gain market presence (India-RDSO, Russia-Altaivagon) Develop repair and leasing opportunities where appropriate Explore and develop other markets (Russia, Saudi Arabia, Australia) as opportunities and resources allow |
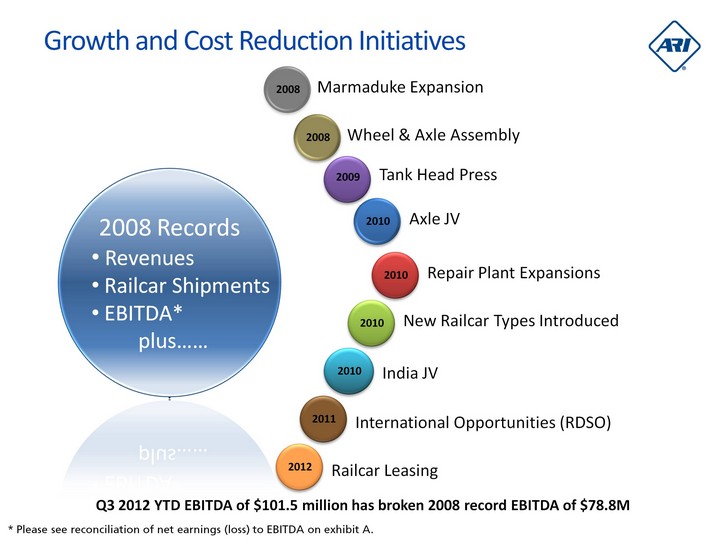
| 2008 Records Revenues Railcar Shipments EBITDA* plus...... Growth and Cost Reduction Initiatives * Please see reconciliation of net earnings (loss) to EBITDA on exhibit A. 2008 2008 2010 2009 2010 2010 2010 2011 2012 Q3 2012 YTD EBITDA of $101.5 million has broken 2008 record EBITDA of $78.8M |
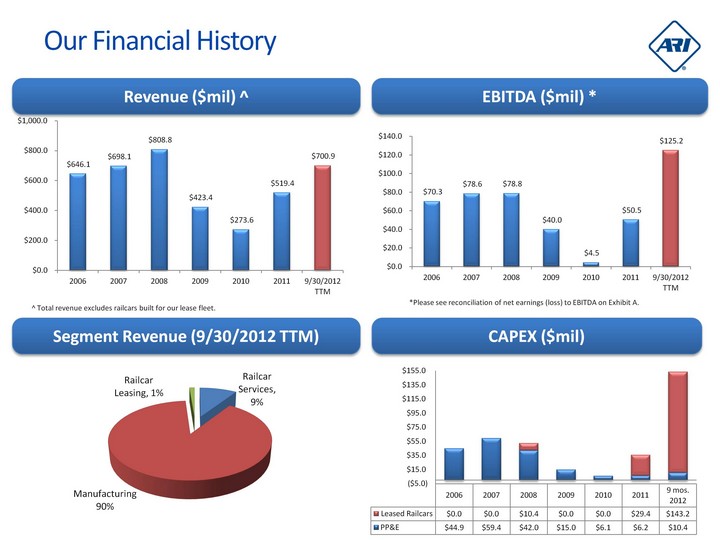
| (CHART) Our Financial History Revenue ($mil) ^ Segment Revenue (9/30/2012 TTM) EBITDA ($mil) * CAPEX ($mil) (CHART) (CHART) *Please see reconciliation of net earnings (loss) to EBITDA on Exhibit A. (CHART) ^ Total revenue excludes railcars built for our lease fleet. |
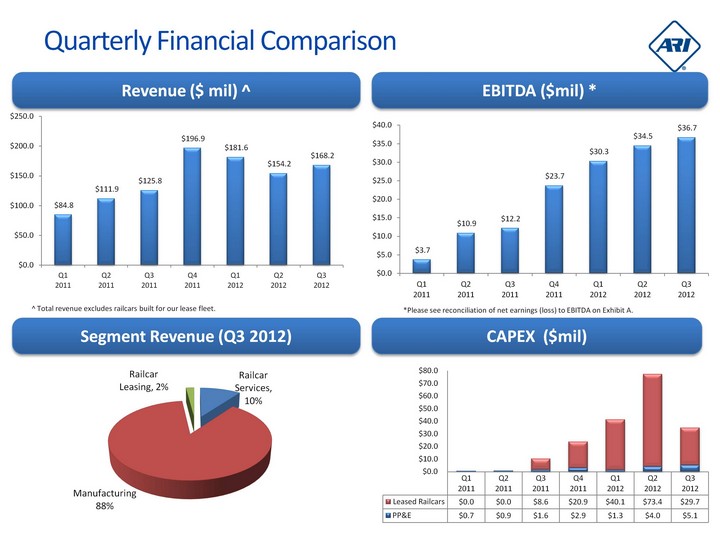
| (CHART) Quarterly Financial Comparison Revenue ($ mil) ^ Segment Revenue (Q3 2012) EBITDA ($mil) * CAPEX ($mil) (CHART) (CHART) *Please see reconciliation of net earnings (loss) to EBITDA on Exhibit A. (CHART) ^ Total revenue excludes railcars built for our lease fleet. |
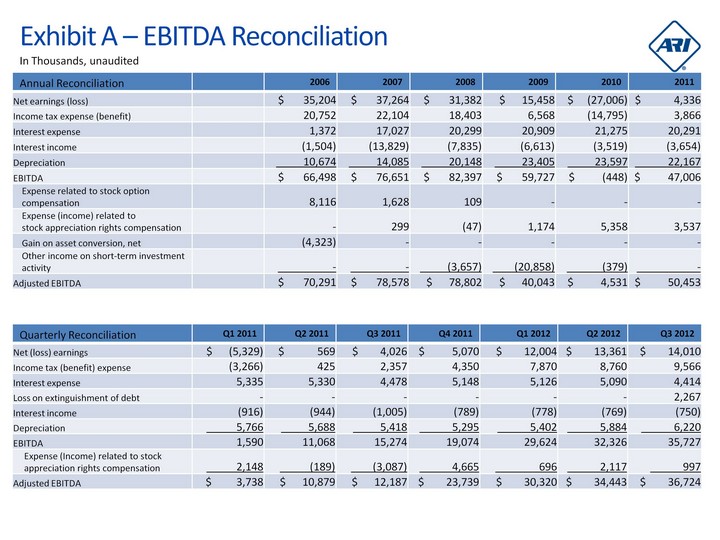
| 2006 2007 2008 2009 2010 2011 Net earnings (loss) $ 35,204 $ 37,264 $ 31,382 $ 15,458 $ (27,006) $ 4,336 Income tax expense (benefit) 20,752 22,104 18,403 6,568 (14,795) 3,866 Interest expense 1,372 17,027 20,299 20,909 21,275 20,291 Interest income (1,504) (13,829) (7,835) (6,613) (3,519) (3,654) Depreciation 10,674 14,085 20,148 23,405 23,597 22,167 EBITDA $ 66,498 $ 76,651 $ 82,397 $ 59,727 $ (448) $ 47,006 Expense related to stock option compensation 8,116 1,628 109 - - - Expense (income) related to stock appreciation rights compensation - 299 (47) 1,174 5,358 3,537 Gain on asset conversion, net (4,323) - - - - - Other income on short-term investment activity - - (3,657) (20,858) (379) - Adjusted EBITDA $ 70,291 $ 78,578 $ 78,802 $ 40,043 $ 4,531 $ 50,453 Exhibit A - EBITDA Reconciliation Q1 2011 Q2 2011 Q3 2011 Q4 2011 Q1 2012 Q2 2012 Q3 2012 Net (loss) earnings $ (5,329) $ 569 $ 4,026 $ 5,070 $ 12,004 $ 13,361 $ 14,010 Income tax (benefit) expense (3,266) 425 2,357 4,350 7,870 8,760 9,566 Interest expense 5,335 5,330 4,478 5,148 5,126 5,090 4,414 Loss on extinguishment of debt - - - - - - 2,267 Interest income (916) (944) (1,005) (789) (778) (769) (750) Depreciation 5,766 5,688 5,418 5,295 5,402 5,884 6,220 EBITDA 1,590 11,068 15,274 19,074 29,624 32,326 35,727 Expense (Income) related to stock appreciation rights compensation 2,148 (189) (3,087) 4,665 696 2,117 997 Adjusted EBITDA $ 3,738 $ 10,879 $ 12,187 $ 23,739 $ 30,320 $ 34,443 $ 36,724 Annual Reconciliation Quarterly Reconciliation In Thousands, unaudited |
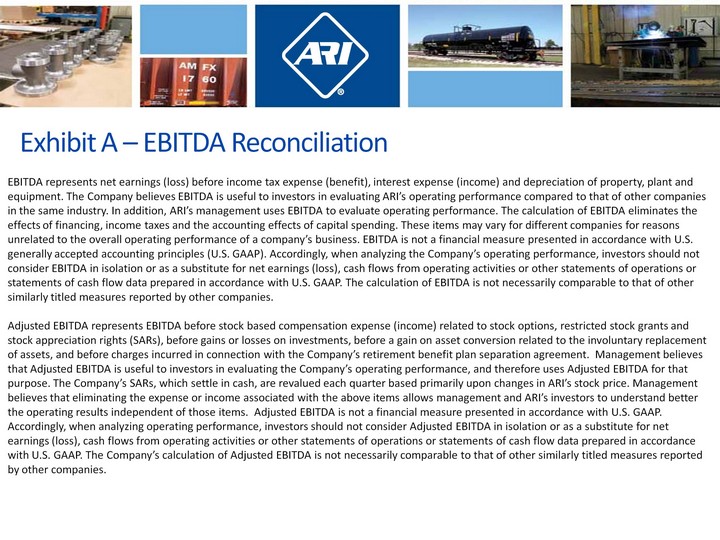
| EBITDA represents net earnings (loss) before income tax expense (benefit), interest expense (income) and depreciation of property, plant and equipment. The Company believes EBITDA is useful to investors in evaluating ARI's operating performance compared to that of other companies in the same industry. In addition, ARI's management uses EBITDA to evaluate operating performance. The calculation of EBITDA eliminates the effects of financing, income taxes and the accounting effects of capital spending. These items may vary for different companies for reasons unrelated to the overall operating performance of a company's business. EBITDA is not a financial measure presented in accordance with U.S. generally accepted accounting principles (U.S. GAAP). Accordingly, when analyzing the Company's operating performance, investors should not consider EBITDA in isolation or as a substitute for net earnings (loss), cash flows from operating activities or other statements of operations or statements of cash flow data prepared in accordance with U.S. GAAP. The calculation of EBITDA is not necessarily comparable to that of other similarly titled measures reported by other companies. Adjusted EBITDA represents EBITDA before stock based compensation expense (income) related to stock options, restricted stock grants and stock appreciation rights (SARs), before gains or losses on investments, before a gain on asset conversion related to the involuntary replacement of assets, and before charges incurred in connection with the Company's retirement benefit plan separation agreement. Management believes that Adjusted EBITDA is useful to investors in evaluating the Company's operating performance, and therefore uses Adjusted EBITDA for that purpose. The Company's SARs, which settle in cash, are revalued each quarter based primarily upon changes in ARI's stock price. Management believes that eliminating the expense or income associated with the above items allows management and ARI's investors to understand better the operating results independent of those items. Adjusted EBITDA is not a financial measure presented in accordance with U.S. GAAP. Accordingly, when analyzing operating performance, investors should not consider Adjusted EBITDA in isolation or as a substitute for net earnings (loss), cash flows from operating activities or other statements of operations or statements of cash flow data prepared in accordance with U.S. GAAP. The Company's calculation of Adjusted EBITDA is not necessarily comparable to that of other similarly titled measures reported by other companies. Exhibit A - EBITDA Reconciliation |

| INNOVATIVE AGILE Responsive A R I |
