Attached files
| file | filename |
|---|---|
| 8-K - 8-K - ATHENAHEALTH INC | athn-20121231x8k.htm |
| EX-99.1 - PRESS RELEASE - ATHENAHEALTH INC | athnq42012earningsrelease.htm |
Fourth Quarter and Fiscal Year 2012 
Prepared Remarks February 7, 2013
Jonathan Bush, President, Chairman & Chief Executive Officer
Tim Adams, Senior Vice President & Chief Financial Officer
About These Remarks
The following commentary is provided by management in conjunction with the fourth quarter and full year 2012 earnings press release issued by athenahealth, Inc. (the “Company,” “we,” or “athenahealth”). These remarks represent management’s current views on the Company’s financial and operational performance and are provided to give investors and analysts more time to analyze and understand our performance in advance of the earnings conference call. These prepared remarks will not be read on the conference call. A complete reconciliation between GAAP and non-GAAP results, as well as a summary of supplemental metrics and definitions, is provided in the tables following these prepared remarks.
Earnings Conference Call Information
To participate in the Company’s live conference call and webcast, please dial 800-447-0521 (or 847-413-3238 for international calls) using conference code No. 34078406, or visit the Investors section of the Company’s web site at www.athenahealth.com. A replay will be available for one week following the conference call at 888-843-7419 (and 630-652-3042 for international calls) using conference code No. 34078406. A webcast replay will also be archived on the Company’s website.
Regulation M-A Disclosures
In connection with the acquisition of Epocrates, Inc. ("Epocrates") by athenahealth pursuant to an Agreement and Plan of Merger (the “Merger”), Epocrates will file with the U.S. Securities and Exchange Commission (the “SEC”) a proxy statement and other relevant materials in connection with the proposed transaction. Epocrates will also mail the proxy statement to Epocrates stockholders. athenahealth and Epocrates urge investors and security holders to read the proxy statement and the other relevant material when they become available because these materials will contain important information about athenahealth, Epocrates, and the proposed transaction. The proxy statement and other relevant materials (when they become available), and any and all documents filed with the SEC, may be obtained free of charge at the SEC's web site at www.sec.gov. In addition, free copies of the documents filed with the SEC by athenahealth will be available on the “Investors” portion of athenahealth's website at www.athenahealth.com. Free copies of the documents filed with the SEC by Epocrates will be available on the “Investor Relations” portion of Epocrates' website at www.epocrates.com. INVESTORS AND SECURITY HOLDERS ARE URGED TO READ THE PROXY STATEMENT AND THE OTHER RELEVANT MATERIALS WHEN THEY BECOME AVAILABLE BEFORE MAKING ANY VOTING OR INVESTMENT DECISION WITH RESPECT TO THE PROPOSED TRANSACTION.
athenahealth, Echo Merger Sub, Inc. (“MergerSub”), Epocrates, and their respective executive officers and directors may be deemed to be participants in the solicitation of proxies from the security holders of Epocrates in connection with the Merger. Information about those executive officers and directors of athenahealth is set forth in athenahealth's proxy statement for its 2012 annual meeting of stockholders, which was filed with the SEC on April 26, 2012, will be included in Epocrates' proxy statement to be filed with the SEC in connection with the proposed transaction as described above, and is supplemented by other public filings made, and to be made, with the SEC. Information about those executive officers and directors of Epocrates and their ownership of Epocrates common stock is set forth in Epocrates' proxy statement for its 2012 annual meeting of stockholders, which was filed with the SEC on August 30, 2012, and is supplemented by other public filings made, and to be made, with the SEC. Investors and security holders may obtain additional information regarding the direct and indirect interests of athenahealth, MergerSub, Epocrates, and their respective executive officers and directors in the Merger by reading the proxy statement and the other filings and documents referred to above. This document does not constitute an offer of any securities for sale.
1
Safe Harbor and Forward-Looking Statements
These remarks contain forward-looking statements, which are made pursuant to the safe harbor provisions of the Private Securities Litigation Reform Act of 1995, including statements reflecting management’s expectations for future financial and operational performance and operational expenditures, expected growth, and business outlook; statements regarding the Company’s research and development efforts and product offering and upgrade plans and timelines; the benefits of and anticipated operational results from the Company’s service offerings; the further integration of the Company’s services and the resulting benefits; changes in the types of providers and health care entities the Company serves and the range of tasks the Company performs for clients; the Company’s sales and marketing activities and plans; the transaction with Epocrates; customer and client behavior and preferences; the Company's market position and awareness among physicians; the potential for cross-sales among service offerings and sales involving multiple services; the Company’s implementation pipeline; the expansion of the number of users of the Company’s care coordination and credentialing services; the benefits of and plans for Healthcare Data Services LLC; the Company’s plans in regard to Stage 2 of Meaningful Use; changes in the industry, including an increased emphasis on coordinated care; the creation of a sustainable market for health information exchange, a social network for health care, an ecosystem of developers and third-party service providers, and a national health IT network; and statements found under the Company’s “Reconciliation of Non-GAAP Financial Measures to Comparable GAAP Measures” section of these remarks. The forward-looking statements in these remarks do not constitute guarantees of future performance. These statements are neither promises nor guarantees, and are subject to a variety of risks and uncertainties, many of which are beyond the Company’s control, which could cause actual results to differ materially from those contemplated in these forward-looking statements. In particular, the risks and uncertainties include, among other things: the Company’s fluctuating operating results; the Company’s variable sales and implementation cycles, which may result in fluctuations in its quarterly results; risks associated with the acquisition and integration of companies and new technologies, including those related to the Company’s ability to successfully integrate the athenaCoordinator® service and successfully scale the Healthcare Data Services services and technologies to achieve expected synergies, and, if the acquisition is completed, those related to the Company's ability to integrate the services and offerings of Epocrates and realize the expected benefits; risks associated with its expectations regarding its ability to maintain profitability; the impact of increased sales and marketing expenditures, including whether increased expansion in revenues is attained and whether impact on margins and profitability is longer term than expected; changes in tax rates or exposure to additional tax liabilities; the highly competitive industry in which the Company operates and the relative immaturity of the market for its service offerings; and the evolving and complex governmental and regulatory compliance environment in which the Company and its clients operate. Existing and prospective investors are cautioned not to place undue reliance on these forward-looking statements, which speak only as of the date hereof. The Company undertakes no obligation to update or revise the information contained in these remarks, whether as a result of new information, future events or circumstances, or otherwise. For additional disclosure regarding these and other risks faced by the Company, see the disclosures contained in its public filings with the Securities and Exchange Commission, available on the Investors section of the Company’s website at http://www.athenahealth.com and on the SEC’s website at http://www.sec.gov.
Use of Non-GAAP Financial Measures
These remarks contain non-GAAP financial measures, as defined by SEC Regulation G. The GAAP financial measure most directly comparable to each non-GAAP financial measure used or discussed, and a reconciliation of the differences between each non-GAAP financial measure and the comparable GAAP financial measure, are included following these prepared remarks or can be found within the Company’s fourth quarter and full year 2012 earnings press release on the Investors section of the Company’s web site at http://www.athenahealth.com.
2
Opening Remarks
2012 marked our thirteenth consecutive year of 30% revenue growth and continued expansion of our national network. While we did not achieve everything we set out to do this year, we did accomplish a great deal. We completed the seamless transition to the American National Standards Institute (ANSI) 5010 standard, launched our mobile strategy and provider credentialing service, introduced our sixth service offering, HDS, and advanced our More Disruption Please program to name a few. Our enterprise deal momentum continued throughout 2012 with the signings of Health Management Physician Network (Q2 2012), Children's Hospital Los Angeles Medical Group (Q3 2012), Children's Hospital Central California (Q4 2012), Prospira PainCare (Q4 2012) and Emergency Medicine Physicians (Q4 2012). These announced deals as well as other signings clearly demonstrate that athenahealth is a major player in the enterprise space. During 2012, we added 7,012 providers onto athenaCollector®, 4,401 providers onto athenaClinicals® and 8,235 providers onto athenaCommunicator®. Our national network also grew via our “lite” service offerings by signing 7,680 billable providers onto athenaCoordinator Core. While enjoying 30% growth, positive industry recognition and high client satisfaction, our main barrier to growth is still physician awareness which saw only a modest increase from 29% to 31%. We believe the recently announced acquisition of Epocrates, Inc., if completed, will provide a powerful new awareness program that will support our 30% growth goals and enable us to better serve our nationwide network of partners.
With all of these accomplishments, we exited 2012 a few steps closer to achieving our vision of building an information backbone that helps health care work as it should. While we are still early in our pursuit, our vision of creating an economically sustainable market for effective health information exchange between senders and receivers, via athenaCoordinator and our new orders-based pricing model, is starting to materialize. Our clients are beginning to realize the true value of an integrated network. In 2012, we saw examples of our clients encouraging their trading partners to join the athenahealth network. We believe this is the beginning of potentially viral growth of both senders and receivers onto our network.
We are poised for even more success in 2013 and beyond. As discussed at our Annual Investor Summit on December 6, 2012, our four most significant strategic initiatives are: 1) transform the athenaNet® user experience; 2) enable clients to clinically integrate; 3) equip care givers to win in a global risk market; and 4) open athenaNet and build an ecosystem of partners. By executing against these initiatives, we believe athenahealth will continue to disrupt the incumbent legacy software model in health care IT and will further transform the way business is conducted in the U.S. health care industry.
Results Overview
athenahealth’s top line results for the fourth quarter and fiscal year (FY) 2012 reflect solid revenue growth:
• | Total revenue: |
◦ | $116.3 million in Q4 2012, representing 26% growth over $92.5 million in Q4 2011 |
◦ | $422.3 million in FY 2012, representing 30% growth over $324.1 million in FY 2011 |
Our bottom line results for Q4 and FY 2012, consistent with our growth strategy, demonstrate strong sales, marketing, and research and development investments, and a focus on operating leverage:
• | Non-GAAP Adjusted Gross Profit: |
◦ | $73.7 million, or 63.4% of total revenue, in Q4 2012, an increase of 24% over $59.4 million, or 64.2% of total revenue, in Q4 2011 |
◦ | $264.4 million, or 62.6% of total revenue, in FY 2012, an increase of 28% over $206.7 million, or 63.8% of total revenue, in FY 2011 |
• | GAAP selling and marketing expense: |
3
◦ | $27.6 million, or 23.7% of total revenue, in Q4 2012, an increase of 19% over $23.2 million, or 25.1% of total revenue, in Q4 2011 |
◦ | $104.3 million, or 24.7% of total revenue, in FY 2012, an increase of 31% over $79.8 million or 24.6% of total revenue, in FY 2011 |
• | GAAP research and development expense: |
◦ | $9.3 million, or 8.0% of total revenue, in Q4 2012, an increase of 33% over $7.0 million, or 7.5% of total revenue, in Q4 2011 |
◦ | $33.8 million, or 8.0% of total revenue, in FY 2012, an increase of 45% over $23.3 million, or 7.2% of total revenue, in FY 2011 |
• | GAAP general and administrative expense: |
◦ | $15.0 million, or 12.9% of total revenue, in Q4 2012, versus $13.4 million, or 14.5% of total revenue, in Q4 2011 |
◦ | $57.0 million, or 13.5% of total revenue, in FY 2012, versus $48.7 million, or 15.0% of total revenue, in FY 2011 |
• | Non-GAAP Adjusted EBITDA: |
◦ | $27.1 million, or 23.3% of total revenue, in Q4 2012, an increase of 31% from $20.7 million, or 22.4% of total revenue, in Q4 2011 |
◦ | $90.9 million, or 21.5% of total revenue in FY 2012, an increase of 29% over $70.6 million, or 21.8% of total revenue, in FY 2011 |
◦ | Non-GAAP Adjusted Operating Income: |
◦ | $19.7 million, or 16.9% of total revenue, in Q4 2012, an increase of 24% from $15.9 million, or 17.2% of total revenue, in Q4 2011 |
◦ | $65.5 million, or 15.5% of total revenue in FY 2012, an increase of 22% over $53.9 million, or 16.6% of total revenue, in FY 2011 |
• | Non-GAAP Adjusted Net Income: |
◦ | $10.8 million, or $0.29 per diluted share, in Q4 2012, an increase of 16% from $9.3 million, or $0.26 per diluted share, in Q4 2011 |
◦ | $37.2 million, or $1.00 per diluted share, in FY 2012, an increase of 17% from $31.8 million, or $0.88 per diluted share, in FY 2011 |
We measure our performance based on a balanced scorecard model. We believe that this framework is an excellent report card for our performance for the current year and that it measures the key performance indicators required for long-term success. The table below shows the scorecard results for Q1, Q2, Q3, and Q4 as well as the full year 2012 targets. For certain scorecard metrics (i.e., Client DAR, DAR in Client Work Buckets, Provider Documentation Time, and Client Tickets per Provider), our goal is to improve our performance by effectively reducing the scorecard metrics results throughout the year. Therefore, the full year target may be lower than the Q1 2012, Q2 2012, Q3 2012 and Q4 2012 actual results for these metrics.
4
Weight | Q1 2012 Results | Q2 2012 Results | Q3 2012 Results | Q4 2012 Results | FY 2012 Results | Fiscal Year 2012 Targets | |||||||||
Stability | |||||||||||||||
Voluntary Turnover | 10% | 2 | % | 3 | % | 2 | % | 2 | % | 8 | % | 10 | % | ||
Corporate Compliance | 5% | 88 | % | 80 | % | 77 | % | 76 | % | 80 | % | 95 | % | ||
Employee Engagement | —% | 4.1 | 4.1 | 4.1 | 4.1 | 4.1 | 4.1 | ||||||||
Stability Results | 15% | 115 | % | 99 | % | 111 | % | 112 | % | 109 | % | 100 | % | ||
Performance | |||||||||||||||
Client Days in Accounts Receivable (DAR) | 10% | 40.0 | 38.2 | 37.6 | 36.4 | 38.0 | 37.5 | ||||||||
DAR in Client Work Buckets | 10% | 8.3 | 7.6 | 7.7 | 7.5 | 7.8 | 7.9 | ||||||||
Client Collection Rate | 5% | 96 | % | 96 | % | 96 | % | 95 | % | 96 | % | 96 | % | ||
Provider Documentation Time per Appointment | 5% | 5.4 | 5.2 | 5.1 | 5.0 | 5.2 | 5.0 | ||||||||
Performance Results | 30% | 101 | % | 103 | % | 98 | % | 94 | % | 99 | % | 100 | % | ||
Satisfaction | |||||||||||||||
Client Touches per Claim | 5% | (a) | (a) | (a) | (a) | (a) | 10% improvement | ||||||||
Client Tickets per Provider (per month) | 5% | 0.34 | 0.33 | 0.36 | 0.32 | 0.34 | 0.35 | ||||||||
Client Satisfaction | 10% | 86 | % | 90 | % | 87 | % | 87 | % | 88 | % | 85 | % | ||
Satisfaction Results | 20% | 103 | % | 107 | % | 103 | % | 106 | % | 105 | % | 100 | % | ||
Financial | |||||||||||||||
Total Revenue | 10% | $96.6M | $103.5M | $105.9M | $116.3M | $422.3M | $430M | ||||||||
Non-GAAP Adjusted Operating Income | 5% | $11.6M | $14.8M | $19.4M | $19.7M | $65.5M | $60M | ||||||||
Financial Results | 15% | 123 | % | 107 | % | 99 | % | 92 | % | 101 | % | 100 | % | ||
Growth | |||||||||||||||
Bookings | 20% | (a) | (a) | (a) | (a) | (a) | 30% growth | ||||||||
Growth Results | 20% | 97 | % | 98 | % | 64 | % | 93 | % | 88 | % | 100 | % | ||
Total Results | 100% | 106 | % | 103 | % | 94 | % | 99 | % | 100 | % | 100 | % | ||
(a) Since the Client Touches per Claim and Bookings metrics contain highly sensitive data, we do not disclose all of the specific performance measures and targets, because we believe that such disclosure would result in serious competitive harm. | |||||||||||||||
We achieved a scorecard result of 99% of goal in Q4 2012 and 100% for FY 2012. We believe that the Company’s underlying drivers of long-term success remain strong as supported by the following metric results:
• | Employee Engagement at 4.1 out of 5.0 in Q4 2012, versus goal of 4.1 and Q4 2011 actual result of 4.0 |
• | Average Client Days in Accounts Receivable (DAR) of 36.4 days in Q4 2012, versus goal of 36 days and Q4 2011 actual result of 38.9 |
• | 7.5 average DAR in Client Work Buckets in Q4 2012, slightly unfavorable to our goal of 6.5 days |
• | Client Collection Rate of 95.4% in Q4 2012, mostly in line with our goal of 96% |
• | Provider Documentation Time per Appointment achieved our stretch goal of 5.0 minutes in Q4 2012 |
• | Client Satisfaction of 87.2% in Q4 2012, versus goal of 85% and Q4 2011 actual result of 87.3% |
5
athenahealth's client base continues to expand while client adoption of other services in the athenahealth service suite grows. As our client base expands outside the traditional ambulatory market, we believe that total active providers or nodes on our network will become a more appropriate metric to use in measuring our market share. During Q4 2012:
• | 82% of all new athenaCollector deals included athenaClinicals, up from 73% in Q4 2011 |
• | 67% of all new athenaCollector deals included athenaClinicals and athenaCommunicator. Additionally, 56% of all new athenaOneSM deals sold during Q4 2012 also included athenaCoordinator Core. This compares to 44% of all new athenaCollector deals included athenaClinicals and athenaCommunicator in Q4 2011 |
• | Net new physicians and providers added sequentially to the network were as follows: |
athenaCollector | athenaClinicals | athenaCommunicator | ||||||||||||
Active physicians and providers: | Physicians | Providers | Physicians | Providers | Physicians | Providers | ||||||||
Beginning balance as of 9/30/12 | 27,013 | 38,145 | 7,340 | 10,062 | 8,739 | 12,149 | ||||||||
Net new additions | 998 | 1,607 | 609 | 864 | 1,414 | 1,916 | ||||||||
Ending balance as of 12/31/12 | 28,011 | 39,752 | 7,949 | 10,926 | 10,153 | 14,065 | ||||||||
Sequential growth % | 4 | % | 4 | % | 8 | % | 9 | % | 16 | % | 16 | % | ||
• | Net new physicians and providers added to the network since Q4 2011 were as follows: |
athenaCollector | athenaClinicals | athenaCommunicator | ||||||||||||
Active physicians and providers: | Physicians | Providers | Physicians | Providers | Physicians | Providers | ||||||||
Beginning balance as of 12/31/11 | 23,210 | 32,740 | 4,662 | 6,525 | 4,098 | 5,830 | ||||||||
Net new additions | 4,801 | 7,012 | 3,287 | 4,401 | 6,055 | 8,235 | ||||||||
Ending balance as of 12/31/12 | 28,011 | 39,752 | 7,949 | 10,926 | 10,153 | 14,065 | ||||||||
Y/Y growth % | 21 | % | 21 | % | 71 | % | 67 | % | 148 | % | 141 | % | ||
athenaCollector network performance metrics were as follows for Q4 2012:
• | $2,540,153,162 posted in total client collections, up 28% from Q4 2011 |
• | 20,055,715 total claims submitted, up 23% from Q4 2011 |
• | 81.7% electronic remittance advice (ERA) rate, a 3.8 point improvement over Q4 2011 |
• | 94.2% first pass resolution (FPR) rate, up 0.5 points from 93.7% at Q4 2011 |
Product Development Discussion
Product development at athenahealth is organized around the goal of being the best in the world at getting medical care givers paid for doing the right thing. In order to fulfill this goal, we deliver services backed by cloud-based software, proprietary knowledge, and robust back-office services.
athenaCollector Service Offering
athenaCollector is our cloud-based medical billing and practice management solution. It is the foundation of our service portfolio and entered general availability in 2000.
Through our co-sourcing business model, athenahealth has developed a comparative advantage in handling repetitive paperwork and information exchange on behalf of our clients. We have spent the past twelve years developing our patented rules engine, building thousands of interfaces with trading partners and expanding our back-office services to create this comparative advantage. We continue to look for error prone processes that we can take over, improve and scale for the benefit of our entire national network. Through our differentiated cloud-based services model, athenahealth is expanding services for
6
our existing client base (i.e., credentialing, contract management, and eligibility-related denials) while also expanding our services into different care delivery models (i.e., ambulance transport companies, hospitalists, Federally Qualified Health Centers, and Rural Health Clinics). In less than 12 months, we have enrolled 30 clients and over 1,100 providers in our provider credentialing service. We anticipate rapid adoption of this service enhancement during 2013 and project that we will enroll close to 20% of our athenaCollector providers in our provider credentialing service by the end of 2013. athenahealth is also actively broadening the types of health care entities we serve. After signing our first ambulance transport company in late 2011, the athenaCollector product development team worked tirelessly to learn and build the front-end and back-end capabilities for ambulance billing into athenaNet. With this pilot currently underway, ambulance billing is now another emerging competency of the ever-expanding athenahealth service offering.
Our hard work has not gone unnoticed. athenahealth's meaningful service enhancements and dedication to our clients' success have been acknowledged with high customer satisfaction scores and favorable industry recognition. athenaCollector earned top rankings in the 2012 Best in KLAS Awards: Software & Services annual report. It was named Best in KLAS in Practice Management in two market segments: physician practices with 1-10 and 11-75 physicians.
athenaClinicals Service Offering
athenaClinicals is our cloud-based electronic health record (EHR) management service. It entered general availability in 2006 and was made available as a stand-alone service in 2010.
athenaClinicals was named Best in KLAS in the Ambulatory EHR in the 1-10 physician segment and was ranked second in the 11-75 physician segment. Our successful implementations and meaningful service enhancements helped athenahealth outpace many of the other HIT vendors. In addition, the 2012 Best in KLAS report noted that 95% of athenahealth's customers surveyed indicated they would buy the athenaClinicals service again. We believe our dedication to our clients' performance and our industry-leading Meaningful Use (MU) attestation success helped us earn these high KLAS rankings. While we are honored by the Best in KLAS rankings, they only serve to fuel our efforts to improve our service offering and drive further MU attestation success. As posted on our MU performance online dashboard, 89% of eligible athenaClinicals providers have successfully attested for the Stage 1 2012 MU program year. This compares to 85% of eligible athenaClinicals providers who successfully attested for the Stage 1 2011 MU program year.
As discussed at our Investor Summit on December 6, 2012, one of our four pivotal strategic initiatives for 2013 is to radically transform the user experience on athenaNet. We have made tremendous progress in bringing athenaNet into the mobile age along with adding cross-browser support. We have only scratched the surface, however, of our plans to create a more intuitive and elegant physician experience on athenaNet. The athenahealth team has made significant progress on our mobile platforms. Our mobile strategy is focused first on providing the physician with flexibility outside the office. Our mobile physician application has been available for the iPhone® mobile digital device since April 2012 and an early beta version of the iPad® mobile digital device has been available since August 2012. Adoption of our mobile application continues to grow rapidly on the iPhone and iPad mobile digital devices. athenaClinicals providers have picked up the mobile application with no additional training. Currently, we have approximately 35% of our athenaClinicals provider base using their iPhone and iPad mobile digital devices to complete their out-of-office tasks. This includes approximately 700 athenaClinicals providers who use the beta version on their iPad mobile digital device. At this time, our applications for the iPhone and iPad mobile digital devices support out-of-office workflows to help physicians keep their tasks under control which in turn improves their overall efficiency. In addition, we are expanding our browser support to include mobile and desktop Safari® application programs for all athenaNet workflows. We expect all athenaClinicals and athenaCollector workflows to be supported on mobile and desktop Safari application programs by Q1 2013. We opened the beta program for select athenaNet users on
7
mobile and desktop Safari application programs in November 2012 and currently have 17 providers using athenaNet on the mobile Safari application program and 45 providers running athenaNet on the desktop Safari application program. Furthermore, we plan to support athenaNet on additional browsers, including ChromeTM browser and Firefox®, in 2013. Our third and most significant undertaking is the radical re-design of the user experience of athenaClinicals. This is an opportunity for the athenahealth technology and design teams to step back and determine what our electronic health record service really needs to be. This process is enabling us to create something far more elegant and purposeful than any electronic health record system that exists today. We previewed what the future of athenaClinicals will look like at our Investor Summit on December 6, 2012. Stay tuned for more updates throughout 2013.
Finally, as discussed during the Q3 2012 earnings call, athenahealth is seizing on the electronic medical record (EMR) replacement market and sharpening our focus to make sure that switching to athenaClinicals is dramatically less painful than staying on legacy software. During Q4 2012, athenahealth launched our new clinical data conversion services which focus on helping our clients maintain productivity and continuity of care by providing access to high quality, extractable data from their legacy EMR systems. To help meet the business needs of our clients, athenahealth has developed multiple options for data conversions. These options cover remote access to historical patient chart data, structured data conversion from the legacy EMR into athenaNet or a combination of both. A recent KLAS survey found that 50% of all organizations in the market for an EMR are not first time buyers. The athenahealth team is more ready than ever for the EMR replacement market and can now manage the entire transition process for our clients. We are confident that this new service offering will provide our clients with a smooth and efficient transition onto athenaClinicals with minimal disruption to their clinical practice.
athenaCommunicator Service Offering
athenaCommunicator is our cloud-based patient communication management service. It entered general availability in 2010 and, at this time, requires adoption of athenaCollector or athenaClinicals.
The athenaCommunicator product team is focused on improving patient interactions outside of the physician’s office. The athenaCommunicator service offering reduces the administrative work required to manage patient relationships, improves self-pay collections, and increases schedule density. The demonstrated benefits of this service offering continue to drive rapid adoption across the client base. As of Q4 2012, the provider adoption rate was 35%, as compared to 32% in Q3 2012 and 18% in Q4 2011. As we increase the penetration of athenaCommunicator across our athenaCollector client base, the volume of work performed on behalf of our clients continues to grow dramatically. athenaCommunicator delivered over 17.1 million automated messages during Q4 2012 across our active patient base (over 7.1 million patients). Increased adoption of the patient portal component of athenaCommunicator will allow our clients to fully maximize the benefits of this service offering. Usage of the patient portal significantly reduces administrative tasks and improves the patient experience both inside and outside the physician’s office. Q4 2012 marked a significant milestone with over 1,100,000 patients registered on the patient portal. This represents a 37% increase in portal adoption over the 811,000 patients registered as of Q3 2012. Another significant benefit of this service offering includes management of self-pay collections which remains critical to our clients’ financial health. athenaCommunicator assisted our clients with their self-pay collections by collecting over $4.5 million during Q4 2012 and $13.2 million during full year 2012 via the patient portal and our live operator service. This represents a 340% increase over the $3.0 million in self-pay collections during full year 2011.
The athenaCommunicator product development team remains focused on initiatives that enhance the value proposition of this service offering for both our clients and their patients. During Q3 2012, we launched our Online Check-In functionality to the patient portal and have seen almost 10,000 appointments processed using this new service. This functionality allows patients to update demographics, confirm insurance, complete their health history and electronically sign privacy forms in the patient portal up to seven days prior to their appointments. In addition, we launched a consumer-
8
focused optimized version of the patient portal with enhanced e-mail communications during Q3 2012. As a result, we have seen a 27% increase in patient interactions conducted via the portal. Finally, with the launch of our mobile version of the patient portal in Q4 2012, patients now have more options in accessing their patient portal. To date, 18% of the visits to the patient portals are via this mobile application. Through all of these service enhancements, we are driving better patient engagement and activation which are necessary to further improve operational performance across our athenaCommunicator client base. In addition to all of these efforts, the development team is building additional athenaCommunicator functionality to support MU Stage 2 requirements such as the ability to view, download and transmit patient health information. Our goal is to have this functionality ready to certify athenaClinicals on the Stage 2 MU rules by mid-2013.
athenaCoordinator Service Offering
Our care coordination service offerings include athenaCoordinator Core and athenaCoordinator Plus. athenaCoordinator Core (f/k/a OrderFlow) is a cloud-based order transmission service for all receiver types and physicians using athenaClinicals. athenaCoordinator Plus is our cloud-based care coordination service for order transmission, insurance pre-certification, and patient registration among physicians and hospitals, surgical centers, and imaging centers. athenaCoordinator Plus entered general availability in 2011 following the acquisition of Proxsys LLC, and the athenaCoordinator Core service offering entered general availability in 2012.
athenahealth has created a sustainable business model for the exchange of health care information with our athenaCoordinator service offering. This game-changing service offering will be at the epicenter of our network-driven growth strategy. During 2012, the athenahealth team was focused on adding receivers, via athenaCoordinator Core and athenaCoordinator Plus, onto our network. We subsequently refined our go-to-market approach for the athenaCoordinator service offerings and broadened our addressable market for athenaCoordinator Core to include medical groups, labs, imaging centers and hospitals. Since launching athenaCoordinator Core, we have signed 1,389 clients representing 7,680 providers onto this service offering as of December 31, 2012, up from 904 clients and 3,845 providers as of September 30, 2012. As of year-end, we signed 880 athenaClinicals clients onto our orders-based pricing model. This has produced between 9,000 and 15,000 receiver prospects for our athenaCoordinator service offerings. During 2013, we will shift focus to start activating these receivers to drive more athenaOne sales. Our network driven growth strategy will be focused on 1) converting athenaCoordinator receivers into athenaOne clients; 2) upselling athenaCoordinator senders onto athenaOne; 3) expanding athenaCoordinator receivers onto our network via introductions from our existing athenaClinicals clients on orders-based pricing; and 4) upselling athenaCoordinator Core clients to athenaCoordinator Plus.
Our emerging sustainable business model for health information exchange was born from the successful integration of athenaCoordinator and athenaClinicals with orders-based pricing. Under this business model, we are effectively shifting the cost of care coordination from our athenaClinicals clients to their trading partners who are benefiting from the health care information they consume. Our athenaClinicals clients no longer want to bear all the costs for care coordination. As a result, they are introducing us to their supply chain partners and are helping us grow our receiver network. Here are just three examples of how the client-driven growth of our care coordination network is happening:
1. | We presented a premier orthopedic medical center with details on its current order volumes from existing athenaClinicals clients. After learning about our athenaCoordinator Core service offering and the ability to improve care coordination with trading partners, the medical center immediately signed up for athenaCoordinator Core. The deal closed in less than 10 days from the initial meeting. |
2. | An independent medical group on athenaOne asked its hospital trading partner to get onto the athenahealth network. When the hospital refused, the medical group connected athenahealth with |
9
an independent imaging center in the same market. This led to the signing of one of the largest imaging organizations in the U.S. onto athenaCoordinator Core.
3. | We sold an athenaOne deal to a multi-specialty group employed at a community hospital. While the hospital was looking to further expand its employed physician group, it also wanted to offer more to its affiliates. In order to drive improved care coordination to benefit all of its trading partners, the hospital signed up for athenaCoordinator Plus. |
We continue to be encouraged by the progress we are making in creating a sustainable market for health information exchange between senders and receivers. We believe this is just the beginning of our network driven viral growth strategy.
During 2012, the athenaCoordinator product development team reimplemented the application we inherited by Proxsys which has allowed us to leverage athenaNet for real-time eligibility checking, insurance package selection, and clinical vocabularies. Now that the application is fully integrated with athenaNet, the athenaCoordinator team can shift focus to initiatives that further improve our operational productivity and differentiate our service offerings. These initiatives include implementing work flow distribution tools and streamlining workflows through automation and task standardization. We are also adding features and functionality that improve visibility and insight into our clients' referral activities and that enhance the exchange of health information for our clients. By Q2 2013, we plan to offer a receiver portal for every stand-alone athenaCoordinator Core receiver. The receiver portal will provide our athenaCoordinator Core receiver clients with a robust reporting of their order volumes sourced from athenaClinicals senders. The receiver portal will help our athenaCoordinator Core clients better manage, maintain and build their sender networks. This represents the first of many additional features we plan to build for the growing athenaCoordinator Core client base. The team is also working on expanding the amount of information that is automatically transferred with an order from one athenaClinicals client to another. Today, specific administrative and billing information such as patient demographics and insurance information, is populated directly from athenaNet. Soon, additional discrete health history information such as problem lists, medication lists, allergies and vaccine history will also be automatically available in the receiver's patient chart when both the sender and receiver are on athenaClinicals. These initiatives further enhance the value of our integrated cloud-based service offerings and will help us rapidly add more nodes onto our national network.
Anodyne Solutions Service Offerings
Anodyne Solutions are our cloud-based business intelligence services for health care professionals. These services have been generally available since 2004 through Anodyne Health Partners, Inc., which athenahealth acquired in October of 2009. Anodyne Solutions are fully integrated with athenaCollector and will be integrated with athenahealth’s other service offerings. They can also be adopted on a stand-alone basis.
The Anodyne Solutions service offering, consisting of Anodyne AnalyticsSM and Anodyne DashboardSM, transforms data into information needed to run a profitable medical practice. The Anodyne Analytics service gives health care organizations the ability to analyze data through specially designed views, identifying and examining critical trends and patterns. The Anodyne Dashboard goes one step further by presenting data at a higher, more summarized level. The Anodyne Solutions service offering provides reliable and easily accessible information to health care organizations. This critical information provides actionable insight, enabling health care organizations to increase their revenue, grow and expand their practices, improve their productivity, and manage their coding patterns and compliance.
Progress has been relative to several initiatives aimed to drive growth and expand awareness of the Anodyne Solutions service offering. During Q4 2012, we launched a refreshed Anodyne website which contains new on-line demos for the Anodyne Analytics and Anodyne Dashboard services, as well as client testimonials and case studies. We have also begun to promote the benefits of our business
10
intelligence tools to our consulting channel partners. This will assist our channel partners in driving further awareness of our service offerings and identifying athenaOne cross-sell opportunities. Our consulting partners who use the Anodyne business intelligence tools can perform more detailed, accurate analysis in a significantly shorter period of time adding to their ability to perform more value added services. Driving change is the key to any consultant's success. By using our powerful business intelligence tools, our consulting partners can recommend and implement changes for a client faster. We believe the marketing of our Anodyne Solutions to our consulting partners will make Anodyne an even stronger lead generation source for athenaOne deals. Our ability to successfully cross-sell our core services into the Anodyne customer base was highlighted by the closing of two important enterprise deals in 2012: Health Management Physician Network and Children's Hospital Los Angeles Medical Group.
HDS Service Offering
HDS is a collection of cloud-based services that provide visibility into the performance of care delivery networks. By combining claims, administrative and clinical data into a single repository, and sharing that information with provider organizations, health care organizations are able to effectively and efficiently monitor and optimize provider network performance. These services have been generally available since 2004 through Healthcare Data Services LLC, which athenahealth acquired in October of 2012.
HDS, our newest service offering resulting from the acquisition of Healthcare Data Services, expands athenahealth's core competencies to include supporting our clients in successfully operating under risk-based reimbursement models. By combining claims and administrative and clinical data into a single data set and surfacing that data into clinical workflows, HDS gives our clients clarity into the care they deliver to their population of patients. HDS further provides the tools our clients need to effectively succeed under value-based contracts and become clinically integrated care organizations. Consistent with athenahealth's other service offerings, HDS offers a unique approach incorporating cloud-based software, unparalleled industry knowledge, and dedicated, experienced support staff. This integrated service offering delivers accurate and valuable visibility into the care delivered in order to support our clients' strategic goals for the future. The HDS service offering provides easily deployed, turn-key solutions for addressing leakage, controlling costs, maximizing quality and reducing utilization.
Business Development Update
One of our pivotal strategic initiatives for 2013 is to open athenaNet and build an ecosystem of partners via our “More Disruption Please” (MDP) program. These efforts will springboard off of the momentum generated by the 2012 expansion of the MDP program. The foundation for the MDP program is based on the belief that a massive surge in disruptive innovation is needed to make health care work as it should. To accomplish this, we need to be an open platform that attracts innovators, entrepreneurs and capital to the health information cloud. Our goal is to connect participants in the health care space and foster the efficient creation and deployment of new technologies. Today, we have built a community of more than 1,000 MDP members that includes innovators, entrepreneurs, health care IT companies, and investors to drive this much-needed innovation in the health care space. We have successfully integrated six MDP partner companies into athenaNet and will work on adding another twenty-five companies in 2013. Our existing MDP partner companies are already helping us differentiate our service offerings and we look to our MDP partner companies to drive incremental value for our clients. Our clients benefit from access to the best technologies and services generating improved efficiencies inside provider and patient workflows. athenahealth remains committed to helping new technologies accelerate their growth using our open, cloud-based platform and our robust provider base. We look to the MDP program to help us in our constant search to turbo charge innovation to benefit us, our clients, and the health care industry. We plan to formally launch a marketplace for our MDP partner companies, athenahealth's version of the Apple App StoreSM online store, by mid-2013. We view the creation of this ecosystem of partners as strategically essential to achieving our vision of an information backbone that helps make health care work as it should. To learn more about our MDP program or to sign up as an MDP member, please access our MDP website at www.athenahealth.com/innovation.
11
On January 7, 2013, athenahealth announced the signing of a definitive agreement to acquire Epocrates. Epocrates is a mobile health provider recognized for developing the most widely-adopted point-of-care medical application among U.S. physicians. The board of directors of each of athenahealth and Epocrates has agreed to a price of $11.75 per share, in cash. By joining forces with Epocrates, we expect to gain a powerful awareness platform - one that would enable us to grow and better serve our nationwide network of providers. The acquisition of Epocrates is expected to advance our goals and our mission in several ways. First, it is expected to strengthen our ability to provide the best information access to health organizations. The acquisition of the #1 point-of-care medical application among U.S. physicians could accelerate our vision to be the health care industry's information backbone. By combining Epocrates' mobile expertise with knowledge and data from athenahealth's cloud-based network, the combined company will be uniquely positioned to introduce new mobile applications that deliver high-value information to the clinical community when, where, and how they want it. Second, it is expected to help athenahealth deliver the most advanced and efficient mobile workflows. The combined company is expected to pioneer new mobile workflows to improve provider efficiency and support care delivery outcomes. Finally, it is expected to accelerate awareness and growth across the physician market. athenahealth would expand its current provider base of 40,000 to include the more than one million health care professionals currently on the Epocrates network. This would open up tremendous awareness opportunities for athenahealth as we build upon the highly-trusted Epocrates brand. athenahealth's brand prowess would expand beyond a leader in cloud-based health services to become the industry leader in mobile clinical content. By joining forces, the combined company would be positioned to completely redefine care givers' mobile experience and to advance our vision for helping health care work as it should. We expect the acquisition to close during Q2 2013.
Revenue Discussion
Q4 2012 revenue reached $116.3 million and grew by 26% (or $23.8 million) over Q4 2011. Our total revenue of $422.3 million for FY 2012 grew by 30% (or $98.2 million) over FY 2011. Our revenue growth was primarily driven by athenaCollector client base expansion and growth in athenaClinicals, athenaCommunicator, and athenaCoordinator services.
In terms of trends in our recurring revenue base, same-store analysis of claims created—a proxy for physician office utilization—indicates that physician office activity in Q4 2012 increased modestly over physician office activity during Q4 2011.
Client Base Discussion
The total number of physicians who have gone live on athenaCollector, our core service offering, is the metric we currently use to define our client base and market share. However, as our client base expands outside the traditional ambulatory market, total active providers—or nodes on our network—will become a more appropriate metric used to define our client base and market share. Annual growth in total revenue continues to outpace growth in our physician base. We believe that this trend will continue as athenaClinicals and athenaCommunicator are included in a growing portion of new deals and adoption of these services spreads across our existing client base.
During Q4 2012, 82% of all new athenaCollector deals included athenaClinicals, up from 73% in Q4 2011. 67% of all new athenaCollector deals included athenaCommunicator and athenaClinicals. Additionally, 56% of all new athenaOne deals also included athenaCoordinator Core. The athenaOne rate of 67% in Q4 2012 compares to 44% in Q4 2011. Among “live” (i.e., implemented and active) athenaCollector clients, adoption of athenaClinicals and athenaCommunicator continues to grow rapidly and resulted in continued growth to our installed base across all of our service offerings. As our client base expands outside the traditional ambulatory market, total active providers-or nodes on our network-will become a more appropriate metric used to measure of our market share.
12
athenahealth Service Offering Adoption
athenaCollector Clients
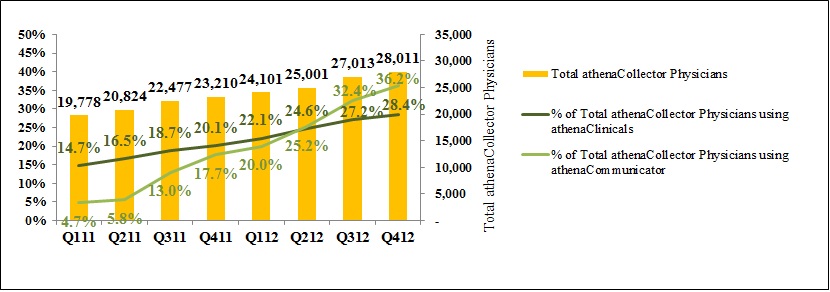
During Q4 2012, total active physicians on athenaCollector grew by 21% year-over-year, to 28,011. On a sequential basis, we added 998 net new active physicians on athenaCollector, versus 733 in Q4 2011. Our quarterly net new physician additions may vary widely due to the number and size of clients that go live in a particular quarter. Furthermore, our larger clients can be more complex and take longer to go live, particularly if our clients request a more phased implementation approach. Total active providers on athenaCollector grew by 21% year-over-year, to 39,752. On a sequential basis, we added 1,607 net new active providers on athenaCollector, versus 1,065 in Q4 2011. During FY 2012, we added 4,801 net new active physicians onto athenaCollector versus 4,013 in FY 2011. In addition, during FY 2012, we added 7,012 net new active providers on athenaCollector versus 5,626 in FY 2011.
athenaClinicals Clients
We continue to experience rapid growth in client adoption of athenaClinicals. Total active physicians live on athenaClinicals grew by 71% year-over-year, to 7,949. On a sequential basis, we added 609 net new active physicians on athenaClinicals, versus 460 in Q4 2011. This equates to an overall adoption rate of 28% of total athenaCollector physicians, up from 20% in Q4 2011. Total active providers on athenaClinicals grew by 67% year-over-year, to 10,926. On a sequential basis, we added 864 net new active providers on athenaClinicals, versus 676 in Q4 2011. During FY 2012, we added 3,287 net new active physicians onto athenaClinicals versus 2,279 in FY 2011. In addition, during FY 2012, we added 4,401 net new active providers on athenaClinicals versus 3,177 in FY 2011. We expect the athenaClinicals client base to increase significantly over time due to cross-selling within our existing base and growth in the volume of athenaOne deals.
athenaCommunicator Clients
Our athenaCommunicator client base is also growing rapidly. Total active physicians live on athenaCommunicator grew by an impressive 148% year-over-year, to 10,153. On a sequential basis, we added 1,414 net new active physicians on athenaCommunicator, versus 1,167 in Q4 2011. This equates to an overall adoption rate of 36% of total athenaCollector physicians, up from 18% in Q4 2011. Total active providers on athenaCommunicator grew by 141%, to 14,065. On a sequential basis, we added 1,916 net new providers on athenaCommunicator, versus 1,713 in Q4 2011. During FY 2012, we added 6,055 net new active physicians onto athenaCommunicator versus 3,362 in FY 2011. In addition, during FY 2012, we added 8,235 net new active providers on athenaCommunicator versus 4,617 in FY 2011. We expect the athenaCommunicator client base to increase significantly over time due to cross-selling within our existing base and growth in the volume of athenaOne deals.
13
New Deals
On November 30, 2012, we announced that Children's Hospital Central California selected athenahealth’s integrated suite of services, including athenaCollector, athenaClinicals, athenaCommunicator, and athenaCoordinator Core. Children's Hospital Central California is the second-largest children's hospital in California and one of the ten largest hospitals of its type in the nation. Children's Hospital Central California is expected to go live across its system of 127 providers in Q3 2013.
On December 3, 2012, we announced that Children's Hospital Los Angeles Medical Group selected athenahealth's cloud-based medical billing services to enhance their revenue cycle performance. Children's Hospital Los Angeles Medical Group is made up of 500 pediatric specialists who provide services across 32 different medical and surgical specialties. Children's Hospital Los Angeles Medical Group already uses athenahealth's business intelligence platform, Anodyne Solutions and is expected to go live on athenaCollector in Q2 2013. Please note that we announced the signing of this deal on the Q3 2012 earnings call.
On December 5, 2012, we announced that Martin's Point Health Care will implement athenahealth's integrated suite of services including athenaCollector, athenaClinicals and athenaCommunicator across all of its health centers. In addition, Martin's Point Health Care will be implementing athenahealth's business intelligence platform, Anodyne Solutions. Martin's Point Health Care is a medical group and health plan administrator with nearly 90 providers. Martin's Point Health Care has nine health care centers in Maine and New Hampshire as well as three health care plans for select groups throughout the northeast. Martin's Point Health Care is expected to go live in Q2 2013. Please note that we announced the signing of this deal on the Q3 2012 earnings call.
On January 9, 2013, we announced that Emergency Medicine Physicians (EMP) selected athenaCollector and athenaCommunicator to support their 800 physicians to deliver top-quality patient care and outcomes. EMP, an industry leader and innovator in emergency medicine and one of the largest physician-owned emergency department groups in the United States, provides Emergency Department management and staffing solutions to nearly 60 hospitals across 14 states. This deal was signed during Q4 2012 and is expected to go live during the second half of 2013.
Also on January 9, 2013, we announced that Prospira PainCare signed an agreement to standardize on athenahealth's cloud-based services across their nationwide network of pain management practices. Prospira will deploy athenaCollector, athenaClinicals, athenaCommunicator as well as Anodyne Solutions, our business intelligence platform to its growing network of pain management professionals. Prospira PainCare currently operates practices in 3 states with plans on growing their organization nationally with a rapid succession of acquisitions. Their footprint today includes 17 physicians and 52 providers in four main locations in California, Florida and Georgia.
On January 22, 2013, we announced that Lowell General Physician Hospital Organization (PHO) selected athenahealth's cloud-based health care data management service (HDS), for greater visibility into provider network performance and alignment with the Accountable Care Organization (ACO) model. The Lowell General Physician Hospital Organization (PHO) is a non-profit organization comprised of approximately 280 member physicians and its hospital partner, Lowell General Hospital. Lowell General Physician Hospital Organization is expected to go live during Q1 2013.
Client Implementations
In terms of our publicly disclosed implementation pipeline as of December 31, 2012, ProMedica (~330 physicians, ~400 providers) is now fully live on athenaCollector and Manet Community Health Center (~17 physicians, ~21 providers) is now live on our integrated suite of services including athenaCollector, athenaClinicals and athenaCommunicator. Our suite of services will also be fully rolled out at Alexian Brothers Health System once they go-live on athenaCommunicator in early 2013. The implementations of all three services began at Health Management Associates (~900 physicians, ~1,200 providers) and
14
Palmetto Primary Care Physicians (~50 physicians, ~80 providers). Health Management Associates brought its first wave live (~200 providers) in early December 2012 and is expected to bring the remaining physicians and providers live in phases during 2013. Palmetto Primary Care is expected to be fully live by Q3/Q4 2013. Mid Dakota Clinic (~60 physicians, ~90 providers) kicked off their athenaOne implementation, including athenaCoordinator Core, during Q4 2012 and is expected to go live by Q2 2013. The implementation of University Hospitals academic medical center (~850 physicians; ~1,000 providers) is underway and is expected to go live on athenaCollector by means of a phased implementation beginning in early 2013. Finally, the athenaCollector implementation at Detroit Medical Center (DMC) (~125 physicians; ~400 providers) remains on hold due to operational reviews at the client.
Non-GAAP Adjusted Gross Margin Discussion
Our Non-GAAP Adjusted Gross Margin was 63.4% for Q4 2012, down approximately eighty basis points from 64.2% in Q4 2011. Our Non-GAAP Adjusted Gross Margin was 62.6% for FY 2012, down from 63.8% in FY 2011. As anticipated, this year-over-year decline in our Non-GAAP Adjusted Gross Margin was driven by our athenaCoordinator service offering. One of our goals is to improve gross margin on a service-line basis each year. As previously discussed, the expansion of our new service offerings, such as athenaCoordinator, will serve as a headwind to margin expansion until these new services become more automated and scalable.
Marketing and Selling Discussion
As an innovative, high growth company with a relatively small share of a very large market opportunity, our business model is still new to health care, and market awareness remains our biggest challenge. To improve awareness, we remain focused on expanding and enhancing our selling and marketing activities. These activities incur both fixed and variable costs, as they range from investment in personnel and infrastructure to spending on new advertising campaigns and paid search terms. We continue to experiment with and expand upon our awareness-building efforts as quickly as we deem them to be effective. The productivity of these investments is largely measured over the long term, particularly as it may take six to nine months of implementation before new clients fully contribute to revenue and join the ranks of our active client base.
Marketing Update
The athenahealth marketing organization encompasses our growth and sales operations, event and partner marketing, inside sales agents (ISAs), advertising, corporate communications, and product marketing teams. This organization executes in-market investments in an effort to generate new business opportunities for athenahealth.
We continued to invest in various growth initiatives during Q4 2012 with a specific focus on awareness-building and lead generation activities. Investments are being made in our proven marketing channels, including leadership institutes, dinner seminars, on-line investments, print advertising, and website optimization. The marketing team has continued to tailor our marketing initiatives and create athenaNet branded content to drive awareness among physicians and practice managers, as well as C-suite executives. These investments have helped drive increased national awareness in the C-suite, which increased from 28% in 2011 to 35% in 2012. Although physician awareness also increased from 29% in 2011 to 31% in 2012, the results fell short of our 35% physician awareness goal. This means that nearly seven out of ten physicians don't even know who we are or how we can help their practices. We realize that awareness remains our main barrier to growth and we continue to search for ways to crack the awareness code. We believe the Epocrates acquisition will be a major step in elevating athenahealth's national awareness.
The marketing team is focused on increasing athenahealth’s profile as an innovative thought leader in the health care community. We believe that raising awareness of athenahealth across key external audiences is critical to our growth strategy. To this end, the athenahealth marketing organization is working on
15
athenaNet branded content that associates athenahealth with top industry trends and showcases our clients’ successes and points of view. Once again, athenahealth’s profile received another nice boost this quarter from press coverage in Medscape, The Huffington Post, InformationWeek Healthcare, Xconomy, The Economist, DownEast.com and Becker's Hospital Review. Also of note, awareness of athenahealth got an even bigger boost in January 2013 with the announcement of our definitive agreement to acquire Epocrates, Inc. Within the first five days following the announcement, athenahealth was featured in 48 original media pieces including seventeen national business articles among which were Associated Press, Bloomberg, Forbes and Fast Company as well as three broadcast segments on Fox Business, Bloomberg TV and CNBC's Mad Money. In addition to public relations and editorial placements, we are driving awareness by showcasing the knowledge and intelligence we glean from our national provider network. We have created applications and other multi-media rich engagement tools such as PracticeVitals, Meaningful Use dashboard and CodeView (in process) from athenaNet. We also posted our inaugural Cloud Analytics blog post, “Deep Data: Cloud-based Health Care Insights” in November 2012. Future Cloud Analytics blog posts will further showcase the power and depth of our athenaNet database by providing insights and highlighting trends in the U.S. health care industry. A more recent blog post, “Cloud Analytics: Flu Season Trends”, that used athenaNet data to track flu trends helped inform an NPR story on the nationwide flu outbreak.
Selling Update
The athenahealth sales organization includes all quota-carrying sales representatives, as well as our sales team leaders, channel sales team, and sales training and development organization.
While our bookings performance in Q4 2012 improved significantly over Q3 2012, our bookings achievement was 88% of our goal for the full year. It is important to note that the 88% achievement is in line with the assumptions used to build our 2013 revenue budget. While bookings across each sales segment grew double digits over 2011, the Enterprise National Account Team, led by Dr. Steve Kahane, delivered a record bookings year. We further expanded our footprint in the enterprise and national account segments with the signings of Health Management Physician Network (Q2 2012), Children's Hospital Los Angeles Medical Group (Q3 2012), Children's Hospital Central California (Q4 2012), Prospira PainCare (Q4 2012) and Emergency Medicine Physicians (Q4 2012). We learned a great deal this year and our sales organization has entered 2013 with more weapons to compete and win with in the marketplace.
As of December 31, 2012, we have a total of 117 quota-carrying sales representatives, up 18% from 99 quota-carrying sales representatives as of December 31, 2011. This quota-carrying sales representative count includes 3 sales executives hired in December who did not join athenahealth until the first week of January 2013.
Balance Sheet and Cash Flow Highlights
Our cash, cash equivalents, and available-for-sale investments totaled $193.1 million at December 31, 2012. We do not have any outstanding debt obligations. Operating cash flow was $24.0 million in Q4 2012, up 12% from $21.5 million in Q4 2011. Operating cash flow was $70.2 million in FY 2012, up 16% from $60.8 million in FY 2011. Our capital expenditures, including capitalized software development, were $9.8 million (or 8.4% of total revenue) in Q4 2012 and $39.6 million (or 9.4% of revenue) in FY 2012.
Fiscal Year 2013 Outlook
athenahealth is not making any changes to the outlook presented at the Company's 5th Annual Investor Summit on December 6, 2012. However, we anticipate updating our fiscal year 2013 guidance on the Q1 2013 earnings call assuming both the Arsenal real estate purchase and the Epocrates acquisition are closed. While athenahealth does not provide quarterly guidance, it is important to note that each first quarter (ending March 31st) is characterized by higher expense levels and weaker collections activity following the holiday season. More specifically, the reset of FICA payroll taxes, bonus and vacation
16
accrual, merit increases and sales and marketing events, such as the Healthcare Information and Management Systems Society (HIMSS) Annual Conference and our Annual Sales Meeting, contribute to higher expense levels. In addition, discretionary use of physician services declines during the holiday season, which leads to a decline in collections by our physician clients approximately 38 days later.
Closing Remarks
2012 was another very good year for athenahealth--our thirteenth consecutive year of 30% revenue growth. We tackled a record number of initiatives while also maintaining high customer satisfaction and high customer retention. athenahealth has emerged as a dominant thought leader in the industry and has broadened our audience through television, business journals and regional press. We also received industry recognition with three 2012 Best in KLAS awards for athenaClinicals and athenaCollector. While we are enjoying 30% growth, Best in KLAS rankings and a highly satisfied customer base, we still contend with awareness as a barrier to growth. By joining forces with Epocrates, which today is recognized and trusted by 90% of practicing U.S. physicians, we expect to gain a powerful new awareness platform - one that will enable us to grow and better serve our nationwide network of providers. While we believe our strategic position is stronger than ever exiting 2012, we expect that it will be further strengthened with the addition of Epocrates.
17
Stock-Based Compensation Expense, Summary of Cash Balance and Reconciliation of Non-GAAP Financial Measures
athenahealth, Inc.
STOCK-BASED COMPENSATION
(Unaudited, in thousands)
Set forth below is a breakout of stock-based compensation impacting the Consolidated Statements of Income for the three and twelve months ended December 31, 2012 and 2011:
Three Months Ended December 31, | Twelve Months Ended December 31, | ||||||||||||||
2012 | 2011 | 2012 | 2011 | ||||||||||||
Stock-based compensation charged to Consolidated Statements of Income: | |||||||||||||||
Direct operating | $ | 1,547 | $ | 948 | $ | 5,619 | $ | 3,173 | |||||||
Selling and marketing | 2,312 | 1,721 | 7,717 | 5,645 | |||||||||||
Research and development | 306 | 815 | 3,213 | 2,311 | |||||||||||
General and administrative | 2,553 | 2,385 | 10,687 | 7,772 | |||||||||||
Total stock-based compensation expense | 6,718 | 5,869 | 27,236 | 18,901 | |||||||||||
Amortization of capitalized stock-based compensation related to software development (1) | 257 | — | 257 | — | |||||||||||
Total | $ | 6,975 | $ | 5,869 | $ | 27,493 | $ | 18,901 | |||||||
(1) | In addition, for the three and twelve months ended December 31, 2012, $0.8 million of stock-based compensation was capitalized in the line item Capitalized Software Costs in the Consolidated Balance Sheet for which $0.3 million of amortization was included in the line item Depreciation and Amortization Expense in the Consolidated Statement of Income. The amount of stock-based compensation related to capitalized software development costs in prior periods was not significant. |
athenahealth, Inc.
CASH, CASH EQUIVALENTS, AND AVAILABLE-FOR-SALE INVESTMENTS
(Unaudited, in thousands)
Set forth below is a breakout of total cash, cash equivalents, and available-for-sale investments as of December 31, 2012, and December 31, 2011:
December 31, 2012 | December 31, 2011 | ||||||
Cash, cash equivalents | $ | 154,988 | $ | 57,781 | |||
Short-term investments | 38,092 | 62,084 | |||||
Long-term investments (1) | — | 18,619 | |||||
Total | $ | 193,080 | $ | 138,484 | |||
(1) | The Company has purchased certain available-for-sale investments that had a maturity date longer than one-year, which it classifies in “Investments and other assets” on the consolidated balance sheet. |
18
athenahealth, Inc.
RECONCILIATION OF NON-GAAP FINANCIAL MEASURES
TO COMPARABLE GAAP MEASURES
(Unaudited, in thousands, except per share amounts)
The following is a reconciliation of the non-GAAP financial measures used by the Company to describe the Company’s financial results determined in accordance with accounting principles generally accepted in the United States of America (GAAP). An explanation of these measures is also included below under the heading “Explanation of Non-GAAP Financial Measures.”
While management believes that these non-GAAP financial measures provide useful supplemental information to investors regarding the underlying performance of the Company’s business operations, investors are reminded to consider these non-GAAP measures in addition to, and not as a substitute for, financial performance measures prepared in accordance with GAAP. In addition, it should be noted that these non-GAAP financial measures may be different from non-GAAP measures used by other companies, and management may utilize other measures to illustrate performance in the future. Non-GAAP measures have limitations in that they do not reflect all of the amounts associated with the Company’s results of operations as determined in accordance with GAAP.
Please note that these figures may not sum exactly due to rounding.
Non-GAAP Adjusted Gross Margin
Set forth below is a presentation of the Company’s “Non-GAAP Adjusted Gross Profit” and “Non-GAAP Adjusted Gross Margin,” which represents Non-GAAP Adjusted Gross Profit as a percentage of total revenue.
(unaudited, in thousands) | Three Months Ended | Twelve Months Ended | |||||||||||||
December 31, | December 31, | ||||||||||||||
2012 | 2011 | 2012 | 2011 | ||||||||||||
Total revenue | $ | 116,304 | $ | 92,512 | $ | 422,271 | $ | 324,067 | |||||||
Direct operating expense | 45,208 | 34,810 | 166,886 | 122,795 | |||||||||||
Total revenue less direct | |||||||||||||||
operating expense | 71,096 | 57,702 | 255,385 | 201,272 | |||||||||||
Add: Stock-based compensation | |||||||||||||||
allocated to direct operating expense | 1,547 | 948 | 5,619 | 3,173 | |||||||||||
Add: Amortization of purchased intangibles | 1,100 | 761 | 3,359 | 2,230 | |||||||||||
Non-GAAP Adjusted Gross Profit | $ | 73,743 | $ | 59,411 | $ | 264,363 | $ | 206,675 | |||||||
Non-GAAP Adjusted Gross Margin | 63.4 | % | 64.2 | % | 62.6 | % | 63.8 | % | |||||||
19
Non-GAAP Adjusted EBITDA
Set forth below is a reconciliation of the Company’s “Non-GAAP Adjusted EBITDA” and “Non-GAAP Adjusted EBITDA Margin,” which represents Non-GAAP Adjusted EBITDA as a percentage of total revenue.
(unaudited, in thousands) | Three Months Ended | Twelve Months Ended | |||||||||||||
December 31, | December 31, | ||||||||||||||
2012 | 2011 | 2012 | 2011 | ||||||||||||
Total Revenue | $ | 116,304 | $ | 92,512 | $ | 422,271 | $ | 324,067 | |||||||
GAAP net income | 5,940 | 5,329 | 18,732 | 19,046 | |||||||||||
Add: Provision for income taxes | 5,701 | 3,999 | 16,146 | 13,834 | |||||||||||
Less: Total other income | (17 | ) | (49 | ) | (251 | ) | (147 | ) | |||||||
Add: Stock-based compensation expense | 6,718 | 5,869 | 27,236 | 18,901 | |||||||||||
Add: Depreciation and amortization | 7,677 | 4,826 | 25,641 | 16,710 | |||||||||||
Add: Amortization of purchased intangibles | 1,100 | 761 | 3,359 | 2,230 | |||||||||||
Non-GAAP Adjusted EBITDA | $ | 27,119 | $ | 20,735 | $ | 90,863 | $ | 70,574 | |||||||
Non-GAAP Adjusted EBITDA Margin | 23.3 | % | 22.4 | % | 21.5 | % | 21.8 | % | |||||||
Non-GAAP Adjusted Operating Income
Set forth below is a reconciliation of the Company’s “Non-GAAP Adjusted Operating Income” and “Non-GAAP Adjusted Operating Income Margin,” which represents Non-GAAP Adjusted Operating Income as a percentage of total revenue.
(unaudited, in thousands) | Three Months Ended | Twelve Months Ended | |||||||||||||
December 31, | December 31, | ||||||||||||||
2012 | 2011 | 2012 | 2011 | ||||||||||||
Total revenue | $ | 116,304 | $ | 92,512 | $ | 422,271 | $ | 324,067 | |||||||
GAAP net income | 5,940 | 5,329 | 18,732 | 19,046 | |||||||||||
Add: Provision for income taxes | 5,701 | 3,999 | 16,146 | 13,834 | |||||||||||
Less: Total other income | (17 | ) | (49 | ) | (251 | ) | (147 | ) | |||||||
Add: Stock-based compensation expense | 6,718 | 5,869 | 27,236 | 18,901 | |||||||||||
Add: Amortization of capitalized stock-based compensation related to software development | 257 | — | 257 | — | |||||||||||
Add: Amortization of purchased intangibles | 1,100 | 761 | 3,359 | 2,230 | |||||||||||
Non-GAAP Adjusted Operating Income | $ | 19,699 | $ | 15,909 | $ | 65,479 | $ | 53,864 | |||||||
Non-GAAP Adjusted Operating Income Margin | 16.9 | % | 17.2 | % | 15.5 | % | 16.6 | % | |||||||
20
Non-GAAP Adjusted Net Income
Set forth below is a reconciliation of the Company’s “Non-GAAP Adjusted Net Income” and “Non-GAAP Adjusted Net Income per Diluted Share.”
(unaudited, in thousands) | Three Months Ended | Twelve Months Ended | |||||||||||||
December 31, | December 31, | ||||||||||||||
2012 | 2011 | 2012 | 2011 | ||||||||||||
GAAP net income | $ | 5,940 | $ | 5,329 | $ | 18,732 | $ | 19,046 | |||||||
Add: Loss on interest rate derivative contract | — | — | — | 73 | |||||||||||
Add: Stock-based compensation expense | 6,718 | 5,869 | 27,236 | 18,901 | |||||||||||
Add: Amortization of capitalized stock-based compensation related to software development | 257 | — | 257 | — | |||||||||||
Add: Amortization of purchased intangibles | 1,100 | 761 | 3,359 | 2,230 | |||||||||||
Sub-total of tax deductible items | 8,075 | 6,630 | 30,852 | 21,204 | |||||||||||
(Less): Tax impact of tax deductible items (1) | (3,230 | ) | (2,652 | ) | (12,341 | ) | (8,482 | ) | |||||||
Non-GAAP Adjusted Net Income | $ | 10,785 | $ | 9,307 | $ | 37,243 | $ | 31,768 | |||||||
Weighted average shares - diluted | 37,420 | 36,492 | 37,133 | 36,050 | |||||||||||
Non-GAAP Adjusted Net Income per Diluted Share | $ | 0.29 | $ | 0.26 | $ | 1.00 | $ | 0.88 | |||||||
(1) | Tax impact calculated using a statutory tax rate of 40%. |
(unaudited, in thousands) | Three Months Ended | Twelve Months Ended | |||||||||||||
December 31, | December 31, | ||||||||||||||
2012 | 2011 | 2012 | 2011 | ||||||||||||
GAAP net income per share - diluted | $ | 0.16 | $ | 0.15 | $ | 0.50 | $ | 0.53 | |||||||
Add: Loss on interest rate derivative contract | — | — | — | — | |||||||||||
Add: Stock-based compensation expense | 0.18 | 0.16 | 0.73 | 0.52 | |||||||||||
Add: Amortization of capitalized stock-based compensation related to software development | 0.01 | — | 0.01 | — | |||||||||||
Add: Amortization of purchased intangibles | 0.03 | 0.02 | 0.09 | 0.06 | |||||||||||
Sub-total of tax deductible items | 0.22 | 0.18 | 0.83 | 0.59 | |||||||||||
(Less): Tax impact of tax deductible items (1) | (0.09 | ) | (0.07 | ) | (0.33 | ) | (0.24 | ) | |||||||
Non-GAAP Adjusted Net Income per Diluted Share | $ | 0.29 | $ | 0.26 | $ | 1.00 | $ | 0.88 | |||||||
Weighted average shares - diluted | 37,420 | 36,492 | 37,133 | 36,050 | |||||||||||
(1) | Tax impact calculated using a statutory tax rate of 40%. |
21
Explanation of Non-GAAP Financial Measures
The Company reports its financial results in accordance with accounting principles generally accepted in the United States of America, or GAAP. However, management believes that, in order to properly understand the Company’s short-term and long-term financial and operational trends, investors may wish to consider the impact of certain non-cash or non-recurring items, when used as a supplement to financial performance measures in accordance with GAAP. These items result from facts and circumstances that vary in frequency and impact on continuing operations. Management also uses results of operations before such items to evaluate the operating performance of the Company and compare it against past periods, make operating decisions, and serve as a basis for strategic planning. These non-GAAP financial measures provide management with additional means to understand and evaluate the operating results and trends in the Company’s ongoing business by eliminating certain non-cash expenses and other items that management believes might otherwise make comparisons of the Company’s ongoing business with prior periods more difficult, obscure trends in ongoing operations, or reduce management’s ability to make useful forecasts. Management believes that these non-GAAP financial measures provide additional means of evaluating period-over-period operating performance. In addition, management understands that some investors and financial analysts find this information helpful in analyzing the Company’s financial and operational performance and comparing this performance to its peers and competitors.
Management defines “Non-GAAP Adjusted Gross Profit” as total revenue, less direct operating expense, plus (1) stock-based compensation expense allocated to direct operating expense and (2) amortization of purchased intangibles, and “Non-GAAP Adjusted Gross Margin” as Non-GAAP Adjusted Gross Profit as a percentage of total revenue. Management considers these non-GAAP financial measures to be important indicators of the Company’s operational strength and performance of its business and a good measure of its historical operating trends. Moreover, management believes that these measures enable investors and financial analysts to closely monitor and understand changes in the Company’s ability to generate income from ongoing business operations.
Management defines “Non-GAAP Adjusted EBITDA” as the sum of GAAP net income before provision for income taxes, total other (income) expense, stock-based compensation expense, depreciation and amortization, and amortization of purchased intangibles and “Non-GAAP Adjusted EBITDA Margin” as Non-GAAP Adjusted EBITDA as a percentage of total revenue. Management defines “Non-GAAP Adjusted Operating Income” as the sum of GAAP net income before provision for income taxes, total other (income) expense, stock-based compensation expense, amortization of capitalized stock-based compensation related to software development, and amortization of purchased intangibles, and “Non-GAAP Adjusted Operating Income Margin” as Non-GAAP Adjusted Operating Income as a percentage of total revenue. Management defines “Non-GAAP Adjusted Net Income” as the sum of GAAP net income before loss on the interest rate derivative contract, stock-based compensation expense, amortization of capitalized stock-based compensation related to software development, amortization of purchased intangibles, and any tax impact related to these items, and “Non-GAAP Adjusted Net Income per Diluted Share” as Non-GAAP Adjusted Net Income divided by weighted average diluted shares outstanding. Management considers all of these non-GAAP financial measures to be important indicators of the Company’s operational strength and performance of its business and a good measure of its historical operating trends, in particular the extent to which ongoing operations impact the Company’s overall financial performance.
Management excludes each of the items identified below from the applicable non-GAAP financial measure referenced above for the reasons set forth with respect to that excluded item:
• | Stock-based compensation expense and amortization of capitalized stock-based compensation related to software development — excluded because these are non-cash expenditures that management does not consider part of ongoing operating results when assessing the performance of the Company’s business, and also because the total amount of the expenditure is partially |
22
outside of the Company’s control because it is based on factors such as stock price, volatility, and interest rates, which may be unrelated to the Company’s performance during the period in which the expense is incurred.
• | Amortization of purchased intangibles — purchased intangibles are amortized over their estimated useful life and generally cannot be changed or influenced by management after the acquisition. Accordingly, this item is not considered by management in making operating decisions. Thus, including such charge does not accurately reflect the performance of the Company’s ongoing operations for the period in which such charge is incurred. |
• | Gains and losses on interest rate derivative contract — excluded because, until they are realized, to the extent these gains or losses impact a period presented, management does not believe that they reflect the underlying performance of ongoing business operations for such period. |
23
Supplemental Metrics and Definitions
Fiscal Year 2011 | Fiscal Year 2012 | ||||||||||||||||||
Q1 | Q2 | Q3 | Q4 | Q1 | Q2 | Q3 | Q4 | ||||||||||||
Client Base | |||||||||||||||||||
Total Physicians on athenaCollector | 19,778 | 20,824 | 22,477 | 23,210 | 24,101 | 25,001 | 27,013 | 28,011 | |||||||||||
Total Providers on athenaCollector | 27,944 | 29,482 | 31,675 | 32,740 | 33,923 | 35,409 | 38,145 | 39,752 | |||||||||||
Total Physicians on athenaClinicals | 2,910 | 3,444 | 4,202 | 4,662 | 5,331 | 6,151 | 7,340 | 7,949 | |||||||||||
Total Providers on athenaClinicals | 4,161 | 4,848 | 5,849 | 6,525 | 7,402 | 8,558 | 10,062 | 10,926 | |||||||||||
Total Physicians on athenaCommunicator | 934 | 1,198 | 2,931 | 4,098 | 4,820 | 6,306 | 8,739 | 10,153 | |||||||||||
Total Providers on athenaCommunicator | 1,564 | 1,936 | 4,117 | 5,830 | 6,800 | 8,642 | 12,149 | 14,065 | |||||||||||
Client Performance | |||||||||||||||||||
Client Satisfaction | 86.2 | % | 85.9 | % | 85.6 | % | 87.3 | % | 86.3 | % | 89.8 | % | 87.2 | % | 87.2 | % | |||
Client Days in Accounts Receivable (DAR) | 41.0 | 39.1 | 39.7 | 38.9 | 40.0 | 38.2 | 37.6 | 36.4 | |||||||||||
First Pass Resolution (FPR) Rate | 94.1 | % | 93.4 | % | 93.8 | % | 93.7 | % | 91.3 | % | 92.9 | % | 93.7 | % | 94.2 | % | |||
Electronic Remittance Advice (ERA) Rate | 74.6 | % | 76.7 | % | 78.3 | % | 77.9 | % | 78 | % | 77.7 | % | 79.8 | % | 81.7 | % | |||
Total Claims Submitted | 13,651,586 | 14,361,876 | 14,854,109 | 16,368,172 | 17,839,150 | 17,467,447 | 17,706,432 | 20,055,715 | |||||||||||
Total Client Collections ($) | 1,608,313,685 | 1,811,067,978 | 1,866,806,003 | 1,990,373,883 | 2,081,686,428 | 2,259,202,690 | 2,302,527,259 | 2,540,153,162 | |||||||||||
Total Working Days | 62 | 64 | 64 | 61 | 62 | 64 | 63 | 62 | |||||||||||
Employees | |||||||||||||||||||
Direct | 719 | 771 | 1,036 | 1,068 | 1,080 | 1,192 | 1,282 | 1,363 | |||||||||||
Sales & Marketing | 217 | 236 | 247 | 276 | 295 | 315 | 341 | 353 | |||||||||||
Research & Development | 216 | 236 | 263 | 277 | 292 | 357 | 375 | 402 | |||||||||||
General & Administrative | 144 | 151 | 168 | 174 | 187 | 196 | 205 | 222 | |||||||||||
Total Employees | 1,296 | 1,393 | 1,713 | 1,795 | 1,853 | 2,060 | 2,202 | 2,339 | |||||||||||
Quota Carrying Sales Force | |||||||||||||||||||
Total Quota Carrying Sales Representatives | 78 | 83 | 83 | 99 | 105 | 109 | 112 | 114 | |||||||||||
Supplemental Metrics Definitions | |
Client Base | |
Total Physicians on athenaCollector | The number of physicians that have rendered a service which generated a medical claim that was billed during the last 91 days on the athenaCollector platform. Examples of physicians include Medical Doctors (MD) and Doctor of Osteopathic Medicine (DO). |
Total Providers on athenaCollector | The number of providers, including physicians, that have rendered a service which generated a medical claim that was billed during the last 91 days on the athenaCollector platform. Examples of non-physician providers are Nurse Practitioners (NP) and Registered Nurses (RN). |
Total Physicians on athenaClinicals | The number of physicians that have rendered a service through the athenaClinicals platform which generated a medical claim that was billed during the last 91 days on the athenaCollector platform. Examples of physicians include Medical Doctors (MD) and Doctor of Osteopathic Medicine (DO). |
Total Providers on athenaClinicals | The number of providers, including physicians, that have rendered a service through the athenaClinicals platform which generated a medical claim that was billed during the last 91 days on the athenaCollector platform. Examples of non-physicians are Nurse Practitioners (NP) and Registered Nurses (RN). |
Total Physicians on athenaCommunicator | The number of physicians that have rendered a service which generated a medical claim that was billed during the last 91 days on the athenaCollector platform and whose practice is actively using athenaCommunicator. |
Total Providers on athenaCommunicator | The number of providers, including physicians, that have rendered a service which generated a medical claim that was billed during the last 91 days on the athenaCollector platform and whose practice is actively using athenaCommunicator. |
Client Performance | |
Client Satisfaction | The percentage of athenaCollector clients who chose 4 or 5 on a scale of 1 to 5 when asked if they would recommend athenahealth to a trusted friend or colleague. These responses are generated from a “client listening” survey that the company conducts for its client base twice per year. |
Client Days in Accounts Receivable (DAR) | The average number of days that it takes outstanding balances on claims to be resolved, e.g. paid, for clients on athenaCollector. Clients that have been live less than 90 days are excluded, as well as clients who are terminating services. |
First Pass Resolution (FPR) Rate | Approximates the percentage of primary claims that are favorably adjudicated and closed after a single submission during the period. Currently, the FPR rate is calculated on a monthly basis, and certain practices are excluded (e.g. those that have been live for less than 90 days). |
Electronic Remittance Advice (ERA) Rate | Remittance refers to the information about payments (a/k/a explanations of benefits) received from insurance companies during the period. The ERA rate reflects the percentage of total charges that were posted using electronic remittance. |
Total Claims Submitted | The number of claims billed through athenaNet during the period. |
Total Client Collections | The dollar value of collections posted on behalf of clients during the period. |
Total Working Days | The total number of days during the quarter minus weekends and U.S. Post Office holidays. |
Employees | |
Direct | The total number of full time equivalent individuals (FTEs) employed by the Company to support its service operations as of quarter end. This team includes production systems, enrollment services, paper claim submission, claim resolution, clinical operations, professional services, account management, and client services. |
Sales & Marketing | The total number of FTEs employed by the Company to support its sales and marketing efforts as of quarter end. This team includes sales representatives, business development staff and the marketing team. |
Research & Development | The total number of FTEs employed by the Company to support its research and development efforts as of quarter end. This team includes product development and product management. |
General & Administrative | The total number of FTEs employed by the Company to support its general and administrative functions as of quarter end. This team includes finance, human resources, compliance, learning and development, internal audit, corporate technology, recruiting, facilities, and legal. |
Total Employees | The total number of FTEs employed by the Company as of quarter end. This number excludes interns and seasonal employees. |
Corporate Scorecard Metrics Definitions | |
Stability | |
Voluntary Turnover | The number of voluntary terminations during the period divided by starting headcount. |
Corporate Compliance | Percentage of compliance tasks that are met within the deadline. |
Employee Engagement | Quarterly engagement survey results for employees. |
Performance | |
Client Days in Accounts Receivable (DAR) | The average number of days that it takes outstanding balances on claims to be resolved, e.g. paid, for clients on athenaCollector. Clients that have been live less than 90 days are excluded, as well as clients who are terminating services. |
DAR in Client Work Buckets | The number of days in accounts receivable that are due to tasks assigned to clients’ work buckets. |
Client Collection Rate | The percentage of charges that are not written off to bad debt. |
Provider Documentation Time per Appointment | The average number of minutes athenaClinicals providers spend on the computer documenting the exam and orders for each appointment. Providers that have been live less than 90 days are excluded. |
Satisfaction | |
Client Touches per Claim | The total number of scrub records, denials on the back-end and posting exceptions that clients must work divided by the total number of claims created. |
Client Tickets per Provider (per month) | The number of Client Service Center (CSC) cases that are not resolved on the initial call by the CSC team divided by the number of athenaCollector providers. |
Client Satisfaction | The percentage of clients who chose 4 or 5 on a scale of 1 to 5 when asked if they would recommend athenahealth to a trusted friend or colleague. These responses are generated from a “client listening” survey that the company conducts for its client base twice per year. |
Financial | |
Total Revenue | Total consolidated revenue. |
Non-GAAP Adjusted Operating Income | Total non-GAAP adjusted operating income. |
Growth | |
Bookings | The annualized value of deals sold. |