Attached files
| file | filename |
|---|---|
| 8-K - FORM 8-K - SPARTON CORP | d480829d8k.htm |
| EX-99.1 - SCRIPT FOR CONFERENCE CALL - SPARTON CORP | d480829dex991.htm |
 Fiscal 2013 Second Quarter
Financial Results
Conference Call
February 6, 2012
Exhibit 99.2 |
 2
Safe Harbor Statement
Safe Harbor Statement
Certain statements herein constitute forward-looking statements within the meaning of the
Securities Act of 1933, as amended and the Securities Exchange Act of 1934, as amended.
When used herein, words such as “believe,” “expect,”
“anticipate,” “project,” “plan,” “estimate,” “will” or “intend” and similar words or expressions as they relate to
the Company or its management constitute forward-looking statements. These forward-looking
statements reflect our current views with respect to future events and are based on currently
available financial, economic and competitive data and our current business plans. The Company
is under no obligation to, and expressly disclaims any obligation to, update or alter its
forward-looking statements whether as a result of such changes, new information, subsequent
events or otherwise. Actual results could vary materially depending on risks and uncertainties
that may affect our operations, markets, prices and other factors. Important factors that could cause
actual results to differ materially from those forward-looking statements include those contained
under the heading of risk factors and in the management’s discussion and analysis
contained from time-to-time in the Company’s filings with the Securities and
Exchange Commission. The reconciliation and adjusted EBITDA presented here represents
earnings before interest, taxes, depreciation and amortization as adjusted for
restructuring/impairment charges, gross profit effect of capitalized profit in inventory from
acquisition and gain on sale of investment. The Company believes Adjusted EBITDA is commonly
used by financial analysts and others in the industries in which the Company operates and, thus,
provides useful information to investors. The Company does not intend, nor should the reader
consider, Adjusted EBITDA an alternative to net income, net cash provided by operating
activities or any other items calculated in accordance with GAAP. The Company's definition of
Adjusted EBITDA may not be comparable with Adjusted EBITDA as defined by other companies.
Accordingly, the measurement has limitations depending on its use. Related to Onyx, adjusted
gross profit and adjusted operating income exclude the gross profit effect of capitalized
profit in inventory from acquisition and unusual write-downs of inventory and accounts receivable
related to an Onyx customer (“Augustine”) which was excluded from the acquisition.
Adjusted EBITDA related to Onyx represents operating income before depreciation and
amortization as adjusted for the gross profit effect of capitalized profit in inventory from
acquisition and unusual write-downs of inventory and accounts receivable related to an Onyx
customer (“Augustine”) which was excluded from the acquisition. |
 3
Today’s Agenda
Today’s Agenda
•
2 Quarter Highlights
•
Fiscal 2013 1
st
Half Financial Results
•
2 Quarter Segmented Operating Results
•
Liquidity & Capital Resources
•
Outlook
•
Q & A
nd
nd |
 4
•
Awarded
13
new
business
programs
during
the
second
quarter
•
Quarter
end
sales
backlog
of
approximately
$211.5
million,
including
approximately
$30.5
million
from
the
Onyx
acquisition
•
Completed
the
acquisition
of
Onyx
EMS,
LLC.
•
Entered
into
a
new
five
year
banking
agreement
with
BMO
Harris
Bank
providing
$65
million
of
committed
credit
facilities.
The
new
facility
also
includes
a
$35
million
accordion
feature
which
could
raise
the
total
facility
to $100 million.
•
Recognized
a
$2.1
million
income
tax
benefit
from
claiming
a
worthless
stock
and
bad
debt
deduction
with
respect
to
investments
and
advances
to
our
100%
owned
Canadian
subsidiary.
2
nd
Quarter Highlights |
 5
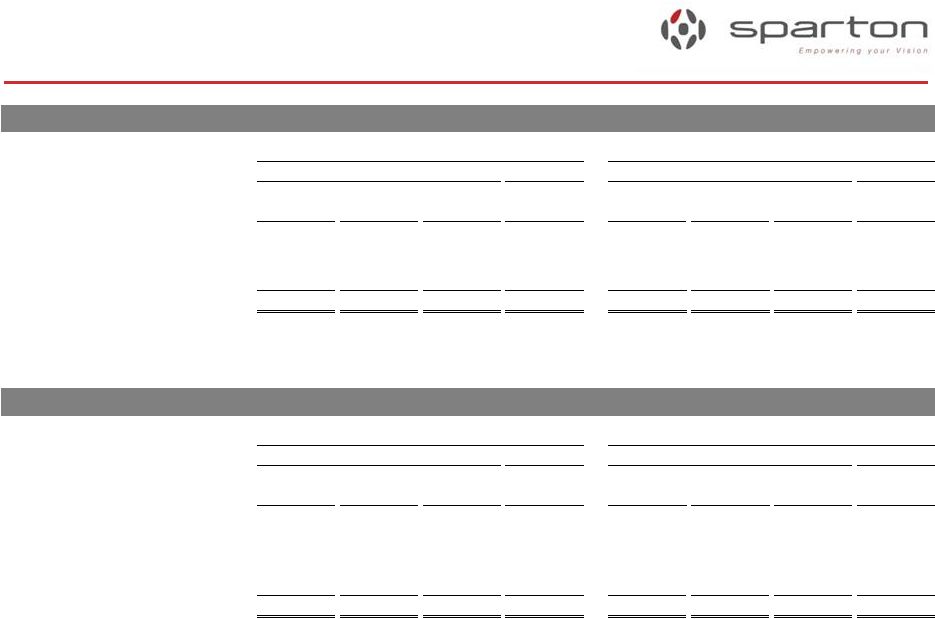
Consolidated Financial Results
Fiscal
2013
1
Half
(Adjusted)
(Adjusted)
(Adjusted)
2012
2011
2012
2011
Net Sales
$ 114,999
$ 107,203
$ 114,999
$ 107,203
$ 7,796
$ 6,115
$ 1,681
Gross Profit
18,621
17,080
19,187
17,080
2,107
867
1,240
16.2%
15.9%
16.7%
15.9%
14.2%
Selling and Administrative Expense
12,847
10,946
12,847
10,946
(1,901)
696
(1,205)
11.2%
10.2%
11.2%
10.2%
Internal R&D Expense
548
616
548
616
68
-
68
Amortization of intangible assets
375
221
375
221
(154)
172
18
Restructuring/impairment charges
-
(59)
-
-
-
-
Other operating expense, net
(6)
48
(6)
48
54
-
54
Operating Income
4,857
5,308
5,423
5,249
174
(1)
175
4.2%
5.0%
4.7%
4.9%
(0.0%)
Income Before Provision For Income Tax
4,823
5,369
5,389
5,183
206
(1)
207
Provision For Income Taxes
(531)
1,918
1,724
1,851
127
-
127
Net Income
$ 5,354
$ 3,451
$ 3,665
$ 3,332
$ 333
$ (1)
$ 334
4.7%
3.2%
3.2%
3.1%
Income per Share (Basic)
$ 0.53
$ 0.34
$ 0.36
$ 0.32
$ 0.04
$ 0.04
Income per Share (Diluted)
$ 0.52
$ 0.33
$ 0.36
$ 0.32
$ 0.04
$ 0.04
($ in 000’s, except per share)
(adjusted removes certain gains and charges, including imputing taxes at 32% and 36%
effective rates for FY2012 and FY2011, respectively) Onyx
Legacy YoY
Variance
(Reported)
(Adjusted)
6 months ended Dec. 31,
6 months ended Dec. 31,
Total YoY
Variance
-
st |
 6
Consolidated Financial Results
Consolidated Financial Results
Adjusted EBITDA
Adjusted EBITDA
2012
2011
Net Income
5,354
3,451
1,903
Interest expense
254
347
93
Interest income
(51)
(48)
3
Provision for income taxes
(531)
1,918
2,449
Depreciation and amortization
1,472
831
(641)
Restructuring/impairment charges
-
(59)
(59)
Gross profit effect of acquisition
566
-
(566)
Gain on sale of investment
-
(127)
(127)
Adjusted EBITDA
7,064
6,313
751
6.1%
5.9%
6 months ended Dec. 31,
YoY
Variance
$
$
$
$
$
$ |
 7
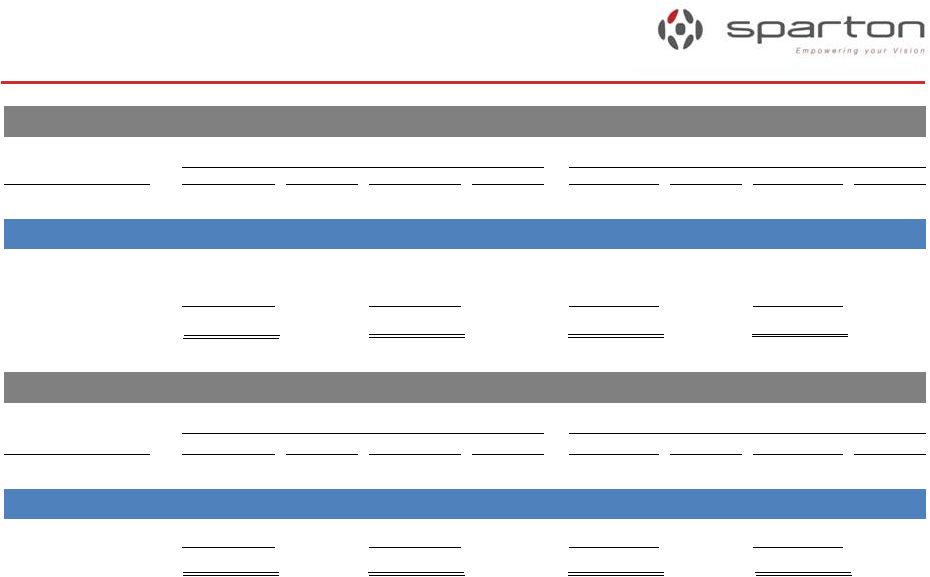
Sales Results
Sales Results
Medical
Medical
SEGMENT
2012
% of Total
2011
% Change
2012
% of Total
2011
% Change
Medical
(with Onyx)
$ 34,804
53%
$ 28,027
24%
$ 62,863
55%
$ 55,487
13%
Complex Systems
14,059
21%
12,549
12%
26,406
23%
25,109
5%
DSS
21,402
32%
18,476
16%
34,608
30%
33,763
3%
Eliminations
(4,286)
-6%
(3,682)
16%
(8,878)
-8%
(7,156)
24%
Totals
$ 65,979
100%
$ 55,370
19%
$ 114,999
100%
$ 107,203
10%
SEGMENT
2012
% of Total
2011
% Change
2012
% of Total
2011
% Change
Medical
(with Onyx)
$ 28,689
48%
$ 28,027
2%
$ 56,748
52%
$ 55,487
2%
Complex Systems
14,059
23%
12,549
12%
26,406
24%
25,109
5%
DSS
21,402
36%
18,476
16%
34,608
32%
33,763
3%
Eliminations
(4,286)
-7%
(3,682)
16%
(8,878)
-8%
(7,156)
24%
Totals
$ 59,864
100%
$ 55,370
8%
$ 108,884
100%
$ 107,203
2%
($ in 000’s)
SALES
(with Onyx)
3 Months Ended December 31,
6 Months Ended December 31,
SALES
(without Onyx)
3 Months Ended December 31,
6 Months Ended December 31, |
 8
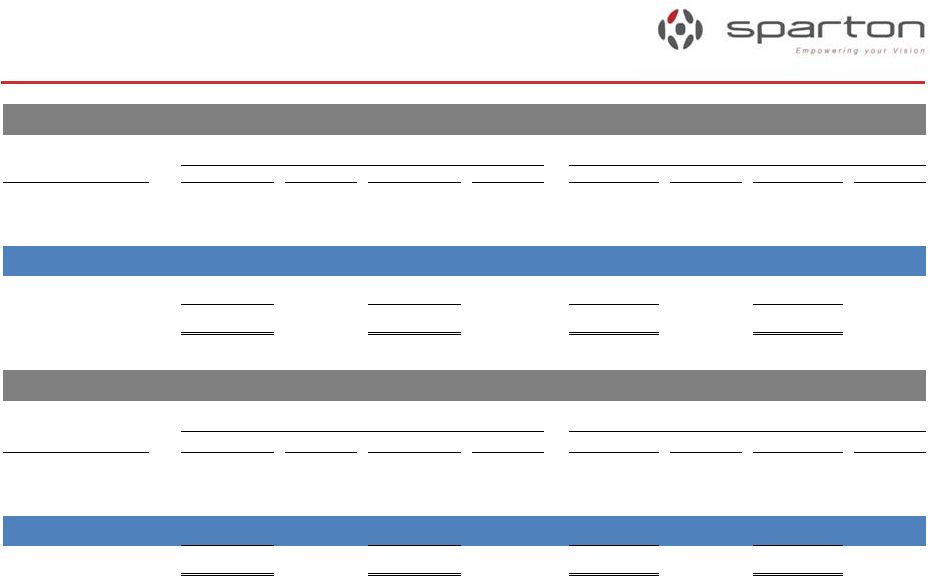
Gross Profit Results
Gross Profit Results
Medical
Medical
SEGMENT
2012
GP %
2011
GP %
2012
GP %
2011
GP %
Medical
(with Onyx)
$ 4,910
14.1%
$ 3,883
13.9%
$ 9,104
14.5%
$ 7,497
13.5%
Complex Systems
1,428
10.2%
1,306
10.4%
2,524
9.6%
2,394
9.5%
DSS
5,636
26.3%
3,547
19.2%
7,559
21.8%
7,189
21.3%
Totals
$ 11,974
18.1%
$ 8,736
15.8%
$ 19,187
16.7%
$ 17,080
15.9%
SEGMENT
2012
GP %
2011
GP %
2012
GP %
2011
GP %
Medical
(with Onyx)
$ 4,043
14.1%
$ 3,883
13.9%
$ 8,237
14.5%
$ 7,497
13.5%
Complex Systems
1,428
10.2%
130
1.0%
2,524
9.6%
2,394
9.5%
DSS
5,636
26.3%
3,547
19.2%
7,559
21.8%
7,189
21.3%
Totals
$ 11,107
18.6%
$ 7,560
13.7%
$ 18,320
16.8%
$ 17,080
15.9%
($ in 000’s)
ADJUSTED GROSS MARGIN
(with Onyx)
3 Months Ended December 31,
6 Months Ended December 31,
GROSS MARGIN
(without Onyx)
3 Months Ended December 31,
6 Months Ended December 31, |
 9
Onyx Operating Results
Onyx Operating Results
2012
2011
2012
2011
Pre
Post
Total
Total
Pre
Post
Total
Total
Acquisition
Acquisition
Onyx
Onyx
Acquisition
Acquisition
Onyx
Onyx
Gross Profit
723
301
1,024
1,796
3,094
301
3,395
3,835
Gross profit effect of acquisition
-
566
566
-
-
566
566
-
Augustine
-
-
-
338
-
-
-
338
Adjusted Gross Profit
723
867
1,590
2,134
3,094
867
3,961
4,173
% of net sales
12.8%
14.2%
13.5%
16.8%
17.0%
14.2%
16.3%
17.1%
Depreciation
285
287
572
300
683
287
970
579
2012
2011
2012
2011
Pre
Post
Total
Total
Pre
Post
Total
Total
Acquisition
Acquisition
Onyx
Onyx
Acquisition
Acquisition
Onyx
Onyx
Operating Income
237
(567)
(330)
278
1,581
(567)
1,014
1,120
Depreciation and amortization
285
459
744
300
683
459
1,142
579
Gross profit effect of acquisition
-
566
566
-
-
566
566
-
Augustine
-
-
-
745
-
-
-
745
Adjusted EBITDA
522
458
980
1,323
2,264
458
2,722
2,444
% of net sales
9.2%
7.5%
8.3%
10.4%
12.4%
7.5%
11.2%
10.0%
($ in 000’s)
ADJUSTED GROSS PROFIT
ADJUSTED EBITDA
For the 6 Months Ended December 31,
For the 6 Months Ended December 31,
For the 3 Months Ended December 31,
For the 3 Months Ended December 31, |
 10
Sales & Gross Profit Results
Sales & Gross Profit Results
Complex Systems
Complex Systems
SEGMENT
2012
% of Total
2011
% Change
2012
% of Total
2011
% Change
Medical
(with Onyx)
$ 34,804
53%
$ 28,027
24%
$ 62,863
55%
$ 55,487
13%
Complex Systems
14,059
21%
12,549
12%
26,406
23%
25,109
8%
DSS
21,402
32%
18,476
16%
34,608
30%
33,763
6%
Eliminations
(4,286)
-6%
(3,682)
16%
(8,878)
-8%
(7,156)
6%
Totals
$ 65,979
100%
$ 55,370
19%
$ 114,999
100%
$ 107,203
10%
SEGMENT
2012
GP %
2011
GP %
2012
GP %
2011
GP %
Medical (with Onyx)
$ 4,910
14.1%
$ 3,883
13.9%
$ 9,104
14.5%
$ 7,497
13.5%
Complex Systems
1,428
10.2%
1,306
10.4%
2,524
9.6%
2,394
9.5%
DSS
5,636
26.3%
3,547
19.2%
7,559
21.8%
7,189
21.3%
Totals
$ 11,974
18.1%
$ 8,736
15.8%
$ 19,187
16.7%
$ 17,080
15.9%
($ in 000’s)
3 Months Ended December 31,
3 Months Ended December 31,
6 Months Ended December 31,
6 Months Ended December 31,
SALES
ADJUSTED GROSS MARGIN |
 11
Sales & Gross Profit Results
Sales & Gross Profit Results
Defense & Security Systems
Defense & Security Systems
SEGMENT
2012
% of Total
2011
% Change
2012
% of Total
2011
% Change
Medical
(with Onyx)
$ 34,804
53%
$ 28,027
24%
$ 62,863
55%
$ 55,487
13%
Complex Systems
14,059
21%
12,549
12%
26,406
23%
25,109
8%
DSS
21,402
32%
18,476
16%
34,608
30%
33,763
6%
Eliminations
(4,286)
-6%
(3,682)
16%
(8,878)
-8%
(7,156)
6%
Totals
$ 65,979
100%
$ 55,370
19%
$ 114,999
100%
$ 107,203
10%
SEGMENT
2012
GP %
2011
GP %
2012
GP %
2011
GP %
Medical
(with Onyx)
$ 4,910
14.1%
$ 3,883
13.9%
$ 9,104
14.5%
$ 7,497
13.5%
Complex Systems
1,428
10.2%
1,306
10.4%
2,524
9.6%
2,394
9.5%
DSS
5,636
26.3%
3,547
19.2%
7,559
21.8%
7,189
21.3%
Totals
$ 11,974
18.1%
$ 8,736
15.8%
$ 19,187
16.7%
$ 17,080
15.9%
($ in 000’s)
3 Months Ended December 31,
3 Months Ended December 31,
6 Months Ended December 31,
6 Months Ended December 31,
SALES
ADJUSTED GROSS MARGIN |
 12
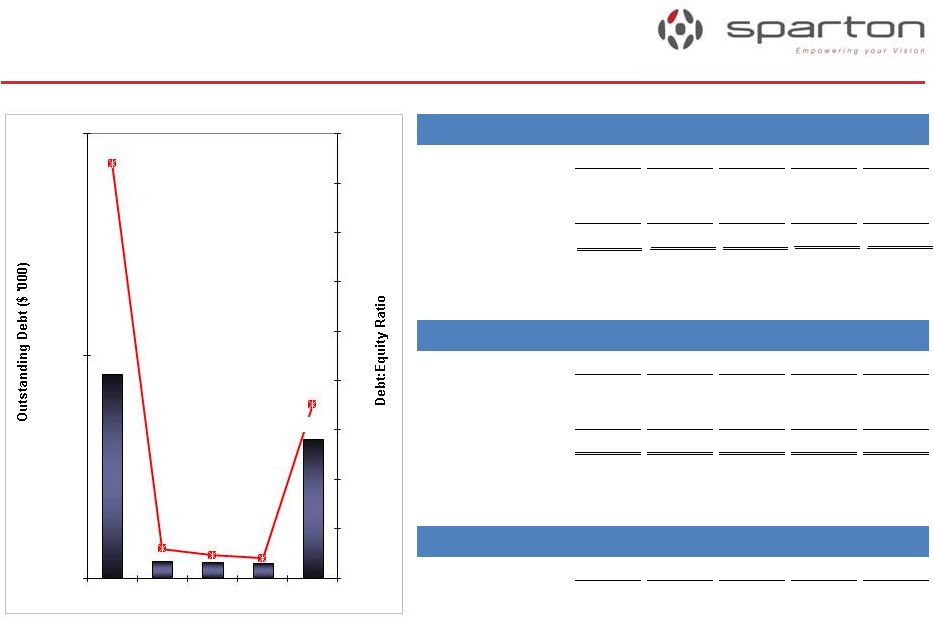
Liquidity & Capital Resources
Liquidity & Capital Resources
($ in '000)
Dec-11
Mar-12
Jun-12
Sep-12
Dec-12
Cash and equivalents
30,610
26,682
46,950
43,096
6,066
LOC Availability
17,290
16,469
16,277
16,012
51,000
Total
47,900
43,151
63,227
59,108
57,066
($ in '000)
Dec-11
Mar-12
Jun-12
Sep-12
Dec-12
Credit Revolver
-
-
-
-
14,000
IRB (Ohio)
1,735
1,702
1,669
1,637
1,604
Total
1,735
1,702
1,669
1,637
15,604
($ in '000)
Dec-11
Mar-12
Jun-12
Sep-12
Dec-12
Net Inventory
38,545
39,252
35,102
38,467
45,367
Cash Availability
Debt
Inventory
22,959
1,917
1,796
1,669
15,604
0.42
0.03
0.02
0.02
0.18
0
0.05
0.1
0.15
0.2
0.25
0.3
0.35
0.4
0.45
0
25,000
50,000
Jun-09
Jun-10
Jun-11
Jun-12
Dec
-12 |
 13
•
Implementation of the strategic growth plan
–
Continue
to
gain
traction
on
a
nationally
focused
direct
selling
effort
–
Further leverage Viet Nam as a low cost country alternative and in-region
provider –
Maintain our level of investment in internal research & development to
commercially extend our product lines
–
Continue to enable our engineering workforce to develop new and innovative
proprietary solutions for our end markets
–
Continue to seek out complementary and compatible acquisitions
•
Focus on sustained profitability
–
Continue margin improvements in Complex Systems
–
Increase capacity utilization
–
Improve the working capital turnover rate
–
Continue additional improvements in operating performance through lean and quality
efforts •
Integration of Onyx
We continue to be optimistic with the outlook that the remainder
of the fiscal year
will outpace fiscal 2012 results
Fiscal 2013 Outlook
Fiscal 2013 Outlook |
 14
Q & A |