Attached files
| file | filename |
|---|---|
| 8-K - 8-K - PACWEST BANCORP | a13-4553_18k.htm |
Exhibit 99.1
|
|
FIG Partners West Coast Bank CEO Forum San Francisco, California February 7, 2013 Filed by PacWest Bancorp Pursuant to Rule 425 under the Securities Act of 1933 and Deemed filed pursuant to Rule 14a-12 of the Securities Exchange Act of 1934 Subject Company: First California Financial Group, Inc. Commission File No. 00-52498 |

|
|
February 7, 2013 FIG - West Coast Bank CEO Forum 2 Forward-Looking Statements and Where to Find Additional Information This presentation contains certain forward-looking information about PacWest Bancorp that is intended to be covered by the safe harbor for “forward-looking statements” provided by the Private Securities Litigation Reform Act of 1995. All references herein to PacWest are intended to refer to PacWest and its predecessor First Community Bancorp. All statements other than statements of historical fact are forward-looking statements. Such statements involve inherent risks and uncertainties, many of which are difficult to predict and are generally beyond the control of the Company. We caution readers that a number of important factors could cause actual results to differ materially from those expressed in, implied or projected by, such forward-looking statements. Risks and uncertainties include, but are not limited to: planned acquisitions and related cost savings cannot be realized or realized within the expected time frame; lower than expected revenues; credit quality deterioration which could cause an increase in the allowance for credit losses and a reduction in net earnings; increased competitive pressure among depository institutions; the Company’s ability to complete announced acquisitions, to successfully integrate acquired entities, or to achieve expected synergies and operating efficiencies within expected time-frames or at all; the integration of acquired businesses costs more, takes longer or is less successful than expected; the possibility that personnel changes will not proceed as planned; the cost of additional capital is more than expected; a change in the interest rate environment reduces net interest margins; asset/liability repricing risks and liquidity risks; pending legal matters may take longer or cost more to resolve or may be resolved adversely to the Company; general economic conditions, either nationally or in the market areas in which the Company does or anticipates doing business, are less favorable than expected; environmental conditions, including natural disasters, may disrupt our business, impede our operations, negatively impact the values of collateral securing the Company’s loans or impair the ability of our borrowers to support their debt obligations; the economic and regulatory effects of the continuing war on terrorism and other events of war, including the conflicts in the Middle East; legislative or regulatory requirements or changes adversely affecting the Company’s business; changes in the securities markets; regulatory approvals for any acquisitions cannot be obtained on the terms expected or on the anticipated schedule; and, other risks that are described in PacWest’s (including its predecessor’s) public filings with the U.S. Securities and Exchange Commission (the “SEC”). If any of these risks or uncertainties materializes or if any of the assumptions underlying such forward-looking statements proves to be incorrect, PacWest’s results could differ materially from those expressed in, implied or projected by such forward-looking statements. PacWest assumes no obligation to update such forward-looking statements. For a more complete discussion of risks and uncertainties, investors and security holders are urged to read the Company’s annual report on Form 10-K, quarterly reports on Form 10-Q and other reports filed by PacWest with the SEC. The documents filed by PacWest with the SEC may be obtained at PacWest Bancorp’s website at www.pacwestbancorp.com or at the SEC’s website at www.sec.gov. These documents may also be obtained free of charge from PacWest by directing a request to: PacWest Bancorp c/o Pacific Western Bank, 275 North Brea Boulevard, Brea, CA 92821. Attention: Investor Relations. Telephone 714-671-6800. |
|
|
Additional Information About the Proposed FCAL Transaction and Where to Find it Investors and security holders are urged to carefully review and consider each of PacWest Bancorp’s and First California Financial Group’s public filings with the SEC, including but not limited to their Annual Reports on Form 10-K, their proxy statements, and their Quarterly Reports on Form 10-Q. The documents filed by PacWest with the SEC may be obtained free of charge at PacWest’s website at www.pacwestbancorp.com or at the SEC’s website at www.sec.gov. These documents may also be obtained free of charge from PacWest by requesting them in writing to PacWest Bancorp, c/o Pacific Western Bank, 275 North Brea Boulevard, Brea, CA 92821; Attention: Investor Relations, or by telephone at (714) 671-6800. The documents filed by First California with the SEC may be obtained free of charge at First California’s website at www.fcalgroup.com or at the SEC’s website at www.sec.gov. These documents may also be obtained free of charge from First California by requesting them in writing to First California Financial Group Inc., 3027 Townsgate Road, Suite 300, Westlake Village, California 91361, Attention: Investor Relations, or by telephone at Phone: (805) 322-9655. This communication does not constitute an offer to sell or the solicitation of an offer to buy any securities or a solicitation of any vote or approval. PacWest Bancorp and First California have filed a registration statement including a joint proxy statement/prospectus and other documents regarding the proposed acquisition with the SEC. Before making any voting or investment decision, investors and security holders of either First California or PacWest Bancorp are urged to carefully read the entire registration statement and joint proxy statement/prospectus, as well as any amendments or supplements to these documents, because they will contain important information about the proposed acquisition. A definitive joint proxy statement/prospectus will be sent to the stockholders of each institution seeking any required stockholder approvals. Investors and security holders will be able to obtain the registration statement and the joint proxy statement/prospectus free of charge from PacWest or First California by writing to the addresses provided for each company set forth in the paragraphs above. PacWest, its directors, executive officers and certain other persons may be soliciting proxies from PacWest Bancorp stockholders in favor of the approval of the acquisition. Information about the directors and executive officers of PacWest and their ownership of PacWest common stock is set forth in the proxy statement for PacWest’s 2012 annual meeting of stockholders, as previously filed with the SEC. Stockholders may obtain additional information regarding the interests of such participants by reading the registration statement and the joint proxy statement/prospectus. First California, its directors, executive officers and certain other persons may be soliciting proxies from First California Financial Group stockholders in favor of the approval of the acquisition. Information about the directors and executive officers of First California and their ownership of First California common stock is set forth in the proxy statement for First California’s 2012 annual meeting of stockholders, as previously filed with the SEC. Stockholders may obtain additional information regarding the interests of such participants by reading the registration statement and the joint proxy statement/prospectus. February 7, 2013 FIG - West Coast Bank CEO Forum 3 |
|
|
February 7, 2013 FIG - West Coast Bank CEO Forum 4 NASDAQ Symbol PACW Fully Diluted Shares 37.421 Million* Market Capitalization $997 Million ** Average Volume 247,000 shares per day ** Dividends Per Share $1.00 per year (4.40%** yield) (Annualized) Analyst Coverage D.A. Davidson & Co. FIG Partners Friedman Billings Ramsey Keefe, Bruyette & Woods, Inc. Macquarie Securities Group RBC Capital Markets Sandler O’Neill + Partners Sterne Agee & Leach, Inc. Wunderlich Securities *Common and unvested restricted shares less treasury shares as of 12/31/2012 **As of 2/5/2013 Stock Summary |
|
|
PacWest Bancorp February 7, 2013 FIG - West Coast Bank CEO Forum 5 Overview, Operating Principles and Objectives Highlights Acquisition Activity Credit DDA & NIM Trends and Investment Yields and Durations Expense Control Performance Charts Strong Franchise Value |
|
|
February 7, 2013 FIG - West Coast Bank CEO Forum 6 Source: Company Filings * See “Non-GAAP Measurements” slide. Commercial Banking Focus in Southern California $5.5 Billion in Assets at December 31, 2012 67 Full-Service Offices: 64 in Southern California and 3 in the Bay Area Low Risk Profile Strong Capital Levels* Proven Operating Model Generates Earnings For the Fourth Quarter of 2012 NIM 5.49% Loan Yield 7.30% Deposit Cost 0.25% Adjusted Efficiency Ratio – 55.7%* Adjusted Earnings Before Income Taxes – $33.9 Million* Strong Credit Quality at December 31, 2012 Non-Covered NPA Ratio – 2.37% Credit Loss Allowance to Net Non-Covered Loans and Leases – 2.37% Credit Loss Allowance to Non-Covered Nonaccruals – 184% Experienced Acquirer 25 Bank and Finance Company Acquisitions, Including 3 FDIC-Assisted Deals Overview as of 12/31/12 Equity ($ millions) Equity/Assets Per Share Company - Tangible* $494.5 9.21% $13.22 Company - GAAP $589.1 10.78% $15.74 Bank - Tangible* $555.1 10.38% n/a Bank - GAAP $649.7 11.93% n/a |
|
|
February 7, 2013 FIG - West Coast Bank CEO Forum 7 Operating Principles Manage for Profitability, Not Growth Strategic Focus on Low-Cost Deposits Strong Expense Management Focus on Credit Quality Results Include Strong Net Interest Margin Controlled Operating Expenses |
|
|
PacWest Bancorp February 7, 2013 FIG - West Coast Bank CEO Forum 8 Overview, Operating Principles and Objectives Highlights Acquisition Activity Credit DDA & NIM Trends and Investment Yields and Durations Expense Control Performance Charts Strong Franchise Value |
|
|
4Q12 Highlights Patient approach to loan growth to preserve NIM and protect balance sheet Core deposit growth remains strong Strong on-balance sheet liquidity Credit loss reserve coverage ratios on noncovered loans are strong ACL to loans: 2.37% ACL to nonaccruals: 184% Metrics Net earnings of $19.9 million, or $0.54 per share ROA: 1.44% ROE: 13.5% ROTE: 16.7% Adjusted earnings before income taxes at $33.9 million * NIM at 5.49% Tangible capital at $494.5 million, or $13.22 per share * DDAs to total deposits: 41% Core deposits to total deposits: 83% * See “Non-GAAP Measurements” slide February 7, 2013 FIG - West Coast Bank CEO Forum 9 |
|
|
Solid Earnings Track Record February 7, 2013 10 *See Non-GAAP Measurements slide FIG - West Coast Bank CEO Forum Adjusted Earnings Before Income Taxes Net Earnings (Loss) PacWest Bancorp ($ in Millions) 1Q10 2Q10 3Q10 4Q10 1Q11 2Q11 3Q11 4Q11 1Q12 2Q12 3Q12 4Q12 Adjusted Earnings Before Income Taxes* $23.2 $21.2 $26.5 $29.2 $28.4 $31.6 $29.1 $28.4 $30.9 $30.0 $33.4 $33.9 Net Earnings (Loss) $(60.5) $2.7 $3.5 $(7.7) $10.7 $12.8 $13.3 $13.9 $5.3 $15.6 $16.1 $19.9 |
|
|
PacWest Bancorp Overview, Operating Principles & Objectives Highlights Acquisition Activity Credit DDA & NIM Trends and Investment Yields and Durations Expense Control Performance Charts Strong Franchise Value February 7, 2013 FIG - West Coast Bank CEO Forum 11 |
|
|
Acquisition Strategy February 7, 2013 FIG - West Coast Bank CEO Forum 12 Similar Strategic Focus Asset generation capability Market Expansion In-Market Consolidation Key Drivers of Accretion Cost Savings Customer Retention Margin Improvement |
|
|
Recent Acquisitions February 7, 2013 FIG - West Coast Bank CEO Forum 13 Acquisition date January 3, 2012 April 3, 2012 August 1, 2012 Cash purchase price $35 million $18 million $58.1 million Gross outstandings $176.1 million * $59.4 million $193.2 million Asset yield 11.15% 15.65% 7.13% NPAs $244,000 Zero 337,000 $ 4Q12 net earnings $1.7 million $540,000 $1.4 million * - includes leases in process of $1.7 million PWE Finance leases business equipment, including computer systems, manufacturing equipment, and medical equipment. Its average lease size is $1 million. Leases are spread amongst 45 states and 18 industries, with financial services, manufacturing, transportation and health care representing over 60% of outstandings. Celtic Capital Corporation focuses on asset-based loans to manufacturers, distributors, wholesalers and service companies, with loans in California, Arizona, Colorado, Minnesota, New Jersey and New Mexico. Its average line of credit is in the $2 million range and its average outstanding loan size is $900,000. APB brought two operating branch offices in San Luis Obispo and Santa Maria, California, and a loan production office in Paso Robles. The Paso Robles loan production office was converted to a full-service branch office on November 19, 2012. Pacific Western Equipment Finance Celtic Capital Corporation American Perspective Bank |
|
|
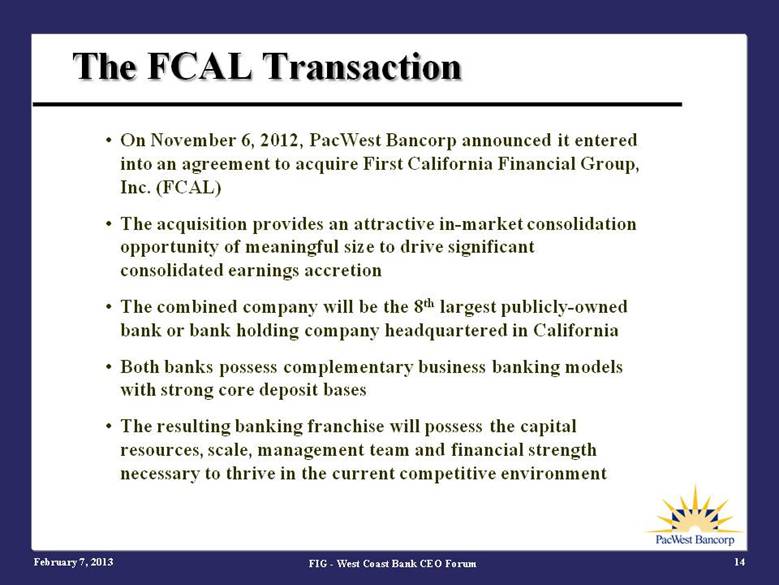
The FCAL Transaction February 7, 2013 FIG - West Coast Bank CEO Forum 14 On November 6, 2012, PacWest Bancorp announced it entered into an agreement to acquire First California Financial Group, Inc. (FCAL) The acquisition provides an attractive in-market consolidation opportunity of meaningful size to drive significant consolidated earnings accretion The combined company will be the 8th largest publicly-owned bank or bank holding company headquartered in California Both banks possess complementary business banking models with strong core deposit bases The resulting banking franchise will possess the capital resources, scale, management team and financial strength necessary to thrive in the current competitive environment |
|
|
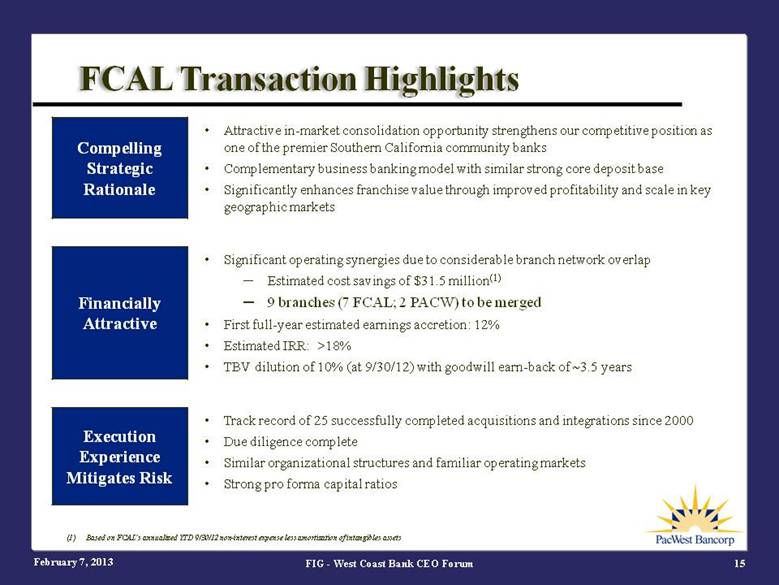
FCAL Transaction Highlights February 7, 2013 15 Compelling Strategic Rationale Attractive in-market consolidation opportunity strengthens our competitive position as one of the premier Southern California community banks Complementary business banking model with similar strong core deposit base Significantly enhances franchise value through improved profitability and scale in key geographic markets Financially Attractive Significant operating synergies due to considerable branch network overlap Estimated cost savings of $31.5 million(1) 9 branches (7 FCAL; 2 PACW) to be merged First full-year estimated earnings accretion: 12% Estimated IRR: >18% TBV dilution of 10% (at 9/30/12) with goodwill earn-back of ~3.5 years Execution Experience Mitigates Risk Track record of 25 successfully completed acquisitions and integrations since 2000 Due diligence complete Similar organizational structures and familiar operating markets Strong pro forma capital ratios FIG - West Coast Bank CEO Forum (1) Based on FCAL’s annualized YTD 9/30/12 non-interest expense less amortization of intangibles assets |
|
|
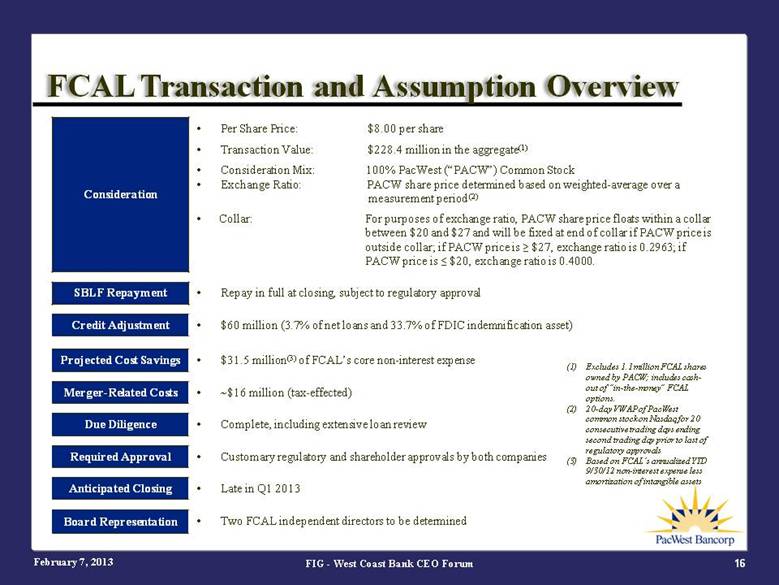
FCAL Transaction and Assumption Overview February 7, 2013 16 Consideration Per Share Price: $8.00 per share Transaction Value: $228.4 million in the aggregate(1) Consideration Mix: 100% PacWest (“PACW”) Common Stock Exchange Ratio: PACW share price determined based on weighted-average over a measurement period (2) Collar: For purposes of exchange ratio, PACW share price floats within a collar between $20 and $27 and will be fixed at end of collar if PACW price is outside collar; if PACW price is > $27, exchange ratio is 0.2963; if PACW price is < $20, exchange ratio is 0.4000. SBLF Repayment Repay in full at closing, subject to regulatory approval Credit Adjustment $60 million (3.7% of net loans and 33.7% of FDIC indemnification asset) Projected Cost Savings $31.5 million(3) of FCAL’s core non-interest expense Merger-Related Costs ~$16 million (tax-effected) Due Diligence Complete, including extensive loan review Required Approval Customary regulatory and shareholder approvals by both companies Anticipated Closing Late in Q1 2013 Board Representation Two FCAL independent directors to be determined FIG - West Coast Bank CEO Forum (1) Excludes 1.1 million FCAL shares owned by PACW; includes cash-out of “in-the-money” FCAL options. (2) 20-day VWAP of PacWest common stock on Nasdaq for 20 consecutive trading days ending second trading day prior to last of regulatory approvals (3) Based on FCAL’s annualized YTD 9/30/12 non-interest expense less amortization of intangible assets |
|
|
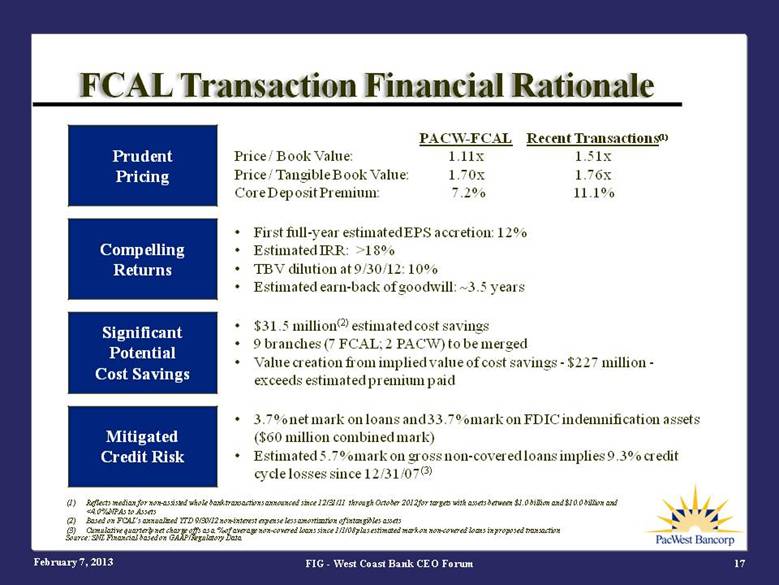
FCAL Transaction Financial Rationale February 7, 2013 17 FIG - West Coast Bank CEO Forum Prudent Pricing PACW-FCAL Recent Transactions(1) Price / Book Value: 1.11x 1.51x Price / Tangible Book Value: 1.70x 1.76x Core Deposit Premium: 7.2% 11.1% Compelling Returns First full-year estimated EPS accretion: 12% Estimated IRR: >18% TBV dilution at 9/30/12: 10% Estimated earn-back of goodwill: ~3.5 years Significant Potential Cost Savings $31.5 million(2) estimated cost savings 9 branches (7 FCAL; 2 PACW) to be merged Value creation from implied value of cost savings - $227 million - exceeds estimated premium paid Mitigated Credit Risk 3.7% net mark on loans and 33.7% mark on FDIC indemnification assets ($60 million combined mark) Estimated 5.7% mark on gross non-covered loans implies 9.3% credit cycle losses since 12/31/07(3) (1) Reflects median for non-assisted whole bank transactions announced since 12/31/11 through October 2012 for targets with assets between $1.0 billion and $10.0 billion and <4.0% NPAs to Assets (2) Based on FCAL’s annualized YTD 9/30/12 non-interest expense less amortization of intangibles assets (3) Cumulative quarterly net charge offs as a % of average non-covered loans since 1/1/08 plus estimated mark on non-covered loans in proposed transaction Source: SNL Financial based on GAAP/Regulatory Data |
|
|
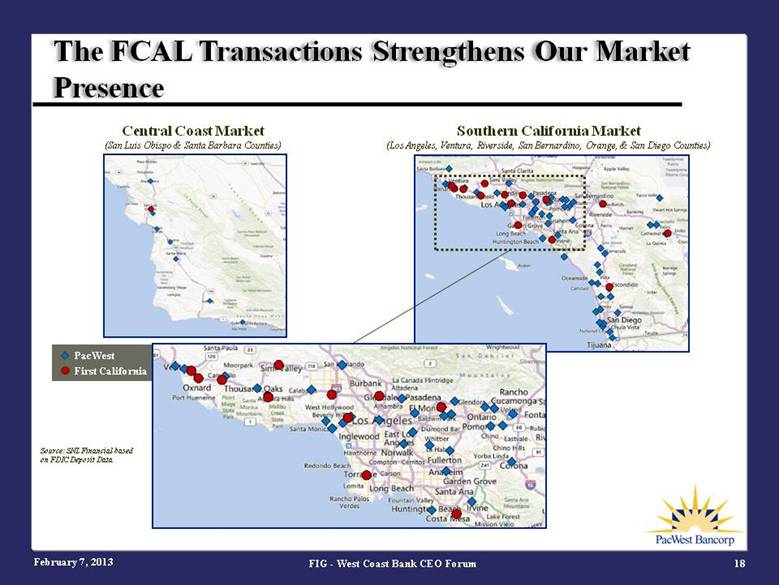
The FCAL Transactions Strengthens Our Market Presence February 7, 2013 FIG - West Coast Bank CEO Forum 18 Central Coast Market (San Luis Obispo & Santa Barbara Counties) Southern California Market (Los Angeles, Ventura, Riverside, San Bernardino, Orange, & San Diego Counties) PacWest First California Source: SNL Financial based on FDIC Deposit Data |
|
|
PacWest Bancorp February 7, 2013 FIG - West Coast Bank CEO Forum 19 Overview, Operating Principles & Objectives Highlights Acquisition Activity Credit DDA & NIM Trends and Investment Yields and Durations Expense Control Performance Charts Strong Franchise Value |
|
|
Credit Quality is Steadily Improving February 7, 2013 FIG - West Coast Bank CEO Forum 20 December 31, September 30, June 30, March 31, December 31, September 30, June 30, March 31, 2012 2012 2012 2012 2011 2011 2011 2011 (Dollars in thousands) Non-Covered Credit Quality Metrics: Allowance for credit losses 72,119 $ 75,012 $ 78,031 $ 81,737 $ 93,783 $ 96,535 $ 102,552 $ 104,239 $ Nonaccrual loans and leases 39,284 36,985 52,763 48,162 58,260 59,968 65,300 76,849 Classified loans and leases (1) 101,019 96,898 139,910 145,933 185,560 177,745 215,437 207,012 Performing restructured loans 106,288 112,834 103,815 110,062 116,791 86,406 82,487 71,669 Net charge-offs 2,893 1,019 3,706 2,046 2,752 6,017 7,187 7,889 Provision for credit losses - (2,000) - (10,000) - - 5,500 7,800 Allowance for credit losses to loans and leases, net of unearned income 2.37% 2.46% 2.74% 2.85% 3.34% 3.34% 3.52% 3.41% Allowance for credit losses to nonaccrual loans and leases 183.6% 202.8% 147.9% 169.7% 161.0% 161.0% 157.0% 135.6% Nonperforming assets to loans and leases, net of unearned income, and other real estate owned 2.37% 2.41% 3.27% 3.24% 3.73% 3.68% 3.96% 4.03% (1) Classified loans and leases are those with a credit risk rating of substandard or doutbtful. |
|
|
Strong Credit Coverage Ratios February 7, 2013 21 FIG - West Coast Bank CEO Forum ACL to Net Loans Non-covered loans and leases only ACL to Nonaccruals 1Q10 2Q10 3Q10 4Q10 1Q11 2Q11 3Q11 4Q11 1Q12 2Q12 3Q12 4Q12 Allowance For Credit Losses to Net Loans & Leases Allowance For Credit Losses to Non-Accrual Loans & Leases 2.81% 2.93% 3.05% 3.30% 3.41% 3.52% 3.34% 3.34% 2.85% 2.74% 2.46% 2.37% 91.5% 86.3% 95.9% 110.8% 135.6% 157.0% 161.0% 161.0% 169.7% 147.9% 202.8% 183.6% |
|
|
Nonaccrual Loans & Leases at Historical Low Levels February 7, 2013 22 FIG - West Coast Bank CEO Forum Classified Loan Sales Non-covered loans and leases only Pacific Western Bank —Linear (Pacific Western Bank) Nonaccrual Loans & Leases ($ in Millions) Pacific Western Bank 1Q10 2Q10 3Q10 4Q10 1Q11 2Q11 3Q11 4Q11 1Q12 2Q12 3Q12 4Q12 $99.9 $108.3 $105.5 $94.2 $76.5 $65.3 $60.0 $58.3 $48.2 $52.8 $37.0 $39.3 |
|
|
New Nonaccruals at Historically Low Levels February 7, 2013 23 FIG - West Coast Bank CEO Forum Non-covered loans and leases only Pacific Western Bank New Nonaccrual Loans & Leases $ in Millions) 1Q10 2Q10 3Q10 4Q10 1Q11 2Q11 3Q11 4Q11 1Q12 2Q12 3Q12 4Q12 $18.1 $25.1 $26.5 $21.4 $23.2 $16.2 $8.8 $8.7 $6.3 $10.7 $5.5 $9.3 |
|
|
Classified Loans & Leases at Historically Low Levels February 7, 2013 24 FIG - West Coast Bank CEO Forum Classified Loan Sales Non-covered loans and leases only Pacific Western Bank —Linear (Pacific Western Bank) Classified Loans & Leases ($ in Millions) Pacific Western Bank 1Q10 2Q10 3Q10 4Q10 1Q11 2Q11 3Q11 4Q11 1Q12 2Q12 3Q12 4Q12 $198.5 $226.4 $297.0 $214.0 $207.0 $215.4 $177.7 $185.6 $145.9 $139.9 $96.9 $101.0 |
|
|
Nonperforming Assets at Lowest Level February 7, 2013 25 FIG - West Coast Bank CEO Forum Classified Loan Sales Non-covered only Pacific Western Bank —Linear (Pacific Western Bank) Nonperforming Assets ($ in Millions) Pacific Western Bank 1Q10 2Q10 3Q10 4Q10 1Q11 2Q11 3Q11 4Q11 1Q12 2Q12 3Q12 4Q12 $129.6 $132.8 $130.1 $119.8 $125.2 $117.5 $108.2 $106.7 $94.4 $94.5 $74.3 $72.9 |
|
|
Largest Non-Covered Nonaccrual Loans FIG - West Coast Bank CEO Forum 26 February 7, 2013 Nonaccrual Amount December 31, 2012 Description (In thousands) 6,908 $ Two loans, each secured by a hotel in San Diego County, California. The borrower is paying according to the restructured terms of each loan. (1) 3,480 Two loans, one of which is secured by an office building Clark County, Nevada; and one of which is secured by an office building in Maricopa County, Arizona. (2) 2,354 This loan is secured by a strip retail center in Riverside County, California. The borrower is paying according to the restructured terms of the loan. (1) 1,877 This loan is secured by a strip retail center in Clark County, Nevada. (2) 1,790 This loan is unsecured and has a specific reserve for 100% of the balance. (1) 1,706 This loan is secured by two industrial buildings in San Diego County, California. (1) 1,245 This loan is secured by land in Riverside County, California. (2) 1,199 Two loans, one of which is secured by an apartment building in San Diego County, California; and one of which is secured by an office building in San Diego County, California. (1) 1,194 This loan is secured by three industrial buildings in Riverside County, California. (1) 1,046 This loan is secured by a multi-tenant industrial building in Riverside County, California. (1) 22,799 $ Total (1) On nonaccrual status at September 30, 2012 (2) New nonaccrual in fourth quarter of 2012 |
|
|
February 7, 2013 FIG - West Coast Bank CEO Forum 27 Non-Covered Loan Charge-Off History Source: Company Filings 1Q08 2Q08 3Q08 4Q08 1Q09 2Q09 3Q09 4Q09 1Q10 1Q10 Excluding Classified Loan Sale 2Q10 3Q10 4Q10 4Q10 Excluding Classified Loan Sale 1Q11 2Q11 3Q11 4Q11 1Q12 2Q12 3Q12 4Q12 1.82% 0.50% 0.76% 0.76% 0.63% 1.83% 3.17% 3.26% 16.81% 2.51% 1.50% 1.09% 3.90% 1.37% 1.03% 0.97% 0.83% 0.39% 0.29% 0.52% 0.14% 0.38% Annualized Net Chargeoffs to Average Loans |
|
|
Net Credit Costs - Components February 7, 2013 FIG - West Coast Bank CEO Forum 28 Three Months Ended December 31, September 30, June 30, March 31, December 31, September 30, June 30, March 31, 2012 2012 2012 2012 2011 2011 2011 2011 (In thousands) Provision (negative provision) for credit losses on non-covered loans and leases - $ (2,000) $ - $ (10,000) $ - $ - $ 5,500 $ 7,800 $ Non-covered OREO expense, net 316 1,883 130 1,821 1,714 2,293 2,300 703 Total non-covered net credit costs 316 (117) 130 (8,179) 1,714 2,293 7,800 8,503 $ Provision (negative provision) for credit losses on covered loans (4,333) (141) (271) 3,926 4,122 348 5,890 2,910 Covered OREO expense (income), net (461) 4,290 2,130 822 226 4,813 1,205 (2,578) (4,794) 4,149 1,859 4,748 4,348 5,161 7,095 332 Less: FDIC loss sharing (income) expense, net, excluding FDIC share of OTTI loss 6,022 367 994 3,579 (2,667) (963) (5,316) 1,170 Total covered net credit costs 1,228 4,516 2,853 8,327 1,681 4,198 1,779 1,502 Total net credit costs 1,544 $ 4,399 $ 2,983 $ 148 $ 3,395 $ 6,491 $ 9,579 $ 10,005 $ |
|
|
February 7, 2013 FIG - West Coast Bank CEO Forum 29 Loan Portfolio Concentrations December 31, 2012 Total Loans Non-Covered Loans and Leases and Leases Covered Loans Unrounded %'s % of % of % of Amount Total Amount Total Amount Total (Dollars in thousands) Real estate mortgage: Hospitality 184,032 $ 5% 181,144 $ 6% 2,888 $ - SBA 504 54,158 1% 54,158 2% - - Other 2,234,701 61% 1,682,368 55% 552,333 94% Total real estate mortgage 2,472,891 67% 1,917,670 63% 555,221 94% Real estate construction: Residential 54,291 1% 48,629 1% 5,662 1% Commercial 98,888 3% 81,330 3% 17,558 3% Total real estate construction 153,179 4% 129,959 4% 23,220 4% Total real estate loans 2,626,070 71% 2,047,629 67% 578,441 98% Commercial: Collateralized 467,779 13% 453,176 14% 14,603 2% Unsecured 70,484 2% 69,844 2% 640 - Asset-based 239,430 7% 239,430 8% - - SBA 7(a) 25,325 1% 25,325 1% - - Total commercial 803,018 23% 787,775 25% 15,243 2% Leases (1) 174,373 5% 174,373 6% - - Consumer 23,081 1% 22,487 1% 594 - Foreign 17,241 0% 17,241 1% - - Total gross loans 3,643,783 $ 100% 3,049,505 100% 594,278 100% Less: Unearned income (2,535) - Discount - (50,951) Allowance for loan and lease losses (65,899) (26,069) Total net loans 2,981,071 $ 517,258 $ (1) Excludes leases in process of $1.7 million. |
|
|
February 7, 2013 FIG - West Coast Bank CEO Forum 30 Non-Covered Real Estate Mortgage Exposure December 31, 2012 September 30, 2012 December 31, 2011 % of % of % of Loan Category Amount Total Amount Total Amount Total (Dollars in thousands) Commercial real estate mortgage: Industrial/warehouse $ 315,096 16.4% $ 329,287 17.1% $ 367,494 18.5% Retail 271,412 14.2% 255,669 13.3% 286,691 14.5% Office buildings 304,096 15.9% 284,920 14.8% 290,074 14.6% Owner-occupied 195,170 10.2% 196,812 10.2% 226,307 11.4% Hotel 181,144 9.4% 118,189 6.1% 144,402 7.3% Healthcare 102,816 5.4% 113,827 5.9% 131,625 6.7% Mixed use 51,294 2.7% 47,404 2.5% 53,855 2.7% Gas station 29,632 1.5% 28,563 1.5% 33,715 1.7% Self storage 29,688 1.5% 19,489 1.0% 23,148 1.2% Restaurant 16,755 0.9% 16,651 0.9% 22,549 1.1% Land acquisition/development 21,922 1.1% 21,988 1.1% 14,015 0.7% Unimproved land 13,173 0.7% 11,089 0.6% 1,369 0.1% Other 172,273 9.0% 278,475 14.3% 206,504 10.4% Total commercial real estate mortgage 1,704,471 88.9% 1,722,363 89.3% 1,801,748 90.9% Residential real estate mortgage: Multi-family 103,742 5.4% 86,190 4.5% 93,866 4.7% Single family owner-occupied 46,125 2.4% 37,700 2.0% 32,209 1.6% Single family nonowner-occupied 12,789 0.7% 7,165 0.4% 19,341 1.0% HELOCs 50,543 2.6% 47,966 2.5% 35,300 1.8% Other - 0.0% 27,506 1.3% - - Total residential real estate mortgage 213,199 11.1% 206,527 10.7% 180,716 9.1% Total gross non-covered real estate mortgage loans $ 1,917,670 100.0% $ 1,928,890 100.0% $ 1,982,464 100.0% |
|
|
Covered Real Estate Loan Exposure February 7, 2013 FIG - West Coast Bank CEO Forum 31 December 31, 2012 December 31, 2011 % of % of Loan Category Amount Total Amount Total (Dollars in thousands) Commercial real estate mortgage: Industrial/warehouse $ 26,205 4.7% $ 33,755 4.6% Retail 96,659 17.4% 113,289 15.4% Office buildings 53,674 9.7% 77,767 10.6% Owner-occupied 17,301 3.1% 24,837 3.4% Hotel 2,888 0.5% 2,944 0.4% Healthcare 8,568 1.5% 16,851 2.3% Mixed use 2,919 0.5% 7,733 1.1% Gas station 5,131 0.9% 6,001 0.8% Self storage 48,937 8.8% 52,793 7.2% Restaurant 1,686 0.3% 2,532 0.3% Unimproved land 493 0.1% 1,752 0.2% Other 14,141 2.6% 14,887 2.0% Total commercial real estate mortgage 278,602 50.1% 355,141 48.3% Residential real estate mortgage: Multi-family 169,601 30.6% 250,633 34.0% Single family owner-occupied 78,960 14.2% 95,248 12.9% Single family nonowner-occupied 20,309 3.7% 25,624 3.5% Mixed use 2,474 0.4% 2,918 0.4% HELOCs 5,275 1.0% 6,794 0.9% Total residential real estate mortgage 276,619 49.9% 381,217 51.7% Total gross covered real estate mortgage loans $ 555,221 100.0% $ 736,358 100.0% |
|
|
February 7, 2013 FIG - West Coast Bank CEO Forum 32 Other Real Estate Owned December 31, 2012 December 31, 2011 Non-Covered Covered Non-Covered Covered Property Type OREO OREO OREO OREO (In thousands) Commercial real estate 1,684 $ 11,635 $ 23,003 $ 15,053 $ Construction and land development 31,888 6,708 24,788 15,461 Multi-family - 4,239 - - Single family residences - 260 621 2,992 Total OREO 33,572 $ 22,842 $ 48,412 $ 33,506 $ |
|
|
PacWest Bancorp February 7, 2013 FIG - West Coast Bank CEO Forum 33 Overview, Operating Principles & Objectives Highlights Acquisition Activity Credit DDA & NIM Trends and Investment Yields and Durations Expense Control Performance Charts Strong Franchise Value |
|
|
February 7, 2013 FIG - West Coast Bank CEO Forum 34 Noninterest-Bearing Deposits to Total Deposits at Period End * 2004 excludes a $365.0 million short-term interest bearing deposit received on December 31, 2004 Source: Company Filings and SNL Data Source 35% 38% 42% 46% 49% 43% 37% 34% 32% 32% 37% 41% 22% 23% 24% 24% 23% 22% 22% 22% 23% 23% 25% 30% 2001 2002 2003 2004* 2005 2006 2007 2008 2009 2010 2011 4Q12 PACW CA Peers |
|
|
Strong Net Interest Margin Versus Peers February 7, 2013 FIG - West Coast Bank CEO Forum 35 Peers Defined: Median of all Major Exchange (NYSE & NASDAQ) Banks with $3B to $7B in Assets as of period end. Source: Company Filings and SNL Data Source 5.32% 5.41% 5.24% 5.58% 6.37% 6.67% 6.34% 5.30% 4.79% 5.02% 5.26% 5.49% 3.91% 4.19% 4.00% 3.96% 3.90% 3.82% 3.64% 3.79% 3.67% 3.92% 3.80% 3.78% 2001 2002 2003 2004 2005 2006 2007 2008 2009 2010 2011 4Q12 PACW Peers |
|
|
Several Volatile Items Impact the NIM February 7, 2013 FIG - West Coast Bank CEO Forum 36 Three Months Ended Year Ended December 31, September 30, December 31, Items Impacting NIM Volatility 2012 2012 2012 Increase (Decrease) in NIM Accelerated accretion of acquisition discounts from covered loan payoffs 0.13% 0.12% 0.16% Nonaccrual loan interest 0.01% 0.04% 0.01% Unearned income and acquisition accounting adjustments on the early repayment of leases 0.03% 0.14% 0.05% Celtic loan portfolio premium amortization (0.01)% (0.04)% (0.03)% Total 0.16% 0.26% 0.19% Reported NIM 5.49% 5.58% 5.52% |
|
|
Investment Yields and Durations February 7, 2013 FIG - West Coast Bank CEO Forum 37 Carrying Duration Value at at 12/31/12 Security Type 12/31/12 (in years) (In thousands) Residential mortgage-backed securities: Government agency and government- sponsored enterprise pass through securities 807,842 $ 1.93% 3.6 Government agency and government-sponsored enterprise collateralized mortgage obligations 101,694 0.80% 3.0 Covered private label collateralized mortgage obligations 44,684 10.20% 3.9 Municipal securities 348,041 4.29% 6.7 Corporate debt securities 42,365 3.85% 13.4 Other securities 10,759 - - Total securities available-for-sale 1,355,385 $ 2.73% 4.6 Tax Equivalent Yield for Month of December 2012 |
|
|
PacWest Bancorp February 7, 2013 FIG - West Coast Bank CEO Forum 38 Overview, Operating Principles & Objectives Highlights Acquisition Activity Credit DDA & NIM Trends and Investment Yields and Durations Expense Control Performance Charts Strong Franchise Value |
|
|
February 7, 2013 FIG - West Coast Bank CEO Forum 39 * - The 2008 efficiency ratio excludes the goodwill write-off. When the goodwill write-off is included in non-interest expense, the efficiency ratio is 371.7%. ** - Adjusted efficiency ratio – see Non-GAAP Measurements slide Source: Company Filings and SNL Data Source Focus and Execution Drive Efficiency Efficiency Ratios Average Branch Size ($ - M) |
|
|
PacWest Bancorp February 7, 2013 FIG - West Coast Bank CEO Forum 40 Overview, Operating Principles & Objectives Highlights Acquisition Activity Credit DDA & NIM Trends and Investment Yields and Durations Expense Control Performance Charts Strong Franchise Value |
|
|
February 7, 2013 FIG - West Coast Bank CEO Forum 41 Stock Performance vs. Indices Monthly pricing data indexed from 6/19/00 through 2/1/13 - 100.0 200.0 300.0 400.0 500.0 Jun - 00 Jun - 01 Jun - 02 Jun - 03 Jun - 04 Jun - 05 Jun - 06 Jun - 07 Jun - 08 Jun - 09 Jun - 10 Jun - 11 Jun - 12 PacWest PACW KBW Bank Index BKX S&P 500 SPX |
|
|
Strong Capital Base February 7, 2013 FIG - West Coast Bank CEO Forum 42 December 31, 2012 Well Pacific PacWest Capitalized Western Bancorp Requirement Bank Consolidated (Dollars in thousands) Total capital 649,656 $ 589,121 $ Tangible capital * 555,067 $ 494,532 $ Regulatory capital ratios: Tier 1 leverage capital ratio 5.00% 9.78% 10.53% Tier 1 risk-based capital ratio 6.00% 14.10% 15.17% Total risk-based capital ratio 10.00% 15.36% 16.43% Tangible common equity ratio * N/A 10.38% 9.21% * See "Non-GAAP Measurements" slide. |
|
|
PacWest Bancorp February 7, 2013 FIG - West Coast Bank CEO Forum 43 Overview, Operating Principles & Objectives Highlights Acquisition Activity Credit DDA & NIM Trends and Investment Yields and Durations Expense Control Performance Charts Strong Franchise Value |
|
|
Strong Franchise Value February 7, 2013 FIG - West Coast Bank CEO Forum 44 * Source: SNL Data Source, using latest data available ** Source: FDIC as of 9/30/2012, the latest data available 9th Largest Publicly-Owned CA Bank* 14th Largest Commercial Bank in California out of 239 Financial Institutions** California Footprint from the Central Coast to throughout Southern California 67 Branches: 64 in Southern California and 3 in the Bay Area Strong Capital Base Low Cost of Deposits High Net Interest Margin Profitability Solid Credit Quality |
|
|
February 7, 2013 FIG - West Coast Bank CEO Forum 45 Attractive Southern California Footprint |
|
|
California Public Banks & Thrifts – 12/31/2012 FIG - West Coast Bank CEO Forum 46 February 7, 2013 Source: SNL Continued on next page Company Name Ticker Industry Assets 1 Wells Fargo & Company WFC Bank $1,422,968,000 2 First Republic Bank FRC Bank 34,387,677 3 City National Corporation CYN Bank 28,618,492 4 East West Bancorp, Inc. EWBC Bank 22,536,110 5 SVB Financial Group SIVB Bank 22,766,123 6 Cathay General Bancorp CATY Bank 10,694,089 7 CapitalSource Inc. CSE Bank 8,549,005 8 CVB Financial Corp. CVBF Bank 6,363,364 9 PacWest Bancorp PACW Bank $5,463,658 10 BBCN Bancorp, Inc. BBCN Bank 5,640,661 11 Farmers & Merchants Bank of Long Beach FMBL Bank 4,988,961 12 Westamerica Bancorporation WABC Bank 4,952,193 13 Mechanics Bank MCHB Bank 3,118,314 14 Hanmi Financial Corporation HAFC Bank 2,882,520 15 Wilshire Bancorp, Inc. WIBC Bank 2,750,863 16 BofI Holding, Inc. BOFI Savings Bank/Thrift/Mutual 2,617,319 17 TriCo Bancshares TCBK Bank 2,609,269 18 First California Financial Group, Inc. FCAL Bank 1,990,804 19 Farmers & Merchants Bancorp FMCB Bank 1,884,401 20 Exchange Bank EXSR Bank 1,698,857 21 Heritage Commerce Corp HTBK Bank 1,693,312 22 First PacTrust Bancorp, Inc. BANC Savings Bank/Thrift/Mutual 1,669,732 23 Preferred Bank PFBC Bank 1,555,367 24 Sierra Bancorp BSRR Bank 1,437,903 25 Bank of Marin Bancorp BMRC Bank 1,434,749 26 Bridge Capital Holdings BBNK Bank 1,343,585 27 American Business Bank AMBZ Bank 1,279,743 28 CU Bancorp CUNB Bank 1,249,637 29 Provident Financial Holdings, Inc. PROV Savings Bank/Thrift/Mutual 1,248,330 30 Pacific Premier Bancorp, Inc. PPBI Bank 1,173,792 31 River City Bank RCBC Bank 1,119,756 32 Pacific Mercantile Bancorp PMBC Bank 1,097,870 33 Heritage Oaks Bancorp HEOP Bank 1,097,532 |
|
|
California Public Banks & Thrifts – Continued FIG - West Coast Bank CEO Forum 47 February 7, 2013 Source: SNL 34 Bank of Commerce Holdings BOCH Bank 979,538 35 Kaiser Federal Financial Group, Inc. SMPL Savings Bank/Thrift/Mutual 915,413 36 FNB Bancorp FNBG Bank 897,724 37 North Valley Bancorp NOVB Bank 894,551 38 Central Valley Community Bancorp CVCY Bank 890,228 39 Malaga Financial Corporation MLGF Savings Bank/Thrift/Mutual 851,000 40 First Northern Community Bancorp FNRN Bank 831,500 41 1st Enterprise Bank FENB Bank 706,138 42 Private Bank of California PBCA Bank 685,073 43 Oak Valley Bancorp OVLY Bank 660,480 44 United Security Bancshares UBFO Bank 633,631 45 Sunwest Bank SWBC Bank 627,173 46 RBB Bancorp RBBO Bank 626,654 47 Saehan Bancorp SAEB Bank 618,976 48 Pacific City Financial Corporation PFCF Bank 607,063 49 American River Bankshares AMRB Bank 596,389 50 California Republic Bancorp CRPB Bank 591,053 51 Premier Valley Bank PVLY Bank 554,000 52 Community West Bancshares CWBC Bank 532,101 53 Security California Bancorp SCAF Bank 488,045 54 Commonwealth Business Bank CWBB Bank 481,853 55 1st Century Bancshares, Inc. FCTY Bank 474,363 56 Plumas Bancorp PLBC Bank 470,073 57 Manhattan Bancorp MNHN Bank 469,332 58 Summit State Bank SSBI Bank 444,896 59 Mission Community Bancorp MISN Bank 443,317 60 Greater Sacramento Bancorp GSCB Bank 433,886 |
|
|
Non-GAAP Information The Company uses certain non-GAAP financial measures to provide meaningful supplemental information regarding the Company’s operational performance and to enhance investors’ overall understanding of such financial performance. These non-GAAP financial measures are presented for supplemental informational purposes only for understanding the Company’s operating results and should not be considered a substitute for financial information presented in accordance with GAAP. These non-GAAP financial measures presented by the Company may be different from non-GAAP financial measures used by other companies. The table on the following slide presents a reconciliation of the non-GAAP financial measurements to the GAAP financial measurements and certain key performance ratios February 7, 2013 FIG - West Coast Bank CEO Forum 48 |
|
|
Non-GAAP Measurements – Adjusted Earnings Before Income Taxes February 7, 2013 FIG - West Coast Bank CEO Forum 49 December 31, September 30, December 31, Adjusted Earnings Before Income Taxes 2012 2012 2011 (In thousands) Earnings before income taxes 32,468 $ 26,937 $ 24,436 $ Plus: Total provision for credit losses (4,333) (2,141) 4,122 Non-covered OREO expense, net 316 1,883 1,714 Covered OREO expense, net (461) 4,290 226 Acquisition and integration costs 1,092 2,101 600 Less: FDIC loss sharing income (expense), net (6,022) (367) 2,667 Gain on sale of securities 1,239 - - Adjusted earnings before income taxes 33,865 $ 33,437 $ 28,431 $ Three Months Ended |
|
|
Non-GAAP Measurements – Tangible Equity FIG - West Coast Bank CEO Forum 50 February 7, 2013 December 31, September 30, December 31, Tangible Common Equity 2012 2012 2011 (Dollars in thousands) PacWest Bancorp Consolidated: Stockholders' equity 589,121 $ 584,086 $ 546,203 $ Less: Intangible assets 94,589 95,491 56,556 Tangible common equity 494,532 $ 488,595 $ 489,647 $ Total assets 5,463,658 $ 5,538,502 $ 5,528,237 $ Less: Intangible assets 94,589 95,491 56,556 Tangible assets 5,369,069 $ 5,443,011 $ 5,471,681 $ Equity to assets ratio 10.78% 10.55% 9.88% Tangible common equity ratio (1) 9.21% 8.98% 8.95% Book value per share 15.74 $ 15.61 $ 14.66 $ Tangible book value per share (2) 13.22 $ 13.06 $ 13.14 $ Shares outstanding 37,420,909 37,420,025 37,254,318 Pacific Western Bank: Stockholders' equity 649,656 $ 660,693 $ 625,494 $ Less: Intangible assets 94,589 95,491 56,556 Tangible common equity 555,067 $ 565,202 $ 568,938 $ Total assets 5,443,484 $ 5,520,998 $ 5,512,025 $ Less: Intangible assets 94,589 95,491 56,556 Tangible assets 5,348,895 $ 5,425,507 $ 5,455,469 $ Equity to assets ratio 11.93% 11.97% 11.35% Tangible common equity ratio (1) 10.38% 10.42% 10.43% (1) Calculated as tangible common equity divided by tangible assets. (2) Calculated as tangible common equity divided by shares outstanding. |
|
|
February 7, 2013 FIG - West Coast Bank CEO Forum 51 Non-GAAP Measurements – Adjusted Efficiency Ratio December 31, September 30, December 31, Adjusted Efficiency Ratio 2012 2012 2011 (Dollars in thousands) Noninterest expense $ 43,525 $ 51,657 $ 43,469 Less: Non-covered OREO expense, net 316 1,883 1,714 Covered OREO expense, net (461) 4,290 226 Acquisition and integration costs 1,092 2,101 600 Adjusted noninterest expense $ 42,578 $ 43,383 $ 40,929 Net interest income $ 69,603 $ 70,771 $ 63,773 Noninterest income 2,057 5,682 8,254 Net revenues 71,660 76,453 72,027 Less: FDIC loss sharing income (expense), net (6,022) (367) 2,667 Gain on sale of securities 1,239 - - Adjusted net revenues $ 76,443 $ 76,820 $ 69,360 Base efficiency ratio (1) 60.7% 67.6% 60.4% Adjusted efficiency ratio (2) 55.7% 56.5% 59.0% (1) Noninterest expense divided by net revenues. (2) Adjusted noninterest expense divided by adjusted net revenues. Three Months Ended |
|
|
PacWest Bancorp 10250 Constellation Boulevard Suite 1640 Los Angeles, California 90067 Matt Wagner, CEO Vic Santoro, CFO 310.728.1020 310.728.1021 |