Attached files
| file | filename |
|---|---|
| 8-K - ANNALY CAPITAL MANAGEMENT, INC. 8-K - ANNALY CAPITAL MANAGEMENT INC | a50552635.htm |
| EX-99.1 - EXHIBIT 99.1 - ANNALY CAPITAL MANAGEMENT INC | a50552635ex99_1.htm |
Exhibit 99.2
4Q 2012 Stockholder Supplement FEBRUARY 6, 2013
Safe Harbor Notice This presentation, other written or oral communications and our public documents to which we refer contain or incorporate by reference certain forward-looking statements which are based on various assumptions (some of which are beyond our control) may be identified by reference to a future period or periods or by the use of forward-looking terminology, such as "may," "will," "believe," "expect," "anticipate," "continue," or similar terms or variations on those terms or the negative of those terms. Actual results could differ materially from those set forth in forward-looking statements due to a variety of factors, including, but not limited to, changes in interest rates; changes in the yield curve; changes in prepayment rates; the availability of mortgage-backed securities for purchase; the availability of financing and, if available, the terms of any financings; changes in the market value of our assets; changes in business conditions and the general economy; our ability to integrate the commercial mortgage business; our ability to consummate any contemplated investment opportunities; risks associated with the businesses of our subsidiaries, including the investment advisory business of our wholly-owned subsidiaries, including: the removal by clients of assets managed, their regulatory requirements, and competition in the investment advisory business; risks associated with the broker-dealer business of our wholly-owned subsidiary; changes in government regulations affecting our business; our ability to maintain our qualification as a REIT for federal income tax purposes; and our ability to maintain our exemption from registration under the Investment Company Act of 1940, as amended. For a discussion of the risks and uncertainties which could cause actual results to differ from those contained in the forward-looking statements, see "Risk Factors" in our most recent Annual Report on Form 10-K and any subsequent Quarterly Reports on Form 10-Q. We do not undertake, and specifically disclaim any obligation, to publicly release the result of any revisions which may be made to any forward-looking statements to reflect the occurrence of anticipated or unanticipated events or circumstances after the date of such statements.
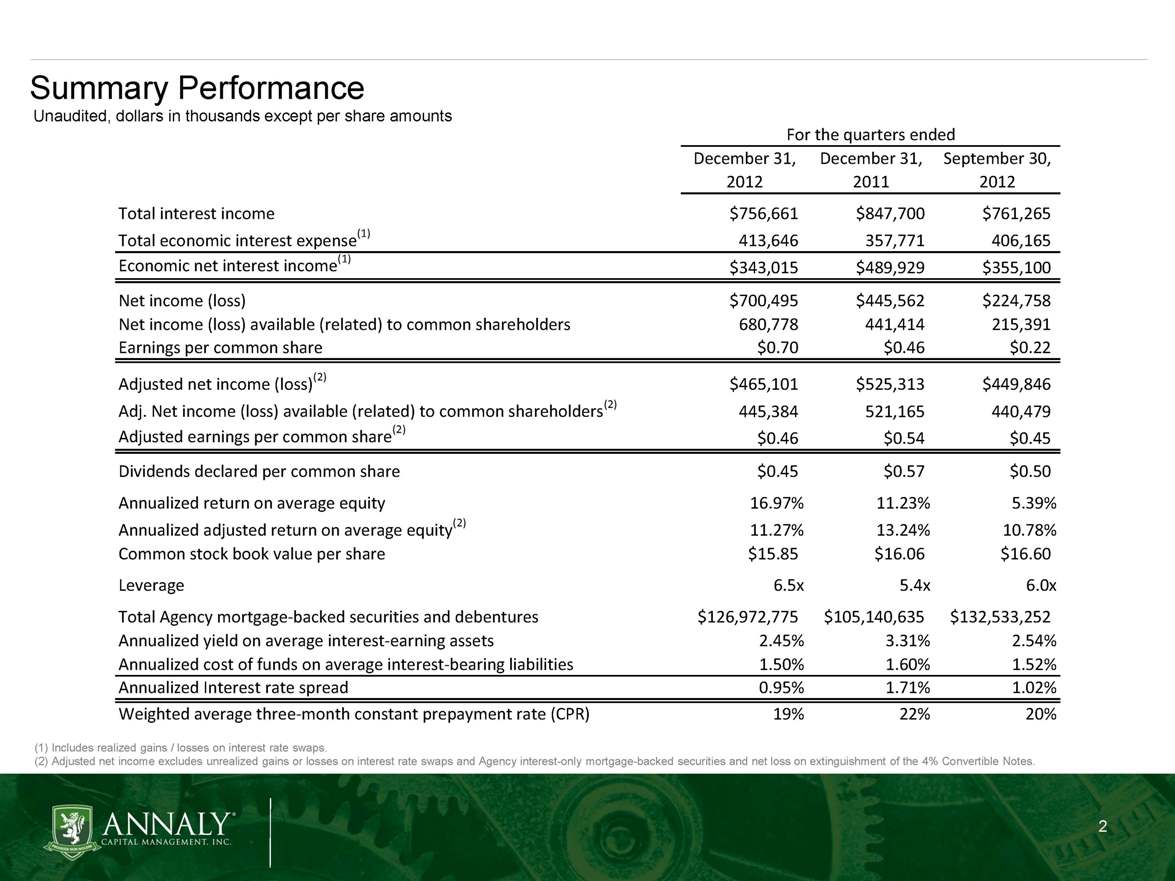
Summary Performance Unaudited, dollars in thousands except per share amounts (1) Includes realized gains / losses on interest rate swaps. (2) Adjusted net income excludes unrealized gains or losses on interest rate swaps and Agency interest-only mortgage-backed securities and net loss on extinguishment of the 4% Convertible Notes. December 31,December 31,September 30,201220112012Total interest income$756,661$847,700$761,265Total economic interest expense(1)413,646357,771406,165Economic net interest income(1)$343,015$489,929$355,100Net income (loss)$700,495$445,562$224,758Net income (loss) available (related) to common shareholders680,778441,414215,391Earnings per common share$0.70$0.46$0.22Adjusted net income (loss)(2)$465,101$525,313$449,846Adj. Net income (loss) available (related) to common shareholders(2)445,384521,165440,479Adjusted earnings per common share(2)$0.46$0.54$0.45Dividends declared per common share$0.45$0.57$0.50Annualized return on average equity16.97%11.23%5.39%Annualized adjusted return on average equity11.27%13.24%10.78%Common stock book value per share$15.85$16.06$16.60Leverage6.5x5.4x6.0xTotal Agency mortgage-backed securities and debentures$126,972,775$105,140,635$132,533,252Annualized yield on average interest-earning assets2.45%3.31%2.54%Annualized cost of funds on average interest-bearing liabilities1.50%1.60%1.52%Annualized Interest rate spread0.95%1.71%1.02%Weighted average three-month constant prepayment rate (CPR)19%22%20%For the quarters ended
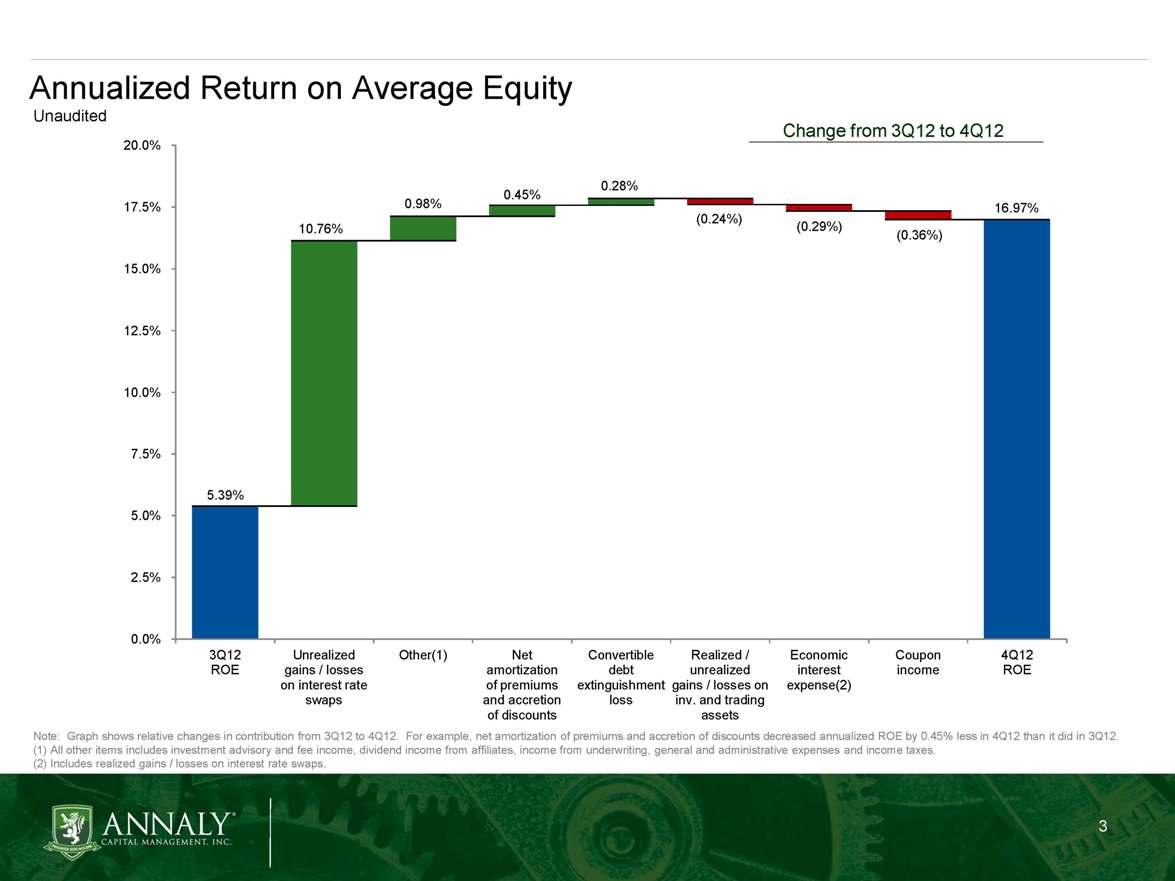
10.76% 0.98% 0.45% 0.28% 5.39% 0.0% 2.5% 5.0% 7.5% 10.0% 12.5% 15.0% 17.5% 20.0% 3Q12 ROE Unrealized gains / losses on interest rate swaps Other(1) Net amortization of premiums and accretion of discounts Convertible debt extinguishment loss Realized / unrealized gains / losses on inv. and trading assets Economic interest expense(2) Coupon income 4Q12 ROE (0.24%) (0.29%) (0.36%) 16.97% Annualized Note: Graph shows relative changes in contribution from 3Q12 to 4Q12. For example, net amortization of premiums and accretion of discounts decreased annualized ROE by 0.45% less in Q412 than it did in Q312. (1) All other items includes investment advisory and fee income, dividend income from affiliates, income from underwriting, general and administrative expenses and income taxes. (2) Includes realized gains / losses on interest rate swaps.
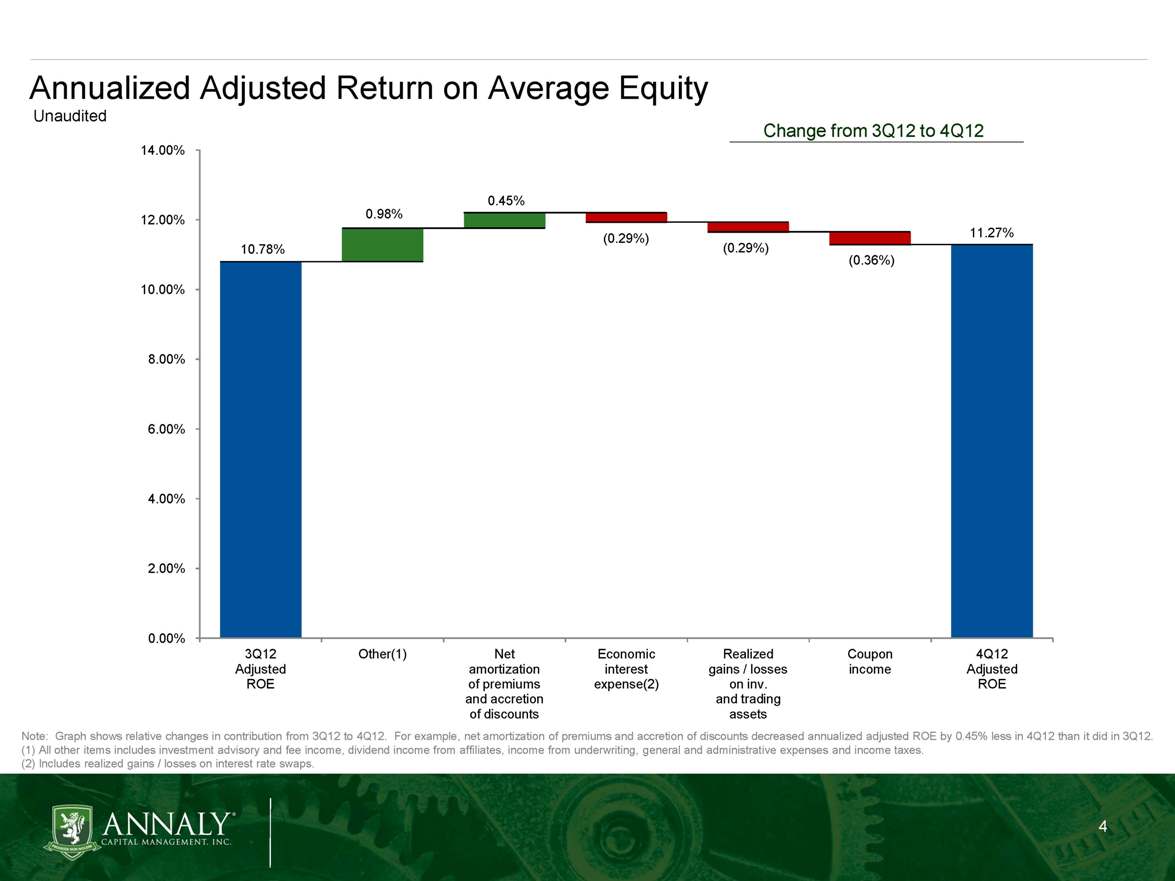
Annualized Adjusted Return on Average Equity Unaudited Change from 3Q12 to 4Q12 0.00% 2.00% 4.00% 6.00% 8.00% 10.00% 12.00% 14.00% 0.98% 0.45% (0.29%) (0.29%) (0.36%) 11.27% 3Q12 Adjusted ROE Other(1) Net amortization of premiums and accretion of discounts Economic interest expense(2) Realized gains / losses on inv. and trading assets Coupon income 4Q12 Adjusted ROE Note: Graph shows relative changes in contribution from 3Q12 to 4Q12. For example, net amortization of premiums and accretion of discounts decreased annualized adjusted ROE by 0.45% less in Q412 than it did in Q312. (1) All other items includes investment advisory and fee income, dividend income from affiliates, income from underwriting, general and administrative expenses and income taxes. (2) Includes realized gains / losses on interest rate swaps.
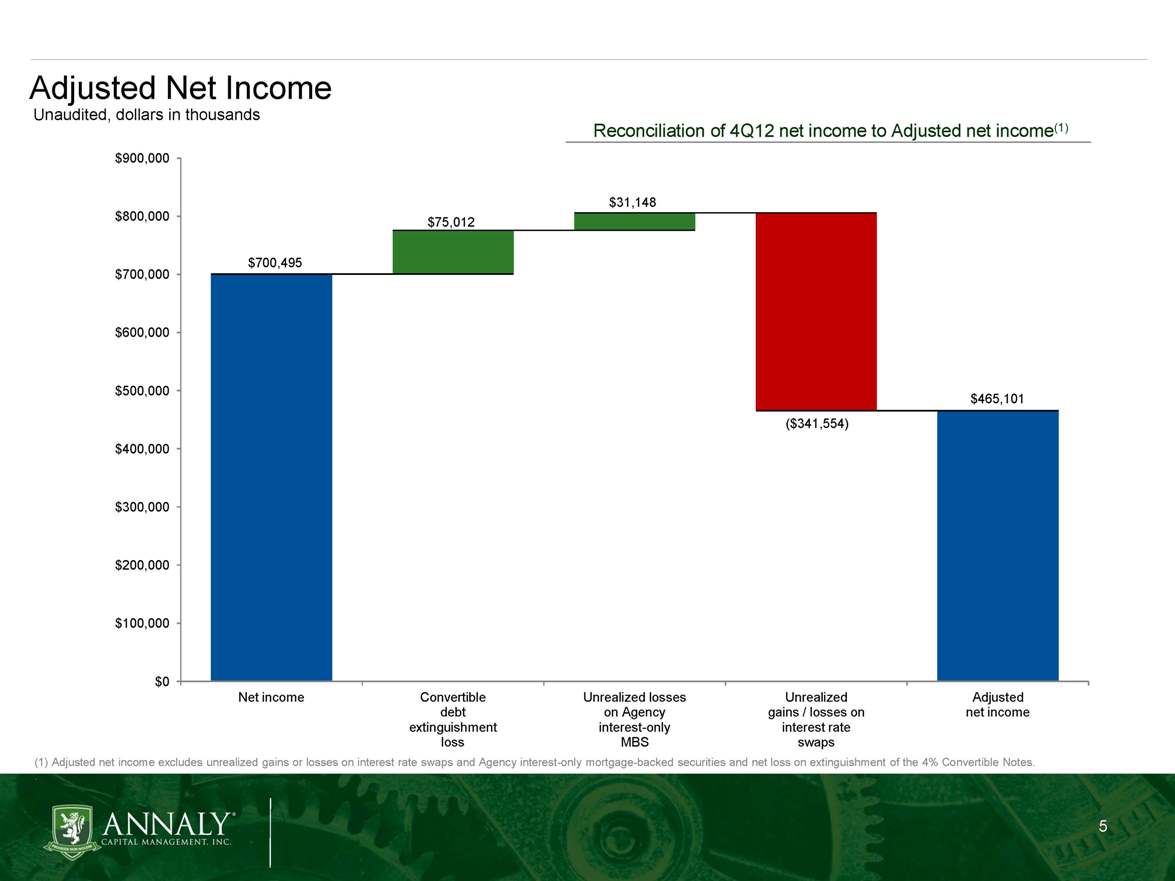
$465,101 $75,012 $31,148 ($341,554) $700,495 $0 $100,000 $200,000 $300,000 $400,000 $500,000 $600,000 $700,000 $800,000 $900,000 Net income Convertible debt extinguishment loss Unrealized losses on Agency interest-only MBS Unrealized gains / losses on interest rate swaps Adjusted net income Adjusted Reconciliation of 4Q12 net income to Adjusted net income(1) (1) Adjusted net income excludes unrealized gains or losses on interest rate swaps and Agency interest-only mortgage-backed securities and net loss on extinguishment of the 4% Convertible Notes.
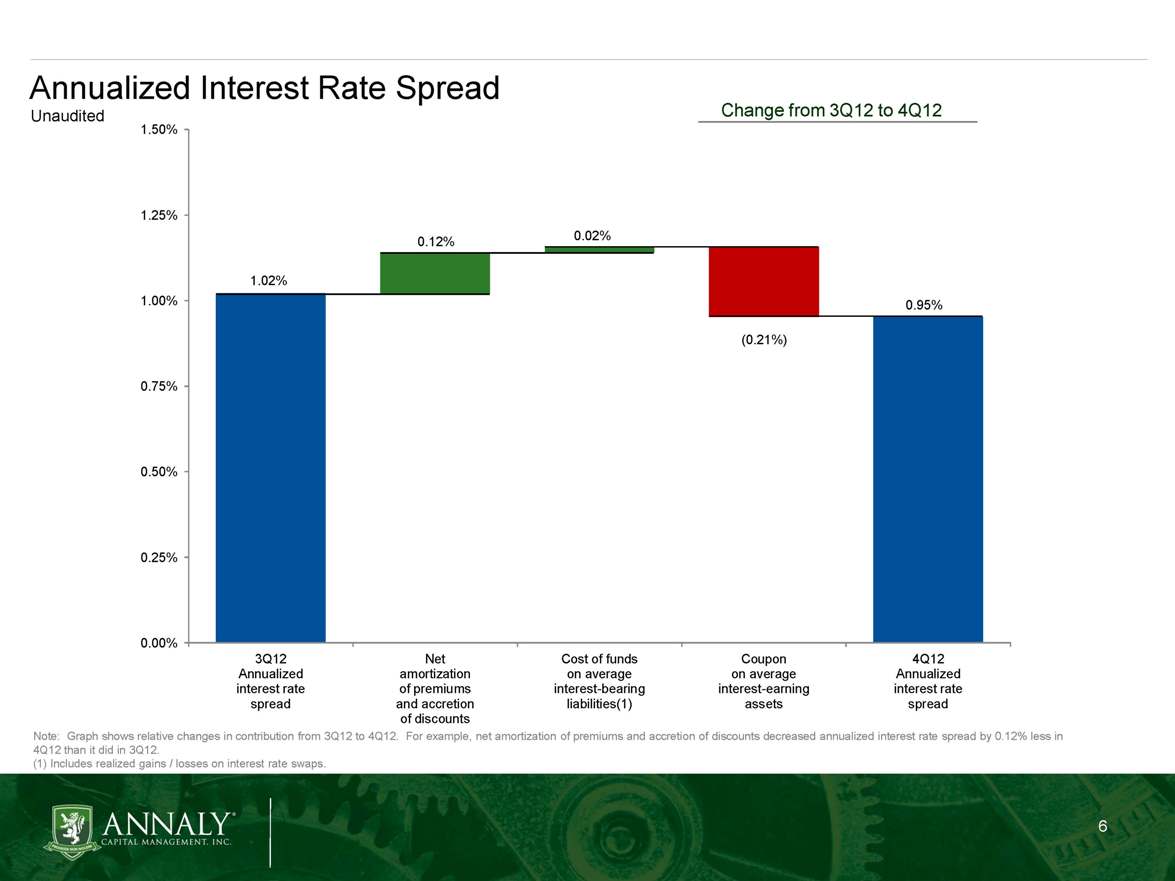
0.12% 0.00% 0.25% 0.50% 0.75% 1.00% 1.25% 1.50% 3Q12 Annualized interest rate spread Net amortization of premiums and accretion of discounts Cost of funds on average interest-bearing liabilities(1) Coupon on average interest-earning assets 4Q12 Annualized interest rate spread 1.02% 0.02% (0.21%) 0.95% Annualized Interest Rate Spread Unaudited Change from 3Q12 to 4Q12 Note: Graph shows relative changes in contribution from 3Q12 to 4Q12. For example, net amortization of premiums and accretion of discounts decreased annualized interest rate spread by 0.12% less in Q412 than it did in Q312. (1) Includes realized gains / losses on interest rate swaps.
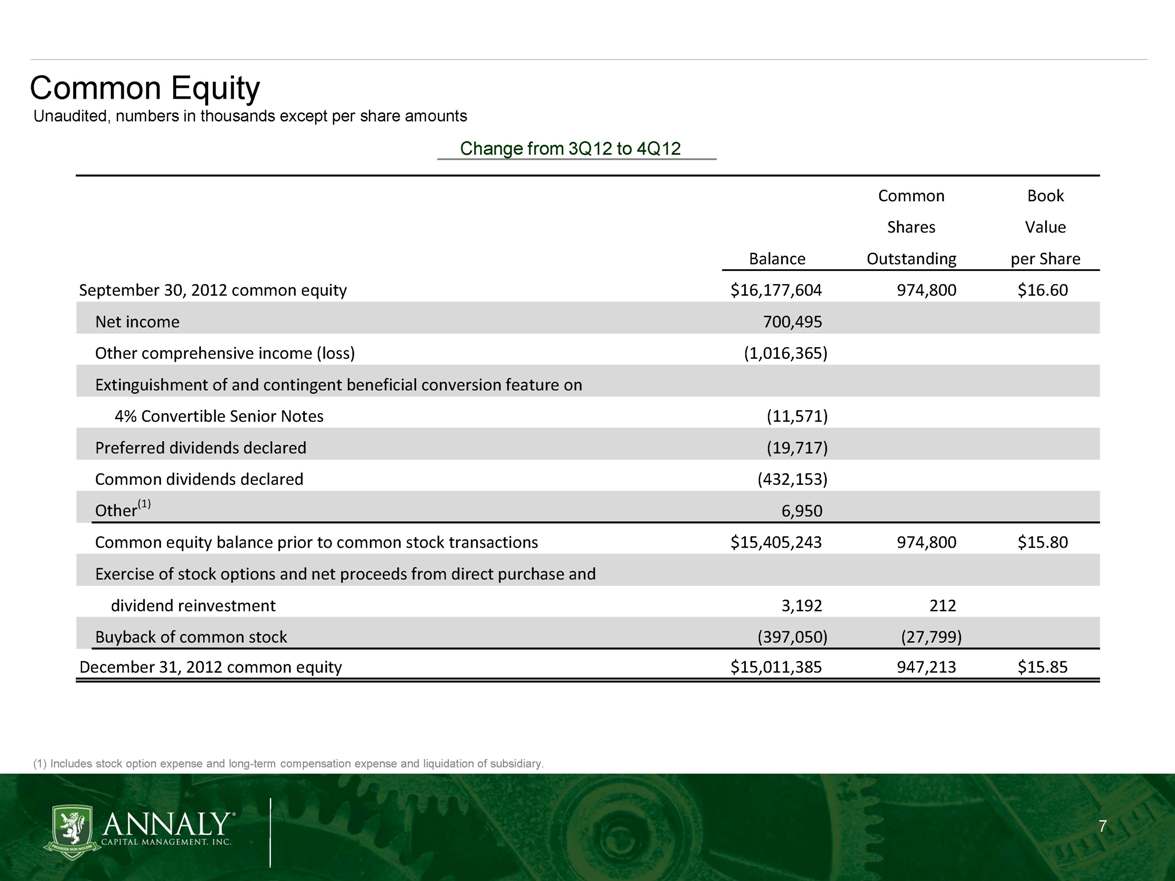
Common Equity Change from 3Q12 to 4Q12 (1) Includes stock option expense and long-term compensation expense and liquidation of subsidiary. Unaudited, numbers in thousands except per share amounts CommonBookSharesValueBalanceOutstandingper ShareSeptember 30, 2012 common equity$16,177,604974,800$16.60Net income700,495Other comprehensive income (loss)(1,016,365)Extinguishment of and contingent beneficial conversion feature on 4% Convertible Senior Notes(11,571)Preferred dividends declared(19,717)Common dividends declared(432,153)Other(1)6,950Common equity balance prior to common stock transactions$15,405,243974,800$15.80Exercise of stock options and net proceeds from direct purchase anddividend reinvestment3,192212Buyback of common stock(397,050)(27,799)December 31, 2012 common equity$15,011,385947,213$15.85
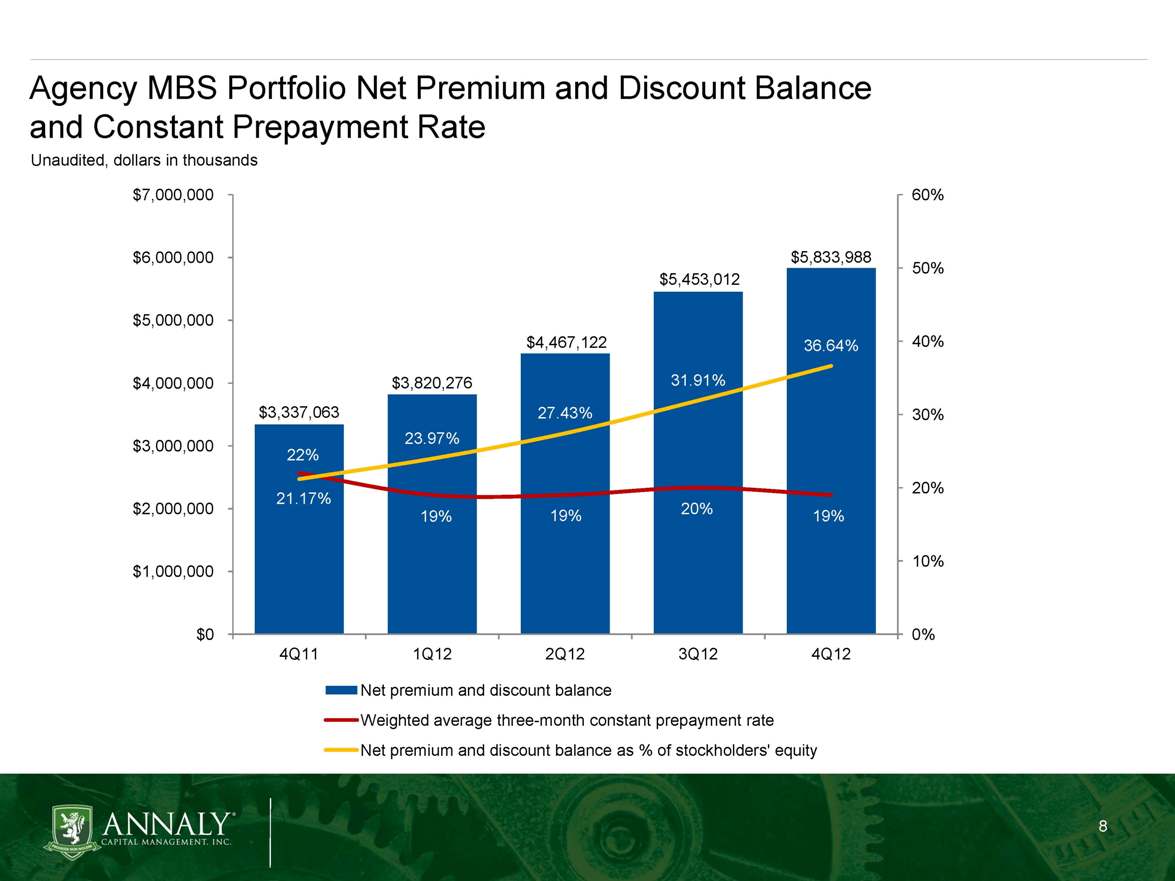
Agency MBS Portfolio Net Premium and Discount Balance and Constant Prepayment Rate Unaudited, dollars in thousands $3,337,063 $3,820,276 $4,467,122 $5,453,012 $5,833,988 22% 19% 19% 20% 19% 21.17% 23.97% 27.43% 31.91% 36.64% 0% 10% 20% 30% 40% 50% 60% $0 $1,000,000 $2,000,000 $3,000,000 $4,000,000 $5,000,000 $6,000,000 $7,000,000 4Q11 1Q12 2Q12 3Q12 4Q12 Net premium and discount balance Weighted average three-month constant prepayment rate Net premium and discount balance as % of stockholder's equity
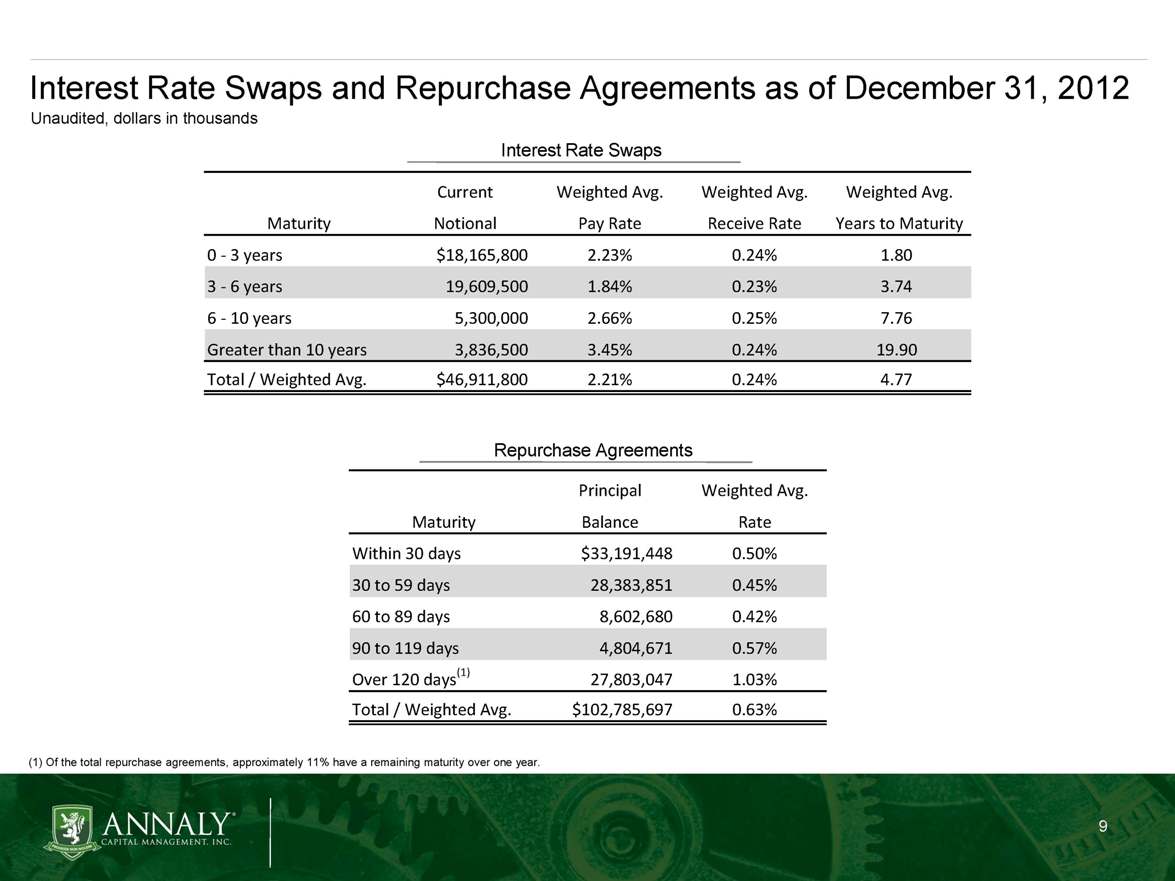
Interest Rate Swaps and Repurchase Agreements as of December 31, 2012 (1) Of the total repurchase agreements, approximately 11% have a remaining maturity over one year. Unaudited, dollars in thousands Interest Rate Swaps Repurchase Agreements CurrentWeighted Avg.Weighted Avg.Weighted Avg.MaturityNotionalPay RateReceive RateYears to Maturity0 - 3 years$18,165,8002.23%0.24%1.803 - 6 years19,609,5001.84%0.23%3.746 - 10 years5,300,0002.66%0.25%7.76Greater than 10 years3,836,5003.45%0.24%19.90Total / Weighted Avg.$46,911,8002.21%0.24%4.77PrincipalWeighted Avg.MaturityBalanceRateWithin 30 day$33,191,4480.50%30 to 59 days28,383,8510.45%60 to 89 days8,602,6800.42%90 to 119 days4,804,6710.57%Over 120 days(1)27,803,0471.03%Total / Weighted Avg.$102,785,6970.63%
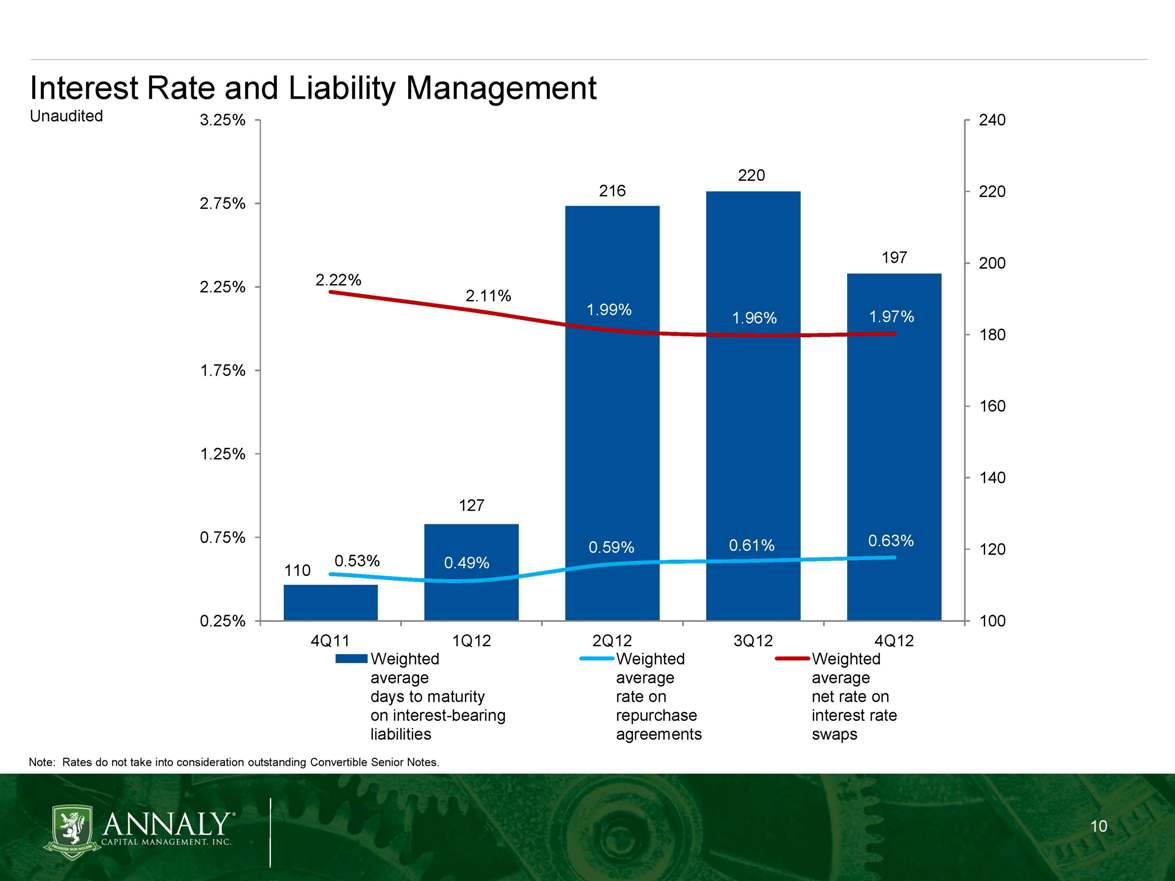
Interest Rate and Liability Management Unaudited 110 127 216 220 197 0.53% 0.49% 0.59% 0.61% 0.63% 2.22% 2.11% 1.99% 1.96% 1.97% 100 120 140 160 180 200 220 240 0.25% 0.75% 1.25% 1.75% 2.25% 2.75% 3.25% 4Q11 1Q12 2Q12 3Q12 4Q12 Weighted average days to maturity on interest-bearing liabilities Weighted average rate on repurchase agreements Weighted average net rate on interest rate swaps Note: Rates do not take into consideration $825.5 million of outstanding Convertible Senior Notes.
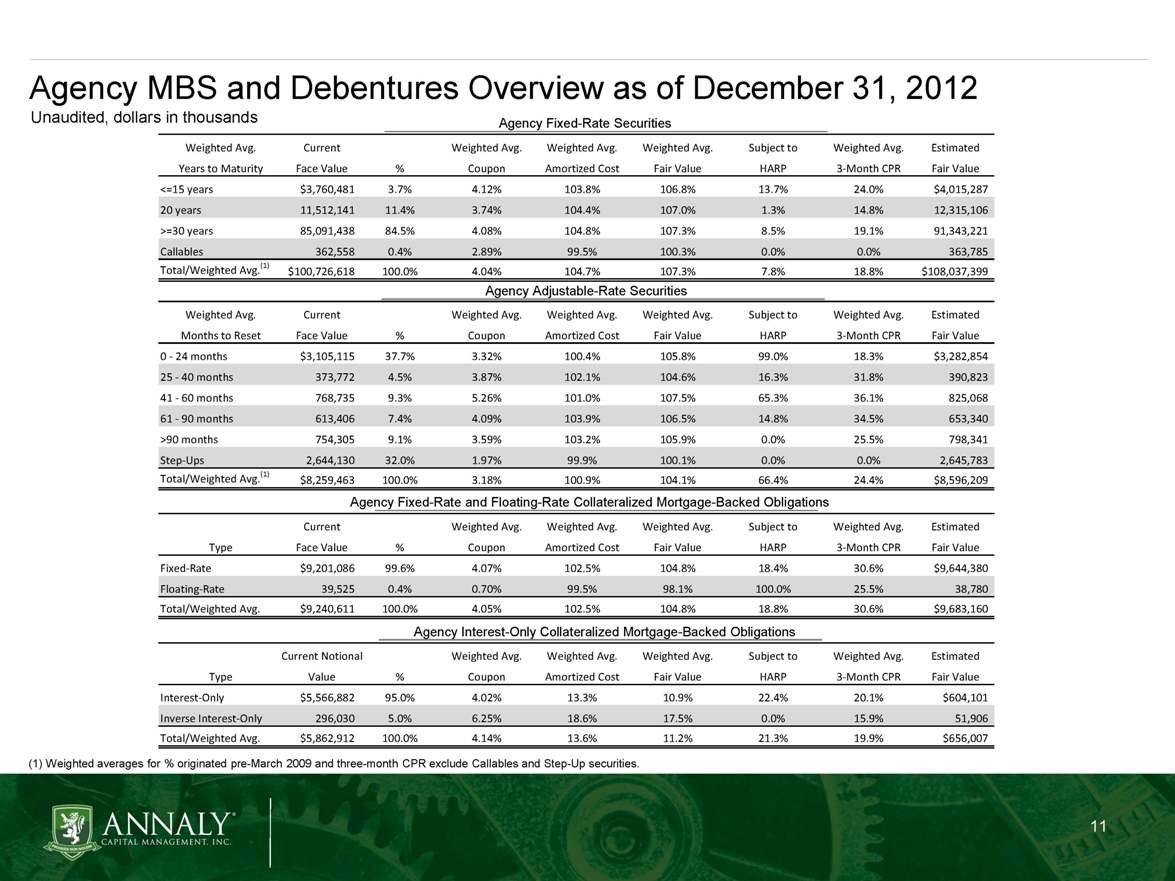
Agency MBS and Debentures Overview as of December 31, 2012 Unaudited, dollars in thousands Agency Fixed-Rate Securities Agency Adjustable-Rate Securities Agency Fixed-Rate and Floating-Rate Collateralized Mortgage-Backed Obligations (1) Weighted averages for % originated pre-March 2009 and three-month CPR exclude Callables and Step-Up securities. Agency Interest-Only Collateralized Mortgage-Backed Obligations Weighted Avg.CurrentWeighted Avg.Weighted Avg.Weighted Avg.% OriginatedWeighted Avg.EstimatedYears to MaturityFace Value%CouponAmortized CostFair ValuePre-March 20093-Month CPRFair Value<=15 years$3,760,4813.7%4.12%103.8%106.8%13.1%24.0%$4,015,28720 years11,512,14111.4%3.74%104.4%107.0%1.3%14.8%12,315,106>=30 years85,091,43884.5%4.08%104.8%107.3%7.9%19.1%91,343,221Callables362,5580.4%2.89%99.5%100.3%0.0%0.0%363,785Total/Weighted Avg.(1)$100,726,618100.0%4.04%104.7%107.3%7.3%18.8%$108,037,399############4.04%10469.0%10726.0%7.3%############Weighted Avg.CurrentWeighted Avg.Weighted Avg.Weighted Avg.% OriginatedWeighted Avg.EstimatedMonths to ResetFace Value%CouponAmortized CostFair ValuePre-March 20093-Month CPRFair Value0 - 24 months$3,105,11837.7%3.32%100.4%105.8%99.0%18.3%$3,282,86025 - 40 months373,7724.5%3.87%102.1%104.6%16.3%31.8%390,82441 - 60 months768,7329.3%5.26%101.0%107.5%65.3%36.1%825,06161 - 90 months613,4067.4%4.09%103.9%106.5%14.8%34.5%653,340>90 months754,3059.1%3.59%103.2%105.9%0.0%25.5%798,341Step-Ups2,644,13032.0%1.97%99.9%100.1%0.0%0.0%2,645,783Total/Weighted Avg.(1)$8,259,463100.0%3.18%100.9%104.1%66.4%24.4%$8,596,209Current FaceWeighted Avg.Weighted Avg.Weighted Avg.% OriginatedWeighted Avg.EstimatedTypeValue%CouponAmortized CostFair ValuePre-March 20093-Month CPRFair ValueFixed$9,201,08699.6%4.07%102.5%104.8%18.4%30.6%$9,644,380Floating39,5250.4%0.70%99.5%98.1%100.0%25.5%38,780Total/Weighted Avg.$9,240,611100.0%4.05%102.5%104.8%18.8%30.6%$9,683,160Current NotionalWeighted Avg.Weighted Avg.Weighted Avg.% OriginatedWeighted Avg.EstimatedTypeValue%CouponAmortized CostFair ValuePre-March 20093-Month CPRFair ValueInterest-Only$5,566,88295.0%4.02%13.3%10.9%21.5%20.1%$604,101Inverse Interest-Only296,0305.0%6.25%18.6%17.5%0.0%15.9%51,906Total/Weighted Avg.$5,862,912100.0%4.14%13.6%11.2%20.4%19.9%$656,007
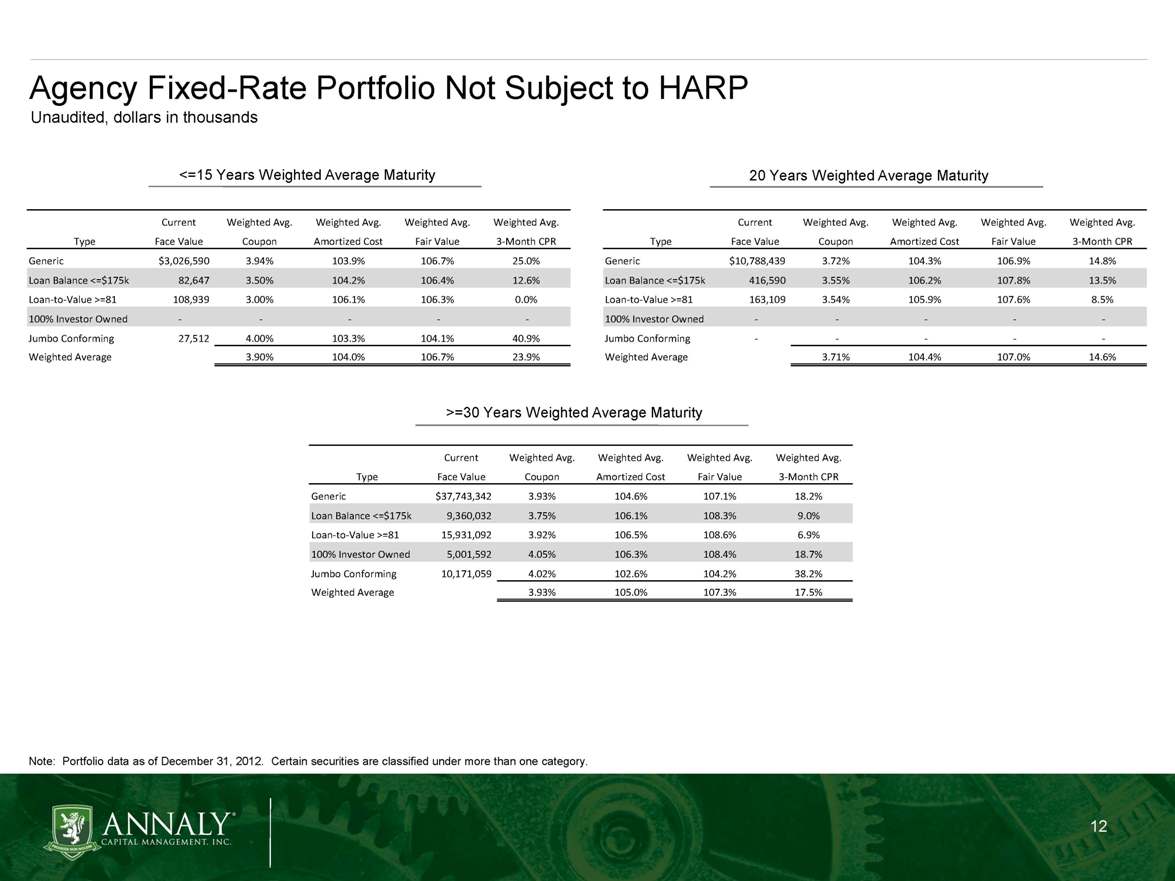
Agency Fixed-Rate Portfolio Originated Post-March 2009 Unaudited, dollars in thousands Note: Portfolio data as of December 31, 2012. Certain securities are classified under more than one category. <=15 Years Weighted Average Maturity 20 Years Weighted Average Maturity >=30 Years Weighted Average Maturity CurrentWeighted Avg.Weighted Avg.Weighted Avg.Weighted Avg.TypeFace ValueCouponAmortized CostFair Value3-Month CPRGeneric$3,046,9623.94%103.9%106.7%25.0%Loan Balance <=$175k82,6473.50%104.2%106.4%12.6%Loan-to-Value >=81108,9393.00%106.1%106.3%0.0%100% Investor Owned - - - - -Jumbo Conforming27,5124.00%103.3%104.1%40.9%Weighted Average3.90%104.0%106.7%24.0%CurrentWeighted Avg.Weighted Avg.Weighted Avg.Weighted Avg.TypeFace ValueCouponAmortized CostFair Value3-Month CPRGeneric$10,788,4393.72%104.3%106.9%14.8%Loan Balance <=$175k416,5903.55%106.2%107.8%13.5%Loan-to-Value >=81163,1093.54%105.9%107.6%8.5%100% Investor Owned - - - - -Jumbo Conforming - - - - -Weighted Average3.71%104.4%107.0%14.6%CurrentWeighted Avg.Weighted Avg.Weighted Avg.Weighted Avg.TypeFace ValueCouponAmortized CostFair Value3-Month CPRGeneric$37,954,4653.93%104.6%107.1%18.3%Loan Balance <=$175k9,658,5563.78%106.1%108.3%9.5%Loan-to-Value >=8115,931,0923.92%106.5%108.6%6.9%100% Investor Owned5,001,5924.05%106.3%108.4%18.7%Jumbo Conforming10,172,5124.02%102.6%104.2%38.3%Weighted Average3.93%105.0%107.3%17.5%
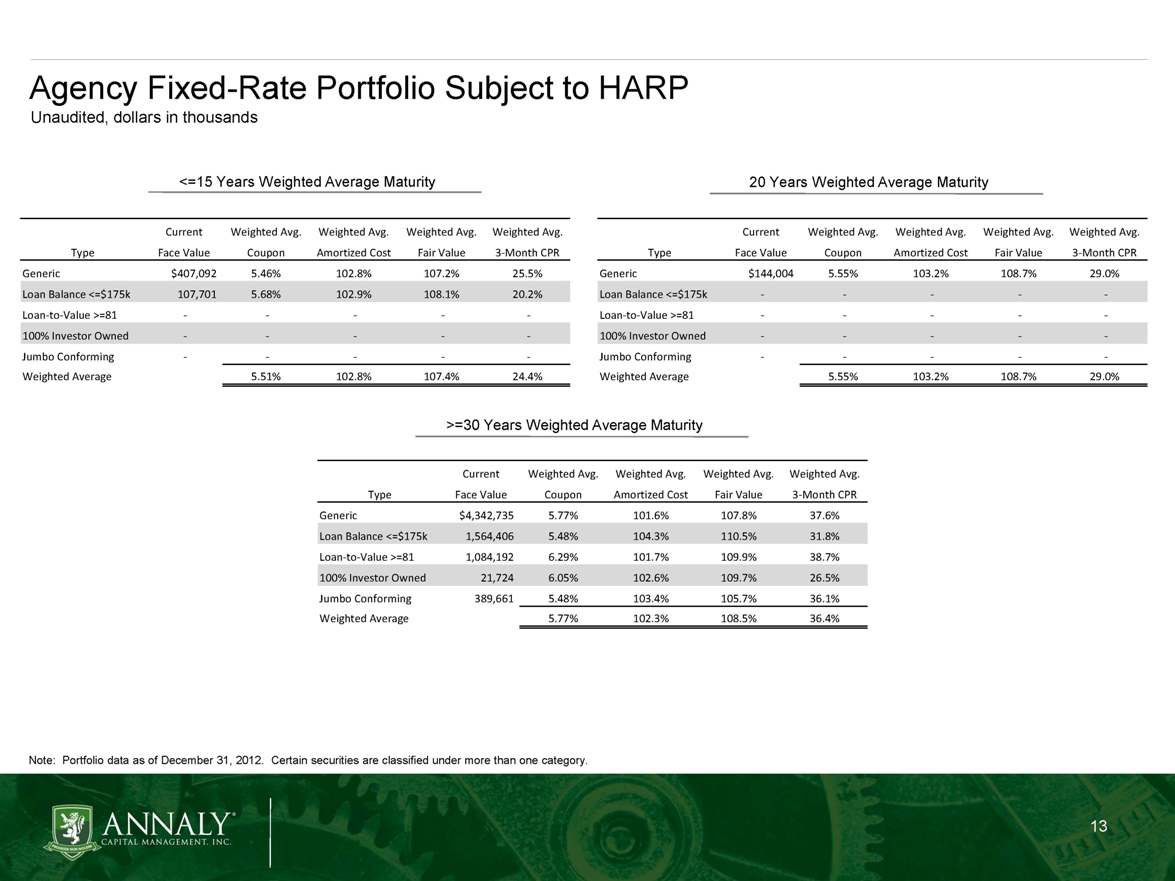
Agency Fixed-Rate Portfolio Originated Pre-March 2009 Unaudited, dollars in thousands <=15 Years Weighted Average Maturity 20 Years Weighted Average Maturity >=30 Years Weighted Average Maturity Note: Portfolio data as of December 31, 2012. Certain securities are classified under more than one category. CurrentWeighted Avg.Weighted Avg.Weighted Avg.Weighted Avg.TypeFace ValueCouponAmortized CostFair Value3-Month CPRGeneric$386,7205.54%102.8%107.2%25.3%Loan Balance <=$175k107,7015.68%102.9%108.1%20.2%Loan-to-Value >=81 - - - - -100% Investor Owned - - - - -Jumbo Conforming - - - - -Weighted Average5.57%102.8%107.4%24.2%CurrentWeighted Avg.Weighted Avg.Weighted Avg.Weighted Avg.TypeFace ValueCouponAmortized CostFair Value3-Month CPRGeneric$144,0045.55%103.2%108.7%29.0%Loan Balance <=$175k - - - - -Loan-to-Value >=81 - - - - -100% Investor Owned - - - - -Jumbo Conforming - - - - -Weighted Average5.55%103.2%108.7%29.0%CurrentWeighted Avg.Weighted Avg.Weighted Avg.Weighted Avg.TypeFace ValueCouponAmortized CostFair Value3-Month CPRGeneric$4,131,6135.83%101.5%107.8%37.7%Loan Balance <=$175k1,265,8835.71%104.0%110.7%32.7%Loan-to-Value >=811,084,1926.29%101.7%109.9%38.7%100% Investor Owned21,7246.05%102.6%109.7%26.5%Jumbo Conforming388,2085.48%103.4%105.7%35.9%Weighted Average5.86%102.1%108.5%36.8%
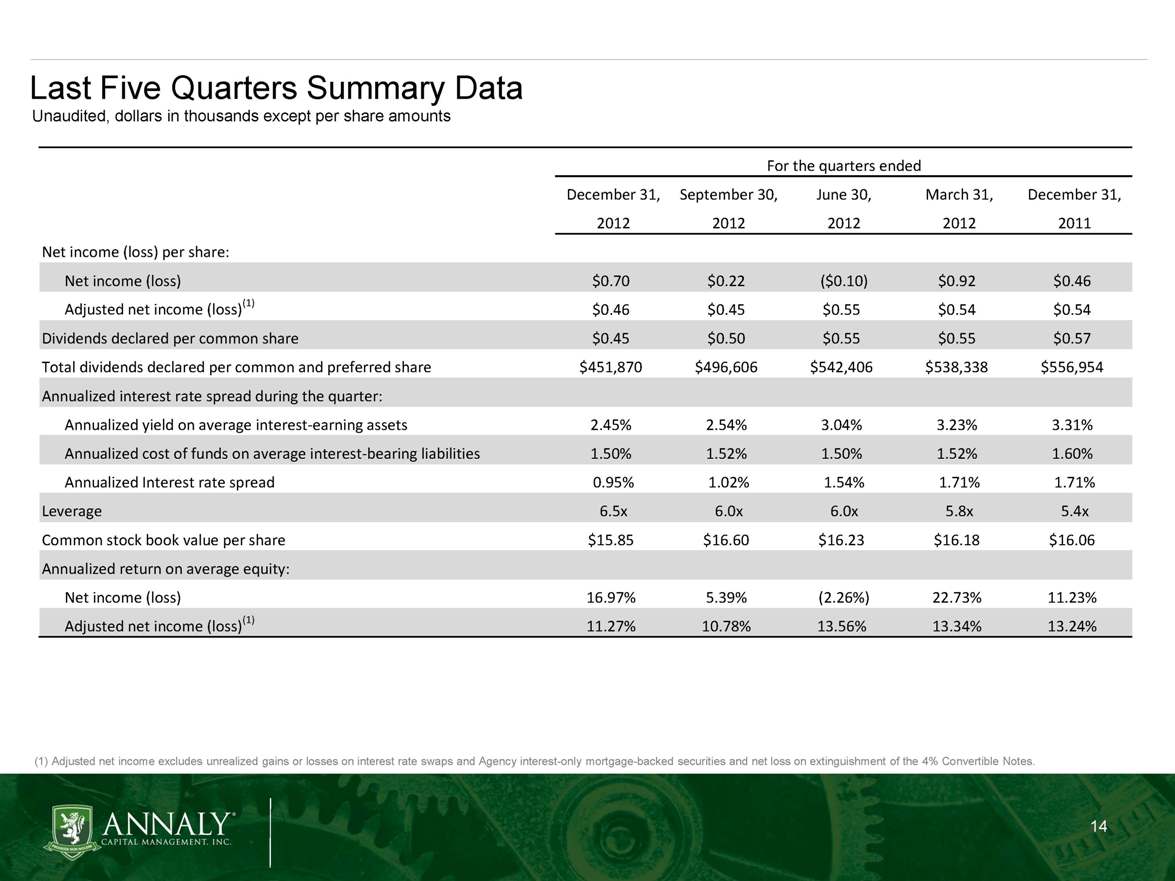
Last Five Quarters Summary Data Unaudited, dollars in thousands except per share amounts (1) Adjusted net income excludes unrealized gains or losses on interest rate swaps and Agency interest-only mortgage-backed securities and net loss on extinguishment of the 4% Convertible Notes. December 31,September 30,June 30,March 31,December 31,20122012201220122011Net income (loss) per share:Net income (loss)$0.70$0.22($0.10)$0.92$0.46Adjusted net income (loss)(1)$0.46$0.45$0.55$0.54$0.54Dividends declared per common share$0.45$0.50$0.55$0.55$0.57Total dividends paid per common and preferred share$506,954$545,265$540,909$556,744$585,900Annualized interest rate spread during the quarter:Annualized yield on average interest-earning assets2.45%2.54%3.04%3.23%3.31%Annualized cost of funds on average interest-bearing liabilities1.50%1.52%1.50%1.52%1.60%Annualized Interest rate spread0.95%1.02%1.54%1.71%1.71%Leverage6.5x6.0x6.0x5.8x5.4xCommon stock book value per share$15.85$16.60$16.23$16.18$16.06Annualized return on average equity:Net income (loss)16.97%5.39%(2.26%)22.73%11.23%Adjusted net income (loss)(1)11.27%10.78%13.56%13.34%13.24%For the quarters ended
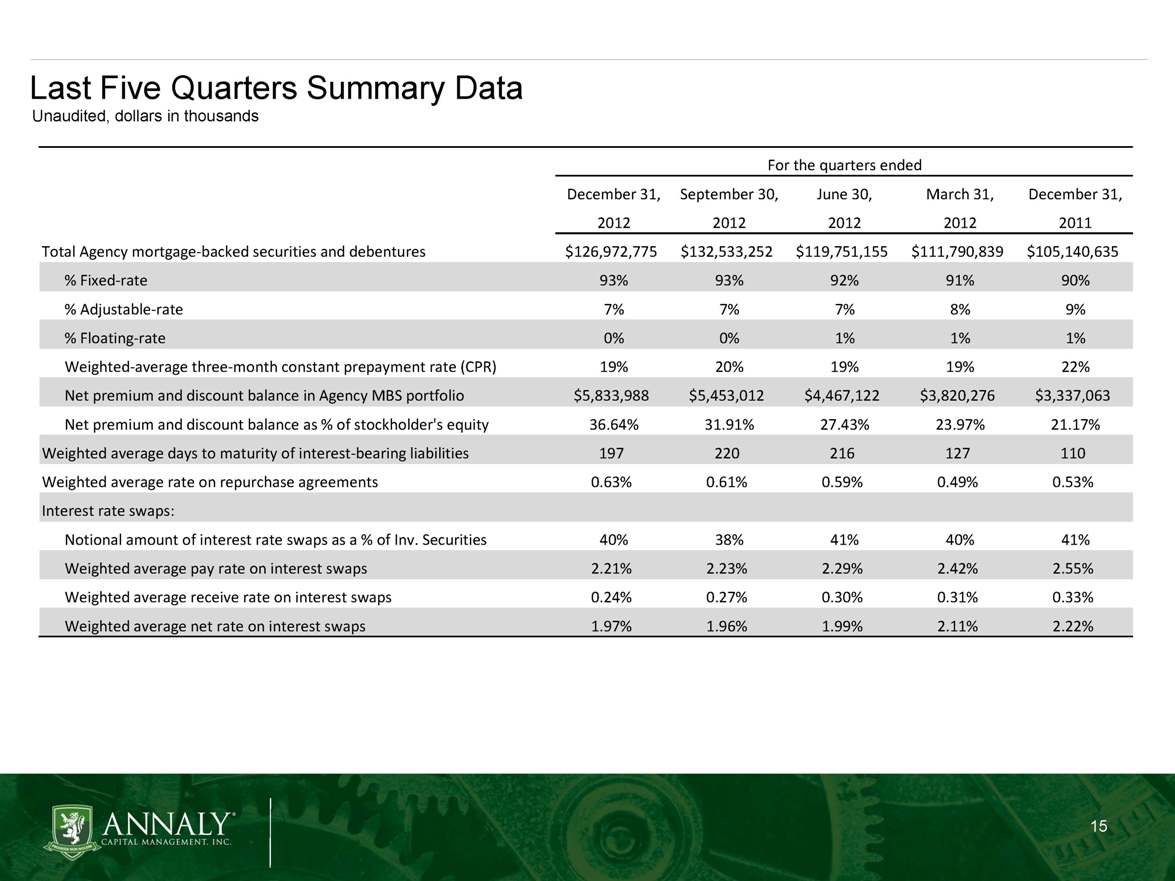
Last Five Quarters Summary Data Unaudited, dollars in thousands December 31,September 30,June 30,March 31,December 31,20122012201220122011Total Agency mortgage-backed securities and debentures$126,972,775$132,533,252$119,751,155$111,790,839$105,140,635% Fixed-rate93%93%92%91%90%% Adjustable-rate7%7%7%8%9%% Floating-rate0%0%1%1%1%Weighted-average three-month constant prepayment rate (CPR)19%20%19%19%22%Net premium and discount balance in Agency MBS portfolio$5,833,988$5,453,012$4,467,122$3,820,276$3,337,063Net premium and discount balance as % of stockholder's equity36.64%31.91%27.43%23.97%21.17%Weighted average days to maturity of interest-bearing liabilities197220216127110Weighted average rate on repurchase agreements0.63%0.61%0.59%0.49%0.53%Interest rate swaps:Notional amount of interest rate swaps as a % of Inv. Securities40%38%41%40%41%Weighted average pay rate on interest swaps2.21%2.23%2.29%2.42%2.55%Weighted average receive rate on interest swaps0.24%0.27%0.30%0.31%0.33%Weighted average net rate on interest swaps1.97%1.96%1.99%2.11%2.22%For the quarters ended