Attached files
| file | filename |
|---|---|
| 8-K - FORM 8-K - Symetra Financial CORP | d477623d8k.htm |
 February 5, 2013
Fourth Quarter 2012 Review
and 2013 Outlook
Exhibit 99.1 |
 Forward-Looking Statements
›
the
effects
of
fluctuations
in
interest
rates
and
a
prolonged
low
interest
rate
environment;
›
general economic, market or business conditions, including further economic
downturns or other adverse conditions in the global and domestic capital and
credit markets; ›
the effects of changes in monetary and fiscal policy;
›
the
effects
of
changes
in
government
programs
to
stimulate
mortgage
refinancing
and
significant
increases
in
corporate
refinance
activity;
›
the performance of our investment portfolio;
›
the
continued
availability
of
quality
commercial
mortgage
loan
investments
and
our
continued
capacity
to
invest
in
commercial
mortgage
loans;
›
our ability to successfully execute on our strategies;
›
recorded reserves for future policy benefits and claims subsequently proving to be
inadequate or inaccurate; ›
deviations
from
assumptions
used
in
setting
prices
for
insurance
and
annuity
products
or
establishing
cash
flow
testing
reserves;
›
continued viability of certain products under various economic, regulatory and
other conditions; ›
market pricing and competitive trends related to insurance products and
services; ›
changes
in
amortization
of
deferred
policy
acquisition
costs
and
deferred
sales
inducements;
›
financial strength or credit ratings changes;
›
the availability and cost of capital and financing;
›
the continued availability and cost of reinsurance coverage;
›
changes in laws or regulations, or their interpretation, including those which
could increase Symetra's business costs, reserve levels and required capital
levels; ›
the ability of subsidiaries to pay dividends to Symetra;
›
the effects of implementation of the Patient Protection and Affordable Care
Act; ›
our ability to implement effective and sufficient risk management policies and
procedures, including hedging strategies; ›
the initiation of legal or regulatory investigations against us and the results of
any legal or regulatory proceedings; ›
the effects of implementation of the Dodd-Frank Wall Street Reform and Consumer
Protection Act of 2010; and ›
the
risks
that
are
described
from
time
to
time
in
Symetra's
filings
with
the
Securities
and
Exchange
Commission,
including
those
in
Symetra's
2011
Annual Report on Form 10-K and 2012 Quarterly Reports on Form 10-Q.
2
Statements made in the following presentation that relate to anticipated financial performance or
business operations, business services and product prospects and plans, reinvestment
opportunities, changes in the amount of cash flow testing reserves, regulatory developments,
accounting standard changes and similar matters may be considered “forward-looking
statements” within the meaning of Section 27A of the Securities Act of 1933 and Section
21E of the Securities Exchange Act of 1934. All statements, other than statements of current or historical
facts, are forward-looking statements. Forward-looking statements are subject to a number of
risks, uncertainties and contingencies that may cause the operations, performance, development
and results of our business to differ materially from those suggested by such statements.
Consequently, all of the forward-looking statements made in this presentation are qualified by these cautionary statements. The
information contained in this presentation speaks as of February 5, 2013. Symetra undertakes no
obligation to update any such forward- looking statements, whether as a result of new
information, future events or otherwise. Historical results are not necessarily indicative of
future results. Future results, including our financial performance, business operations and trends in
our business and industry, are subject to significant risks and uncertainties, including
without limitation the following: |
 2012: Year in Review
3
›
Improved capabilities across the company
›
Benefits –
built out Group Life & Disability Income (DI) business
›
Retirement –
expanded bank channel distribution for Edge Pro Fixed Indexed
Annuity; built True Variable Annuity (VA) product
›
Individual Life –
enhanced product and distribution capabilities
›
But missed on sales targets for new products (True VA, Classic Universal Life (UL),
Group Life & DI)
›
Solid performance in core business lines
›
Medical stop-loss: strong sales, loss ratio consistent with
long-term target range ›
Deferred fixed annuities: sales down (consistent with industry trend), but
maintained strong relationships with bank distribution partners; held
interest spreads stable despite challenging interest rate environment
›
Maintained underwriting and pricing discipline
We’re well positioned to leverage the investments made in 2012
and drive improved sales results in 2013 |
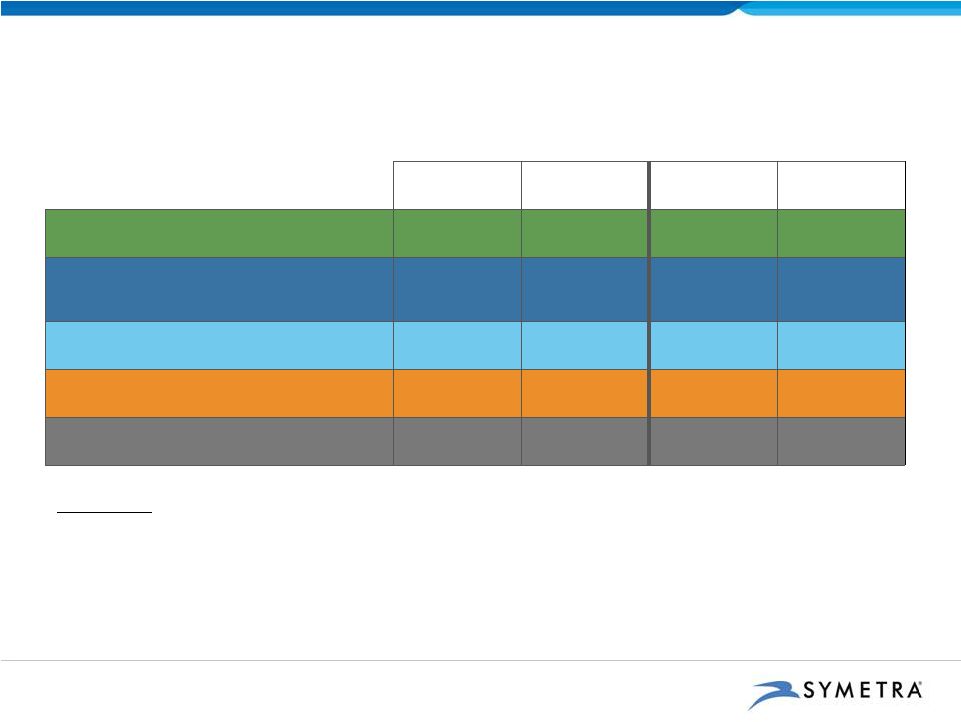
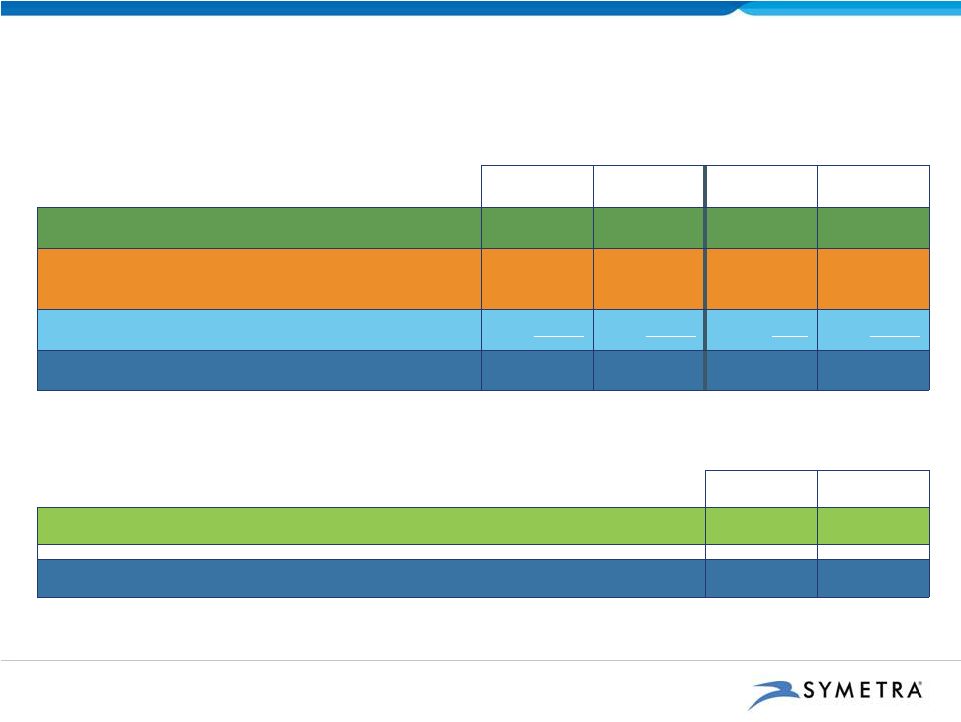 Financial Results
4
Twelve Months
Ended Dec. 31
2012
2011
Return on Equity (ROE)
6.1%
7.2%
Operating Return on Average Equity (ROAE)
8.5%
9.5%
4Q12
4Q11
2012
2011
Net Income
$ 31.0
$ 73.7
$ 205.4
$ 195.8
Less: Net realized investment gains
(losses)
1
(2.6)
22.2
20.2
4.7
Add: Net realized gains (losses) –
FIA
1, 2
(0.7)
(0.4)
0.1
(0.9)
Adjusted Operating Income
3
$ 32.9
$ 51.1
$ 185.3
$ 190.2
Historical financial information has been restated to reflect retrospective
adoption of a new accounting standard for deferred acquisition costs on Jan. 1, 2012.
1
Net of taxes.
Fixed indexed annuity.
A non-GAAP financial measure. See Appendix for a definition of
this measure and a reconciliation to the most directly comparable GAAP
measure. $ in millions
2
3
3 |
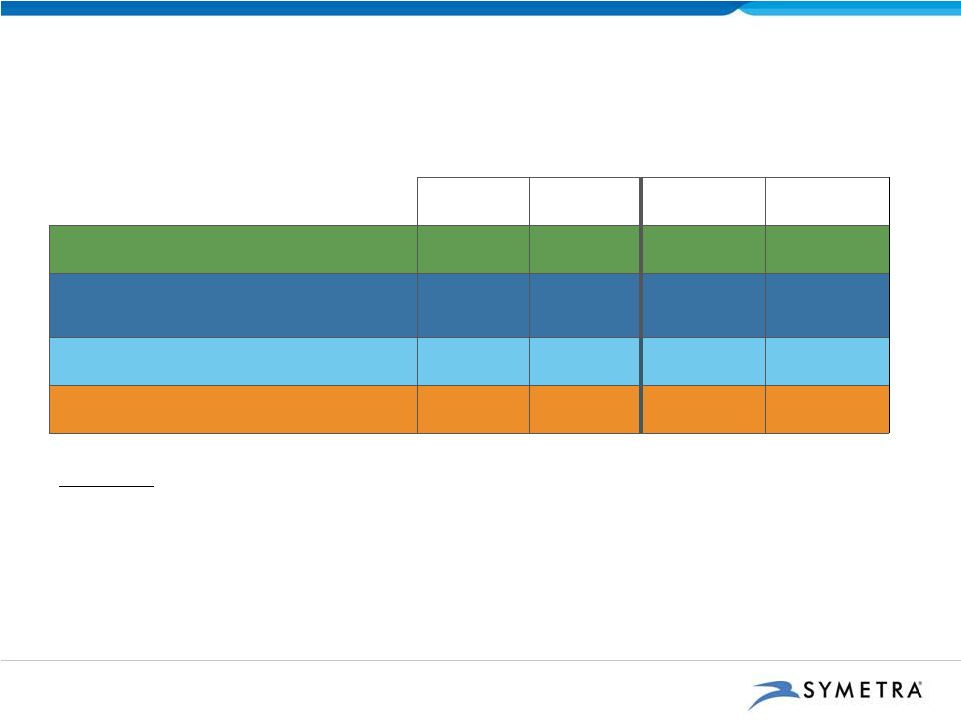 5
Benefits Segment
29% of 2012 Pretax Adjusted Operating Income
1
Priorities:
›
Maintain leadership position in medical stop-loss market, while achieving loss
ratio
in
line
with
long-term
target
range
of
63%
-
65%
›
Drive growth in group life & DI premium
$ in millions
1
Total pretax adjusted operating income includes Other segment loss. A
non-GAAP financial measure. See Appendix for a definition of this
measure and a reconciliation to the most directly comparable GAAP measure.
2
Total revenue excluding net realized investment gains (losses).
4Q12
4Q11
2012
2011
Operating
Revenues
$ 153.7
$ 148.7
$ 601.6
$ 533.3
Pretax Adjusted Operating
Income
$ 12.4
$ 24.2
$ 70.5
$ 79.1
Loss Ratio
67.7%
59.6%
65.1%
63.1%
Total Sales
$ 25.7
$ 26.5
$ 159.3
$ 118.7
2 |
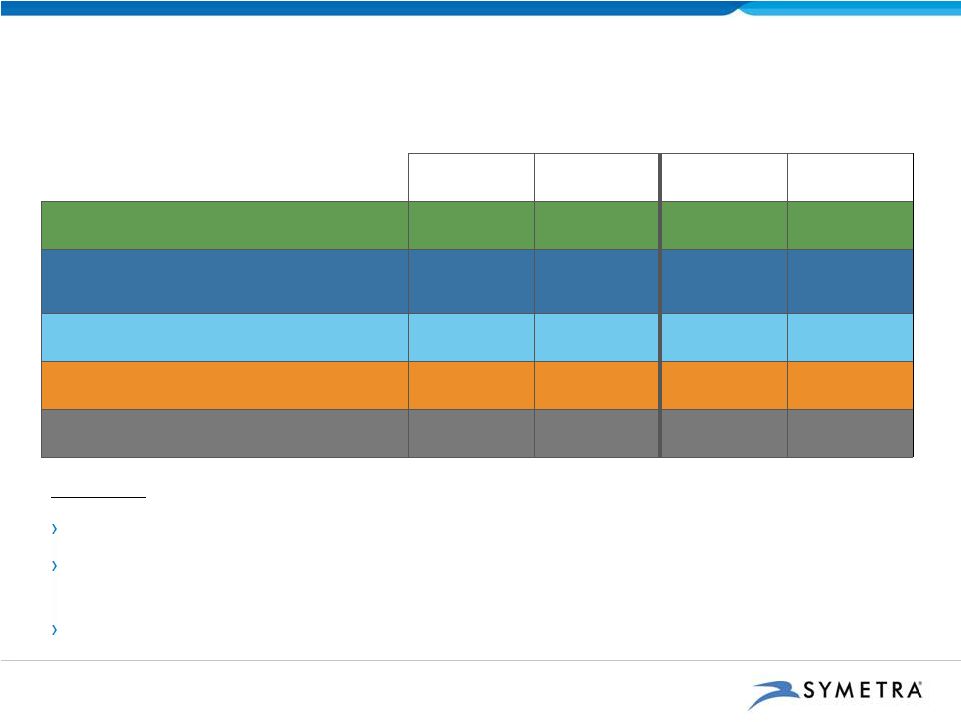 Deferred Annuities Segment
43% of 2012 Pretax Adjusted Operating Income
1
Priorities:
Maintain solid interest spread on fixed annuities
Maintain sales of fixed annuities and expand sales of fixed indexed annuities (FIA)
through banks and broker-dealers
Continue to enhance FIA and VA product line up
$ in millions
1
Total pretax adjusted operating income includes Other segment loss. A
non-GAAP financial measure. See Appendix for
a
definition
of
this
measure
and
a
reconciliation
to
the
most
directly
comparable
GAAP
measure.
2
Total
revenue
excluding
net
realized
investment
gains
(losses)
and
including
net
realized
gains
(losses)
–
FIA.
3
Excludes
impact
of
asset prepayments, mortgage-backed securities prepayment speed adjustments and
deferred sales inducement unlocking. 4Q12
4Q11
2012
2011
Operating
Revenues
2
$ 146.4
$ 147.5
$ 568.0
$ 546.5
Pretax Adjusted Operating
Income
$ 29.1
$ 27.5
$ 102.7
$ 95.8
Base
Interest
Spread
3
1.78%
1.81%
1.83%
1.82%
Total Sales
$ 300.8
$ 356.8
$ 1,146.6
$ 1,815.3
Ending Account Values
$11,786.7
$11,326.9
6 |
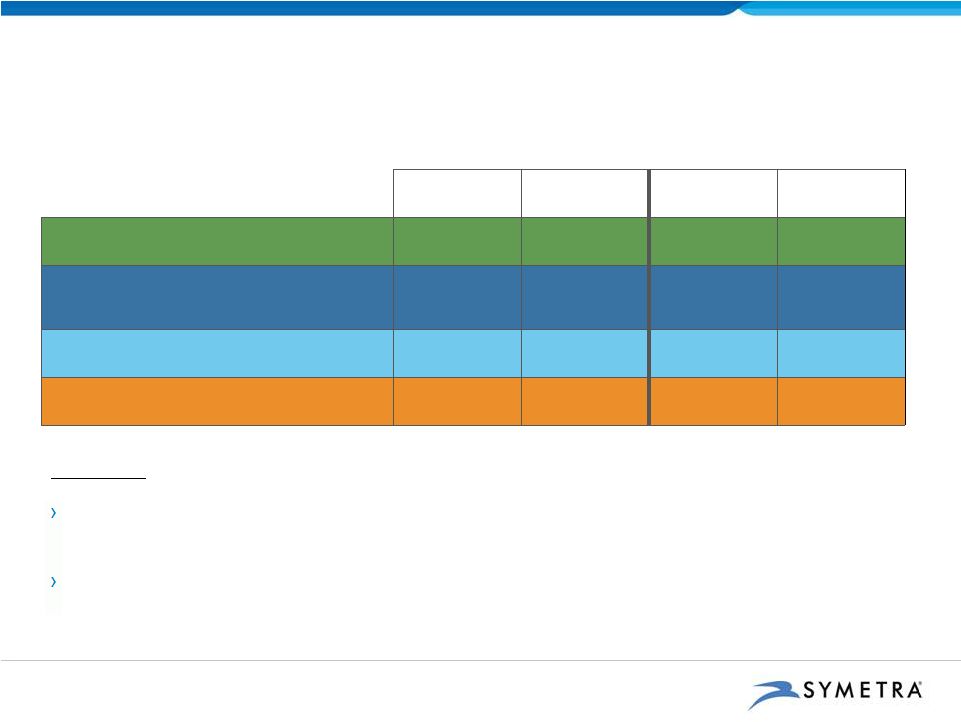 Income Annuities Segment
19% of 2012 Pretax Adjusted Operating Income
1
Priorities:
Continue
to
stabilize
the
profitability
of
existing
block
in
low
interest
rate
environment with commercial mortgage loan origination strategy
Focus sales effort on shorter duration retail opportunities (structured settlement
sales discontinued in 4Q12)
4Q12
4Q11
2012
2011
Operating
Revenues
$ 102.3
$ 104.5
$ 416.7
$ 414.9
Pretax Adjusted Operating
Income
$ 5.1
$ 6.5
$ 45.0
$ 35.1
Base
Interest
Spread
0.45%
0.53%
0.51%
0.50%
Total Sales
$ 57.6
$ 54.1
$ 258.2
$ 221.9
7
1
Total pretax adjusted operating income includes Other segment loss. A
non-GAAP financial measure. See Appendix for a definition of this
measure and a reconciliation to the most directly comparable GAAP measure.
2
Total revenue excluding net realized investment gains (losses).
3
Excludes impact of asset prepayments and mortgage-backed securities prepayment
speed adjustments. $ in millions
3
2 |
 Individual Life Segment
20%
of
2012
Pretax
Adjusted
Operating
Income
1
Priorities:
›
Drive sales of Classic UL and Classic UL with Lapse Protection Benefit rider
›
Drive sales of variable COLI (corporate-owned life insurance) product
4Q12
4Q11
2012
2011
Operating
Revenues
2
$ 110.8
$ 116.7
$ 450.2
$ 452.0
Pretax Adjusted Operating
Income
$ 5.5
$ 18.1
$ 47.0
$ 65.3
BOLI Base ROA
3
0.66%
0.98%
0.88%
0.98%
Individual Sales
$ 1.3
$ 3.1
$ 9.1
$ 11.7
BOLI / COLI Sales
$ --
$ --
$ 2.0
$ --
8
1
Total pretax adjusted operating income includes Other segment loss. A non-GAAP
financial measure. See Appendix for
a
definition
of
this
measure
and
a
reconciliation
to
the
most
directly
comparable
GAAP
measure.
2
Total
revenue
excluding
net
realized
investment
gains
(losses)
.
3
Excludes
impact
of
asset
prepayments,
mortgage-backed
securities
prepayment speed adjustments and deferred sales inducement unlocking.
$ in millions |
 9
Estimated
2013
Operating
EPS
1
range:
$1.30-$1.50
1
Denotes
a
non-GAAP
financial
measure
also
referred
to
as
“adjusted
operating
income
per
common
share
–
diluted.”
See Appendix for definition.
Operating EPS Guidance for 2013
Year-over-year sales growth for new product lines
Expenses flat relative to full year 2012 Low
interest rate environment, holding rates at current levels through 2013
Benefits loss ratio at higher end of long-term target range (63%-65%)
Continued abundance of attractively priced commercial mortgage loans
Mortality experience in line with historical experience (~ neutral) Continued favorable effective tax rate
Assumptions for 2013: |
 Prolonged Path to ROE Improvement
›
Challenging interest rate environment lengthens our path
›
Steps we’re taking to drive improvement, over time:
›
Profitable growth
›
Accretive acquisitions
›
Share repurchases, dividends
10 |
 2013: Leveraging Investments Made in 2012
›
Focus on driving sales results, while maintaining our discipline
›
Solid sales expected in 2013 for core business lines:
›
Medical stop-loss
›
Fixed deferred annuities
›
Year-over-year growth expected in 2013 for newer products:
›
Group life & DI
›
Fixed indexed annuities
›
True VA
›
Classic UL
›
Variable COLI
11 |
 Appendix
12 |
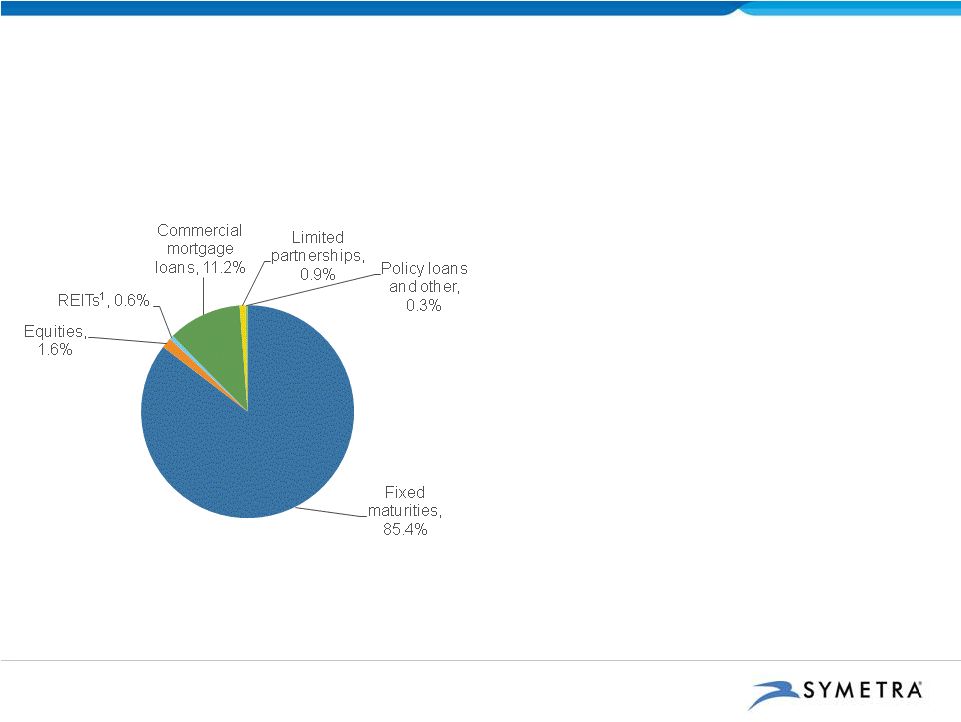 $27.6 billion
Portfolio Composition
As of 12/31/12
13
High-Quality Investment Portfolio
1
Included in trading marketable equity securities.
2
From
inception
of
Symetra
equity
portfolio
in
January
2005
and
Symetra
REIT
portfolio
in
April
2011.
3
FTSE NAREIT All Equity REITs Index.
›
Pretax impairments of $3.8M in 4Q12 vs $5.5M in 4Q11
›
AOCI of $1,371.2M at 12/31/12 vs $1,027.3M at 12/31/11
›
RMBS of $3.0B
›
Gross premium of $53.4M
›
Gross discount of $62.3M
›
Average mortgage loan rate of 5.2%
›
Outstanding long-term equity portfolio performance:
Life-to-date annualized total return of 9.5% (vs
4.2% for S&P 500 Total Return Index)
›
Life-to-date annualized total return for REITs of
9.2% vs benchmark
total return of 9.4%
›
European exposure of $1.6B
›
$0.7M of sovereign
›
$191.1M of financials
›
Largest holding = $125.0M of Deutsche Telekom
›
Commercial mortgage loans offer attractive yields:
4Q12 originations funded at 313 bps spread over
Treasury securities
2
3
2 |
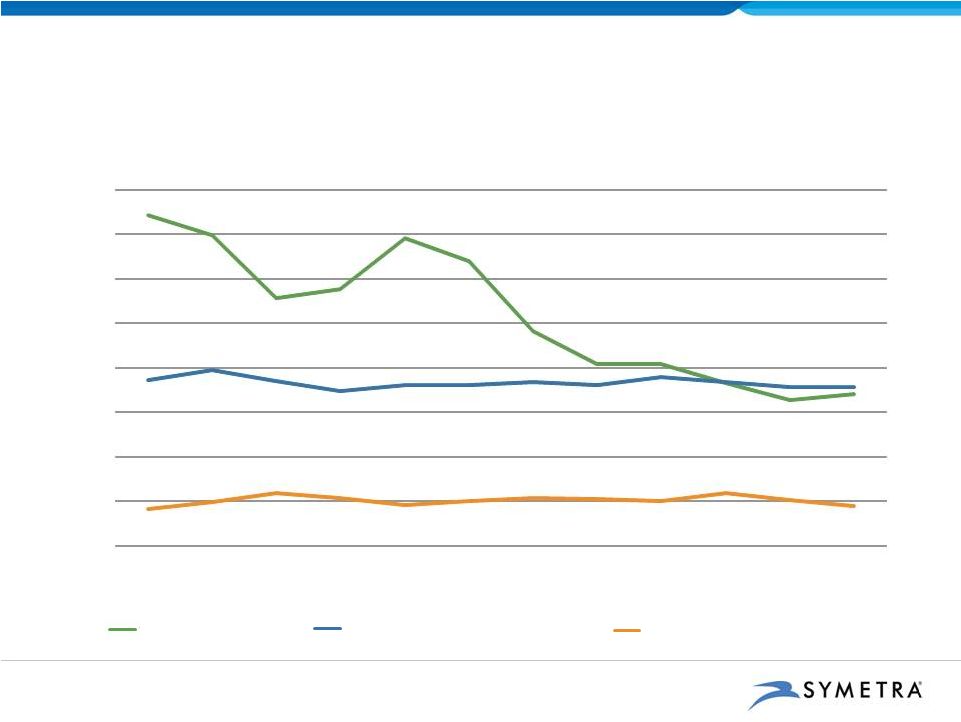 (Percent)
14
Effective Asset-Liability Management
-
0.50
1.00
1.50
2.00
2.50
3.00
3.50
4.00
1Q10
2Q10
3Q10
4Q10
1Q11
2Q11
3Q11
4Q11
1Q12
2Q12
3Q12
4Q12
10-Yr Treasury Rate
Deferred Annuities -
Base Spread
Income Annuities -
Base Spread
Holding annuity interest spreads stable in a challenging rate environment
|
 15
›
Reinvestment risk is relatively small due to:
›
Effective ALM program (matching asset and liability cash flows)
›
Flexibility from rate resetting capabilities (except in Income Annuities
segment) ›
Attractive investment opportunity in commercial mortgage loan originations
›
Our estimates could be affected by changes in monetary policy, government programs
to stimulate mortgage refinancing and significant increases in corporate
refinance activity Estimated Amount of
Reinvestment
(2013 –
2015)
Risk Management Tools
Surplus
~ $250 / year
CML
Deferred Annuity
< $50 / year
Rate resets
Income Annuity
< $50 / year
CML
BOLI
~ $400 / year
CML, rate resets,
other product levers
Prolonged Low Interest Rate Environment
Minimal Reinvestment Risk
$ in millions |
 Reconciliation of Non-GAAP Measures
16
Three Months
Ended Dec. 31
Twelve Months
Ended Dec. 31
2012
2011
2012
2011
Net income
$ 31.0
$ 73.7
$ 205.4
$ 195.8
Less: Net realized investment gains (losses) (net of taxes)
(2.6)
22.2
20.2
4.7
Add:
Net
realized
gains
(losses)
–
FIA
(net
of
taxes)
(0.7)
(0.4)
0.1
(0.9)
Adjusted operating income
1
$ 32.9
$ 51.1
$ 185.3
$ 190.2
Twelve Months
Ended Dec. 31
2012
2011
Return on equity (ROE)
6.1%
7.2%
Net income
$ 205.4
$ 195.8
Average book value
3,383.9
2,710.2
Operating
return
on
average
equity
(ROAE)
1
8.5%
9.5%
Adjusted operating income
1
$ 185.3
$ 190.2
Average adjusted book value
1
2,185.7
2,002.4
1
Denotes a non-GAAP measure. See slide 18 for definition.
$ in millions |
 Reconciliation of Non-GAAP Measures (cont.)
17
Three Months
Ended Dec. 31
Twelve Months
Ended Dec. 31
2012
2011
2012
2011
Segment pretax adjusted operating income (loss):
Benefits
$ 12.4
$ 24.2
$ 70.5
$ 79.1
Deferred Annuities
29.1
27.5
102.7
95.8
Income Annuities
5.1
6.5
45.0
35.1
Individual Life
5.5
18.1
47.0
65.3
Other
(5.3)
(5.2)
(26.1)
(10.7)
Pretax adjusted operating income
1
46.8
71.1
239.1
264.6
Add:
Net
realized
investment
gains
(losses)
–
excluding
FIA
(2.9)
34.8
31.0
8.6
Income from operations before income taxes
$ 43.9
$ 105.9
$ 270.1
$ 273.2
$ in millions
1
Denotes a non-GAAP measure. See slide 18 for definition.
|
 Non-GAAP Measures
18
Adjusted Operating Income and Pre-tax Operating Income
Adjusted operating income consists of net income, less after-tax net realized
investment gains (losses), plus after-tax
net
investment
gains
(losses)
on
FIA.
Net
income
is
the
most
directly
comparable
GAAP
measure
to
adjusted operating income.
Pre-tax
adjusted
operating
income
is
adjusted
operating
income
on
a
pre-tax
basis.
It
also
represents the
cumulative total of segment pre-tax adjusted operating income, which at the
segment level is a GAAP measure. Income from operations before income taxes
is the most directly comparable GAAP measure to pre-tax adjusted
operating income. Pre-tax adjusted operating income excludes pre-tax net
realized investment gains (losses), except pre-tax net realized
investment gains (losses) on FIA. Adjusted Operating Income per Common Share
– Diluted, or Operating EPS
Adjusted
operating
income
per
common
share
—
diluted
consists
of
adjusted
operating
income
divided
by
the
GAAP-basis
weighted
average
diluted
shares
outstanding.
Net
income
per
common
share
—
diluted
is
the
most directly comparable GAAP measures.
Adjusted Book Value
Adjusted
book
value
consists
of
stockholders’
equity,
less
AOCI.
Stockholders’
equity
is
the
most
directly
comparable GAAP measure to adjusted book value. AOCI, which is primarily composed
of the net unrealized gains (losses)
on
our
fixed
maturities,
net
of
taxes,
is
a
component
of
stockholders’
equity.
Operating Return on Average Equity, or Operating ROAE
Operating return on average equity, or operating ROAE, consists of adjusted
operating income for the most recent four quarters, divided by average
adjusted book value, both of which are non-GAAP measures as described
above. We measure average adjusted book value by averaging adjusted book value for
the most recent five quarters. Return on stockholders’
equity, or ROE, is the most directly comparable GAAP measure. Return on
stockholders’
equity for the most recent four quarters is calculated as net income for such
period divided by the average stockholders’
equity for the most recent five quarters. |
 Symetra®
and
the
Symetra
logo
are
registered
service
marks
of
Symetra
Life
Insurance
Company,
777
108
th
Ave
NE,
Suite
1200,
Bellevue,
WA
98004. |