Attached files
| file | filename |
|---|---|
| 8-K - 8-K - MICRON TECHNOLOGY INC | a13-4300_28k.htm |
Exhibit 99.1
|
|
February 5, 2013 Presentation Highlights February 5, 2013 ©2013 Micron Technology, Inc. All rights reserved. Products are warranted only to meet Micron’s production data sheet specifications. Information, products, and/or specifications are subject to change without notice. All information is provided on an “AS IS” basis without warranties of any kind. Dates are estimates only. Drawings are not to scale. Micron and the Micron logo are trademarks of Micron Technology, Inc. All other trademarks are the property of their respective owners. |
|
|
Cautionary Statement In this presentation, we may make projections or other forward-looking statements regarding future events, including whether and when the Elpida transactions will be completed and the results of the Elpida transactions, or the future financial performance and trends of the Company and the industry, including expected increases in wafer capacity, growth opportunities in our targeted markets, expected bit growth and expected reductions in memory cost. We wish to caution you that such statements are predictions and that actual events or results may differ materially. We refer you to the documents the Company files on a consolidated basis from time to time with Securities and Exchange Commission, specifically the Company’s most recent Form 10-K, Form 10-Q and Form 8-K filed on February 5, 2013. These documents contain and identify important factors that could cause the actual results for the Company on a consolidated basis to differ materially from those contained in our projections or forward-looking statements. These certain factors can be found at http://investors.micron.com/riskfactors.cfm. Although we believe that the expectations reflected in the forward-looking statements are reasonable, we cannot guarantee future results, levels of activity, performance or achievements. The statements herein speak only as of their date. We are under no duty to update any of the forward-looking statements after the date of the presentation to conform these statements to actual results. February 5, 2013 |
|
|
Financial Overview Ron Foster Chief Financial Officer February 5, 2013 |

|
|
Elpida Performance Update January to September 2012 was a transition period for Elpida Filed for bankruptcy in February Filed reorganization plan in late August with Tokyo court with Micron as sponsor Since the signing of the Sponsor Agreement with Micron in July, Elpida’s key business drivers have been: Product mix shift to mobile driven by strong customer demand for mobile Improving PC DRAM prices 25nm ramp to provide reduced cost Weakening Yen improving cost competitiveness February 5, 2013 |
|
|
Income Statement (USD’M) Fiscal Quarter ended Micron Nov 29, 2012 Elpida Sep 30, 2012 Pro Forma Adj. Pro Forma Combined Net Sales $1,834 $794 ($9) $2,619 COGS 1,617 777 (196) 2,198 Gross Margin 217 17 187 421 % Margin 12% 2% 16% Operating Expenses (374) (157) 10 (521) % of Revenue 20% 20% 20% Operating Income (loss) (157) (140) 197 (100) % Margin -9% -18% -4% Non-Operating Expenses (53) (7) (27) (87) Profit before Tax (210) (147) 170 (187) Income Tax (13) (4) (17) Income (Loss) from Equity Method Investments (52) 2 4 (46) Net (Income) Loss Attributable to noncontrolling interests - 7 (10) (3) Net Income (Loss) Attributable to Parent Entity (275) (142) 164 (253) % Margin -15% -18% -10% Micron + Elpida Pro Forma Quarterly Income Statement February 5, 2013 |
|
|
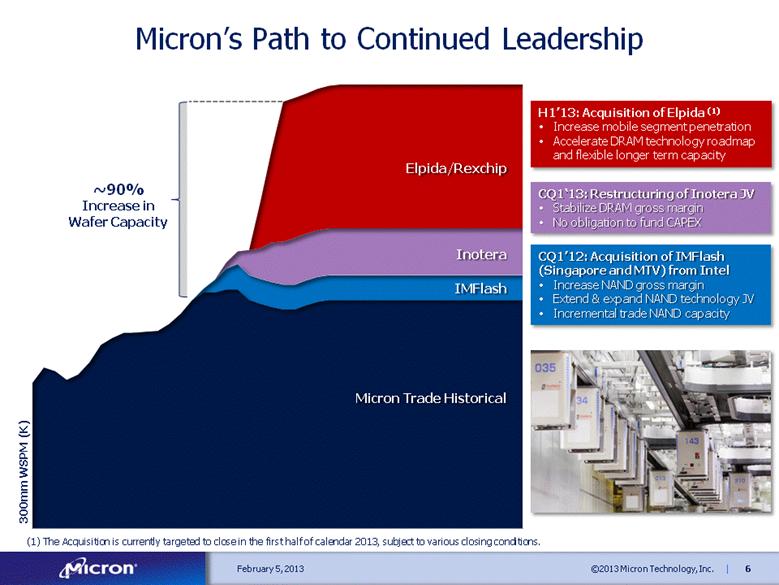
Micron’s Path to Continued Leadership February 5, 2013 CQ1’12: Acquisition of IMFlash (Singapore and MTV) from Intel Increase NAND gross margin Extend & expand NAND technology JV Incremental trade NAND capacity CQ1‘13: Restructuring of Inotera JV Stabilize DRAM gross margin No obligation to fund CAPEX H1’13: Acquisition of Elpida (1) Increase mobile segment penetration Accelerate DRAM technology roadmap and flexible longer term capacity Micron Trade Historical IMFlash Inotera Elpida/Rexchip 300mm WSPM (K) ~90% Increase in Wafer Capacity (1) The Acquisition is currently targeted to close in the first half of calendar 2013, subject to various closing conditions. |
|
|
Strategy Overview Mark Durcan Chief Executive Officer February 5, 2013 |
|
|
Business Highlights Large multi-market opportunities in semiconductor memory with significant growth drivers Largest global pure play memory company (post Elpida transaction) Diversified across memory technologies and end markets; focused on high growth, high margin segments Financial strength to invest through cycles; flexible investment model Broad and deep technology capabilities to capitalize on industry move toward memory system solutions February 5, 2013 |
|
|
Memory Markets Continue to Grow February 5, 2013 Forecast NOR TAM NAND TAM DRAM TAM MEMORY TAM Sources: Gartner (4Q12) |
|
|
Automotive Server Mobile Personal Computing Industrial Multimarket Storage Graphics / Consumer Networks Diversified Memory End Markets February 5, 2013 |
|
|
Source: Micron * LTM is FQ2-12 through FQ1-13; AIMM is Auto, Industrial, Medical and Military Micron End Market and Technology Diversification February 5, 2013 SSD Other AIMM Networking & Storage Server Consumer Mobile Personal Systems End Applications NOR Other NAND DRAM Memory Technology NAND Overtaking DRAM End Market Diversification February 5, 2013 |
|
|
SSD and Mobile Driving NAND Bit Growth February 5, 2013 Source: Micron, Gartner 4Q12; Cards included in Mobile and DSC 2012 – 2016 NAND Bit CAGR 40% 73% 13% 32% 27% 38% 71% 39% Tablets SSD PMP/MP3 USB DSC/Video Mobile PC/Com (Non-SSD) Embedded, AIMM End Applications |
|
|
Shift to Mobility Driving DRAM Bit Growth February 5, 2013 2012 – 2016 DRAM Bit CAGR 33% 28% 44% 46% 23% AIMM Tablet Consumer Mobile Server/ Storage PC/Computing End Applications 67% Source: Micron, Gartner 4Q12; AIMM is Auto, Industrial, Medical and Military |
|
|
February 5, 2013 PC/NB Server & Storage Networking Mobile Consumer Enablers OS Expanding Customer Landscape + + + + + + + |
|
|
Memory Technology Roadmap February 5, 2013 Memory Cost Scaling Over Time Today Physical and Electrical Materials Limitations Equipment Capability Cost and Complexity Historical ~30% YoY Reductions Historical ~40% YoY Reductions Hybrid Memory Cube - DRAM Increased Bandwidth Power Efficiency Scalability Reduced Latency Vertical NAND Continued Cost/GB Reductions Relaxed Lithography Requirements PCM Faster Read Times Lower Power Consumption Better Data Retention Memory Industry in Transition Historical Cost Trend February 5, 2013 |
|
|
Elpida Acquisition - Solidifying Leadership in Memory February 5, 2013 Founded in 1978 Headquartered in Boise, Idaho ~27,000 Employees LTM Revenue: $8.0bn IP Patents: ~25,000 Fab locations: Boise, Idaho Manassas, Virginia Lehi, Utah Singapore Taiwan (Inotera) Italy Israel Total Capacity: 435k WSPM¹ Founded in 1999 Headquartered in Tokyo, Japan ~5,800 Employees LTM Revenue: $3.2bn IP Patents: ~6,000 Fab locations: Hiroshima, Japan Taiwan (Rexchip) Total Capacity: 180k WSPM² (Rexchip R2 has an additional shell for 75K WPM potential for DRAM or NAND Capacity) Note: Revenue for the last twelve months ending Nov 2012 and Sep 2012 for Micron and Elpida, respectively. Assumes FX rate of 80 YEN/USD. 1. Current utilized 300mm equivalent DRAM, NAND, and NOR wafer capacity. Micron DRAM includes the majority portion of Inotera post 2013 restructure. NAND includes all wafers produced for Micron and Intel. 2. Current installed 300mm equivalent capacity. WSPM: Wafer Starts per Month. + |
|
|
Source: Company Data, Micron Estimates, Competitor data from C1’Q12 – CQ4’12 except for Micron, Elpida, and Windbond (thru CQ3-12 as they have not yet reported) 1. Group total defined as only those companies listed on this page although others may also exist 2. Micron Includes NAND sold to Intel from IM Flash, Micron data from FQ2’12 – FQ1’13 Elpida data from CQ4’11 through CQ3’12 3. Samsung and Toshiba’s market share % represents actual reported “Memory” revenue Scale to Invest, Compete, and Serve Customers February 5, 2013 LTM Memory Revenue (% of Group Total)¹ |
|
|
Solidifying Leadership In Memory February 5, 2013 Industry leading pure-play memory company with scale to invest, compete and serve our customers Greater Manufacturing Scale Creating Significant Shift in Strategic Capability ~90% increase in trade wafer capacity (includes Micron’s trade NAND and total DRAM from Micron, Inotera and Elpida/Rexchip). Capacity increase is a shift within the industry and not incremental Enables shift of acquired capacity to more valued added segments Investment Levels Enabling Broad Technology Platform Leadership Expands R&D resources and merged technology platforms Increases ability to balance capacity among memory technologies (DRAM, NAND & NOR) based on customers’ needs End Market Diversification Expanded customer-base and product/technology portfolio Expanded product portfolio drives leadership positions in mobile, networking and enterprise Cost Competitiveness Increased scale and technology leadership resulting in improving cost structure Leverage Micron’s cost efficient test platform across incremental capacity Extending Technology Performance through Partnerships Successful Strategic Alliances (i.e., Intel, EMC, Sony, IBM .) |
|
|
Business Highlights February 5, 2013 Large multi-market opportunities in semiconductor memory with significant growth drivers Largest global pure play memory company (post Elpida transaction) Diversified across memory technologies and end markets; focused on high growth, high margin segments Financial strength to invest through cycles; flexible investment model Broad and deep technology capabilities to capitalize on industry move toward memory system solutions |
|
|
[LOGO] |