Attached files
| file | filename |
|---|---|
| 8-K - 8-K - KNOLL INC | a13-4331_18k.htm |
| EX-99.1 - EX-99.1 - KNOLL INC | a13-4331_1ex99d1.htm |
Exhibit 99.2
|
|
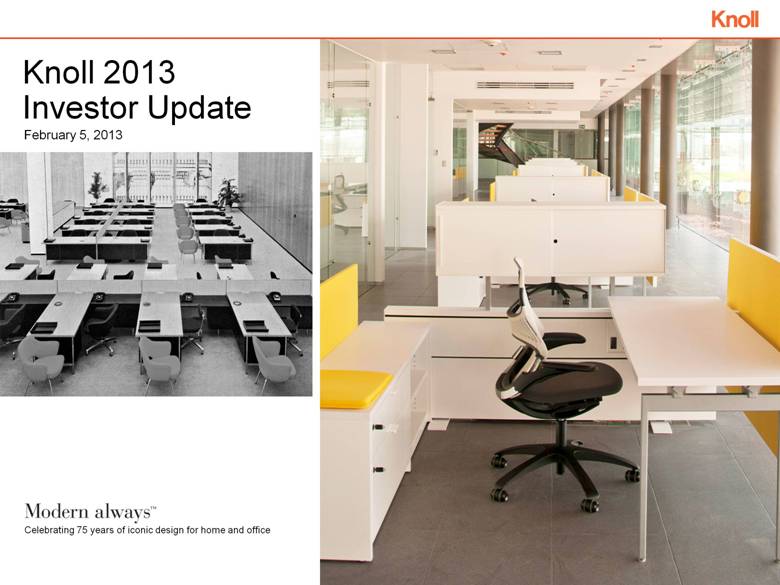
Knoll 2013 Investor Update Celebrating 75 years of iconic design for home and office February 5, 2013 |
|
|
2 Disclaimer The following information includes forward-looking statements within the meaning of Section 27A of the Securities Act of 1933, as amended, and Section 21E of the Securities Exchange Act of 1934, as amended. All statements regarding Knoll, Inc.'s expected future financial position, results of operations, revenue and profit levels, cash flows, business strategy, budgets, projected costs, capital expenditures, products, competitive positions, growth opportunities, plans and objectives of management for future operations, as well as statements that include words such as "anticipate," "if," "believe," "plan," "goals, " "estimate," "expect," "intend," "may," "could," "should," "will," and other similar expressions are forward-looking statements. This includes, without limitation, our statements and expectations regarding any current or future recovery in our industry and our publicly announced plans for increased capital and investment spending to achieve our long-term revenue and profitability growth goals. Such forward-looking statements are inherently uncertain, and readers must recognize that actual results may differ materially from the expectations of Knoll management. Knoll does not undertake a duty to update such forward-looking statements. Factors that may cause actual results to differ materially from those in the forward-looking statements include corporate spending and service-sector employment, price competition, acceptance of Knoll's new products, the pricing and availability of raw materials and components, foreign currency exchange, transportation costs, demand for high quality, well designed office furniture solutions, changes in the competitive marketplace, changes in the trends in the market for office furniture or coverings, the financial strength and stability of our suppliers, customers and dealers, access to capital, and other risks identified in Knoll's annual report on Form 10-K, and other filings with the Securities and Exchange Commission. Many of these factors are outside of Knoll's control. Note: All trademarks used herein are the property of their respective owners. |
|
|
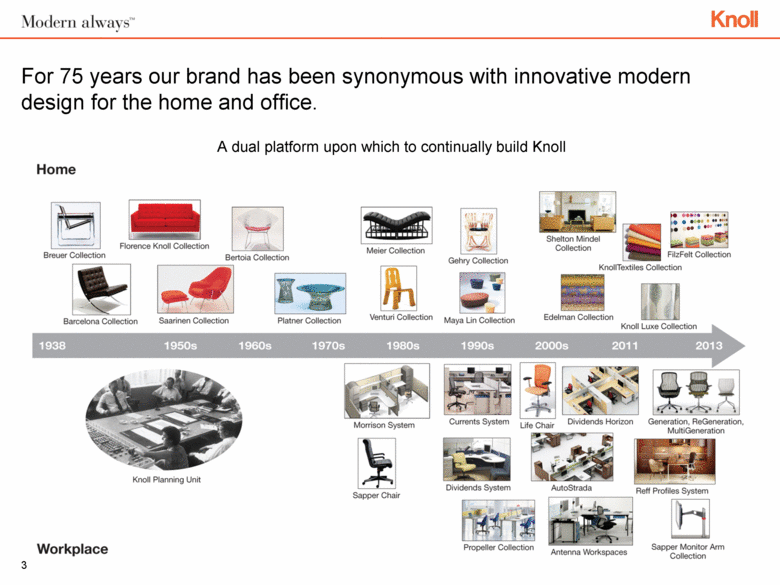
For 75 years our brand has been synonymous with innovative modern design for the home and office. A dual platform upon which to continually build Knoll 3 |
|
|
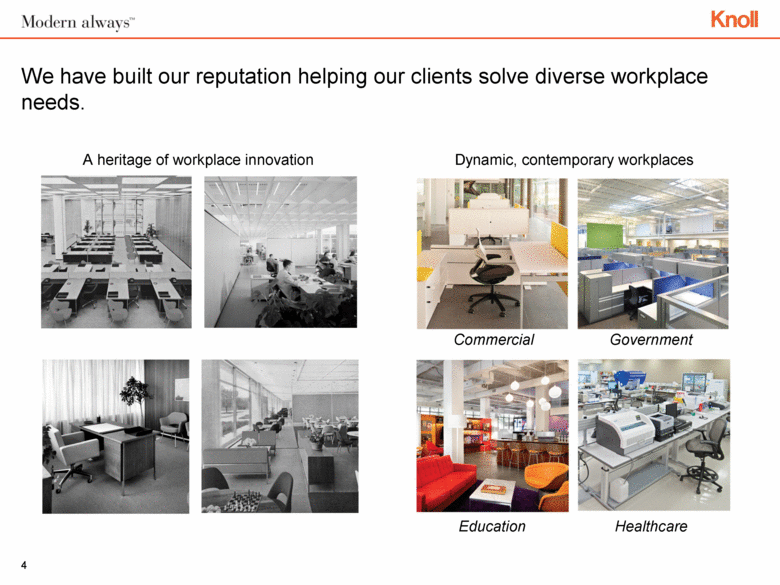
We have built our reputation helping our clients solve diverse workplace needs. Education Healthcare A heritage of workplace innovation Commercial Government Dynamic, contemporary workplaces 4 |
|
|
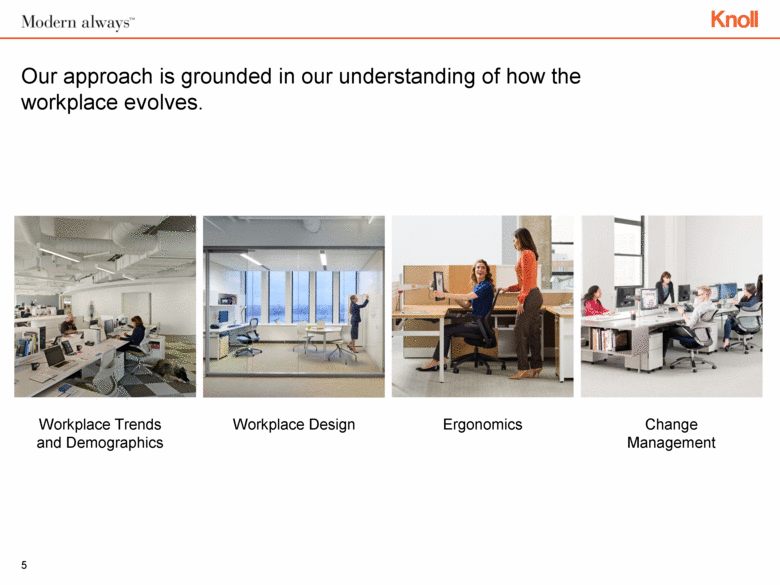
Our approach is grounded in our understanding of how the workplace evolves. Workplace Trends and Demographics Workplace Design Ergonomics Change Management 5 |
|
|
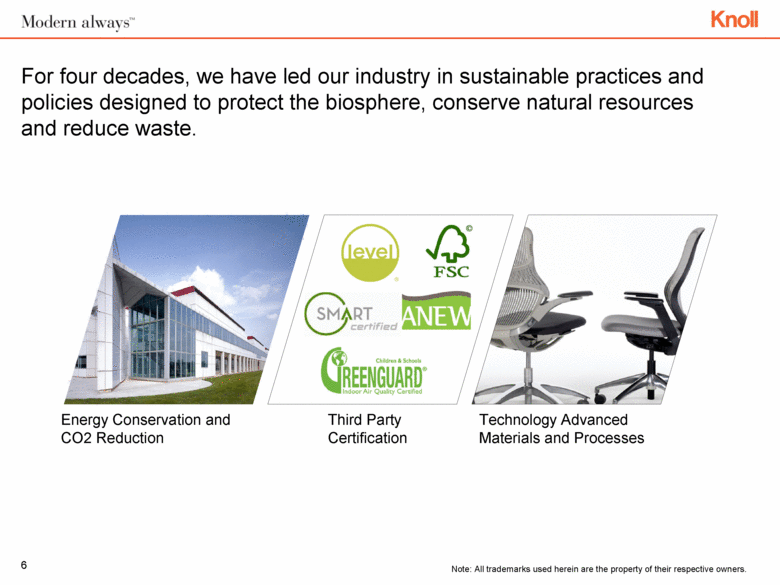
For four decades, we have led our industry in sustainable practices and policies designed to protect the biosphere, conserve natural resources and reduce waste. Energy Conservation and CO2 Reduction Third Party Certification Technology Advanced Materials and Processes 6 Note: All trademarks used herein are the property of their respective owners. |
|
|
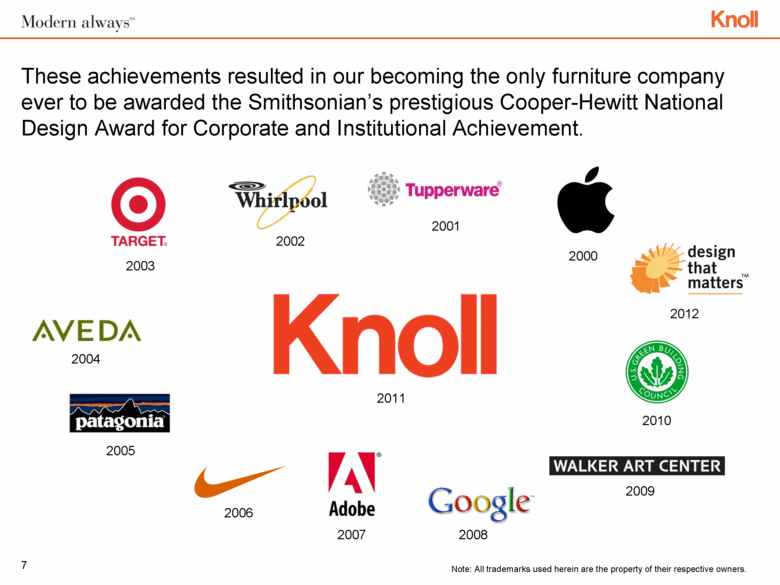
These achievements resulted in our becoming the only furniture company ever to be awarded the Smithsonian’s prestigious Cooper-Hewitt National Design Award for Corporate and Institutional Achievement. 2001 2002 2003 2000 2004 2005 2006 2007 2008 2009 2010 2011 Note: All trademarks used herein are the property of their respective owners. 2012 7 |
|
|
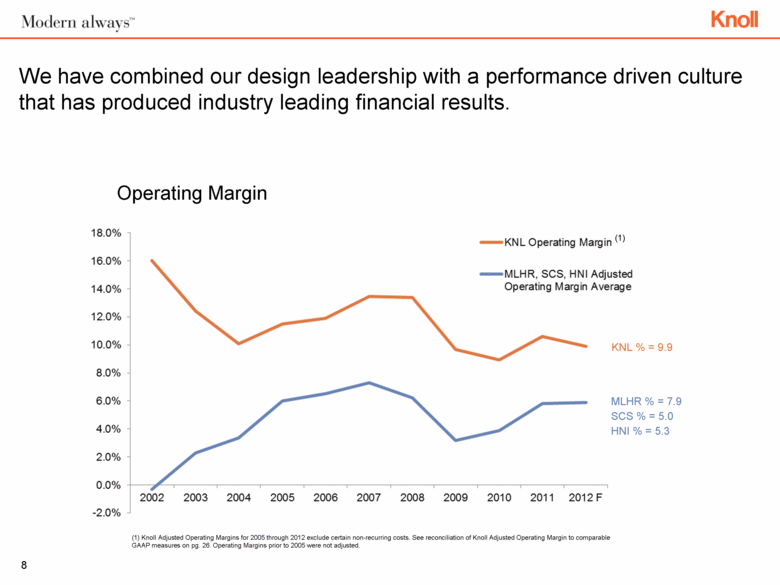
We have combined our design leadership with a performance driven culture that has produced industry leading financial results. Operating Margin 8 (1) Knoll Adjusted Operating Margins for 2005 through 2012 exclude certain non-recurring costs. See reconciliation of Knoll Adjusted Operating Margin to comparable GAAP measures on pg. 26. Operating Margins prior to 2005 were not adjusted. KNL % = 9.9 MLHR % = 7.9 SCS % = 5.0 HNI % = 5.3 (1) |
|
|
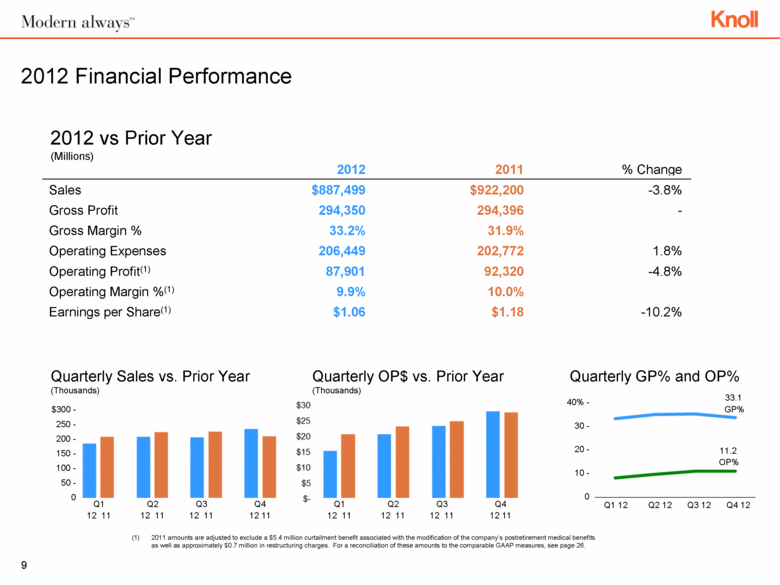
2012 2011 % Change Sales $887,499 $922,200 -3.8% Gross Profit 294,350 294,396 - Gross Margin % 33.2% 31.9% Operating Expenses 206,449 202,772 1.8% Operating Profit(1) 87,901 92,320 -4.8% Operating Margin %(1) 9.9% 10.0% Earnings per Share(1) $1.06 $1.18 -10.2% 2012 vs Prior Year (Millions) 2012 Financial Performance Quarterly Sales vs. Prior Year (Thousands) Quarterly GP% and OP% $300 - 250 - 200 - 150 - 100 - 50 - 0 Quarterly OP$ vs. Prior Year (Thousands) Q1 Q2 Q3 Q4 12 11 12 11 12 11 12 11 Q1 12 Q2 12 Q3 12 Q4 12 40% - 30 - 20 - 10 - 0 GP% OP% 9 33.1 11.2 2011 amounts are adjusted to exclude a $5.4 million curtailment benefit associated with the modification of the company’s postretirement medical benefits as well as approximately $0.7 million in restructuring charges. For a reconciliation of these amounts to the comparable GAAP measures, see page 26. Q1 Q2 Q3 Q4 12 11 12 11 12 11 12 11 |
|
|
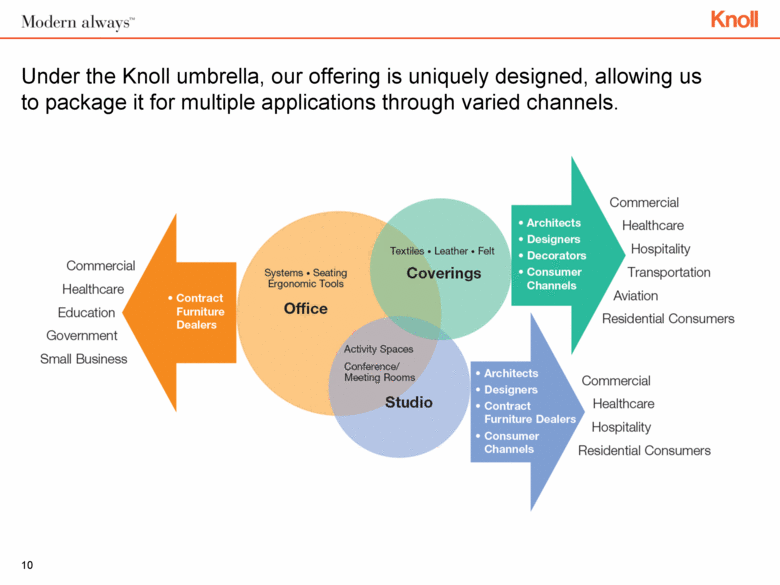
Under the Knoll umbrella, our offering is uniquely designed, allowing us to package it for multiple applications through varied channels. 10 |
|
|
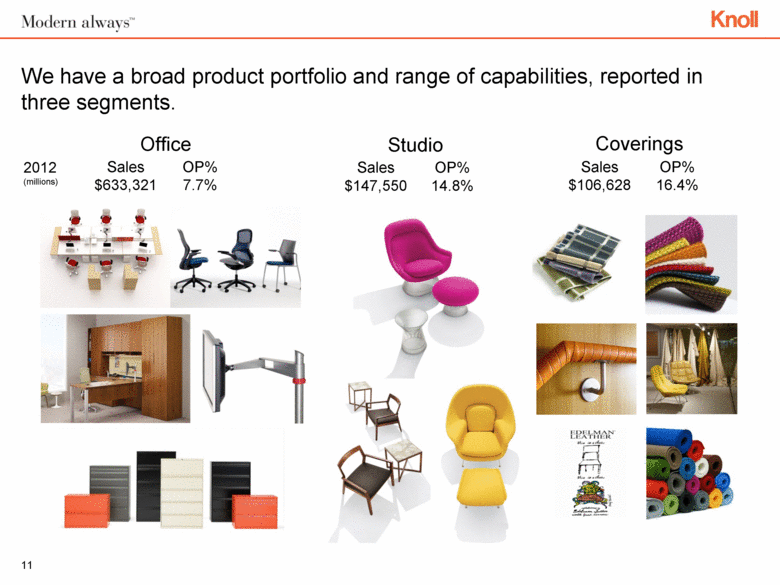
Office Studio Coverings OP% 7.7% Sales $633,321 Sales $106,628 Sales $147,550 OP% 16.4% OP% 14.8% We have a broad product portfolio and range of capabilities, reported in three segments. 2012 (millions) 11 |
|
|
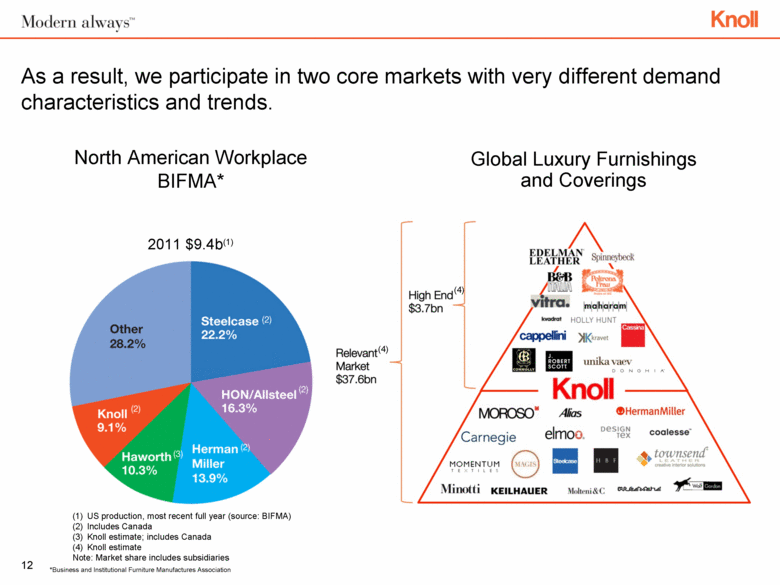
As a result, we participate in two core markets with very different demand characteristics and trends. Global Luxury Furnishings and Coverings 2011 $9.4b(1) North American Workplace BIFMA* 12 US production, most recent full year (source: BIFMA) Includes Canada Knoll estimate; includes Canada Knoll estimate Note: Market share includes subsidiaries *Business and Institutional Furniture Manufactures Association (4) (4) |
|
|
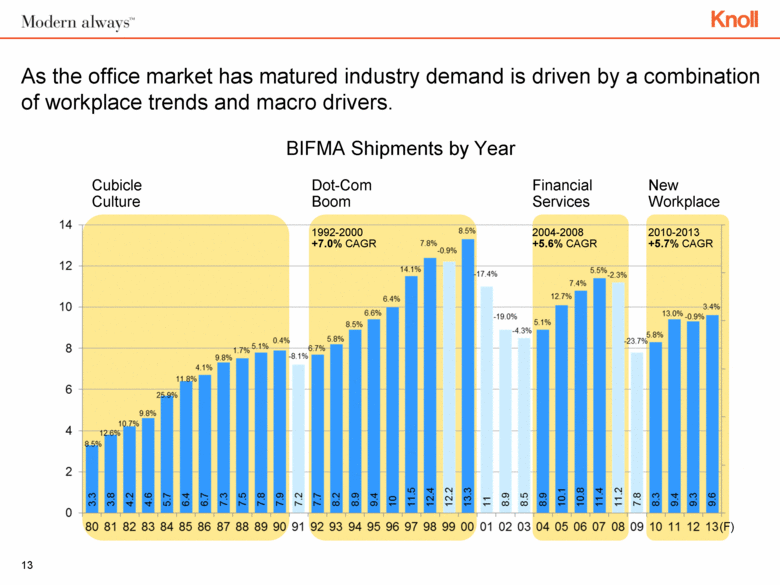
BIFMA Shipments by Year Cubicle Culture As the office market has matured industry demand is driven by a combination of workplace trends and macro drivers. Dot-Com Boom 1992-2000 +7.0% CAGR Financial Services 2004-2008 +5.6% CAGR New Workplace 2010-2013 +5.7% CAGR 13 (F) |
|
|
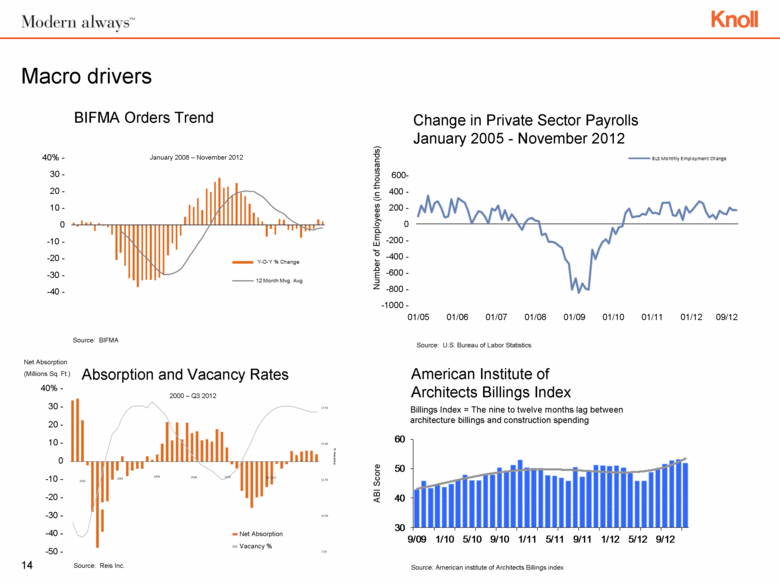
Source: Reis Inc. 14 Macro drivers Change in Private Sector Payrolls January 2005 - November 2012 American Institute of Architects Billings Index Source: BIFMA 40% - 30 - 20 - 10 - 0 -10 - -20 - -30 - -40 - 600- 400 - 200 - 0 -200 - -400 - -600 - -800 - -1000 - 01/05 01/06 01/07 01/08 01/09 01/10 01/11 01/12 09/12 01/05 01/06 01/07 01/08 01/09 01/10 01/11 01/12 09/12 Source: U.S. Bureau of Labor Statistics 40% - 30 - 20 - 10 - 0 -10 - -20 - -30 - -40 - -50 - Net Absorption (Millions Sq. Ft.) Source: American institute of Architects Billings index BIFMA Orders Trend Absorption and Vacancy Rates Billings Index = The nine to twelve months lag between architecture billings and construction spending ABI Score 2000 – Q3 2012 January 2008 – November 2012 Number of Employees (in thousands) Net Absorption Vacancy % 30 40 50 60 9/09 1/10 5/10 9/10 1/11 5/11 9/11 1/12 5/12 9/12 |
|
|
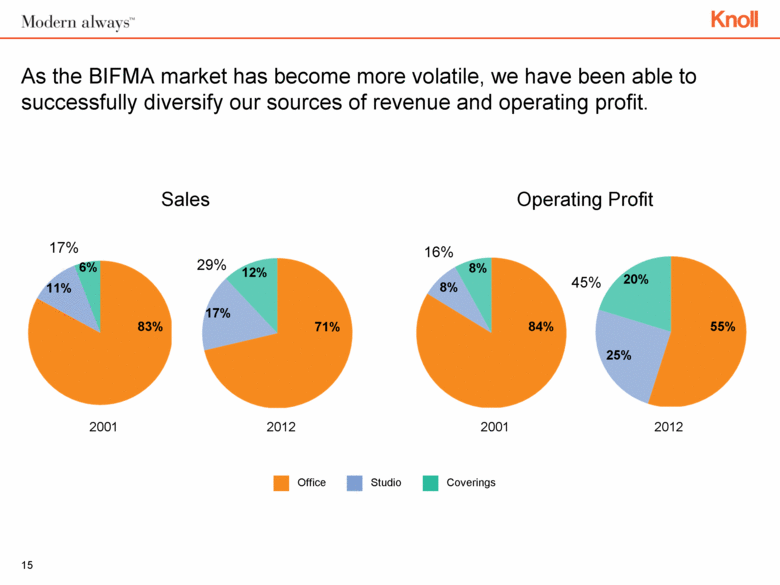
6% 83% 8% 84% 17% 71% 25% 55% 12% 11% 8% 20% As the BIFMA market has become more volatile, we have been able to successfully diversify our sources of revenue and operating profit. 2001 Operating Profit 2012 2012 Sales 2001 17% 29% 16% 45% Office Coverings Studio 15 |
|
|
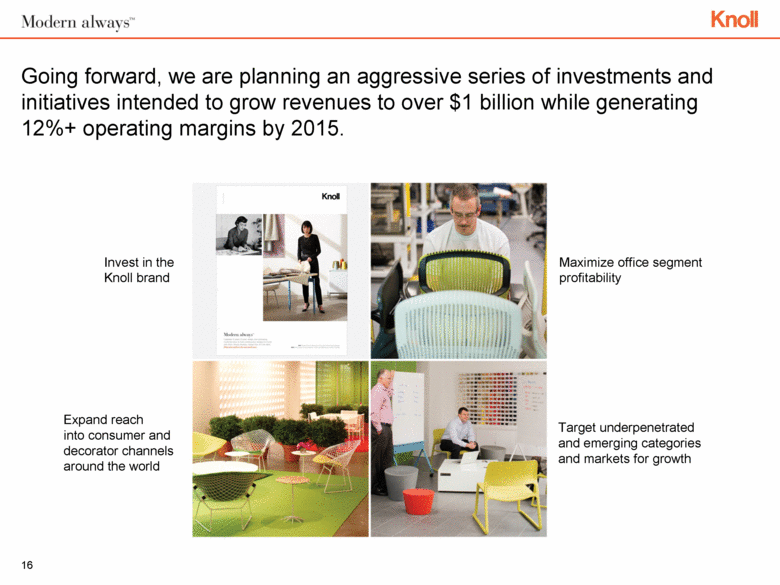
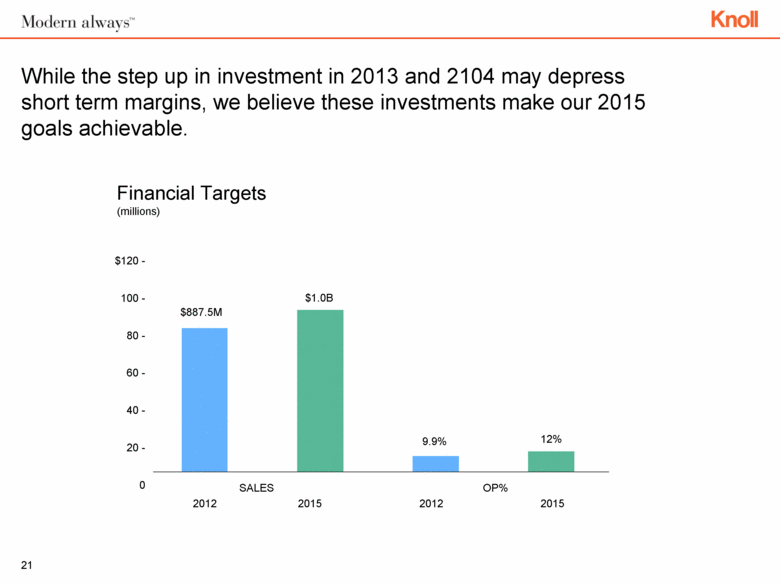
Going forward, we are planning an aggressive series of investments and initiatives intended to grow revenues to over $1 billion while generating 12%+ operating margins by 2015. 16 Invest in the Knoll brand Expand reach into consumer and decorator channels around the world Maximize office segment profitability Target underpenetrated and emerging categories and markets for growth |
|
|
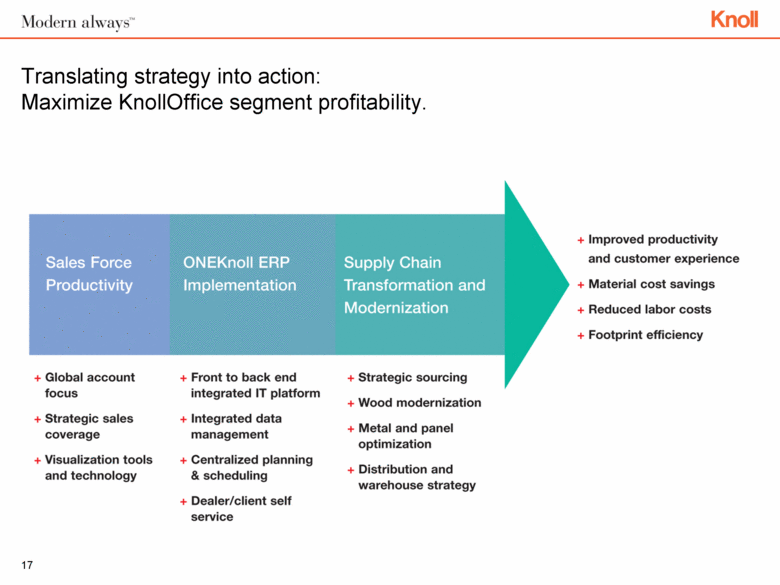
Translating strategy into action: Maximize KnollOffice segment profitability. 17 |
|
|
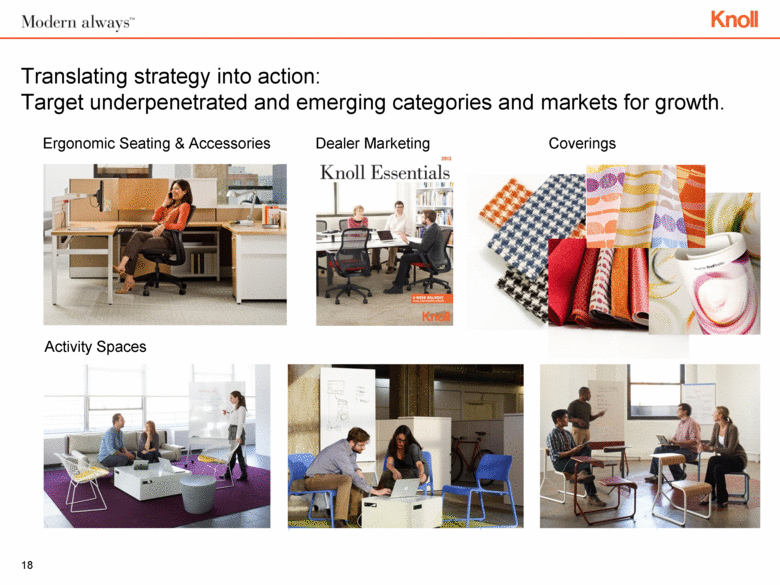
Translating strategy into action: Target underpenetrated and emerging categories and markets for growth. Ergonomic Seating & Accessories Activity Spaces Coverings Dealer Marketing 18 |
|
|
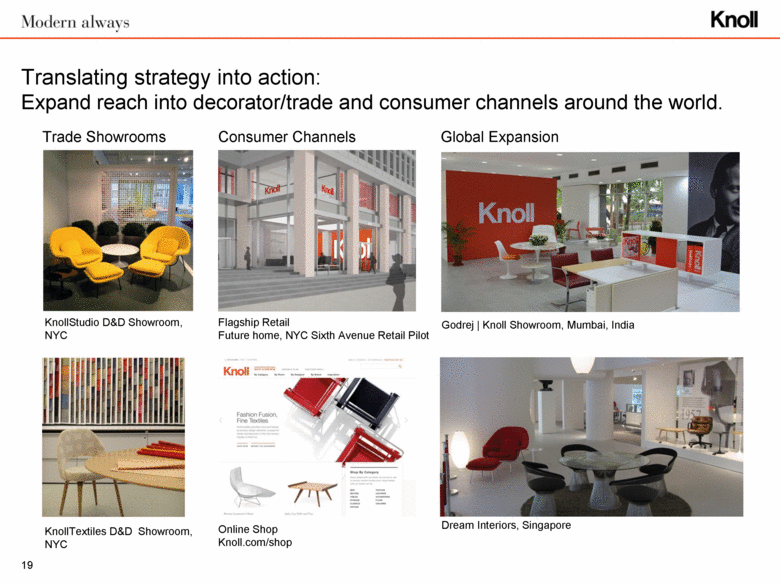
Trade Showrooms Global Expansion Consumer Channels Online Shop Knoll.com/shop KnollTextiles D&D Showroom, NYC Translating strategy into action: Expand reach into decorator/trade and consumer channels around the world. KnollStudio D&D Showroom, NYC Flagship Retail Future home, NYC Sixth Avenue Retail Pilot Dream Interiors, Singapore Godrej | Knoll Showroom, Mumbai, India 19 |
|
|
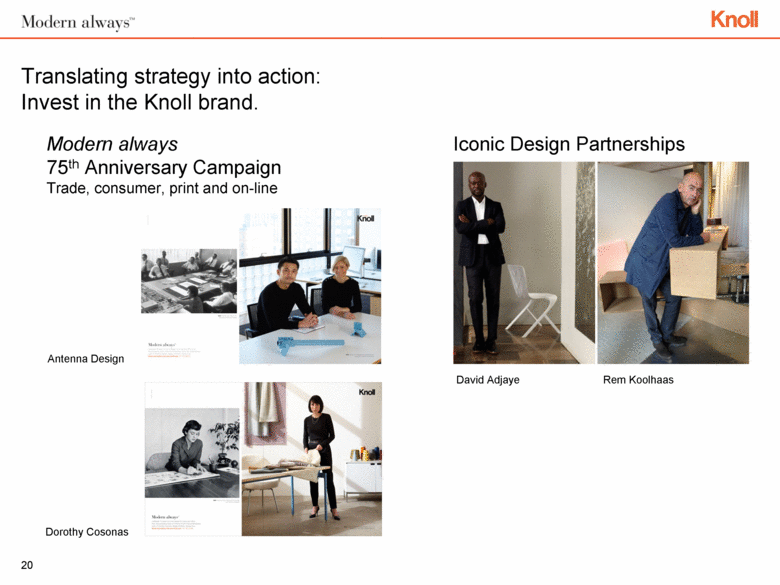
Iconic Design Partnerships David Adjaye Rem Koolhaas Modern always 75th Anniversary Campaign Trade, consumer, print and on-line Translating strategy into action: Invest in the Knoll brand. Antenna Design Dorothy Cosonas 20 |
|
|
While the step up in investment in 2013 and 2104 may depress short term margins, we believe these investments make our 2015 goals achievable. Financial Targets (millions) SALES OP% 2012 2015 2012 2015 $120 - 100 - 80 - 60 - 40 - 20 - 0 21 $887.5M $1.0B 9.9% 12% |
|
|
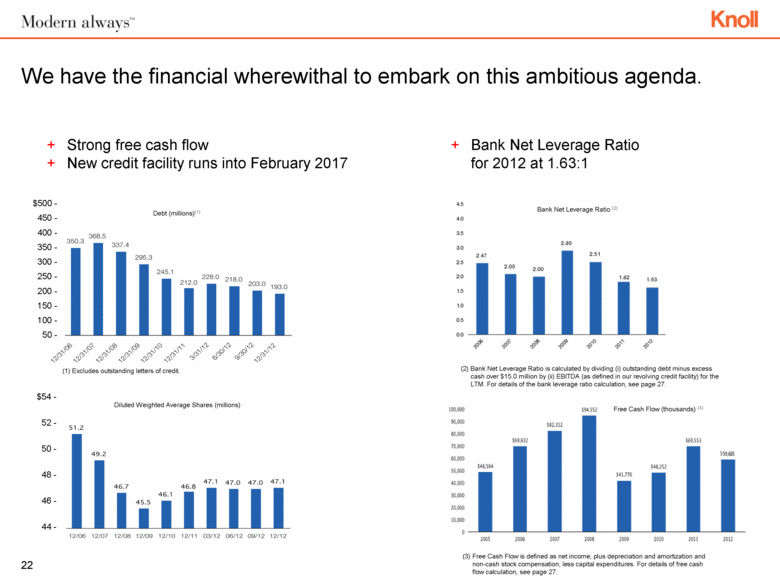
Bank Net Leverage Ratio for 2012 at 1.63:1 We have the financial wherewithal to embark on this ambitious agenda. (3) Free Cash Flow is defined as net income, plus depreciation and amortization and non-cash stock compensation, less capital expenditures. For details of free cash flow calculation, see page 27. (1) Excludes outstanding letters of credit. (2) Bank Net Leverage Ratio is calculated by dividing (i) outstanding debt minus excess cash over $15.0 million by (ii) EBITDA (as defined in our revolving credit facility) for the LTM. For details of the bank leverage ratio calculation, see page 27. Strong free cash flow New credit facility runs into February 2017 Debt (millions)(1) Diluted Weighted Average Shares (millions) Bank Net Leverage Ratio (2) Free Cash Flow (thousands) (3) $500 - 450 - 400 - 350 - 300 - 250 - 200 - 150 - 100 - 50 - 06 07 08 09 10 11 03/12 06/12 09/12 $54 - 52 - 50 - 48 - 46 - 44 - 40% - 30 - 20 - 0 -10 - -20 - -30 - -40 - 22 $59,685 |
|
|
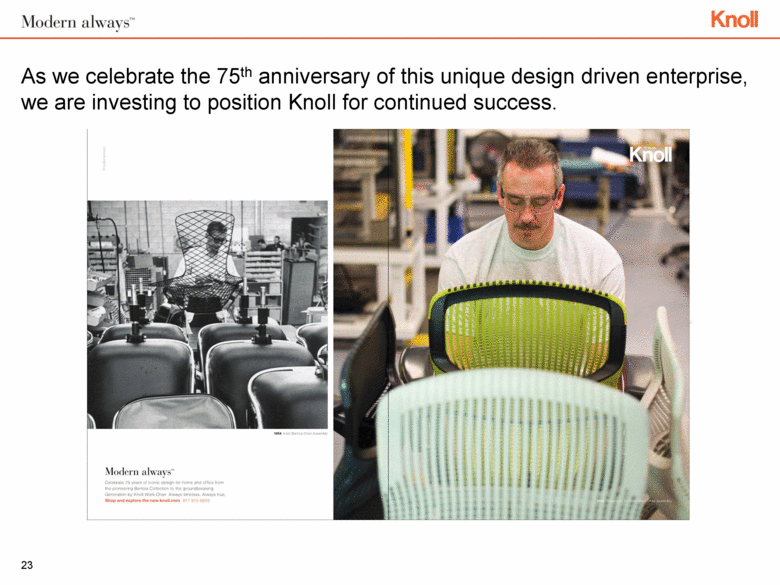
As we celebrate the 75th anniversary of this unique design driven enterprise, we are investing to position Knoll for continued success. 23 |
|
|
1957 Hartford, CT Appendix 2013 New York, NY For further information please contact Barry McCabe EVP CFO at bmccabe@knoll.com or 215 679-1301 |
|
|
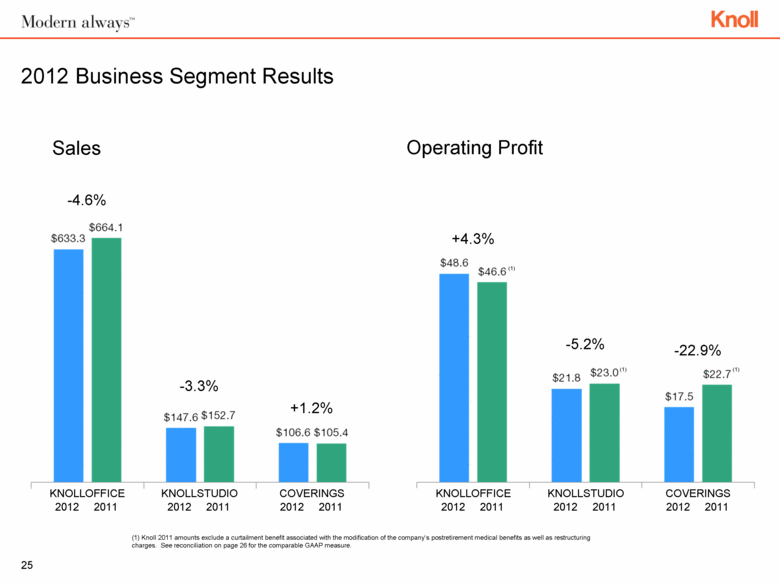
2012 Business Segment Results Sales Operating Profit 25 2012 2011 KNOLLOFFICE 2012 2011 KNOLLSTUDIO 2012 2011 COVERINGS -4.6% -3.3% +1.2% 2012 2011 KNOLLOFFICE 2012 2011 KNOLLSTUDIO 2012 2011 COVERINGS +4.3% -5.2% -22.9% (1) Knoll 2011 amounts exclude a curtailment benefit associated with the modification of the company’s postretirement medical benefits as well as restructuring charges. See reconciliation on page 26 for the comparable GAAP measure. (1) (1) (1) |
|
|
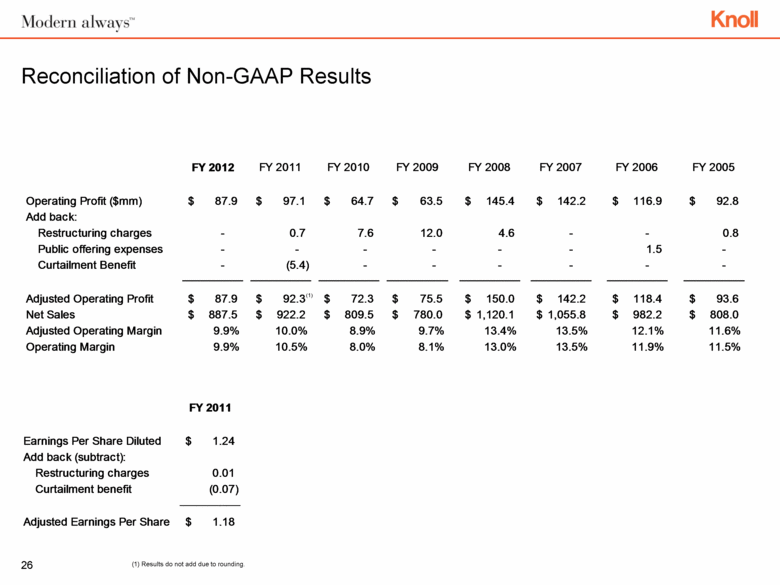
Reconciliation of Non-GAAP Results 26 (1) Results do not add due to rounding. (1) FY 2012 FY 2011 FY 2010 FY 2009 FY 2008 FY 2007 FY 2006 FY 2005 Operating Profit ($mm) 87.9 $ 97.1 $ 64.7 $ 63.5 $ 145.4 $ 142.2 $ 116.9 $ 92.8 $ Add back: Restructuring charges - 0.7 7.6 12.0 4.6 - - 0.8 Public offering expenses - - - - - - 1.5 - Curtailment Benefit - (5.4) - - - - - - Adjusted Operating Profit 87.9 $ 92.3 $ 72.3 $ 75.5 $ 150.0 $ 142.2 $ 118.4 $ 93.6 $ Net Sales 887.5 $ 922.2 $ 809.5 $ 780.0 $ 1,120.1 $ 1,055.8 $ 982.2 $ 808.0 $ Adjusted Operating Margin 9.9% 10.0% 8.9% 9.7% 13.4% 13.5% 12.1% 11.6% Operating Margin 9.9% 10.5% 8.0% 8.1% 13.0% 13.5% 11.9% 11.5% FY 2011 Earnings Per Share Diluted 1.24 $ Add back (subtract): Restructuring charges 0.01 Curtailment benefit (0.07) Adjusted Earnings Per Share 1.18 $ |
|
|
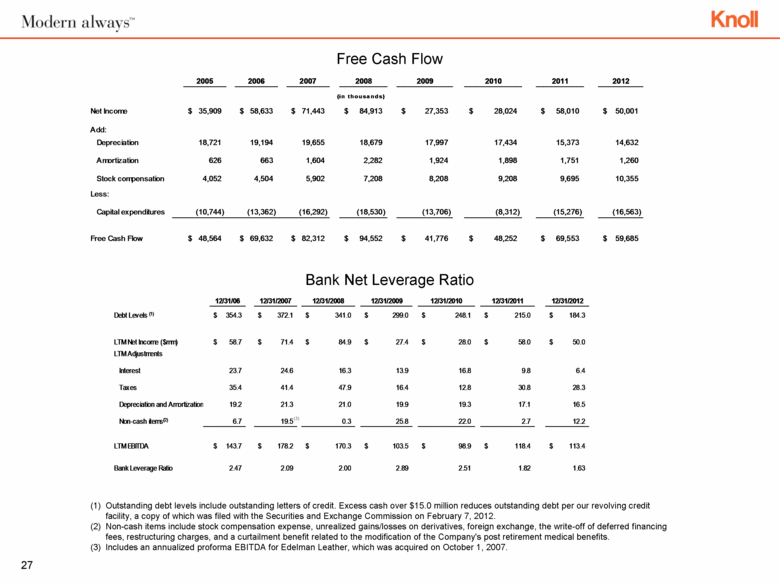
(1) Outstanding debt levels include outstanding letters of credit. Excess cash over $15.0 million reduces outstanding debt per our revolving credit facility, a copy of which was filed with the Securities and Exchange Commission on February 7, 2012. (2) Non-cash items include stock compensation expense, unrealized gains/losses on derivatives, foreign exchange, the write-off of deferred financing fees, restructuring charges, and a curtailment benefit related to the modification of the Company's post retirement medical benefits. (3) Includes an annualized proforma EBITDA for Edelman Leather, which was acquired on October 1, 2007. Free Cash Flow Bank Net Leverage Ratio (3) 27 2005 2006 2007 2008 2009 2010 2011 2012 Net Income 35,909 $ 58,633 $ 71,443 $ 84,913 $ 27,353 $ 28,024 $ 58,010 $ 50,001 $ Add: Depreciation 18,721 19,194 19,655 18,679 17,997 17,434 15,373 14,632 Amortization 626 663 1,604 2,282 1,924 1,898 1,751 1,260 Stock compensation 4,052 4,504 5,902 7,208 8,208 9,208 9,695 10,355 Less: Capital expenditures (10,744) (13,362) (16,292) (18,530) (13,706) (8,312) (15,276) (16,563) Free Cash Flow 48,564 $ 69,632 $ 82,312 $ 94,552 $ 41,776 $ 48,252 $ 69,553 $ 59,685 $ (in thousands) 12/31/06 12/31/2007 12/31/2008 12/31/2009 12/31/2010 12/31/2011 12/31/2012 Debt Levels (1) 354.3 $ 372.1 $ 341.0 $ 299.0 $ 248.1 $ 215.0 $ 184.3 $ LTM Net Income ($mm) 58.7 $ 71.4 $ 84.9 $ 27.4 $ 28.0 $ 58.0 $ 50.0 $ LTM Adjustments Interest 23.7 24.6 16.3 13.9 16.8 9.8 6.4 Taxes 35.4 41.4 47.9 16.4 12.8 30.8 28.3 Depreciation and Amortization 19.2 21.3 21.0 19.9 19.3 17.1 16.5 Non-cash items (2) 6.7 19.5(3) 0.3 25.8 22.0 2.7 12.2 LTM EBITDA 143.7 $ 178.2 $ 170.3 $ 103.5 $ 98.9 $ 118.4 $ 113.4 $ Bank Leverage Ratio 2.47 2.09 2.00 2.89 2.51 1.82 1.63 |

