Attached files
| file | filename |
|---|---|
| 8-K - FORM 8-K - C. H. ROBINSON WORLDWIDE, INC. | d480245d8k.htm |
| EX-99.1 - EX-99.1 - C. H. ROBINSON WORLDWIDE, INC. | d480245dex991.htm |
 Earnings Conference Call –
Fourth Quarter 2012
February 5, 2013
John Wiehoff, Chairman & CEO
Chad Lindbloom, CFO
Tim Gagnon, Director, Investor Relations
Exhibit 99.2 |
 2
Safe Harbor Statement
Except for the historical information contained herein, the matters set forth in
this presentation and the accompanying earnings release are
forward-looking statements that represent our expectations, beliefs,
intentions or strategies concerning future events. These forward-looking
statements are subject to certain risks and uncertainties that could cause actual
results to differ materially from our historical experience or our present
expectations, including, but not limited to such factors as changes in
economic conditions, including uncertain consumer demand; changes in market
demand and pressures on the pricing for our services; competition and growth
rates within the third party logistics industry; freight levels and increasing costs and
availability
of
truck
capacity
or
alternative
means
of
transporting
freight,
and
changes
in
relationships
with
existing
truck,
rail,
ocean
and
air
carriers; changes
in
our
customer
base
due
to
possible
consolidation
among
our
customers;
our
ability
to integrate
the
operations
of
acquired
companies
with
our
historic
operations
successfully;
risks associated with litigation and
insurance coverage; risks associated with operations outside of the U.S.; risks
associated with the potential impacts of changes in government regulations;
risks associated with the produce industry, including food safety and
contamination issues; fuel prices and availability; the impact of war on the
economy; and other risks and uncertainties detailed in our Annual and Quarterly
Reports.
Any forward-looking statement speaks only as of the date on which such
statement is made, and we undertake no obligation to update such statement
to reflect events or circumstances arising after such date. All remarks made
during our financial results conference call will be current at the time of
the call and we undertake no obligation to update the replay. |
 3
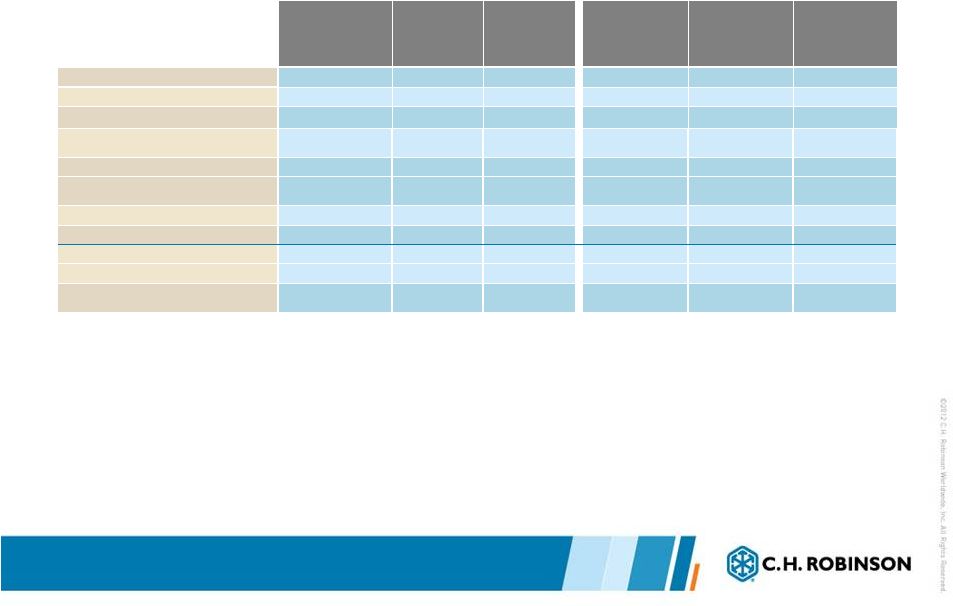
Summarized Adjusted Income Statement
•
The term “Adjusted”
refers to non-GAAP financial information, adjusted to exclude
certain transaction impacts.
•
Non-recurring
personnel
expenses
is
primarily
an
incremental
expense
related
to
the
vesting of restricted equity, driven by the impact that the T-Chek gain had on
EPS. •
Non-recurring other operating expenses are investment banking, external legal
and financial due diligence fees, related to the acquisition of Phoenix and
Apreo, and the divestiture of T-Chek.
•
Non-recurring investment income, is the gain on the sale of T-Chek.
In thousands, except per share amount
Actual
Non-recurring
Transaction
Impacts
Adjusted
Actual
Non-recurring
Transaction Impacts
Adjusted
Total net revenues
$444,632
$0
$444,632
$1,717,571
$0
$1,717,571
Personnel expenses
226,042
34,592
191,450
766,006
34,592
731,414
Other operating expenses
84,986
9,115
75,871
276,245
10,604
265,641
Total operating expenses
$311,028
$43,707
$267,321
$1,042,251
$45,196
$997,055
Income from operations
$133,604
-$43,707
$177,311
$675,320
-$45,196
$720,516
Investment & other income
282,166
281,551
615
283,142
281,551
1,591
Income before taxes
415,770
237,844
177,926
958,462
236,355
722,107
Provision for income taxes
159,378
90,023
69,355
364,658
89,558
275,100
Net income
$256,392
$147,821
$108,571
$593,804
$146,797
$447,007
Net income per share (diluted)
1.58
0.68
3.67
2.76
Weighted average shares (diluted)
161,799
1,190
160,609
161,946
277
161,669
Three months ended December 31, 2012
Twelve months ended December
31,2012 |
 4
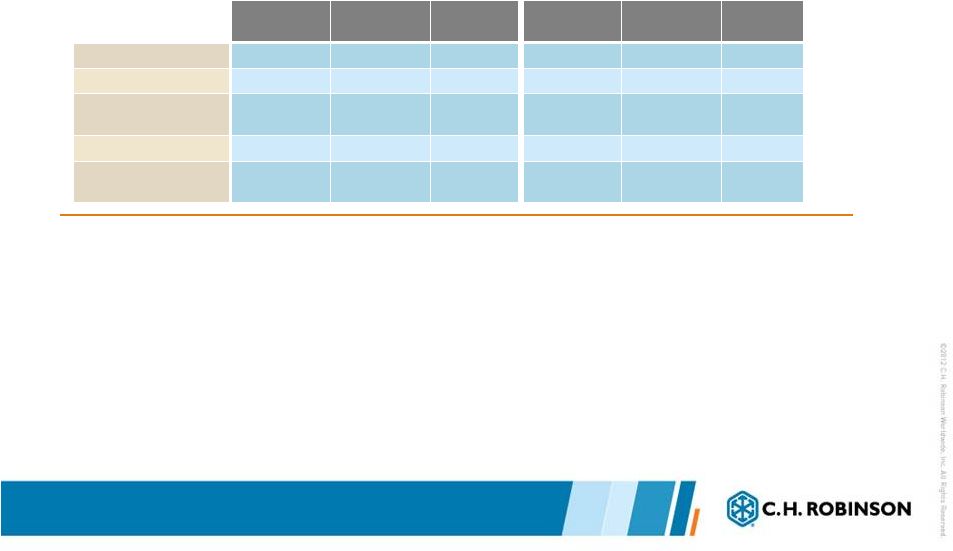
Adjusted Q4 & YTD 2012 Results
Adjusted
2012
2011
% Change
Adjusted
2012
2011
% Change
Total revenues
$2,970,876
$2,568,284
15.7%
$11,359,113
$10,336,346
9.9%
Total net revenues
$444,632
$401,385
10.8%
$1,717,571
$1,632,658
5.2%
Income from
operations
$177,311
$171,955
3.1%
$720,516
$692,730
4.0%
Net income
$108,571
$109,214
-0.6%
$447,007
$431,612
3.6%
Earnings per share
(diluted)
$0.68
$0.67
1.5%
$2.76
$2.62
5.3%
Three months ended December 31
Twelve months ended December 31
In thousands, except per share amounts
•
Full
year,
2012
truckload
volume
growth,
10%
•
Active
customers
in
2012:
approximately
42,000,
compared
to
37,000
in
2011
•
Active
carriers
in
2012:
approximately
56,000,
compared
to
53,000
in
2011
•
Q4
2011,
T-Chek
had
$12.5
million
net
revenue
and
$6.4
million
income
from
operations
•
Excluding
T-Chek
from
Q4
results
in
both
2012
and
2011;
•
Adjusted
net
revenue
increased
approximately
14
percent,
year
over
year
in
quarter
4
•
Adjusted
income
from
operations
increased
approximately
6.5
percent,
year
over
year
in
quarter
4 |
 5
2012 Review
•
Recap of previously communicated strategic alignment
•
Phoenix International acquisition
•
T-Chek divestiture
•
Commitment to Europe
•
Operational and execution highlights and challenges
•
Highlights
•
We continue to grow market share
•
We are aggressively selling and developing our relationships
•
Our account management initiatives are expanding our service offerings and
account penetration
•
Challenges
•
Truckload margin compression continues |
 6
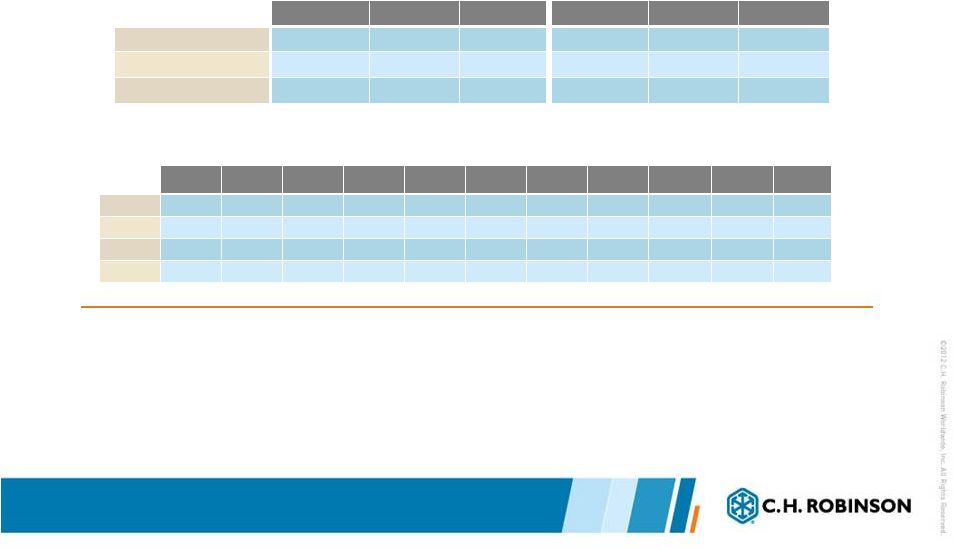
Transportation Results Q4 2012
•
Q4 consolidated transportation net revenue margin on the lower end of our 10 year
performance
•
Volumes up in nearly all services in Q4
•
The revenue mix has changed with the acquisition of Phoenix International
2012
2011
% Change
2012
2011
% Change
Total revenues
$2,585,930
$2,200,258
17.5%
$9,685,415
$8,740,524
10.8%
Total net revenues
$409,141
$358,672
14.1%
$1,528,137
$1,443,916
5.8%
Net revenue margin
15.8%
16.3%
-2.9%
15.8%
16.5%
-4.5%
Three months ended December 31
Twelve months ended December 31
TRANSPORTATION in thousands
TRANSPORTATION NET REVENUE MARGIN PERCENTAGE
2002
2003
2004
2005
2006
2007
2008
2009
2010
2011
2012
Q1
17.7%
17.8%
16.8%
17.4%
18.3%
20.2%
18.2%
22.6%
17.4%
17.2%
16.9%
Q2
16.1%
15.9%
15.4%
16.3%
17.1%
17.9%
15.4%
20.6%
15.8%
16.2%
14.9%
Q3
15.6%
16.0%
15.9%
16.3%
17.5%
18.0%
15.9%
19.8%
16.6%
16.4%
15.6%
Q4
16.2%
15.8%
16.0%
15.7%
18.3%
17.7%
19.0%
18.3%
17.6%
16.3%
15.8% |
 7
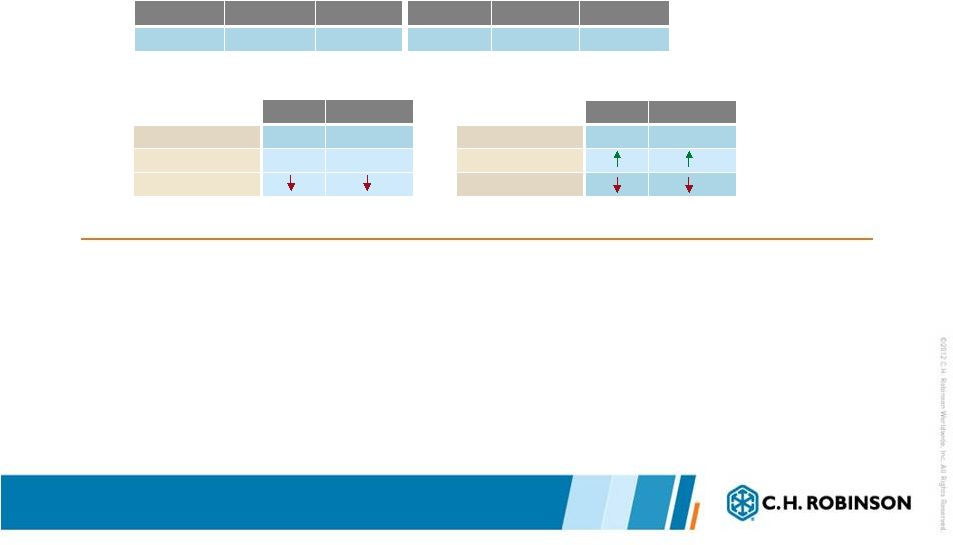
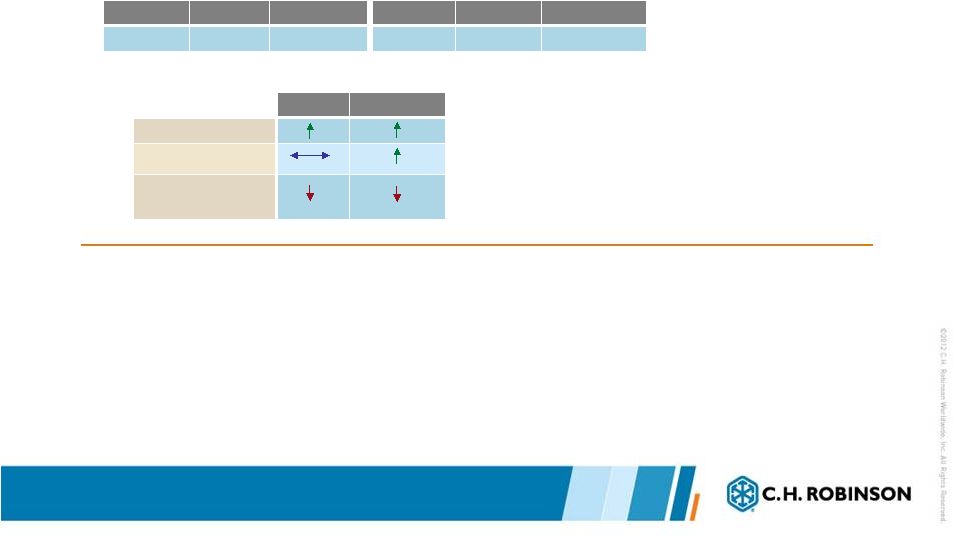
Truck Results Q4 2012
2012
2011
% Change
2012
2011
% Change
$328,273
$306,443
7.1%
$1,284,280
$1,236,611
3.9%
Three months ended December 31
Twelve months ended December 31
TRUCK NET REVENUES in thousands
Quarter
Year to Date
Volume
12%
10%
Pricing *
1%
1%
Net revenue margin
TRUCKLOAD
Quarter
Year to Date
Volume
16%
16%
Pricing
Net revenue margin
LTL
Year over year change
Year over year change
*Excluding estimated impact of fuel
•
North American Truckload volume increased 8% in the fourth quarter
•
We estimate that our acquisition of Apreo Logistics in Poland contributed
approximately 4% to our volume growth in the fourth quarter
•
North American Truckload cost per mile increased approximately two percent and our
pricing to our customers increased approximately one percent
•
Less-than-Truckload volume increased 16% in the fourth quarter while net
revenue margin declined |
 8
Intermodal Results Q4 2012
•
Net
revenue
declined,
due
to
a
change
in
our
mix
of
business
and
an
increased
cost
of
capacity
•
Length of haul increased in the fourth quarter
•
Approximately 1,000 owned containers now in service
2012
2011
% Change
2012
2011
% Change
$9,011
$10,189
-11.6%
$38,815
$41,189
-5.8%
Three months ended December 31
Twelve months ended December 31
INTERMODAL NET REVENUES in thousands
Quarter
Year to Date
Volume
Pricing
Net revenue margin
Year over year change |
 9
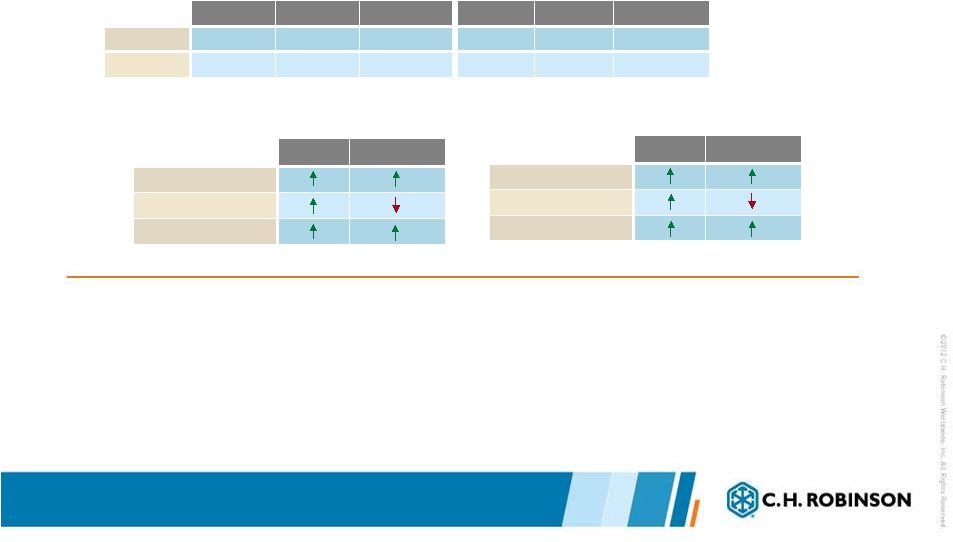
Ocean & Air Results Q4 2012
2012
2011
% Change
2012
2011
% Change
Ocean
$33,707
$17,022
98.0%
$84,924
$66,873
27.0%
Air
$15,948
$8,811
81.0%
$44,444
$39,371
12.9%
Three months ended December 31
Twelve months ended December 31
NET REVENUES in thousands
Quarter
Year to Date
Volume
Pricing
Net revenue margin
OCEAN
Quarter
Year to Date
Volume
Pricing
Net revenue margin
AIR
Year over year change
Year over year change
•
Ocean
net
revenues
increased
98
percent
in
the
fourth
quarter
of
2012.
Excluding
Phoenix,
we estimate that ocean transportation net revenues increased approximately three
percent in the fourth quarter. The net revenue increases (excluding Phoenix)
resulted in part from increased pricing, partially offset by decreased
volumes. •
Air net revenues increased 81 percent in the fourth quarter of 2012. Excluding
Phoenix, we estimate that air transportation net revenues increased
approximately 19 percent in the fourth quarter.
The
net
revenue
increase
(excluding
Phoenix)
was
due
to
the
decreased
cost
of capacity
and increased pricing, partially offset by decreased volumes.
|
 10
Other Logistics Services Results Q4 2012
•
Other Logistics Services includes Transportation Management Services, Customs,
Warehousing, and Small Parcel.
•
Other Logistics Services net revenues increased 37 percent in the fourth quarter.
Excluding Phoenix, we estimate Other Logistics Services net revenues
increased approximately 15 percent in the fourth quarter.
2012
2011
% Change
2012
2011
% Change
$22,202
$16,207
37.0%
$75,674
$59,872
26.4%
Three months ended December 31
Twelve months ended December 31
NET REVENUES in thousands
|
 11
Sourcing Results Q4 2012
•
Sourcing net revenue growth was driven by an increase in net revenue margin
•
We had case volume growth with large customers in the fourth quarter
2012
2011
% Change
2012
2011
% Change
Total revenues
$379,479
$352,744
7.6%
$1,620,183
$1,535,528
5.5%
Total net revenues
$30,543
$27,431
11.3%
$136,438
$128,448
6.2%
Net revenue margin
8.0%
7.8%
3.5%
8.4%
8.4%
0.7%
Three months ended December 31
Twelve months ended December 31
SOURCING in thousands |
 12
2012 Adjusted Results Compared to 2011
Adjusted
2012
2011
% Change
Adjusted
2012
2011
% Change
Total net revenues
$444,632
$401,385
10.8%
$1,717,571
$1,632,658
5.2%
Operating expenses:
Personnel expenses
$191,450
$164,062
16.7%
$731,414
$696,233
5.1%
Percent of net revenues
43.1%
40.9%
42.6%
42.6%
Other operating expenses
$75,871
$65,368
16.1%
$265,641
$243,695
9.0%
Percent of net revenues
17.1%
16.3%
15.5%
14.9%
Total Operating expenses
$267,321
$229,430
16.5%
$,997,055
$939,928
6.1%
Income from Operations
$177,311
$171,955
3.1%
$720,516
$692,730
4.0%
Percent of net revenues
39.9%
42.8%
41.9%
42.4%
Three months ended December 31
Twelve months ended December 31
•
The term “Adjusted”
refers to non-GAAP financial information, adjusted to exclude certain
transaction impacts.
•
Estimated impact of Phoenix to consolidated personnel as a percent of net revenue
was an increase of 1%.
•
Q4 2011 personnel expense was unusually low, due to reductions in certain incentive
compensation plans that are based on growth in earnings. These
reductions were driven by a slowing
of
earnings
growth
in
Q4
2011
compared
to
the
first
nine
months
of
2011.
•
The increase in other operating expenses as a percent of net revenues was driven
primarily by two months of intangible amortization ($2.7 million) related to
the Phoenix acquisition. In thousands |
 13
2012 Adjusted Results Compared to 2011(continued)
Adjusted
2012
2011
% Change
Adjusted
2012
2011
% Change
Total revenues
$2,970,876
$2,568,284
15.7%
$11,359,113
9.9%
Total net revenues
$444,632
$401,385
10.8%
$1,717,571
$1,632,658
5.2%
Income from
operations
$177,311
$171,955
3.1%
$720,516
$692,730
4.0%
Other income
615
1,373
-55.2%
1,591
1,974
-19.4%
Income before taxes
177,926
173,328
2.7%
722,107
694,704
3.9%
Income taxes
69,355
64,114
8.2%
275,100
263,092
4.6%
Effective tax rate
39.0%
37.0%
38.1%
37.9%
Net income
$108,571
$109,214
-0.6%
$447,007
$431,612
3.6%
Earnings per share
(diluted)
$0.68
$0.67
1.5%
$2.76
$2.62
5.3%
Three months ended December 31
Twelve months ended December 31
In thousands, except per share amounts
•
The
term
“Adjusted”
refers
to
non-GAAP
financial
information,
adjusted
to
exclude
certain
transaction impacts.
•
Other income/expense decrease driven by lower investment income and interest
expense from debt used to finance a portion of the Phoenix purchase
price. $10,336,346 |
 14
2012
2011
% Change
2012
2011
% Change
Net cash provided by operating
activities
$193,186
$136,157
41.9%
$460,342
$429,712
7.1%
Capital expenditures, net
$11,765
$23,725
-50.4%
$50,656
$52,806
-4.1%
Three months ended December 31
Twelve months ended December 31
Quarter
Year to Date
Shares repurchased
1,452,903
4,237,555
Average price per
share
$61.92
$60.66
Total cost of shares
repurchased
$89,959
$257,064
December 31, 2012
Cash &
investments
$210,019
Current assets
$1,672,290
Total assets
$2,804,225
Debt
$253,646
Current liabilities
$1,232,217
Stockholders’
investment
$1,504,372
CASH FLOW DATA
2012
BALANCE SHEET DATA
REPURCHASES OF COMMON STOCK
Other Financial Information
In thousands, except share and per share amounts |
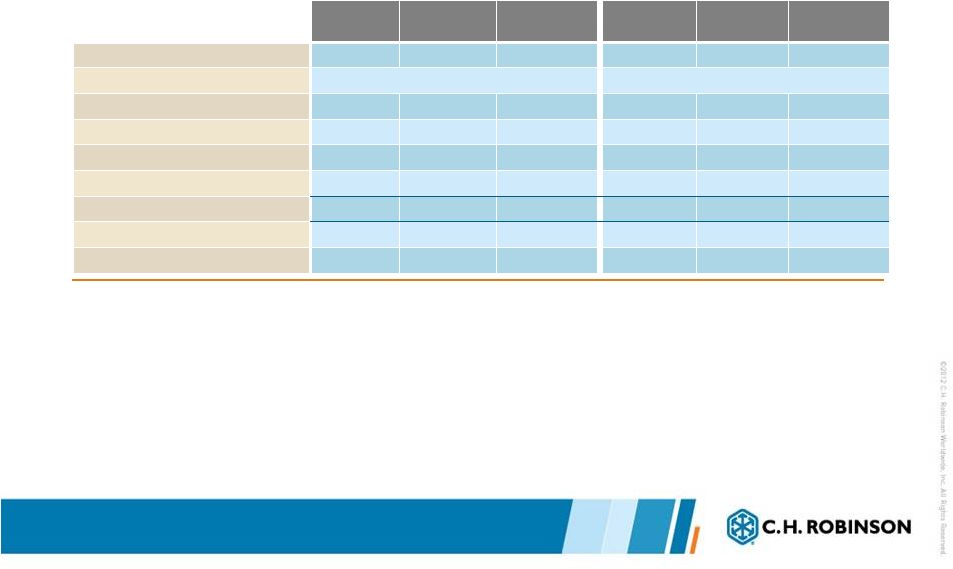
 15
Review of Unaudited Pro Forma Condensed Combined
Financial Information
•
Unaudited
pro
forma
condensed
combined
financial
information
for
the
company
should
be
reviewed with Form 8-K/A filed on January 14, 2013.
•
Phoenix, historically has had a higher transportation net revenue margin than C.H.
Robinson. In thousands
Historical
C.H. Robinson
Pro Forma
Phoenix including
purchase
accounting
Pro Forma
Combined
Historical
C.H. Robinson
Pro Forma Phoenix
including purchase
accounting
Pro Forma
Combined
Revenues:
Transportation
$8,740,524
$817,748
$9,558,272
$4,653,602
$414,303
$5,067,905
Sourcing
1,535,528
0
1,535,528
822,327
0
822,327
Information services
60,294
0
60,294
31,899
0
31,899
Total Revenues
$10,336,346
$817,748
$11,154,094
$5,507,828
$414,303
$5,922,131
Net Revenues:
Transportation
$1,443,916
$165,689
$1,609,605
$736,222
$82,920
$819,142
net revenue margin
16.5%
20.3%
16.8%
15.8%
20.0%
16.2%
Sourcing
128,448
0
128,448
72,148
0
72,148
net revenue margin
8.4%
0.0%
8.4%
8.8%
0.0%
8.8%
Information Services
60,294
0
60,294
31,899
0
31,899
net revenue margin
100.0%
0.0%
100.0%
100.0%
0.0%
100.0%
Total net revenues
$1,632,658
$165,689
$1,798,347
$840,269
$82,920
$923,189
net revenue margin
15.8%
20.3%
16.1%
15.3%
20.0%
15.6%
Year ended December 31, 2011
Six months ended June 30, 2012 |
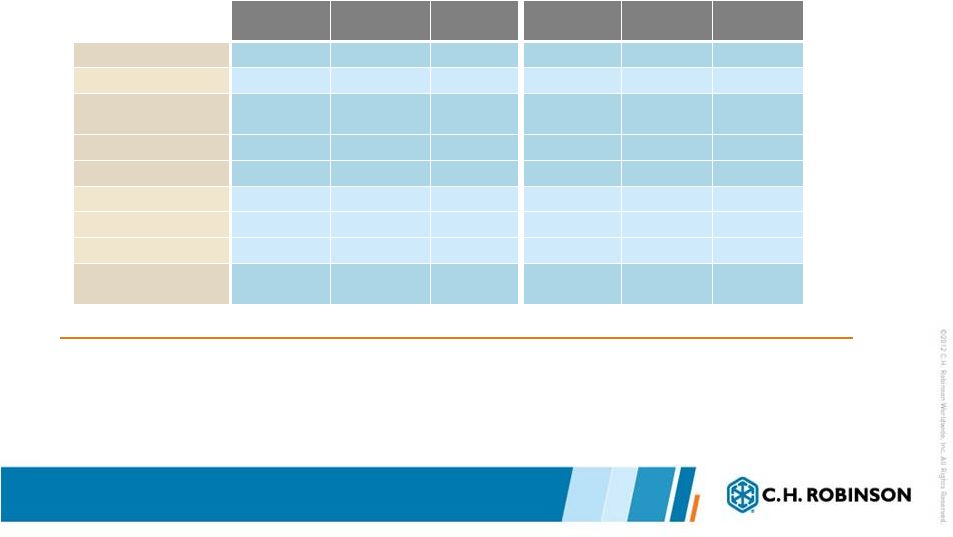
 16
Review of Unaudited Pro Forma Condensed Combined
Financial Information
•
Intangible asset amortization expense impacted operating expenses and operating
expenses as a percent of net revenue.
•
Phoenix, like similar international forwarding companies, has had a lower operating
income as a percent of net revenues compared to C.H. Robinson.
In thousands
Historical
C.H. Robinson
Pro Forma
Phoenix including
purchase
accounting
Pro Forma
Combined
Historical
C.H. Robinson
Pro Forma Phoenix
including purchase
accounting
Pro Forma
Combined
Total net revenues
$1,632,658
$165,689
$1,798,347
$840,269
$82,920
$923,189
Personnel expenses
696,233
79,177
775,410
360,622
41,100
401,722
percent of net revenues
42.6%
47.8%
43.1%
42.9%
49.6%
43.5%
Intangible asset amortization
0
16,265
16,265
0
8,133
8,133
percent of net revenues
0.0%
9.8%
0.9%
0.0%
9.8%
0.9%
Other operating expenses
243,695
33,341
277,036
125,188
18,750
143,938
percent of net revenues
14.9%
20.1%
15.4%
14.9%
22.6%
15.6%
Total operating expenses
$939,928
$128,783
$1,068,711
$485,810
$67,983
$553,793
percent of net revenues
57.6%
77.7%
59.4%
57.8%
82.0%
60.0%
Income from operations
$692,730
$36,906
$729,636
$354,459
$14,937
$369,396
percent of net revenues
42.4%
22.3%
40.6%
42.2%
18.0%
40.0%
Year ended December 31, 2011
Six months ended June 30, 2012 |
 17
2013
•
We will continue to expand our global network.
•
We expect continued growth with our Management & Integrated services.
•
Our productivity remains a critical success factor in our business.
•
We are committed to a successful deployment of Navisphere, our global
platform. •
Our people are a competitive advantage
•
Target capital structure strategy is being reviewed |
 |