Attached files
| file | filename |
|---|---|
| 8-K - FORM 8-K - Bristow Group Inc | d479732d8k.htm |
Third Quarter FY 2013 Earnings Presentation
Bristow Group Inc.
February 5, 2013
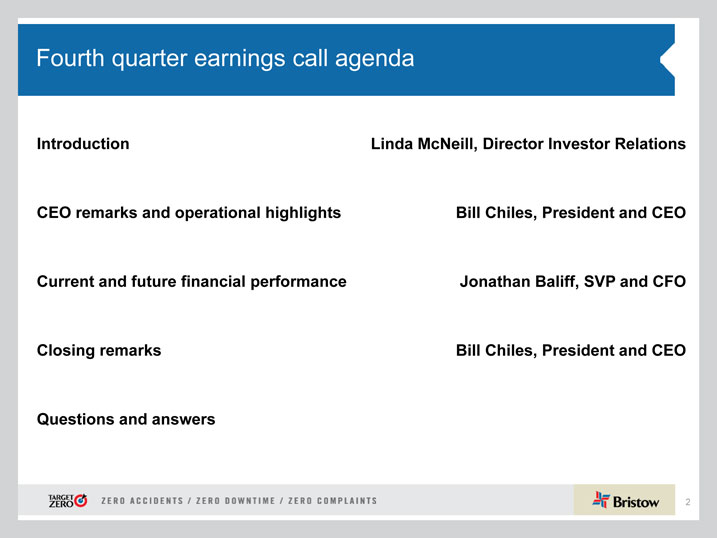
Fourth quarter earnings call agenda
Introduction Linda McNeill, Director Investor Relations
CEO remarks and operational highlights Bill Chiles, President and CEO
Current and future financial performance Jonathan Baliff, SVP and CFO
Closing remarks Bill Chiles, President and CEO
Questions and answers
| 2 |
|
Forward-looking statements
This presentation may contain “forward-looking statements” within the meaning of the Private Securities Litigation Reform Act of 1995. Forward-looking statements include statements about our future business, operations, capital expenditures, fleet composition, capabilities and results; modeling information, earnings and adjusted earnings growth guidance, expected operating margins and other financial projections; future dividends, share repurchase and other uses of excess cash; plans, strategies and objectives of our management, including our plans and strategies to grow earnings and our business, our general strategy going forward and our business model; expected actions by us and by third parties, including our customers, competitors and regulators impact of CAA grounding and the effects thereof; the valuation of our company and its valuation relative to relevant financial indices; assumptions underlying or relating to any of the foregoing, including assumptions regarding factors impacting our business, financial results and industry; and other matters. Our forward-looking statements reflect our views and assumptions on the date of this presentation regarding future events and operating performance. They involve known and unknown risks, uncertainties and other factors, many of which may be beyond our control, that may cause actual results to differ materially from any future results, performance or achievements expressed or implied by the forward-looking statements. These risks, uncertainties and other factors include those discussed under the captions “Risk Factors” and “Management’s Discussion and Analysis of Financial Condition and Results of Operations” in our Annual Report on Form 10-K for the fiscal year-ended March 31, 2012 and our Quarterly Report on Form 10-Q for the quarter ended December 31, 2012. We do not undertake any obligation, other than as required by law, to update or revise any forward-looking statements, whether as a result of new information, future events or otherwise.
| 3 |
|
Chief Executive Officer comments
Bill Chiles, President and CEO
| 4 |
|
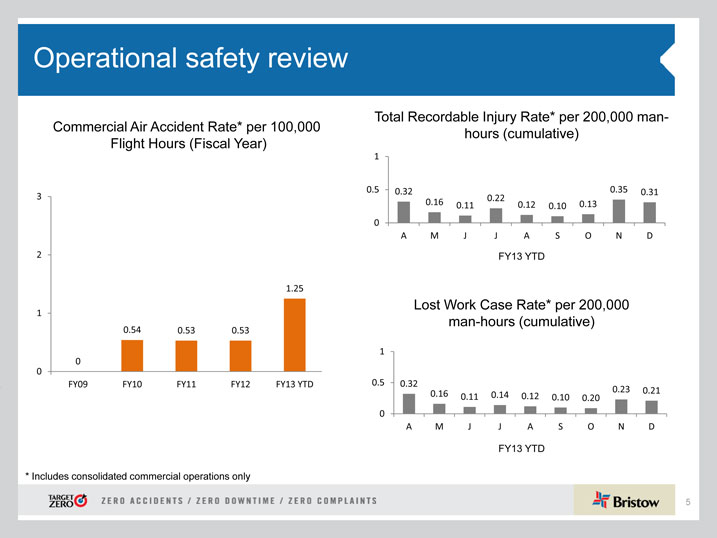
Operational safety review
Commercial Air Accident Rate* per 100,000 Flight Hours (Fiscal Year)
| 3 |
|
| 2 |
|
1.25
| 1 |
|
0.54 0.53 0.53
0 0
FY09 FY10 FY11 FY12 FY13 YTD
Total Recordable Injury Rate* per 200,000 man-hours (cumulative)
| 1 |
|
0.5 0.32 0.35 0.31 0.22 0.16 0.11 0.12 0.13 0.10 0 A M J J A S O N D
FY13 YTD
Lost Work Case Rate* per 200,000 man-hours (cumulative)
| 1 |
|
0.5 0.32
0.23 0.21 0.16 0.11 0.14 0.12 0.10 0.20 0 A M J J A S O N D
FY13 YTD
| * |
|
Includes consolidated commercial operations only |
| 5 |
|
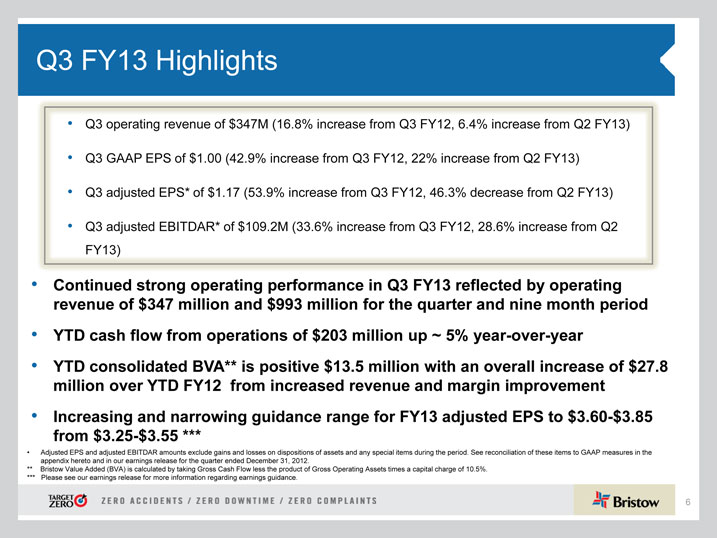
Q3 FY13 Highlights
• Q3 operating revenue of $347M (16.8% increase from Q3 FY12, 6.4% increase from Q2 FY13)
• Q3 GAAP EPS of $1.00 (42.9% increase from Q3 FY12, 22% increase from Q2 FY13)
• Q3 adjusted EPS* of $1.17 (53.9% increase from Q3 FY12, 46.3% decrease from Q2 FY13)
• Q3 adjusted EBITDAR* of $109.2M (33.6% increase from Q3 FY12, 28.6% increase from Q2 FY13)
• Continued strong operating performance in Q3 FY13 reflected by operating revenue of $347 million and $993 million for the quarter and nine month period
• YTD cash flow from operations of $203 million up ~ 5% year-over-year
• YTD consolidated BVA** is positive $13.5 million with an overall increase of $27.8 million over YTD FY12 from increased revenue and margin improvement
• Increasing and narrowing guidance range for FY13 adjusted EPS to $3.60-$3.85 from $3.25-$3.55 ***
• Adjusted EPS and adjusted EBITDAR amounts exclude gains and losses on dispositions of assets and any special items during the period. See reconciliation of these items to GAAP measures in the appendix hereto and in our earnings release for the quarter ended December 31, 2012.
** Bristow Value Added (BVA) is calculated by taking Gross Cash Flow less the product of Gross Operating Assets times a capital charge of 10.5%.
*** Please see our earnings release for more information regarding earnings guidance.
| 6 |
|
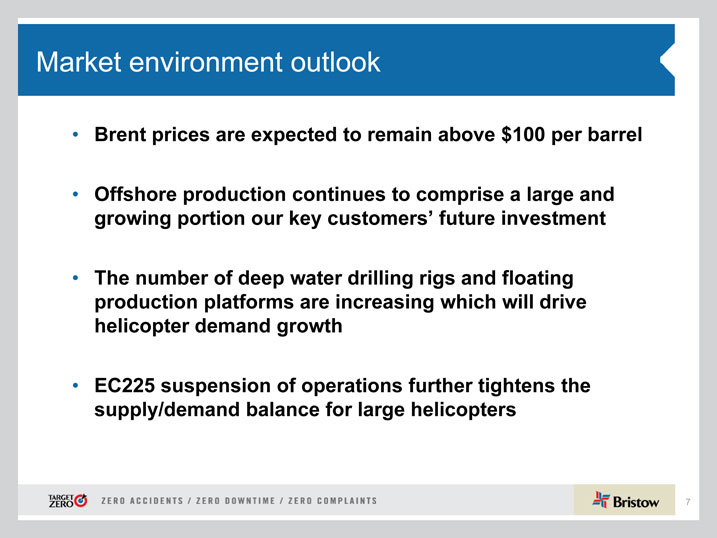
Market environment outlook
• Brent prices are expected to remain above $100 per barrel
• Offshore production continues to comprise a large and growing portion our key customers’ future investment
• The number of deep water drilling rigs and floating production platforms are increasing which will drive helicopter demand growth
• EC225 suspension of operations further tightens the supply/demand balance for large helicopters
| 7 |
|
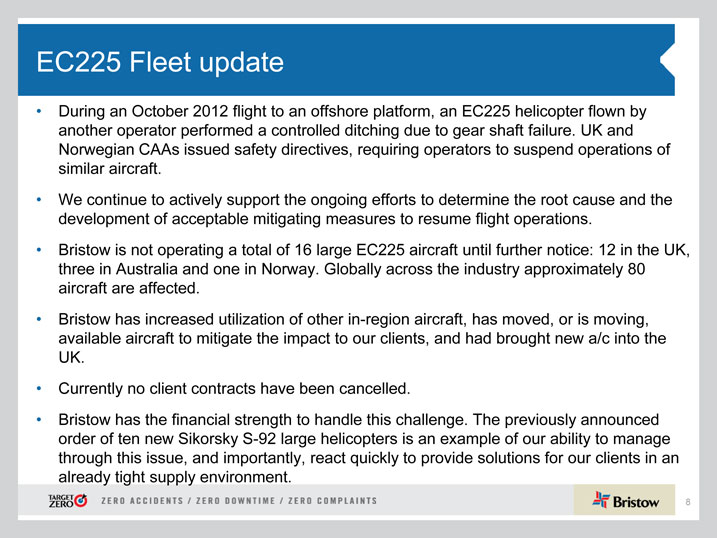
EC225 Fleet update
• During an October 2012 flight to an offshore platform, an EC225 helicopter flown by another operator performed a controlled ditching due to gear shaft failure. UK and Norwegian CAAs issued safety directives, requiring operators to suspend operations of similar aircraft.
• We continue to actively support the ongoing efforts to determine the root cause and the development of acceptable mitigating measures to resume flight operations.
• Bristow is not operating a total of 16 large EC225 aircraft until further notice: 12 in the UK, three in Australia and one in Norway. Globally across the industry approximately 80 aircraft are affected.
• Bristow has increased utilization of other in-region aircraft, has moved, or is moving, available aircraft to mitigate the impact to our clients, and had brought new a/c into the UK.
• Currently no client contracts have been cancelled.
• Bristow has the financial strength to handle this challenge. The previously announced order of ten new Sikorsky S-92 large helicopters is an example of our ability to manage through this issue, and importantly, react quickly to provide solutions for our clients in an already tight supply environment.
| 8 |
|
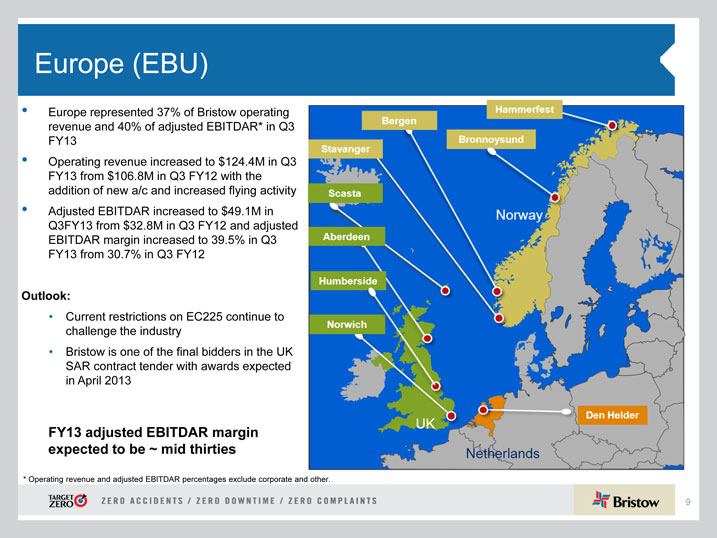
Europe (EBU)
• Europe represented 37% of Bristow operating revenue and 40% of adjusted EBITDAR* in Q3 FY13
• Operating revenue increased to $124.4M in Q3 FY13 from $106.8M in Q3 FY12 with the addition of new a/c and increased flying activity
• Adjusted EBITDAR increased to $49.1M in Q3FY13 from $32.8M in Q3 FY12 and adjusted EBITDAR margin increased to 39.5% in Q3 FY13 from 30.7% in Q3 FY12
Outlook:
• Current restrictions on EC225 continue to challenge the industry
• Bristow is one of the final bidders in the UK SAR contract tender with awards expected in April 2013
FY13 adjusted EBITDAR margin expected to be ~ mid thirties
| * |
|
Operating revenue and adjusted EBITDAR percentages exclude corporate and other. |
9
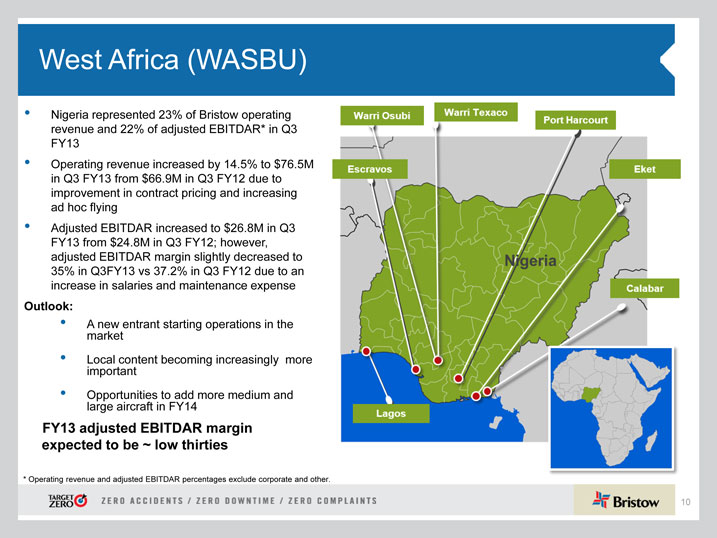
West Africa (WASBU)
• Nigeria represented 23% of Bristow operating revenue and 22% of adjusted EBITDAR* in Q3 FY13
• Operating revenue increased by 14.5% to $76.5M in Q3 FY13 from $66.9M in Q3 FY12 due to improvement in contract pricing and increasing ad hoc flying
• Adjusted EBITDAR increased to $26.8M in Q3 FY13 from $24.8M in Q3 FY12; however, adjusted EBITDAR margin slightly decreased to 35% in Q3FY13 vs 37.2% in Q3 FY12 due to an increase in salaries and maintenance expense
Outlook:
• A new entrant starting operations in the market
• Local content becoming increasingly more important
• Opportunities to add more medium and large aircraft in FY14
FY13 adjusted EBITDAR margin expected to be ~ low thirties
| * |
|
Operating revenue and adjusted EBITDAR percentages exclude corporate and other. |
10
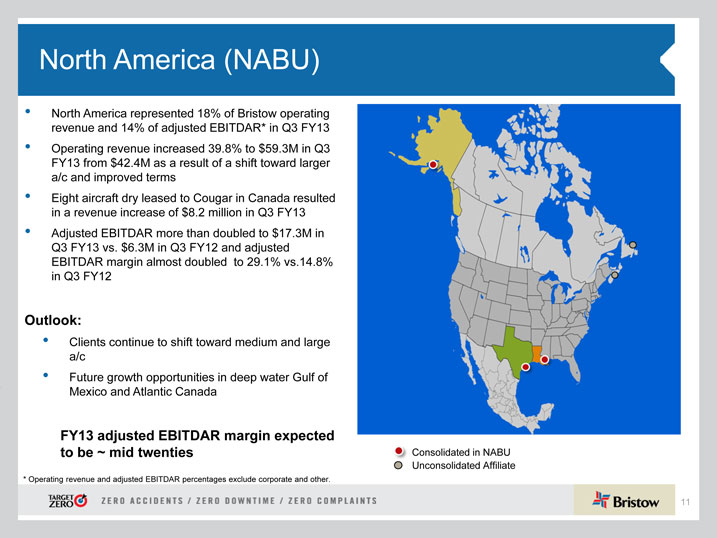
North America (NABU)
• North America represented 18% of Bristow operating revenue and 14% of adjusted EBITDAR* in Q3 FY13
• Operating revenue increased 39.8% to $59.3M in Q3 FY13 from $42.4M as a result of a shift toward larger a/c and improved terms
• Eight aircraft dry leased to Cougar in Canada resulted in a revenue increase of $8.2 million in Q3 FY13
• Adjusted EBITDAR more than doubled to $17.3M in Q3 FY13 vs. $6.3M in Q3 FY12 and adjusted EBITDAR margin almost doubled to 29.1% vs.14.8% in Q3 FY12
Outlook:
• Clients continue to shift toward medium and large a/c
• Future growth opportunities in deep water Gulf of Mexico and Atlantic Canada
FY13 adjusted EBITDAR margin expected to be ~ mid twenties Consolidated in NABU Unconsolidated Affiliate
| * |
|
Operating revenue and adjusted EBITDAR percentages exclude corporate and other. 11 |
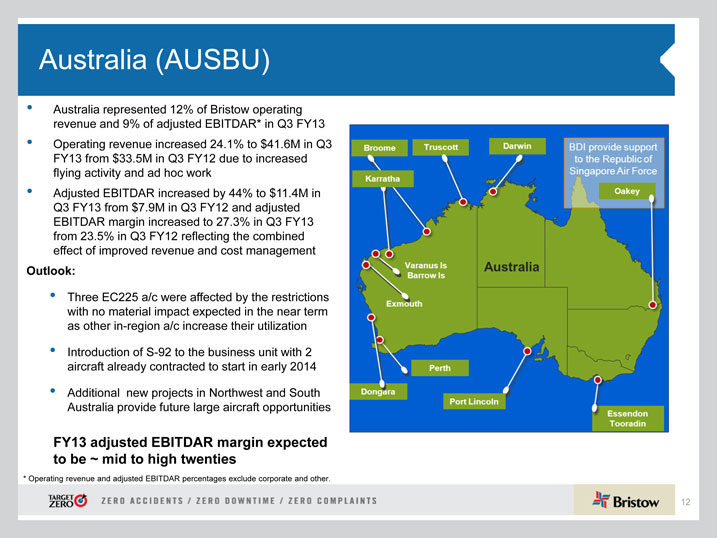
Australia (AUSBU)
• Australia represented 12% of Bristow operating revenue and 9% of adjusted EBITDAR* in Q3 FY13
• Operating revenue increased 24.1% to $41.6M in Q3 FY13 from $33.5M in Q3 FY12 due to increased flying activity and ad hoc work
• Adjusted EBITDAR increased by 44% to $11.4M in Q3 FY13 from $7.9M in Q3 FY12 and adjusted EBITDAR margin increased to 27.3% in Q3 FY13 from 23.5% in Q3 FY12 reflecting the combined effect of improved revenue and cost management
Outlook:
• Three EC225 a/c were affected by the restrictions with no material impact expected in the near term as other in-region a/c increase their utilization
• Introduction of S-92 to the business unit with 2 aircraft already contracted to start in early 2014
• Additional new projects in Northwest and South Australia provide future large aircraft opportunities
FY13 adjusted EBITDAR margin expected to be ~ mid to high twenties
| * |
|
Operating revenue and adjusted EBITDAR percentages exclude corporate and other. |
12
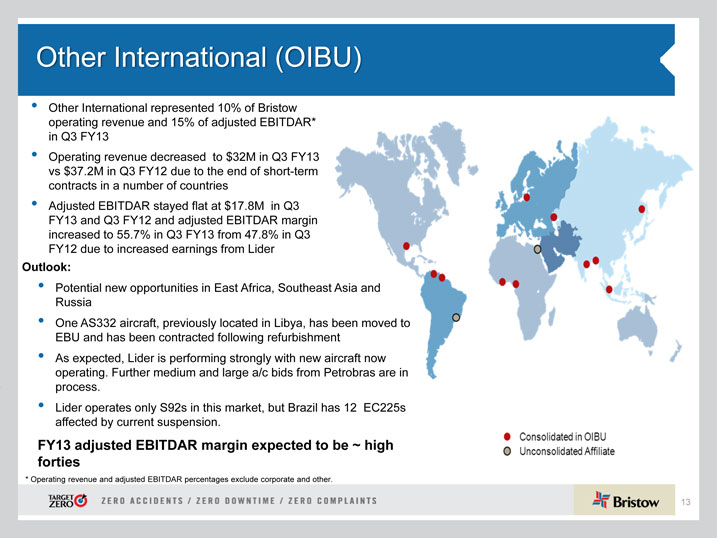
Other International (OIBU)
• Other International represented 10% of Bristow operating revenue and 15% of adjusted EBITDAR* in Q3 FY13
• Operating revenue decreased to $32M in Q3 FY13 vs $37.2M in Q3 FY12 due to the end of short-term contracts in a number of countries
• Adjusted EBITDAR stayed flat at $17.8M in Q3 FY13 and Q3 FY12 and adjusted EBITDAR margin increased to 55.7% in Q3 FY13 from 47.8% in Q3 FY12 due to increased earnings from Lider
Outlook:
• Potential new opportunities in East Africa, Southeast Asia and Russia
• One AS332 aircraft, previously located in Libya, has been moved to EBU and has been contracted following refurbishment
• As expected, Lider is performing strongly with new aircraft now operating. Further medium and large a/c bids from Petrobras are in process.
• Lider operates only S92s in this market, but Brazil has 12 EC225s affected by current suspension.
FY13 adjusted EBITDAR margin expected to be ~ high forties
| * |
|
Operating revenue and adjusted EBITDAR percentages exclude corporate and other. |
13
Financial discussion
Jonathan Baliff, SVP and CFO
14
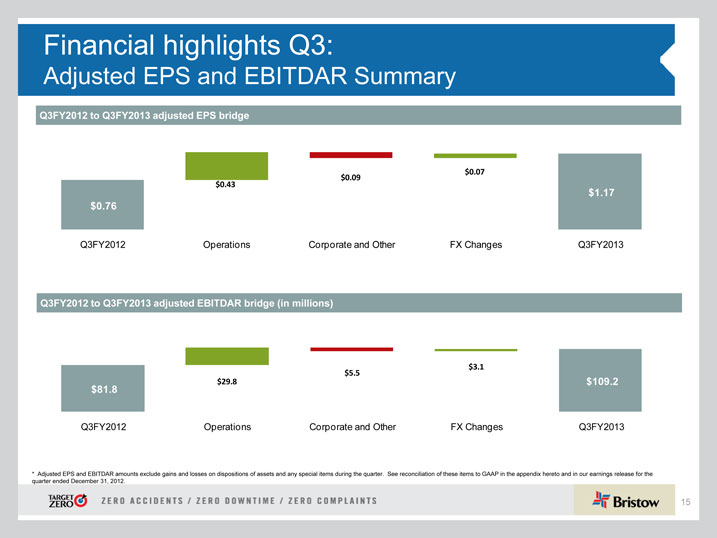
Financial highlights Q3:
Adjusted EPS and EBITDAR Summary
Q3FY2012 to Q3FY2013 adjusted EPS bridge
$0.07
$0.43 $0.09
$1.17
$0.76
Q3FY2012 Operations Corporate and Other FX Changes Q3FY2013
Q3FY2012 to Q3FY2013 adjusted EBITDAR bridge (in millions)
$5.5 $3.1
$29.8 $109.2
$81.8
Q3FY2012 Operations Corporate and Other FX Changes Q3FY2013
* Adjusted EPS and EBITDAR amounts exclude gains and losses on dispositions of assets and any special items during the quarter. See reconciliation of these items to GAAP in the appendix hereto and in our earnings release for the quarter ended December 31, 2012.
15
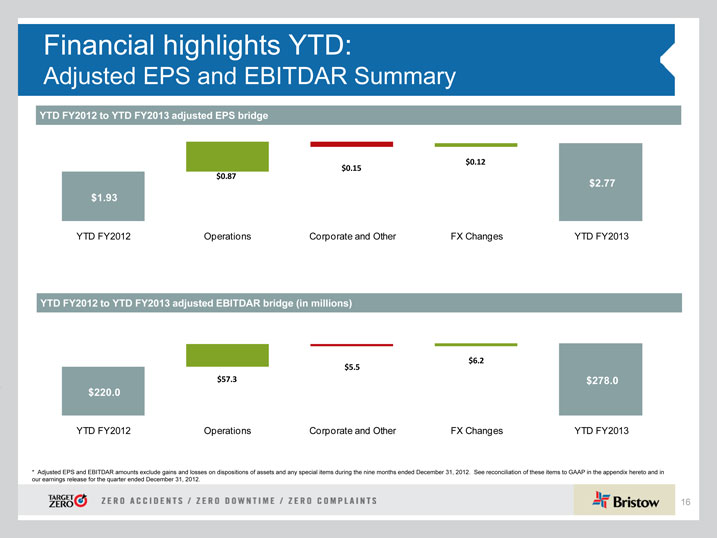
Financial highlights YTD:
Adjusted EPS and EBITDAR Summary
YTD FY2012 to YTD FY2013 adjusted EPS bridge
$0.15 $0.12 $0.87 $2.77 $1.93
YTD FY2012 Operations Corporate and Other FX Changes YTD FY2013
YTD FY2012 to YTD FY2013 adjusted EBITDAR bridge (in millions)
$5.5 $6.2 $57.3 $278.0 $220.0
YTD FY2012 Operations Corporate and Other FX Changes YTD FY2013
* Adjusted EPS and EBITDAR amounts exclude gains and losses on dispositions of assets and any special items during the nine months ended December 31, 2012. See reconciliation of these items to GAAP in the appendix hereto and in our earnings release for the quarter ended December 31, 2012.
16
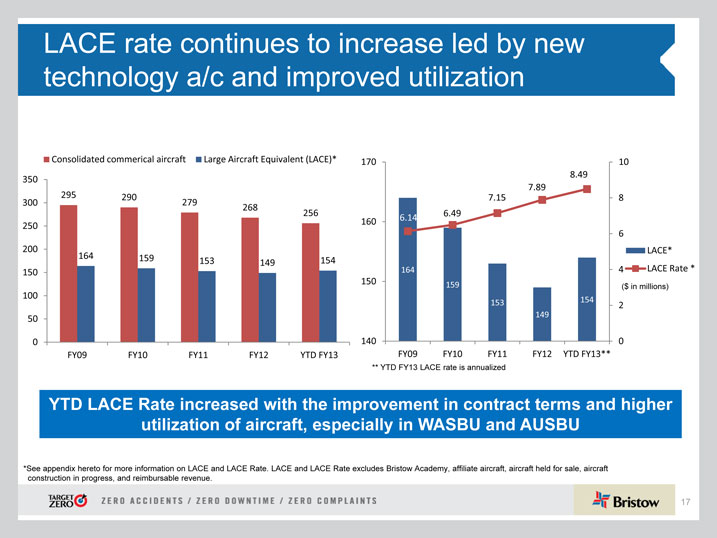
LACE rate continues to increase led by new technology a/c and improved utilization
Consolidated commerical aircraft Large Aircraft Equivalent (LACE)*
350
300 295 290 279
268
256 250
200
164 159
153 149 154 150
100
50
0
FY09 FY10 FY11 FY12 YTD FY13
170 10
8.49
7.89
7.15 8
6.49
160 6.14
| 6 |
|
LACE*
164 4 LACE Rate *
150 159 ($ in millions)
154
153 2
149
140 0
FY09 FY10 FY11 FY12 YTD FY13**
** YTD FY13 LACE rate is annualized
YTD LACE Rate increased with the improvement in contract terms and higher utilization of aircraft, especially in WASBU and AUSBU
*See appendix hereto for more information on LACE and LACE Rate. LACE and LACE Rate excludes Bristow Academy, affiliate aircraft, aircraft held for sale, aircraft construction in progress, and reimbursable revenue.
17
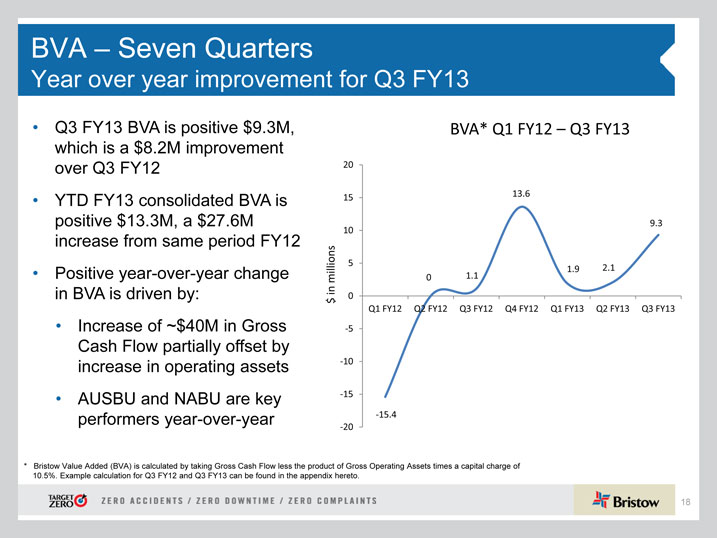
BVA – Seven Quarters
Year over year improvement for Q3 FY13
• Q3 FY13 BVA is positive $9.3M, which is a $8.2M improvement over Q3 FY12
• YTD FY13 consolidated BVA is positive $13.3M, a $27.6M increase from same period FY12
• Positive year-over-year change in BVA is driven by:
• Increase of ~$40M in Gross Cash Flow partially offset by increase in operating assets
• AUSBU and NABU are key performers year-over-year
BVA* Q1 FY12 – Q3 FY13
20
13.6 15
10 9.3
| 5 |
|
1.1 1.9 2.1 millions 0 in 0 $
Q1 FY12 Q2 FY12 Q3 FY12 Q4 FY12 Q1 FY13 Q2 FY13 Q3 FY13
? 5
? 10
? 15
? 15.4 ? 20
* Bristow Value Added (BVA) is calculated by taking Gross Cash Flow less the product of Gross Operating Assets times a capital charge of 10.5%. Example calculation for Q3 FY12 and Q3 FY13 can be found in the appendix hereto.
18
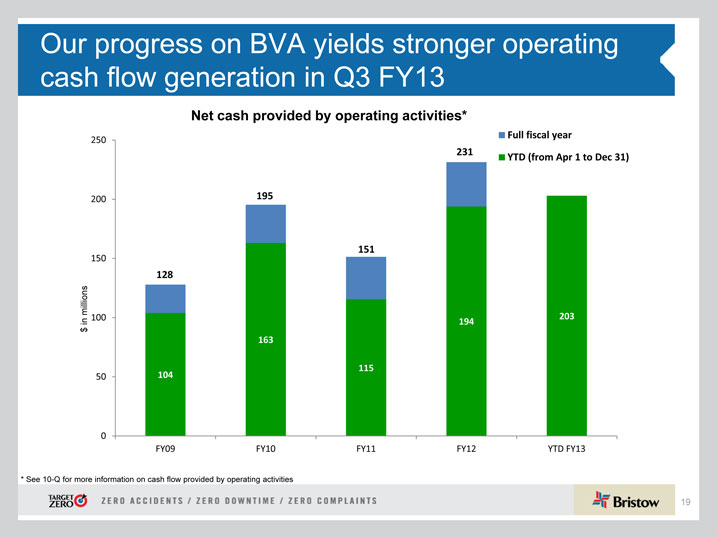
Our progress on BVA yields stronger operating cash flow generation in Q3 FY13
Net cash provided by operating activities*
250 Full fiscal year
231 YTD (from Apr 1 to Dec 31)
200 195
151
150
128
millions 100 203
in 194
$
163
115
50 104
0
FY09 FY10 FY11 FY12 YTD FY13
| * |
|
See 10-Q for more information on cash flow provided by operating activities |
19
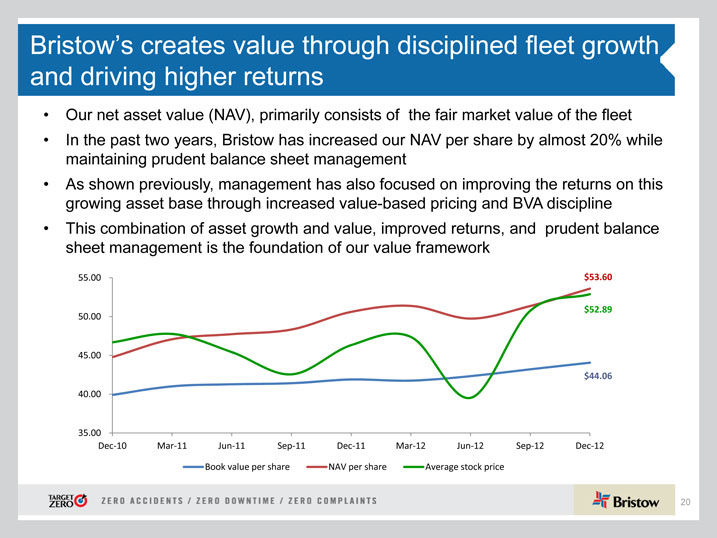
Bristow’s creates value through disciplined fleet growth and driving higher returns
• Our net asset value (NAV), primarily consists of the fair market value of the fleet
• In the past two years, Bristow has increased our NAV per share by almost 20% while maintaining prudent balance sheet management
• As shown previously, management has also focused on improving the returns on this growing asset base through increased value-based pricing and BVA discipline
• This combination of asset growth and value, improved returns, and prudent balance sheet management is the foundation of our value framework
55.00 $53.60
$52.89
50.00
45.00
$44.06
40.00
35.00
Dec?10 Mar?11 Jun?11 Sep?11 Dec?11 Mar?12 Jun?12 Sep?12 Dec?12
Book value per share NAV per share Average stock price
20
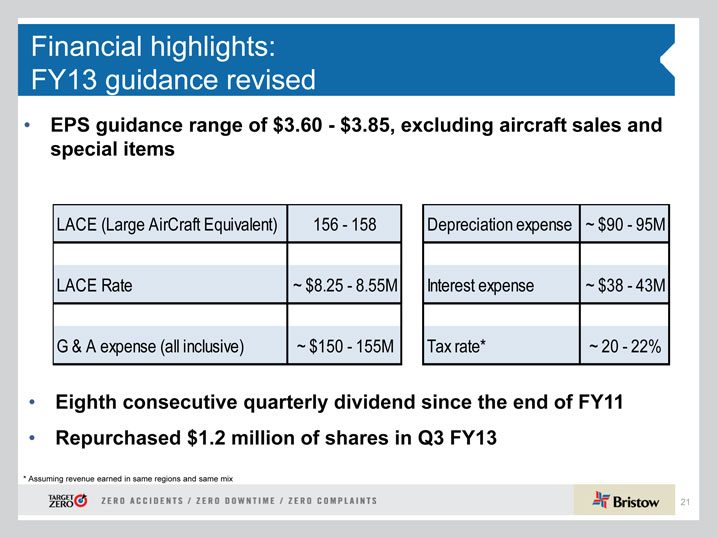
Financial highlights: FY13 guidance revised
• EPS guidance range of $3.60—$3.85, excluding aircraft sales and special items
LACE (Large AirCraft Equivalent) 156—158 LACE Rate ~ $8.25—8.55M G & A expense (all inclusive) ~ $150—155M
Depreciation expense ~ $90—95M Interest expense ~ $38—43M Tax rate* ~ 20—22%
• Eighth consecutive quarterly dividend since the end of FY11
• Repurchased $1.2 million of shares in Q3 FY13
| * |
|
Assuming revenue earned in same regions and same mix |
21
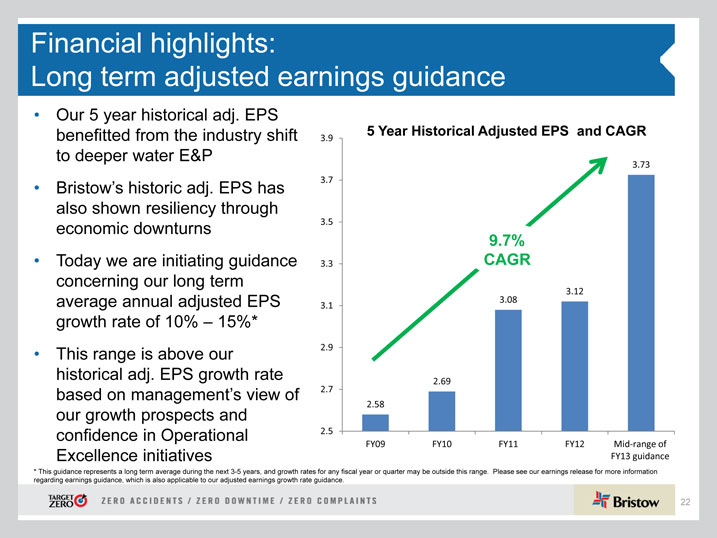
Financial highlights:
Long term adjusted earnings guidance
• Our 5 year historical adj. EPS benefitted from the industry shift to deeper water E&P
• Bristow’s historic adj. EPS has also shown resiliency through economic downturns
• Today we are initiating guidance concerning our long term average annual adjusted EPS growth rate of 10% – 15%*
• This range is above our historical adj. EPS growth rate based on management’s view of our growth prospects and confidence in Operational Excellence initiatives
3.9 5 Year Historical Adjusted EPS and CAGR
3.73
3.7
3.5
9.7%
3.3 CAGR
3.12
3.08
3.1
2.9
2.69
2.7
2.58
2.5
FY09 FY10 FY11 FY12 Mid?range of
FY13 guidance
* This guidance represents a long term average during the next 3-5 years, and growth rates for any fiscal year or quarter may be outside this range. Please see our earnings release for more information regarding earnings guidance, which is also applicable to our adjusted earnings growth rate guidance.
22
Conclusions
• Safety continues to be our # 1 priority as we strive to achieve Target Zero
• We anticipate continued improvement in revenue generation through new contract awards across all business units
• Higher year-over-year EBITDAR and BVA demonstrate the strength of our business model, especially with the investment in Cougar
• Prudent balance sheet allows us to respond to and successfully manage through industry challenges such as the EC225 suspension of operations
23
Appendix
24
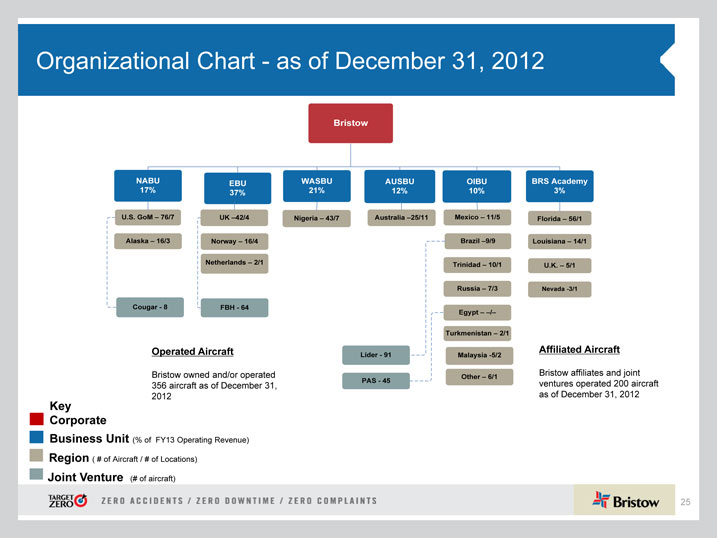
Organizational Chart—as of December 31, 2012
Operated Aircraft Affiliated Aircraft
Bristow owned and/or operated Bristow affiliates and joint 356 aircraft as of December 31, ventures operated 200 aircraft 2012 as of December 31, 2012
Key Corporate
Business Unit (% of FY13 Operating Revenue) Region ( # of Aircraft / # of Locations)
Joint Venture (# of aircraft)
25
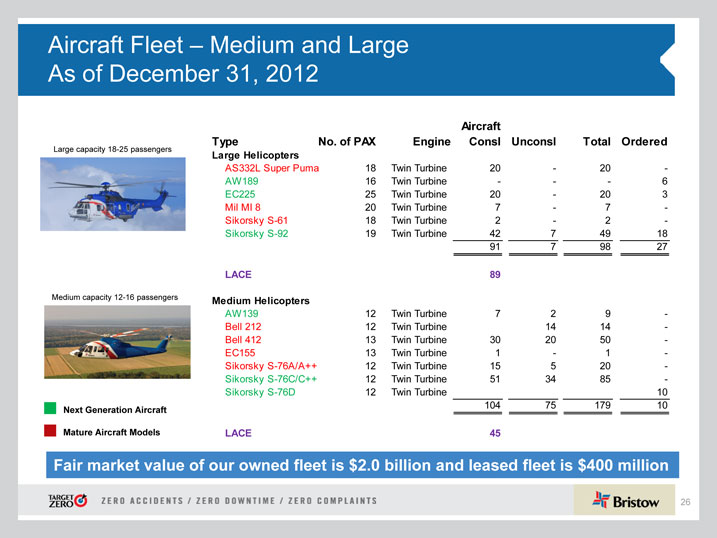
Aircraft Fleet – Medium and Large As of December 31, 2012
Aircraft
Type No. of PAX Engine Consl Unconsl Total Ordered
Large capacity 18-25 passengers Large Helicopters
AS332L Super Puma 18 Twin Turbine 20—20—
AW189 16 Twin Turbine——6
EC225 25 Twin Turbine 20—20 3
Mil MI 8 20 Twin Turbine 7—7—
Sikorsky S-61 18 Twin Turbine 2—2—
Sikorsky S-92 19 Twin Turbine 42 7 49 18
91 7 98 27
LACE 89
Medium capacity 12-16 passengers Medium Helicopters
AW139 12 Twin Turbine 7 2 9—
Bell 212 12 Twin Turbine 14 14—
Bell 412 13 Twin Turbine 30 20 50—
EC155 13 Twin Turbine 1—1—
Sikorsky S-76A/A++ 12 Twin Turbine 15 5 20—
Sikorsky S-76C/C++ 12 Twin Turbine 51 34 85—
Sikorsky S-76D 12 Twin Turbine 10
Next Generation Aircraft 104 75 179 10
Mature Aircraft Models LACE 45
Fair market value of our owned fleet is $2.0 billion and leased fleet is $400 million
26
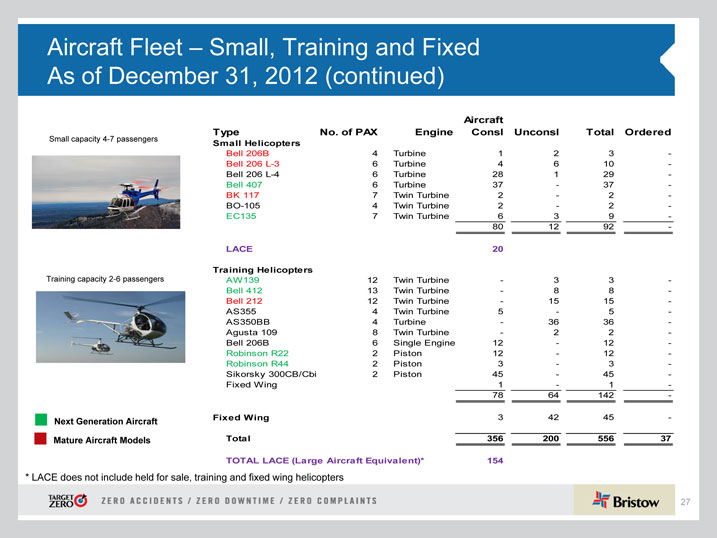
Aircraft Fleet – Small, Training and Fixed As of December 31, 2012 (continued)
Aircraft
Type No. of PAX Engine Consl Unconsl Total Ordered
Small capacity 4-7 passengers
Small Helicopters
Bell 206B 4 Turbine 1 2 3—Bell 206 L-3 6 Turbine 4 6 10—Bell 206 L-4 6 Turbine 28 1 29—Bell 407 6 Turbine 37—37—BK 117 7 Twin Turbine 2—2—BO-105 4 Twin Turbine 2—2—EC135 7 Twin Turbine 6 3 9—
80 12 92—
LACE 20
Training Helicopters
Training capacity 2-6 passengers AW139 12 Twin Turbine—3 3—
Bell 412 13 Twin Turbine—8 8—Bell 212 12 Twin Turbine—15 15—AS355 4 Twin Turbine 5—5—AS350BB 4 Turbine—36 36—Agusta 109 8 Twin Turbine—2 2—Bell 206B 6 Single Engine 12—12—Robinson R22 2 Piston 12—12—Robinson R44 2 Piston 3—3—Sikorsky 300CB/Cbi 2 Piston 45—45—Fixed Wing 1—1—
78 64 142—
Next Generation Aircraft Fixed Wing 3 42 45—Mature Aircraft Models Total 356 200 556 37
TOTAL LACE (Large Aircraft Equivalent)* 154
| * |
|
LACE does not include held for sale, training and fixed wing helicopters |
27
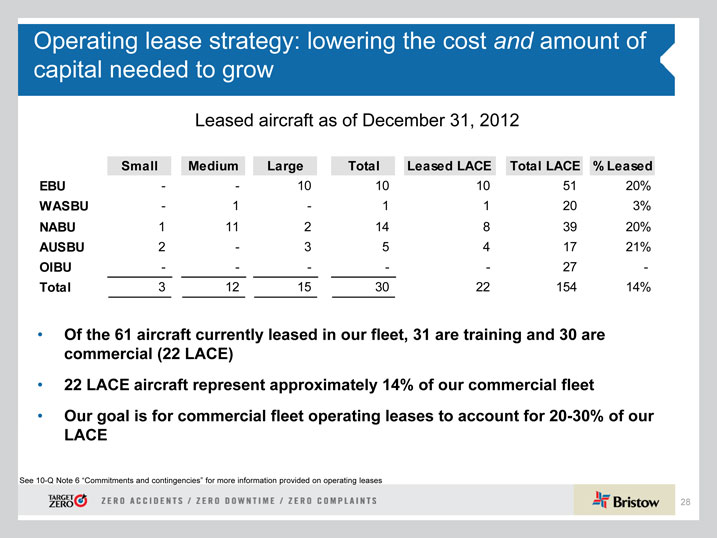
Operating lease strategy: lowering the cost and amount of capital needed to grow
Leased aircraft as of December 31, 2012
Small Medium Large Total Leased LACE Total LACE % Leased
EBU—10 10 10 51 20%
WASBU—1—1 1 20 3%
NABU 1 11 2 14 8 39 20%
AUSBU 2—3 5 4 17 21%
OIBU———27—
Total 3 12 15 30 22 154 14%
• Of the 61 aircraft currently leased in our fleet, 31 are training and 30 are commercial (22 LACE)
• 22 LACE aircraft represent approximately 14% of our commercial fleet
• Our goal is for commercial fleet operating leases to account for 20-30% of our LACE
See 10-Q Note 6 “Commitments and contingencies” for more information provided on operating leases
28
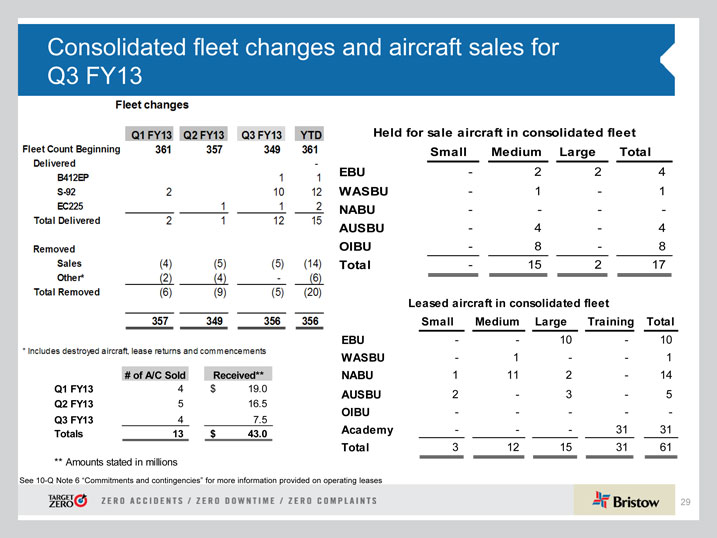
Consolidated fleet changes and aircraft sales for Q3 FY13
# of A/C Sold Received**
Q1 FY13 4 $ 19.0
Q2 FY13 5 16.5
Q3 FY13 4 7.5
Totals 13 $ 43.0
** Amounts stated in millions
Held for sale aircraft in consolidated fleet
Small Medium Large Total
EBU—2 2 4
WASBU—1—1
NABU——
AUSBU—4—4
OIBU—8—8
Total—15 2 17
Leased aircraft in consolidated fleet
Small Medium Large Training Total
EBU—10—10
WASBU—1—1
NABU 1 11 2—14
AUSBU 2—3—5
OIBU———
Academy——31 31
Total 3 12 15 31 61
See 10-Q Note 6 “Commitments and contingencies” for more information provided on operating leases
29
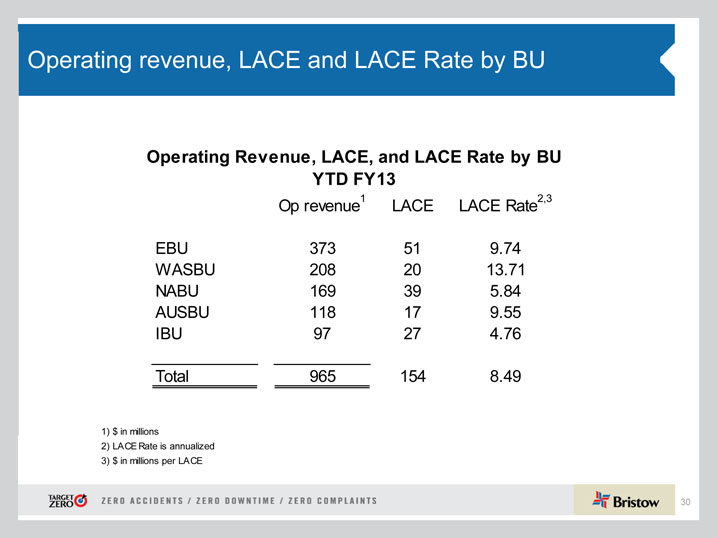
Operating revenue, LACE and LACE Rate by BU
Operating Revenue, LACE, and LACE Rate by BU YTD FY13
Op revenue1 LACE LACE Rate2,3
EBU 373 51 9.74
WASBU 208 20 13.71
NABU 169 39 5.84
AUSBU 118 17 9.55
IBU 97 27 4.76
Total 965 154 8.49
1) $ in millions
2) LACE Rate is annualized 3) $ in millions per LACE
30
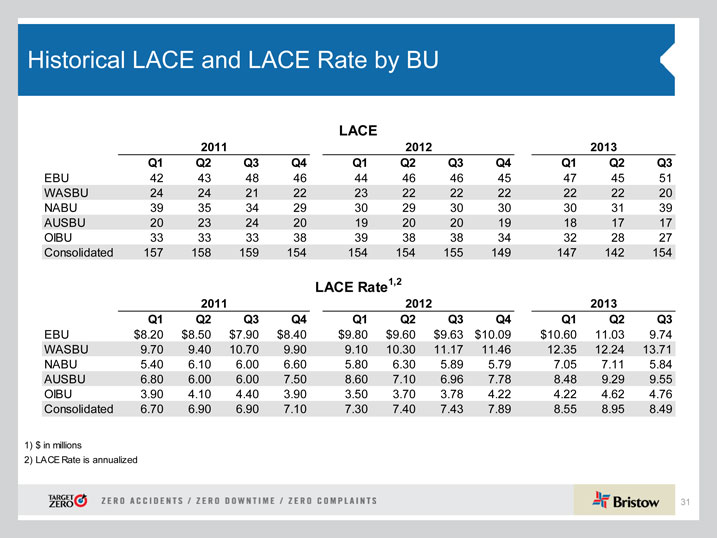
Historical LACE and LACE Rate by BU
LACE
2011 2012 2013
Q1 Q2 Q3 Q4 Q1 Q2 Q3 Q4 Q1 Q2 Q3
EBU 42 43 48 46 44 46 46 45 47 45 51
WASBU 24 24 21 22 23 22 22 22 22 22 20
NABU 39 35 34 29 30 29 30 30 30 31 39
AUSBU 20 23 24 20 19 20 20 19 18 17 17
OIBU 33 33 33 38 39 38 38 34 32 28 27
Consolidated 157 158 159 154 154 154 155 149 147 142 154
LACE Rate1,2
2011 2012 2013
Q1 Q2 Q3 Q4 Q1 Q2 Q3 Q4 Q1 Q2 Q3
EBU $8.20 $8.50 $7.90 $8.40 $9.80 $9.60 $9.63 $10.09 $10.60 11.03 9.74
WASBU 9.70 9.40 10.70 9.90 9.10 10.30 11.17 11.46 12.35 12.24 13.71
NABU 5.40 6.10 6.00 6.60 5.80 6.30 5.89 5.79 7.05 7.11 5.84
AUSBU 6.80 6.00 6.00 7.50 8.60 7.10 6.96 7.78 8.48 9.29 9.55
OIBU 3.90 4.10 4.40 3.90 3.50 3.70 3.78 4.22 4.22 4.62 4.76
Consolidated 6.70 6.90 6.90 7.10 7.30 7.40 7.43 7.89 8.55 8.95 8.49
1) $ in millions
2) LACE Rate is annualized
31
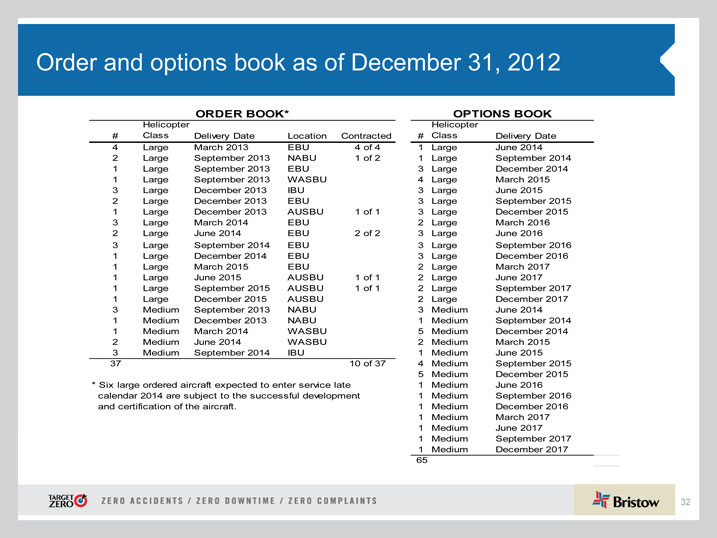
Order and options book as of December 31, 2012
ORDER BOOK*
Helicopter
# Class Delivery Date Location Contracted
| 4 |
|
Large March 2013 EBU 4 of 4 |
| 2 |
|
Large September 2013 NABU 1 of 2 |
| 1 |
|
Large September 2013 EBU |
| 1 |
|
Large September 2013 WASBU |
| 3 |
|
Large December 2013 IBU |
| 2 |
|
Large December 2013 EBU |
| 1 |
|
Large December 2013 AUSBU 1 of 1 |
| 3 |
|
Large March 2014 EBU |
| 2 |
|
Large June 2014 EBU 2 of 2 |
| 3 |
|
Large September 2014 EBU |
| 1 |
|
Large December 2014 EBU |
| 1 |
|
Large March 2015 EBU |
| 1 |
|
Large June 2015 AUSBU 1 of 1 |
| 1 |
|
Large September 2015 AUSBU 1 of 1 |
| 1 |
|
Large December 2015 AUSBU |
| 3 |
|
Medium September 2013 NABU |
| 1 |
|
Medium December 2013 NABU |
| 1 |
|
Medium March 2014 WASBU |
| 2 |
|
Medium June 2014 WASBU |
| 3 |
|
Medium September 2014 IBU |
37 10 of 37
* Six large ordered aircraft expected to enter service late calendar 2014 are subject to the successful development and certification of the aircraft.
OPTIONS BOOK
Helicopter
# Class Delivery Date
| 1 |
|
Large June 2014 |
| 1 |
|
Large September 2014 |
| 3 |
|
Large December 2014 |
| 4 |
|
Large March 2015 |
| 3 |
|
Large June 2015 |
| 3 |
|
Large September 2015 |
| 3 |
|
Large December 2015 |
| 2 |
|
Large March 2016 |
| 3 |
|
Large June 2016 |
| 3 |
|
Large September 2016 |
| 3 |
|
Large December 2016 |
| 2 |
|
Large March 2017 |
| 2 |
|
Large June 2017 |
| 2 |
|
Large September 2017 |
| 2 |
|
Large December 2017 |
| 3 |
|
Medium June 2014 |
| 1 |
|
Medium September 2014 |
| 5 |
|
Medium December 2014 |
| 2 |
|
Medium March 2015 |
| 1 |
|
Medium June 2015 |
| 4 |
|
Medium September 2015 |
| 5 |
|
Medium December 2015 |
| 1 |
|
Medium June 2016 |
| 1 |
|
Medium September 2016 |
| 1 |
|
Medium December 2016 |
| 1 |
|
Medium March 2017 |
| 1 |
|
Medium June 2017 |
| 1 |
|
Medium September 2017 |
| 1 |
|
Medium December 2017 |
65
32
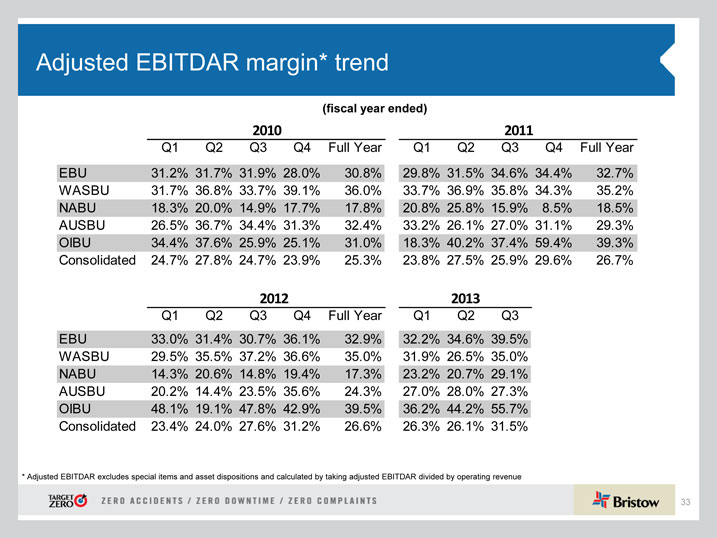
Adjusted EBITDAR margin* trend
(fiscal year ended)
2010 2011
Q1 Q2 Q3 Q4 Full Year Q1 Q2 Q3 Q4 Full Year
EBU 31.2% 31.7% 31.9% 28.0% 30.8% 29.8% 31.5% 34.6% 34.4% 32.7%
WASBU 31.7% 36.8% 33.7% 39.1% 36.0% 33.7% 36.9% 35.8% 34.3% 35.2%
NABU 18.3% 20.0% 14.9% 17.7% 17.8% 20.8% 25.8% 15.9% 8.5% 18.5%
AUSBU 26.5% 36.7% 34.4% 31.3% 32.4% 33.2% 26.1% 27.0% 31.1% 29.3%
OIBU 34.4% 37.6% 25.9% 25.1% 31.0% 18.3% 40.2% 37.4% 59.4% 39.3%
Consolidated 24.7% 27.8% 24.7% 23.9% 25.3% 23.8% 27.5% 25.9% 29.6% 26.7%
2012 2013
Q1 Q2 Q3 Q4 Full Year Q1 Q2 Q3
EBU 33.0% 31.4% 30.7% 36.1% 32.9% 32.2% 34.6% 39.5%
WASBU 29.5% 35.5% 37.2% 36.6% 35.0% 31.9% 26.5% 35.0%
NABU 14.3% 20.6% 14.8% 19.4% 17.3% 23.2% 20.7% 29.1%
AUSBU 20.2% 14.4% 23.5% 35.6% 24.3% 27.0% 28.0% 27.3%
OIBU 48.1% 19.1% 47.8% 42.9% 39.5% 36.2% 44.2% 55.7%
Consolidated 23.4% 24.0% 27.6% 31.2% 26.6% 26.3% 26.1% 31.5%
* Adjusted EBITDAR excludes special items and asset dispositions and calculated by taking adjusted EBITDAR divided by operating revenue
33
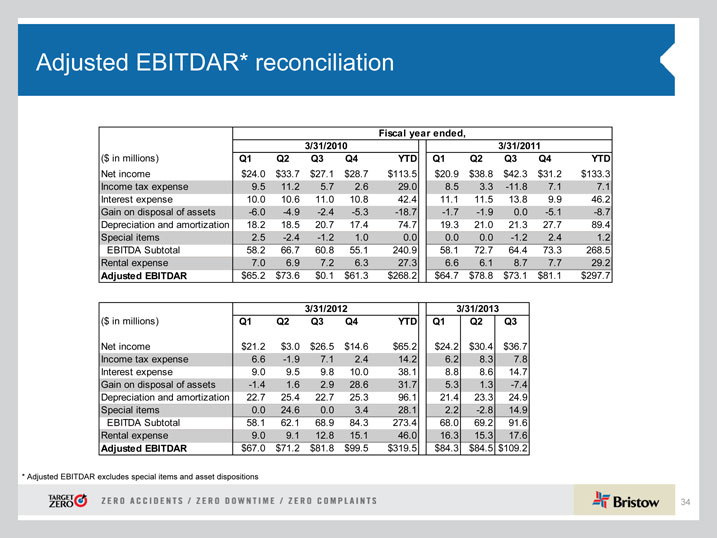
Adjusted EBITDAR* reconciliation
Fiscal year ended,
3/31/2010 3/31/2011
($ in millions) Q1 Q2 Q3 Q4 YTD Q1 Q2 Q3 Q4 YTD
Net income $24.0 $33.7 $27.1 $28.7 $113.5 $20.9 $38.8 $42.3 $31.2 $133.3
Income tax expense 9.5 11.2 5.7 2.6 29.0 8.5 3.3—11.8 7.1 7.1
Interest expense 10.0 10.6 11.0 10.8 42.4 11.1 11.5 13.8 9.9 46.2
Gain on disposal of assets—6.0—4.9—2.4—5.3—18.7—1.7—1.9 0.0—5.1—8.7
Depreciation and amortization 18.2 18.5 20.7 17.4 74.7 19.3 21.0 21.3 27.7 89.4
Special items 2.5—2.4—1.2 1.0 0.0 0.0 0.0—1.2 2.4 1.2
EBITDA Subtotal 58.2 66.7 60.8 55.1 240.9 58.1 72.7 64.4 73.3 268.5
Rental expense 7.0 6.9 7.2 6.3 27.3 6.6 6.1 8.7 7.7 29.2
Adjusted EBITDAR $65.2 $73.6 $0.1 $61.3 $268.2 $64.7 $78.8 $73.1 $81.1 $297.7
3/31/2012 3/31/2013
($ in millions) Q1 Q2 Q3 Q4 YTD Q1 Q2 Q3
Net income $21.2 $3.0 $26.5 $14.6 $65.2 $24.2 $30.4 $36.7
Income tax expense 6.6—1.9 7.1 2.4 14.2 6.2 8.3 7.8
Interest expense 9.0 9.5 9.8 10.0 38.1 8.8 8.6 14.7
Gain on disposal of assets—1.4 1.6 2.9 28.6 31.7 5.3 1.3—7.4
Depreciation and amortization 22.7 25.4 22.7 25.3 96.1 21.4 23.3 24.9
Special items 0.0 24.6 0.0 3.4 28.1 2.2—2.8 14.9
EBITDA Subtotal 58.1 62.1 68.9 84.3 273.4 68.0 69.2 91.6
Rental expense 9.0 9.1 12.8 15.1 46.0 16.3 15.3 17.6
Adjusted EBITDAR $67.0 $71.2 $81.8 $99.5 $319.5 $84.3 $84.5 $109.2
| * |
|
Adjusted EBITDAR excludes special items and asset dispositions |
34
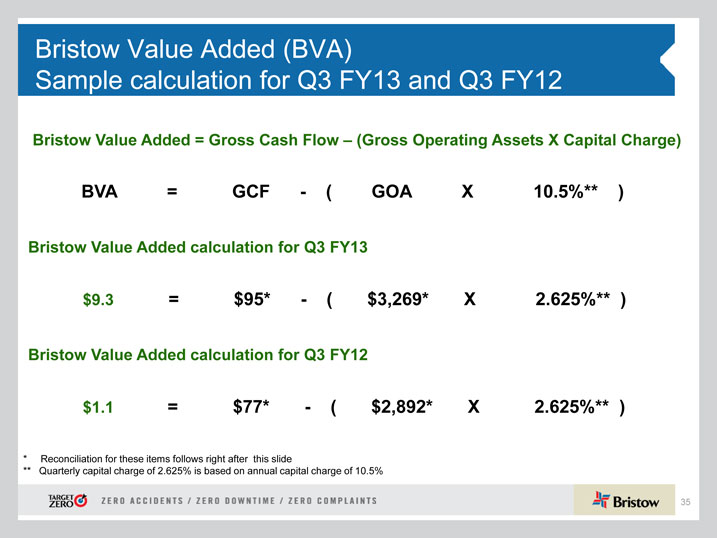
Bristow Value Added (BVA)
Sample calculation for Q3 FY13 and Q3 FY12
Bristow Value Added = Gross Cash Flow – (Gross Operating Assets X Capital Charge) BVA = GCF—( GOA X 10.5%** ) Bristow Value Added calculation for Q3 FY13 $9.3 = $95*—( $3,269* X 2.625%** ) Bristow Value Added calculation for Q3 FY12 $1.1 = $77*—( $2,892* X 2.625%** )
| * |
|
Reconciliation for these items follows right after this slide |
** Quarterly capital charge of 2.625% is based on annual capital charge of 10.5%
35
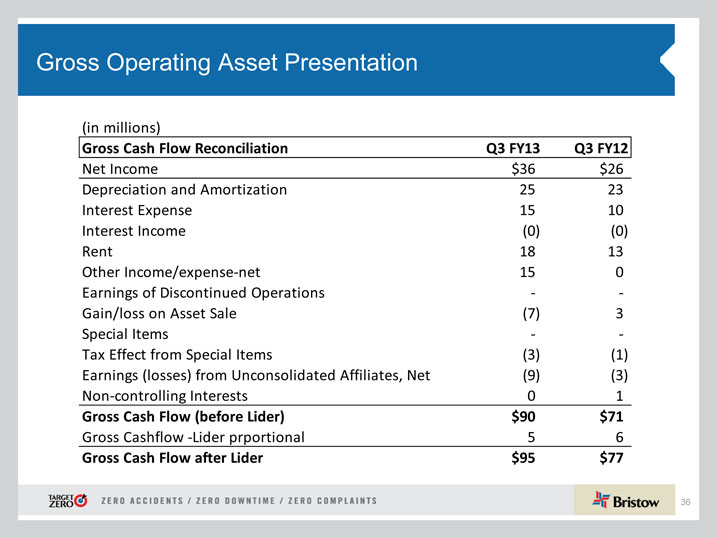
Gross Operating Asset Presentation
(in millions)
Gross Cash Flow Reconciliation Q3 FY13 Q3 FY12
Net Income $36 $26
Depreciation and Amortization 25 23
Interest Expense 15 10
Interest Income (0) (0)
Rent 18 13
Other Income/expense?net 15 0
Earnings of Discontinued Operations ? ?
Gain/loss on Asset Sale (7) 3
Special Items ? ?
Tax Effect from Special Items (3) (1)
Earnings (losses) from Unconsolidated Affiliates, Net (9) (3)
Non?controlling Interests 0 1
Gross Ca Flow (beforesh Lider) $90 $71
Gross Cashflow ?Lider prportional 5 6
Gross Cash Flow after Lider $95 $77
36
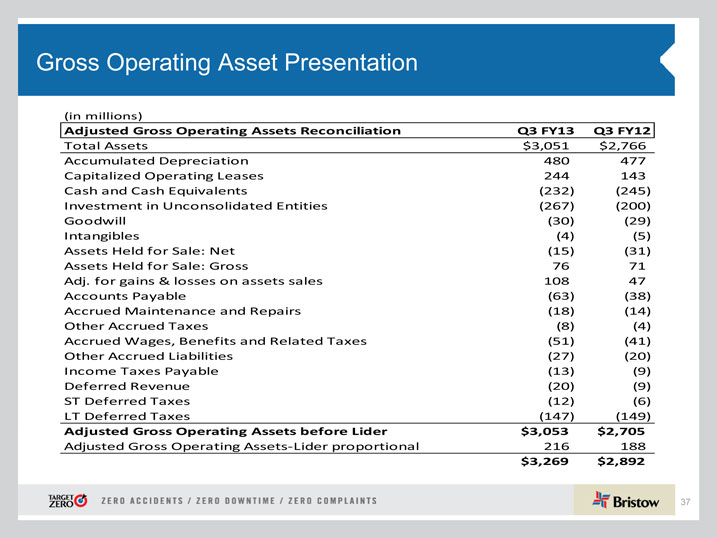
Gross Operating Asset Presentation
(in millions)
Adjusted Gross Operating Assets Reconciliation Q3 FY13 Q3 FY12
Total Assets $3,051 $2,766
Accumulated Depreciation 480 477
Capitalized Operating Leases 244 143
Cash and Cash Equivalents (232) (245)
Investment in Unconsolidated Entities (267) (200)
Goodwill (30) (29)
Intangibles (4) (5)
Assets Held for Sale: Net (15) (31)
Assets Held for Sale: Gross 76 71
Adj. for gains & losses on assets sales 108 47
Accounts Payable (63) (38)
Accrued Maintenance and Repairs (18) (14)
Other Accrued Taxes (8) (4)
Accrued Wages, Benefits and Related Taxes (51) (41)
Other Accrued Liabilities (27) (20)
Income Taxes Payable (13) (9)
Deferred Revenue (20) (9)
ST Deferred Taxes (12) (6)
LT Deferred Taxes (147) (149)
Adjusted Gross Operating Assets before Lider $3,053 $2,705
Adjusted Gross Operating Assets?Lider proportional 216 188
$3,269 $2,892
37
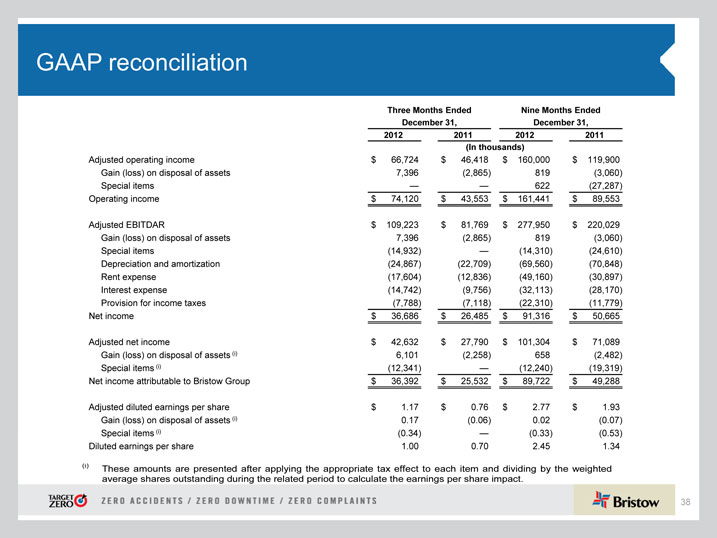
GAAP reconciliation
Three Months Ended Nine Months Ended
December 31, December 31,
2012 2011 2012 2011
(In thousands)
Adjusted operating income $ 66,724 $ 46,418 $ 160,000 $ 119,900
Gain (loss) on disposal of assets 7,396 (2,865) 819 (3,060)
Special items — — 622 (27,287)
Operating income $ 74,120 $ 43,553 $ 161,441 $ 89,553
Adjusted EBITDAR $ 109,223 $ 81,769 $ 277,950 $ 220,029
Gain (loss) on disposal of assets 7,396 (2,865) 819 (3,060)
Special items (14,932) — (14,310) (24,610)
Depreciation and amortization (24,867) (22,709) (69,560) (70,848)
Rent expense (17,604) (12,836) (49,160) (30,897)
Interest expense (14,742) (9,756) (32,113) (28,170)
Provision for income taxes (7,788) (7,118) (22,310) (11,779)
Net income $ 36,686 $ 26,485 $ 91,316 $ 50,665
Adjusted net income $ 42,632 $ 27,790 $ 101,304 $ 71,089
Gain (loss) on disposal of assets (i) 6,101 (2,258) 658 (2,482)
Special items (i) (12,341) — (12,240) (19,319)
Net income attributable to Bristow Group $ 36,392 $ 25,532 $ 89,722 $ 49,288
Adjusted diluted earnings per share $ 1.17 $ 0.76 $ 2.77 $ 1.93
Gain (loss) on disposal of assets (i) 0.17 (0.06) 0.02 (0.07)
Special items (i) (0.34) — (0.33) (0.53)
Diluted earnings per share 1.00 0.70 2.45 1.34
(i) These amounts are presented after applying the appropriate tax effect to each item and dividing by the weighted average shares outstanding during the related period to calculate the earnings per share impact.
38
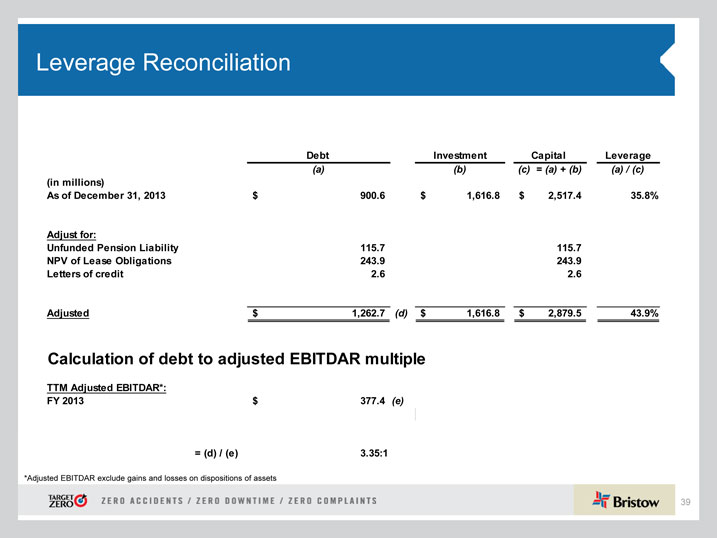
Leverage Reconciliation
Debt Investment Capital Leverage
| (a) |
|
(b) (c) = (a) + (b) (a) / (c) |
(in millions)
As of December 31, 2013 $ 900.6 $ 1,616.8 $ 2,517.4 35.8%
Adjust for:
Unfunded Pension Liability 115.7 115.7
NPV of Lease Obligations 243.9 243.9
Letters of credit 2.6 2.6
Adjusted $ 1,262.7 (d) $ 1,616.8 $ 2,879.5 43.9%
Calculation of debt to adjusted EBITDAR multiple
TTM Adjusted EBITDAR*:
FY 2013 $ 377.4 (e) \
= (d) / (e) 3.35:1
*Adjusted EBITDAR exclude gains and losses on dispositions of assets
39
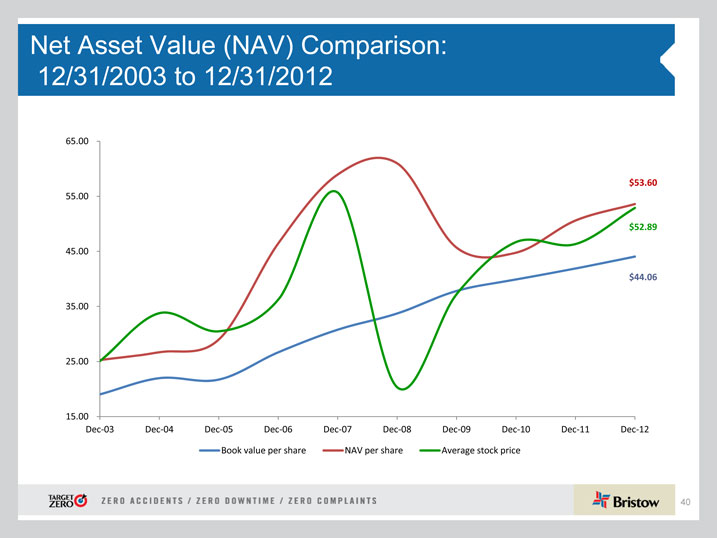
Net Asset Value (NAV) Comparison: 12/31/2003 to 12/31/2012
65.00
$53.60
55.00
$52.89
45.00
$44.06
35.00
25.00
15.00
Dec 03 Dec 04 Dec 05 Dec 06 Dec 07 Dec 08 Dec 09 Dec 10 Dec 11 Dec 12
Book value per share NAV per share Average stock price
40
Contact Us
Bristow Group Inc. (NYSE: BRS) 2103 City West Blvd., 4th Floor Houston, Texas 77042 t 713.267.7600 f 713.267.7620 bristowgroup.com
41