Attached files
| file | filename |
|---|---|
| 8-K - 8-K - CONSUMERS ENERGY CO | d478125d8k.htm |
Exhibit 99.1
2013 Credit Suisse Energy Summit February 5, 2013 Cross Winds_ Energy Park Smart Energy Program Gas Combined Cycle Plant
This presentation is made as of the date hereof and contains “forward-looking statements” as defined in Rule 3b-6 of the Securities Exchange Act of 1934, as amended, Rule 175 of the Securities Act of 1933, as amended, and relevant legal decisions. The forward-looking statements are subject to risks and uncertainties. They should be read in conjunction with “FORWARDLOOKING INFORMATION” “FACTORS” Energy’s LOOKING STATEMENTS AND INFORMATION and RISK FACTORS sections of CMS Energy s and Consumers Energy’s Form 10-K for the year ended December 31 and as updated in subsequent 10-Qs. CMS Energy’s and Consumers Energy’s “FORWARD-LOOKING STATEMENTS AND INFORMATION” and “RISK FACTORS” sections are incorporated herein by reference and discuss important factors that could cause CMS Energy’s and Consumers Energy’s results to differ materially from those anticipated in such statements. CMS Energy and Consumers Energy undertake no obligation to update any of the information presented herein to reflect facts, events or circumstances after the date hereof. The presentation also includes non-GAAP measures when describing CMS Energy’s results of operations and financial performance. A reconciliation of each of these measures to the most directly comparable GAAP measure is included in the appendix and posted on our website at www.cmsenergy.com. CMS Energy provides financial results on both a reported (Generally Accepted Accounting Principles) and adjusted (non-GAAP) basis. Management views adjusted earnings as a key measure of the company’s present operating financial performance, unaffected by discontinued operations, asset sales, impairments, regulatory items from prior years, or other items. Certain of these items have the potential to impact, favorably or unfavorably, the company’s reported earnings in 2012. The company is not able to estimate the impact of these matters and is not providing reported earnings guidance. 1
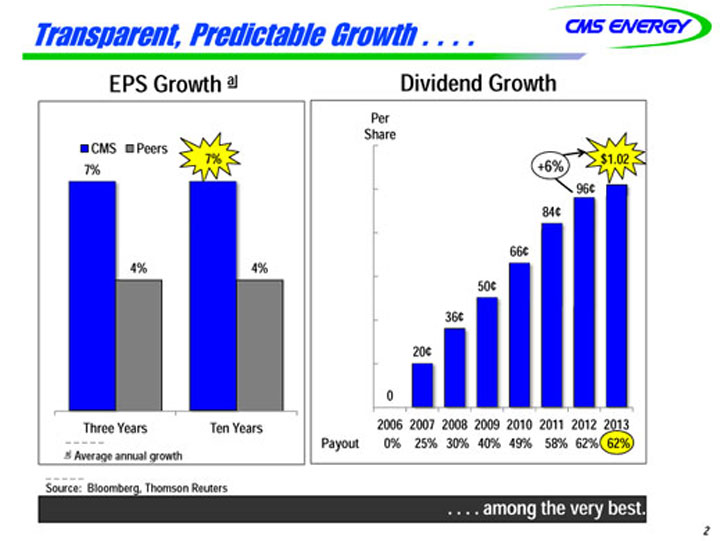
Transparent, Predictable Growth . . . . Di id G th a d G th Per Share EPS Growth Dividend Growth % CMS Peers 84¢ 96¢ 7% +6% $ 1.02 7% 50¢ 66¢ 4% 4% 20¢ 36¢ 0 2006 2007 2008 2009 2010 2011 2012 2013 a Average annual growth Payout 0% 25% 30% 40% 49% 58% 62% 62% Three Years Ten Years . . . . among the very best. 2 Source: Bloomberg, Thomson Reuters
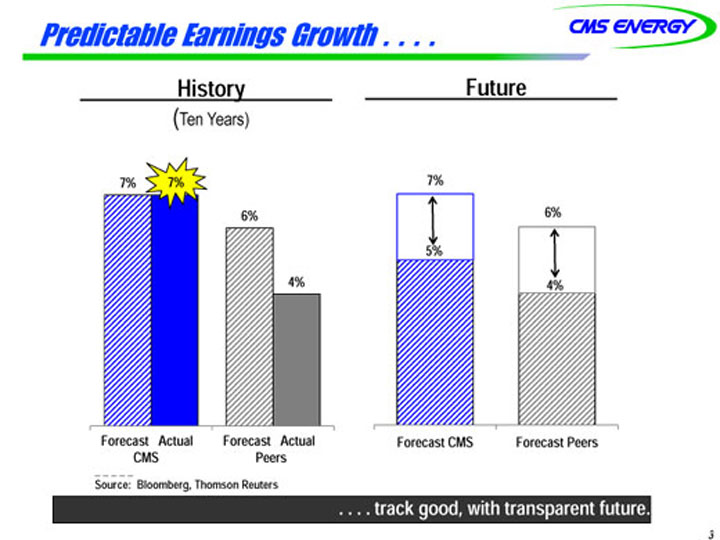
Predictable Earnings Growth . . . . History (Ten Years) Future 7% 6% 7% 6% 7% 4% 5% 4% ForecFaosrte c Aascttual Actual Forecast CMS Forecast Peers CMS Forecast Actual Peers . . . . track good, with transparent future. 3 Source: Bloomberg, Thomson Reuters
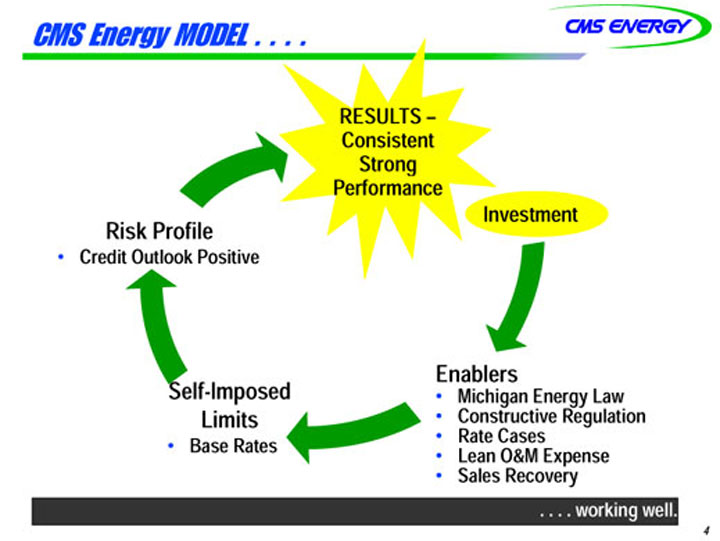
CMS Energy MODEL . . . . RESULTS – Consistent Investment Risk Profile Strong Performance • Credit Outlook Positive Enablers S lfI d • Michigan Energy Law • Constructive Regulation • Rate Cases • Lean O&M Expense Self-Imposed Limits • Base Rates • Sales Recovery . . . . working well. 4
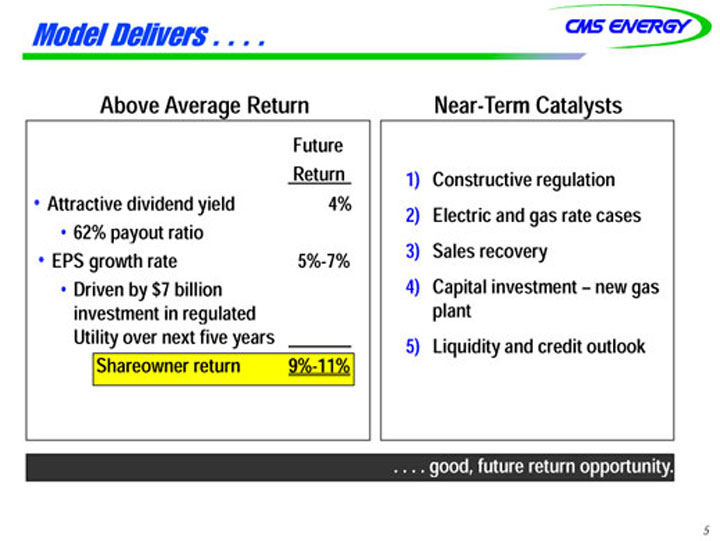
Model Delivers . . . . Above Average Return Near-Term Catalysts Future 1) Constructive regulation 2) Electric and gas rate cases Return • Attractive dividend yield 4% • 62% payout ratio 3) Sales recovery 4) Capital investment – new gas plant • EPS growth rate 5%-7% • Driven by $7 billion i t t i ltd 5) Liquidity and credit outlook investment in regulated Utility over next five years Shareowner return 9%-11% . . . . good, future return opportunity. 5
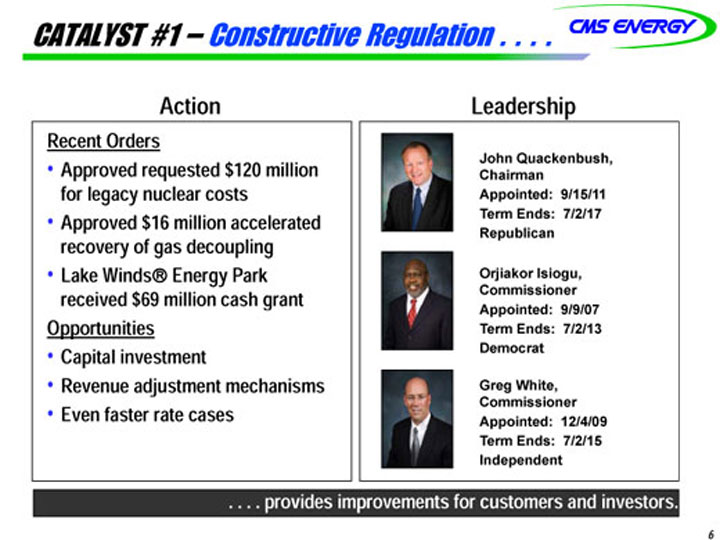
CATALYST #1 – Constructive Regulation . . . . Recent Orders Leadership J h Q k b h Action • Approved requested $120 million for legacy nuclear costs • Approved $16 million accelerated John Quackenbush, Chairman Appointed: 9/15/11 Term Ends: 7/2/17 Republican pp recovery of gas decoupling • Lake Winds_ Energy Park received $69 million cash grant Orjiakor Isiogu, Commissioner Appointed: 9/9/07 g Opportunities • Capital investment • Revenue adjustment mechanisms Term Ends: 7/2/13 Democrat White • Even faster rate cases Greg White, Commissioner Appointed: 12/4/09 Term Ends: 7/2/15 Independent . . . . provides improvements for customers and investors. 6
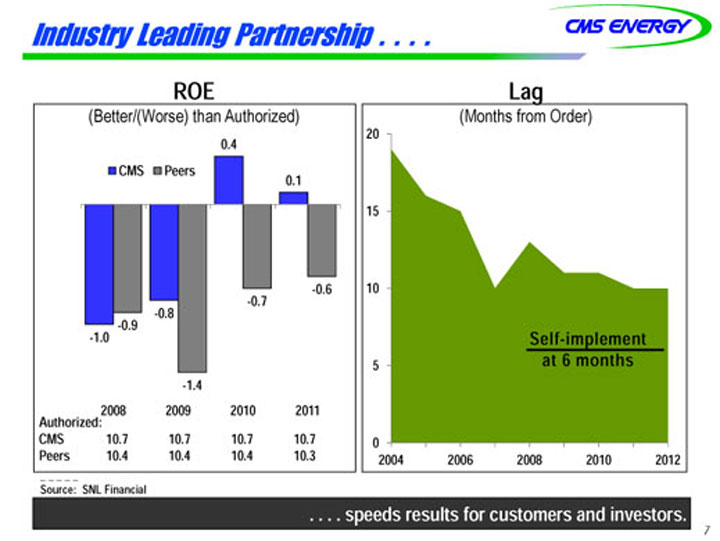
Industry Leading Partnership . . . . 0.4 ROE (Better/(Worse) than Authorized) Lag (Months from Order) 20 CMS Peers 0.1 15 -0.7 -0.6 10 -1.0 -0.8 -0.9 1 4 5 Self-implement at 6 months -1.4 2008 2009 2010 2011 Authorized: CMS 10.7 10.7 10.7 10.7 Peers 10.4 10.4 10.4 10.3 0 2004 2006 2008 2010 2012 . . . . speeds results for customers and investors. 7 Source: SNL Financial
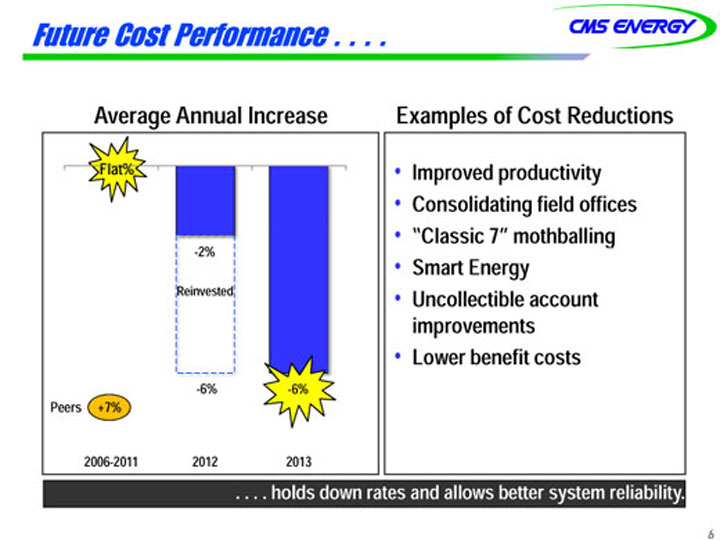
Future Cost Performance . . . . Average Annual Increase Examples of Cost Reductions • Improved productivity • Consolidating field offices • “Classic 7” mothballing Flat% • Smart Energy • Uncollectible account -2% Reinvested improvements • Lower benefit costs -6% -66%% 2006-2011 2012 2013 -6% Peers +7% . . . . hol.d .s . .d coownnt irnautes taon dp raolvloidwes s buesttaeirn saybslete EmP rSe lgiarobwilitthy. 8
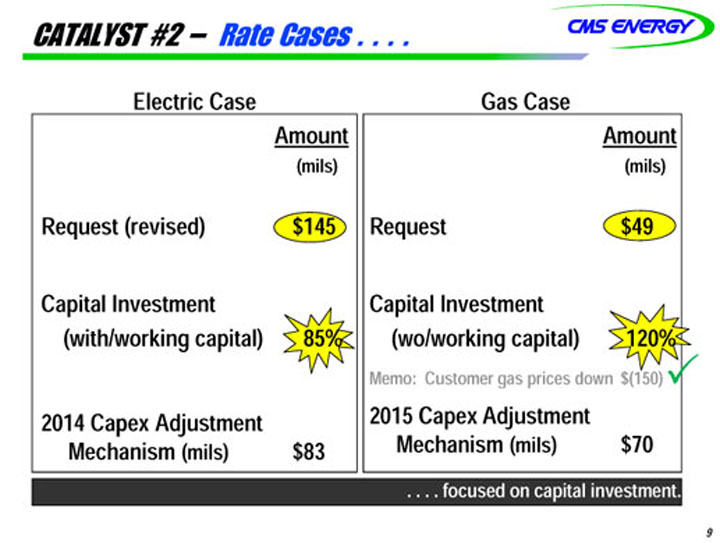
CATALYST #2 – Rate Cases . . . . Electric Case Amount Gas Case Amount (mils) Request (revised) $145 (mils) Request $49 Capital Investment Capital Investment (with/working capital) 85% 0 (wo/working capital) 120% Memo: Customer gas prices down $( 150)? 2014 Capex Adjustment Mechanism ( mils) $ 83 e o Custo e p ces do 50) 2015 Capex Adjustment ) Mechanism (mils) $70 . . . . focused on capital investment. 9
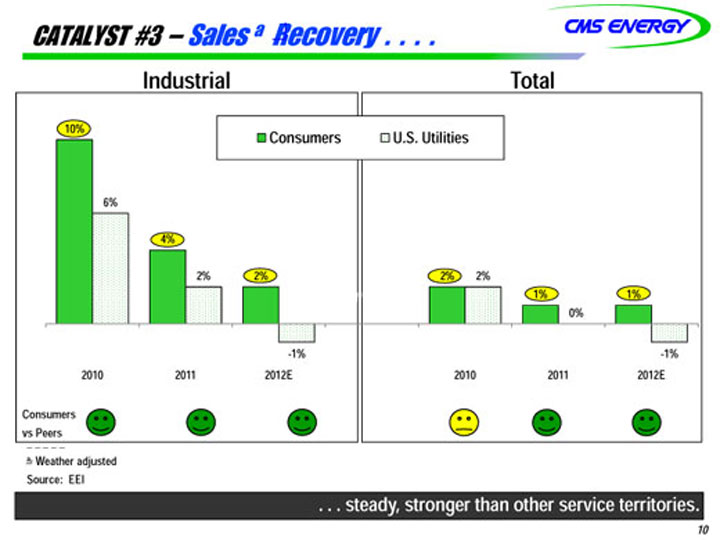
CATALYST #3 – Sales a Recovery . . . . Industrial Total 10% Consumers U.S. Utilities 6% 4% 2% 2% 1% 1% 2% 2% -1% 0% -1% 2010 2011 2012E 2010 2011 2012E a Weather adj sted Consumers vs Peers . . . steady, stronger than other service territories. adjusted Source: EEI 10
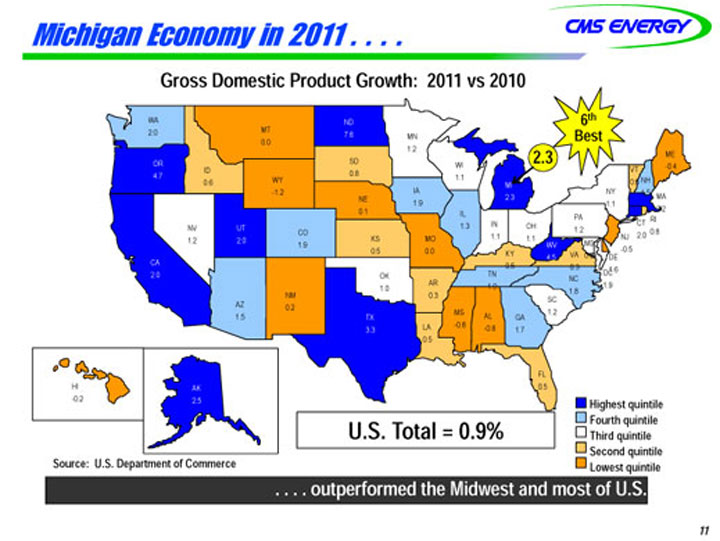
Michigan Economy in 2011 . . . . Gross Domestic Product Growth: 2011 vs 2010 2 3 WA 2.0 MT 0.0 ND 7.6 MN 1.2 ME 6th Best 2.3 OR 4.7 NV ID 0.6 WY -1.2 UT CO SD 0.8 NE 0.1 IA 1.9 WI 1.1 IL 1.3 MI 2.3 IN OH PA 1 2 NY 1.1 CT RI 0 8 NH 1.5 VT 0.5 MA 2.2 -0.4 CA 2.0 1.2 2.0 AZ NM 0 2 1.9 KS 0.5 OK 1.0 MO 0.0 AR 0.3 TN 1.9 1.1 1.1 KY 0.5 VA 0.3 WV 4.5 1.2 MD 0.9 DE 1.6 NJ -0.5 2.0 0.8 DC 1.9 SC NC 1.8 1.5 0.2 TX 3.3 LA 0.5 MS -0.8 AL -0.8 FL GA 1.7 1.2 Highest quintile Fourth quintile Third quintile Second quintile S U S D t t f C HI -0.2 AK 2.5 0.5 U.S. Total = 0.9% Source: U.S. Department of Commerce Lowest quintile . . . . outperformed the Midwest and most of U.S. 11
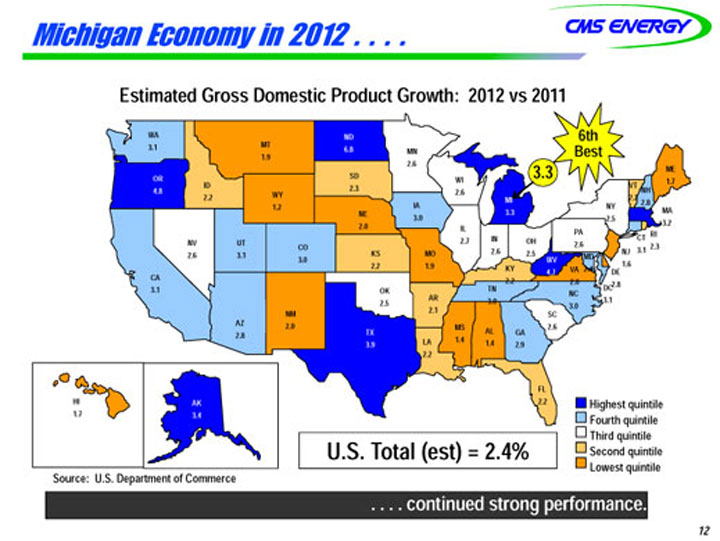
Michigan Economy in 2012 . . . . Estimated Gross Domestic Product Growth: 2012 vs 2011 WA 3.1 MT ND 6.8 MN 6th Best 3.3 OR 4.8 1.9 ID 2.2 WY 1.2 SD 2.3 NE 2.0 2.6 IA 3.0 WI 2.6 IL MI 3.3 PA NY 2.5 NH 2.8 MA 3.2 ME VT 1.7 2.2 CA 3.1 NV 2.6 UT 3.1 CO 3.0 KS 2.2 OK 2.5 MO 1.9 AR 2.7 TN 3.0 IN 2.6 OH 2.5 KY 2.2 VA 2.0 WV 4.7 2.6 MD 2.4 DE 2.8 NJ 1.6 CT 3.1 RI 2.3 DC 3.1 NC 3 0 AZ 2.8 NM 2.0 TX 3.9 2.1 LA 2.2 MS 1.4 AL 1.4 GA 2.9 SC 2.6 3.0 Highest quintile Fourth quintile Third quintile Second quintile HI 1.7 AK 3.4 FL 2.2 U.S. Total ( est) = 2.4% . . . . continued strong performance. Source: U.S. Department of Commerce Lowest quintile ) % 12
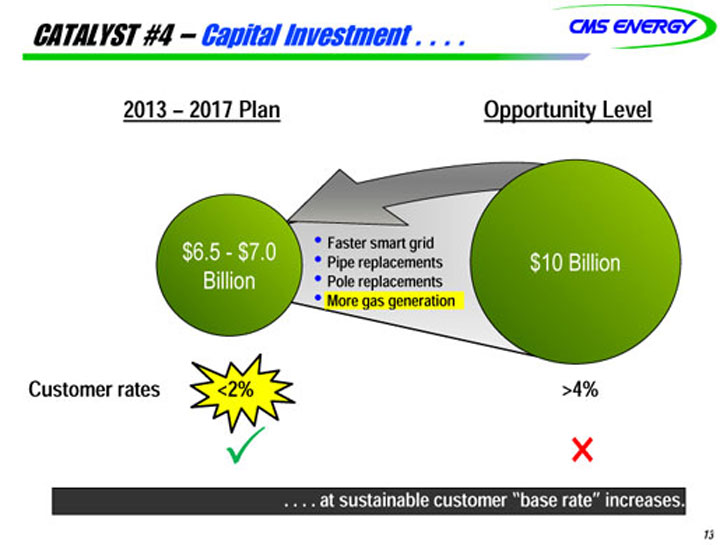
CATALYST #4 – Capital Investment . . . . 2013 – 2017 Plan Opportunity Level $6.5—$7.0 Billion $10 Billion • Faster smart grid • Pipe replacements • Pole replacements • More gas generation Customer rates <2% >4% g g ? × . . . . at sustainable customer “base rate” increases. 13
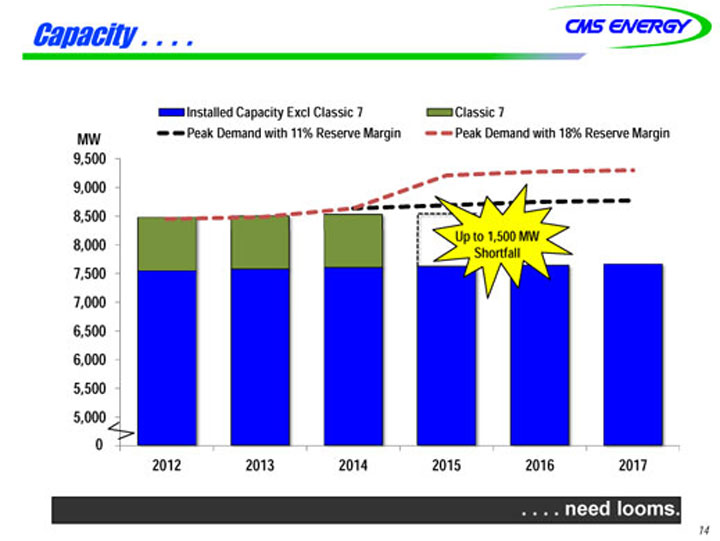
Capacity . . . . 9 500 Installed Capacity Excl Classic 7 Classic 7 Peak Demand with 11% Reserve Margin MW Peak Demand with 18% Reserve Margin 8,500 9,000 9,500 7,000 7,500 8,000 Up to 1,500 MW Shortfall 5 500 6,000 6,500 4,500 5,000 5,500 2012 2013 2014 2015 2016 2017 0 . . . . need looms. 14
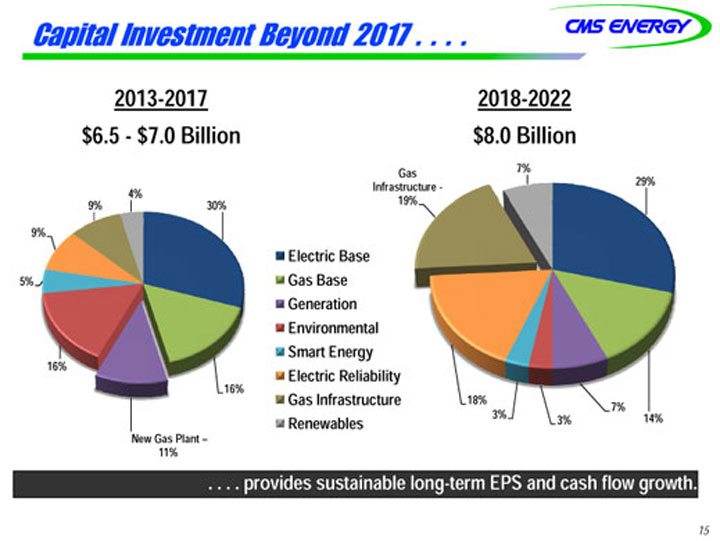
Capital Investment Beyond 2017 . . . . 2013-2017 $6.5—$7.0 Billion 2018-2022 $8.0 Billion 30% 9% 9% 4% Gas 29% Infrastructure—19% 7% 5% Electric Base Gas Base Generation 16% Environmental Smart Energy Electric Reliability 16% New Gas Plant – 11% y Gas Infrastructure Renewables 14% 7% 3% 3% 18% . . . . provides sustainable long-term EPS and cash flow growth. 15
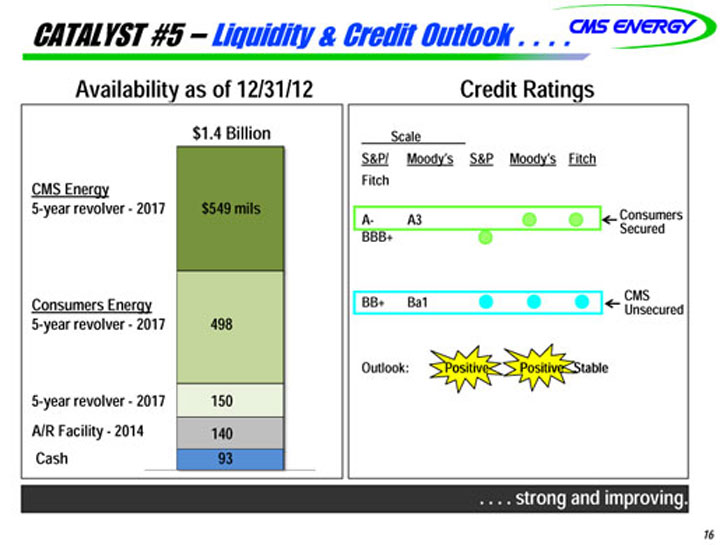
CATALYST #5 – Liquidity & Credit Outlook . . . . Credit Ratings $1.4 Billion Scale S&P/ M d ‘ S&P M d ‘ Fit h Availability as of 12/31/12 CMS Energy 5-year revolver—2017 $549 mils Consumers Secured Moody’s Moody’s Fitch Fitch A- A3A3 BBB Consumers Energy CMS Unsecured BBB+ BB+ Ba1 5-year revolver—2017 498 Outlook: Positive Positive Stable 5-year revolver—2017 A/R Facility—2014 Cash 150 140 93 . . . . strong and improving. 16
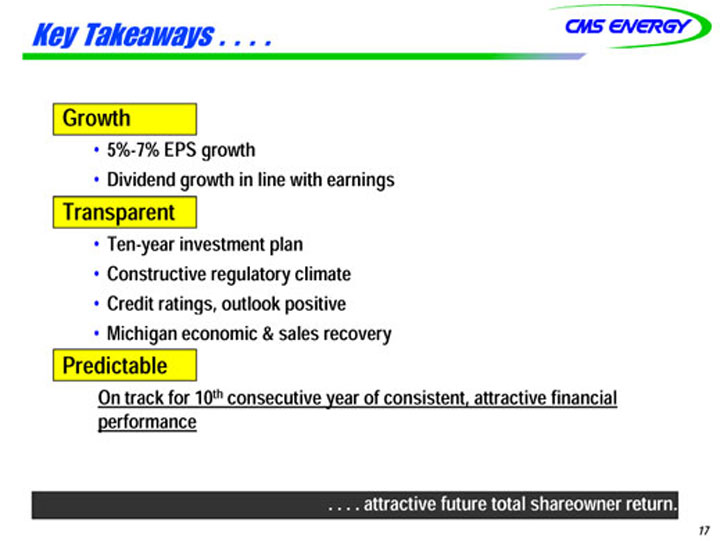
Key Takeaways . . . . Growth • 5%-7% EPS growth • Dividend growth in line with earnings Transparent • Ten-year investment plan • Constructive regulatory climate • Credit ratings, outlook positive • Michigan economic & sales recovery Predictable On track for 10th consecutive year of consistent, attractive financial performance . . . . attractive future total shareowner return. 17
APPENDIX 18
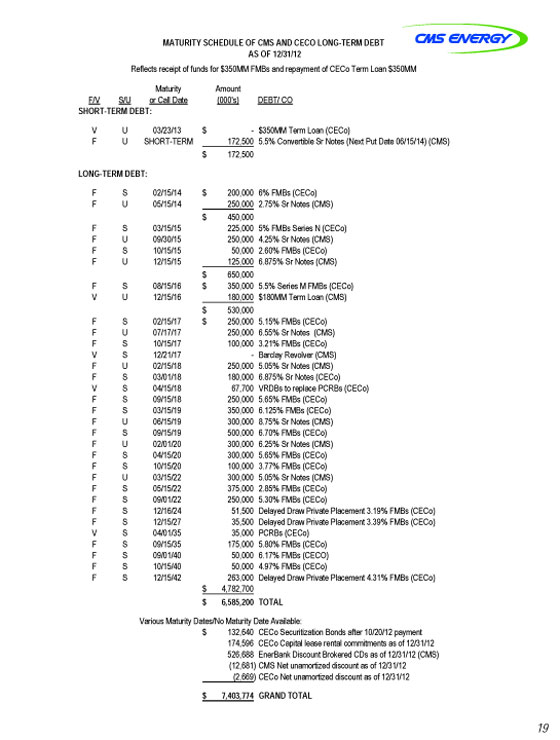
S L M F/V S/U or C SHORT-TERM DEBT: V U 03 F U SHO LONG-TERM DEBT: F S 02 F U 05 F S 03 F U 09 F S 10 F U 12 F S 08 V U 12 F S 02 F U 07 F S 10 V S 12 F U 02 F S 03 V S 04 F S 09 F S 03 F U 06 F S 09 F U 02 F S 04 F S 10 F U 03 F S 05 F S 09 F S 12 F S 12 V S 04 F S 09 F S 09 F S 10 F S 12 Variou Reflects Maturity Amoun Call Date (000’s) 3/23/13 $ ORT-TERM 172 $ 172 2/15/14 $ 200 5/15/14 250 $ 450 3/15/15 225 9/30/15 250 0/15/15 50 2/15/15 125 $ 650 8/15/16 $ 350 2/15/16 180 $ 530 2/15/17 $ 250 7/17/17 250 0/15/17 100 2/21/17 2/15/18 250 3/01/18 180 4/15/18 67 9/15/18 250 3/15/19 350 6/15/19 300 9/15/19 500 2/01/20 300 4/15/20 300 0/15/20 100 3/15/22 300 5/15/22 375 9/01/22 250 2/16/24 51 2/15/27 35 4/01/35 35 9/15/35 175 9/01/40 50 0/15/40 50 2/15/42 263 $ 4,782 $ 6,585 us Maturity Dates/No Mat $ 132 174 526 (12 (2 $ 7,403 receipt of funds for $350M MATURITY SCHEDUL nt ) DEBT/ CO—$350MM Term Loa 2,500 5.5% Convertible S 2,500 0,000 6% FMBs (CECo) 0,000 2.75% Sr Notes (C 0,000 5,000 5% FMBs Series N 0,000 4.25% Sr Notes (C 0,000 2.60% FMBs (CEC 5,000 6.875% Sr Notes ( 0,000 0,000 5.5% Series M FM 0,000 $180MM Term Loa 0,000 0,000 5.15% FMBs (CEC 0,000 6.55% Sr Notes (C 0,000 3.21% FMBs (CEC—Barclay Revolver ( 0,000 5.05% Sr Notes (C 0,000 6.875% Sr Notes ( 7,700 VRDBs to replace 0,000 5.65% FMBs (CEC 0,000 6.125% FMBs (CE 0,000 8.75% Sr Notes (C 0,000 6.70% FMBs (CEC 0,000 6.25% Sr Notes (C 0,000 5.65% FMBs (CEC 0,000 3.77% FMBs (CEC 0,000 5.05% Sr Notes (C 5,000 2.85% FMBs (CEC 0,000 5.30% FMBs (CEC 1,500 Delayed Draw Priv 5,500 Delayed Draw Priv 5,000 PCRBs (CECo) 5,000 5.80% FMBs (CEC 0,000 6.17% FMBs (CEC 0,000 4.97% FMBs (CEC 3,000 Delayed Draw Priv 2,700 5,200 TOTAL turity Date Available: 2,640 CECo Securitizatio 4,596 CECo Capital leas 6,688 EnerBank Discoun 2,681) CMS Net unamort 2,669) CECo Net unamor 3,774 GRAND TOTAL MM FMBs and repaymen AS OF 12/31/12 LE OF CMS AND CECO an (CECo) Sr Notes (Next Put Date CMS) (CECo) CMS) Co) CMS) MBs (CECo) an (CMS) Co) CMS) Co) CMS) CMS) CECo) PCRBs (CECo) Co) ECo) CMS) Co) CMS) Co) Co) CMS) Co) Co) vate Placement 3.19% FM vate Placement 3.39% FM Co) CO) Co) vate Placement 4.31% FM on Bonds after 10/20/12 p se rental commitments as nt Brokered CDs as of 12/ ized discount as of 12/31 rtized discount as of 12/3 nt of CECo Term Loan $3 LONG-TERM DEBT 06/15/14) (CMS) MBs (CECo) MBs (CECo) MBs (CECo) payment of 12/31/12 /31/12 (CMS) /12 1/12 350MM 19