Attached files
| file | filename |
|---|---|
| 8-K - 8-K - SCIENTIFIC GAMES CORP | a13-4119_18k.htm |
| EX-99.1 - EX-99.1 - SCIENTIFIC GAMES CORP | a13-4119_1ex99d1.htm |
Exhibit 99.2
|
|
Acquisition of January 31, 2013 |
|
|
Safe Harbor Statement This presentation includes forward-looking statements within the meaning of Section 27A of the Securities Act of 1933 and Section 21E of the Securities Exchange Act of 1934. Forward-looking statements describe future expectations, plans, results or strategies and can often be identified by the use of terminology such as "may," "will," "estimate," "intend," "continue," "believe," "expect," "anticipate," "estimate," "should," "potential," "opportunity," or similar terminology. These statements are based upon management's current expectations, beliefs, assumptions and estimates and are not guarantees of future results or performance. Similarly, statements herein that describe the proposed transaction, including its financial impact, and other statements of management’s expectations, beliefs, assumptions, estimates and goals regarding the proposed transaction are forward-looking statements. It is uncertain whether any of the events or results anticipated by the forward-looking statements (including consummation of the proposed transaction) will transpire or occur, or if any of them do, what impact they will have on the results of operations and financial condition of the combined companies or the price of Scientific Games or WMS stock. These forward-looking statements involve certain risks and uncertainties that could cause actual results to differ materially from those indicated in such forward-looking statements, including but not limited to: the ability of the parties to consummate the proposed transaction and the satisfaction of the conditions precedent to consummation of the proposed transaction, the ability to secure regulatory approvals at all or in a timely manner; the ability of Scientific Games to successfully integrate WMS’ operations, product lines and technology; the ability of Scientific Games to implement its plans, forecasts and other expectations with respect to WMS’ business after the completion of the transaction and realize additional opportunities for growth and innovation; and the other risks, uncertainties and important factors contained and identified (including under the heading “Risk Factors”) in Scientific Games’ and WMS’ filings with the Securities and Exchange Commission (the “SEC”), such as their respective Quarterly Reports on Form 10-Q and Annual Reports on Form 10-K, any of which could cause actual results to differ materially from the forward-looking statements. The date of this presentation is as of January 31, 2013, and the information provided herein is presented through the dates indicated on the applicable slides. Forward-looking statements speak only as of the date they are made and, except for Scientific Games’ ongoing obligations under the U.S. federal securities laws, Scientific Games undertakes no obligation to publicly update any forward-looking statements whether as a result of new information, future events or otherwise. Note Regarding Presentation of Non-GAAP Financial Measures: As used herein, Attributable EBITDA, Adjusted EBITDA and Combined Attributable EBITDA are non-GAAP measurements. Attributable EBITDA, as used herein, is based on the definition of Scientific Games’ “consolidated EBITDA” in its credit agreement (summarized in Scientific Games’ November 6, 2012 press release), except that Attributable EBITDA as used herein includes its share of the EBITDA of all of its equity investments (whereas “consolidated EBITDA” for purposes of the credit agreement generally includes its share of the EBITDA of its Italian joint venture but only the income of its other equity investments to the extent it has been distributed to Scientific Games). Attributable EBITDA is a non-GAAP financial measure that is presented herein as a supplemental disclosure and is reconciled to net income (loss) in the appendix of this presentation. As used herein, Adjusted EBITDA of WMS is defined as earnings before depreciation, amortization, income taxes, interest income and expense, share-based compensation and other non-cash items, including non-cash impairment and restructuring charges. Adjusted EBITDA is a non-GAAP financial measure that is presented herein as a supplemental disclosure and is reconciled to net income (loss) in the appendix of this presentation. As used herein, Combined Attributable EBITDA reflects the arithmetic sum of Scientific Games’ Attributable EBITDA and WMS’ Adjusted EBITDA for the trailing 12-month period ended September 30, 2012, and does not include any synergies Scientific Games expects to achieve. Combined Attributable EBITDA does not reflect any adjustments resulting from the proposed transaction and does not represent a "pro forma" amount determined in accordance with the SEC's rules and regulations, including Article 11 of Regulation S-X. Combined Attributable EBITDA is a non-GAAP financial measure that is presented herein as a supplemental disclosure and is reconciled in the appendix of this presentation. 1 |
|
|
Today’s Presenters Lorne Weil – Chairman & CEO Jeff Lipkin – Senior Vice President & CFO |

|
|
A Transformational Transaction Combines leading companies in lottery instant tickets, systems, gaming machines and interactive gaming to create a comprehensive scope of product and service offerings for the lottery and gaming industries 3 |
|
|
Strategic Rationale and Opportunities Diversifies revenue base, expands margins and propels future growth opportunities Broadens scope of product offerings and creates cross-selling opportunities Shared and complementary core competencies Award-winning game development Global footprint Extensive licensed brands Design and product innovation Leading systems Growing interactive gaming presence $110 million of anticipated cash flow savings on an annualized run-rate basis $90 million in anticipated cost savings $20 million in anticipated capex savings Over $100 million expected tax savings from 2014 to 2017, largely from usage of existing NOL’s Immediately accretive to EPS and free cash flow at close 4 |
|
|
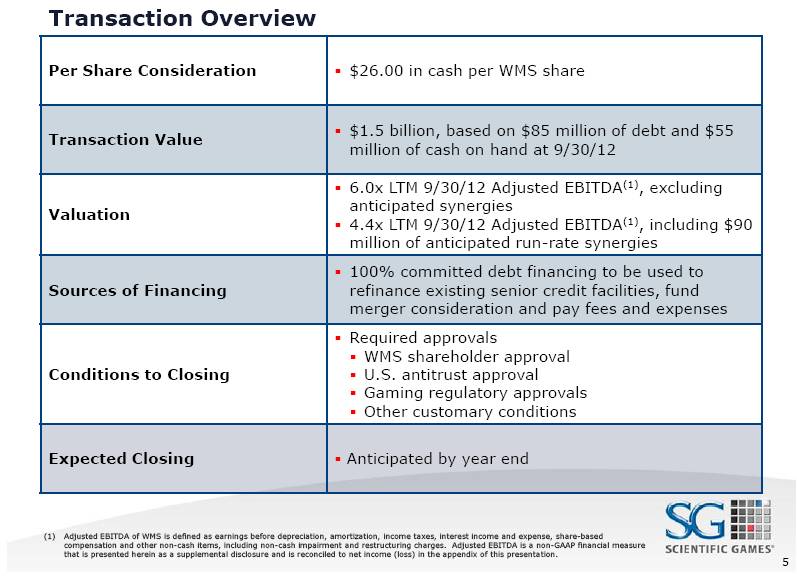
Transaction Overview Per Share Consideration $26.00 in cash per WMS share Transaction Value $1.5 billion, based on $85 million of debt and $55 million of cash on hand at 9/30/12 Valuation 6.0x LTM 9/30/12 Adjusted EBITDA(1), excluding anticipated synergies 4.4x LTM 9/30/12 Adjusted EBITDA(1), including $90 million of anticipated run-rate synergies Sources of Financing 100% committed debt financing to be used to refinance existing senior credit facilities, fund merger consideration and pay fees and expenses Conditions to Closing Required approvals WMS shareholder approval U.S. antitrust approval Gaming regulatory approvals Other customary conditions Expected Closing Anticipated by year end 5 (1) Adjusted EBITDA of WMS is defined as earnings before depreciation, amortization, income taxes, interest income and expense, share-based compensation and other non-cash items, including non-cash impairment and restructuring charges. Adjusted EBITDA is a non-GAAP financial measure that is presented herein as a supplemental disclosure and is reconciled to net income (loss) in the appendix of this presentation. |
|
|
6 Global leader in over $70 billion worldwide instant ticket category (1) Instant ticket supplier to 41 U.S. jurisdictions and experience selling into over 50 countries Largest portfolio of licensed brands for lotteries Leader in value chain management services for lotteries Leader in lottery loyalty and rewards Leading provider of software, equipment and data networks to lotteries in ~$190 billion worldwide draw-based game category (1) Systems contracts across the U.S. and leading provider of hardware and software internationally B2B sports betting software, hardware and hosting for land-based and interactive operators Leader in server-based gaming machines and systems Focus on local venues: betting shops, pubs, bingo halls and arcades Over 30,000 machines installed Leading provider of machines in U.K. Recently licensed in multiple U.S. jurisdictions Emerging B2G interactive business (1) Source: 2012 La Fleur’s Lottery Almanac. LTM 9/30/12 Revenue: $930 LTM Revenue: $501 LTM Revenue: $260 LTM Revenue: $169 ($ in millions) Scientific Games Profile |
|
|
7 Product Sales Second largest machine supplier as measured by ship share (1) Broad range of video and mechanical reel gaming machines Serves Class III, Class II and video lottery terminal sectors Social, casual and mobile gaming (SoCaMo) Deploys WMS branded game content across interactive channels Diverse product portfolio including Jackpot Party Social Casino, a monetized social casino app B2B managed services Leasing gaming machines and game content (WAP & LAP) Over 9,000 participation machines Leading titles including Monopoly™, Wizard of Oz™, Star Trek™, Lord of the Rings™, SPIDER-MAN™ and others Gaming Operations Williams Interactive WMS Profile LTM 9/30/12 Revenue: $693 LTM Revenue: $429 LTM Revenue: $264 ($ in millions) (1) Source: Wall Street Research. |
|
|
Combined Company Creates one of the largest B2B and B2G global gaming suppliers with LTM 9/30/12 combined: Revenue of ~$1.6 billion Combined Attributable EBITDA(1) of ~$579 million, excluding ~$90 million of anticipated synergies Worldwide leader in lottery & gaming hardware and software Global installed base of ~40,000 participation-based machines Leader in server-based gaming content and technology Full suite of interactive gaming solutions and services 8 (1) Combined Attributable EBITDA reflects the arithmetic sum of Scientific Games’ Attributable EBITDA and WMS’ Adjusted EBITDA (see footnote on page 5 of this presentation) for the trailing 12-month period ended September 30, 2012, and does not include any synergies Scientific Games expects to achieve. Scientific Games’ Attributable EBITDA, as used herein, is based on the definition of "consolidated EBITDA" in Scientific Games’ credit agreement (summarized in its November 6, 2012 press release), except that Attributable EBITDA as used herein includes Scientific Games’ share of the EBITDA of all of its equity investments (whereas "consolidated EBITDA" for purposes of the credit agreement generally includes its share of the EBITDA of its Italian joint venture but only the income of its other equity investments to the extent it has been distributed to Scientific Games). Attributable EBITDA is a non-GAAP financial measure that is presented herein as a supplemental disclosure and is reconciled to net income (loss) in the appendix of this presentation. Combined Attributable EBITDA does not reflect any adjustments resulting from the proposed transaction and does not represent a "pro forma" amount determined in accordance with the SEC's rules and regulations, including Article 11 of Regulation S-X. Combined Attributable EBITDA is a non-GAAP financial measure that is presented herein as a supplemental disclosure and is reconciled in the appendix of this presentation. . |
|
|
Shared and Complementary Core Competencies Game Development Brand Licensing Loyalty Programs 9 Hardware Software Development Systems Design & Development Manufacturing & Engineering Customer Service Field Maintenance Supply Chain Interactive Gaming Government Relations & Government Procurement Acquiring & Integrating Businesses |
|
|
Full Suite of Interactive Content & Solutions 10 Products Scientific Games Williams Interactive Pro Forma Company Electronic Instant Tickets ü ü Draw Games ü ü Slots ü ü ü Sports Betting ü ü Social Games ü ü Video Poker ü ü Casino Games ü ü Multi-Player Games ü ü Subscriptions ü ü Player Loyalty ü ü Player Rewards ü ü Player Community ü ü |
|
|
WMS is Well Positioned in an Industry Poised for Growth 11 North American unit sales (1) Source: Company reports & EILERS-FANTINI Quarterly Slot Report. Note: North American market defined as U.S. and Canada. Includes Class II, Class III and VLTs. (1) Estimates based on Wall Street Research. Slot replacement rate % (000’s) WMS relative positioning Attractive recent product developments Highly valued licensed brands with pipeline including Willy Wonka™, SPIDER-MAN™, Cheers™ and others Advanced interactive gaming technology 63 51 46 50 55 63 77 80 37 48 24 12 12 24 30 28 100 100 69 62 67 87 107 108 CY 2007 CY 2008 CY 2009 CY 2010 CY 2011 CY 2012E CY 2013E CY 2014E Replacement New & Expansionary |
|
|
Revenue Growth Opportunities Through Cross-Selling 12 Capitalize on WMS and SGMS content creation capabilities across multiple markets, channels and platforms Accelerate WMS’ international growth by utilizing SGMS’ global footprint Expand WMS participation in government gaming by capitalizing on SGMS government relations and procurement Expand business in wide area and other emerging gaming segments Deepen and expand scope of interactive businesses and create cross-selling opportunities Content Geographic Footprint B2G Wide Area Gaming Interactive |
|
|
Combined Revenue Mix Scientific Games WMS Combined LTM 9/30/12 Revenue: $930 LTM 9/30/12 Revenue: $693 LTM 9/30/12 Revenue: $1,623 13 ($ in millions) |
|
|
Combined Financials 14 Revenue (1) Combined Attributable EBITDA (2) (includes anticipated synergies) (1) Revenue (excluding Racing Business), which excludes the revenue of Scientific Games’ Racing Business that was sold in October 2010, is a non-GAAP financial measure that is presented herein as a supplemental disclosure and is reconciled to revenue in the appendix of this presentation. (2) Combined Attributable EBITDA reflects the arithmetic sum of Scientific Games’ Attributable EBITDA (see footnote on page 8 of this presentation) and WMS’ Adjusted EBITDA (see footnote on page 5 of this presentation) for the trailing 12-month period ended September 30, 2012, and does not include any synergies Scientific Games expects to achieve. Combined Attributable EBITDA does not reflect any adjustments resulting from the proposed transaction and does not represent a "pro forma" amount determined in accordance with the SEC's rules and regulations, including Article 11 of Regulation S-X. Combined Attributable EBITDA is a non-GAAP financial measure that is presented herein as a supplemental disclosure and is reconciled in the appendix of this presentation. ($ in millions) ($ in millions) $315 $327 $333 $246 $90 $669 2010 2011 LTM 9/30/12 SG Attributable EBITDA WMS Adj. EBITDA Synergies |
|
|
Integration Strategy and Anticipated Synergies Extensive prior acquisition integration experience Integration Strategy Integration will be driven by teams composed of WMS and SGMS leadership 6 to 9 months to create a comprehensive plan for rapid and efficient integration Opportunity for rapid realization of EBITDA synergies Year 1: $50 million Year 2: $75 million Year 3: $90 million Anticipated capex synergies of $20 million 15 EBITDA synergies Capex synergies ($ in millions) Anticipated run-rate synergies Note: EBITDA is a non-GAAP financial measure that is presented herein as a supplemental disclosure and is reconciled to net income (loss) in the appendix of this presentation. $110 SG&A R&D Manufacturing Total run-rate $110 $20 $90 |
|
|
Combined Leverage As of 9/30/12 16 (1) Combined Attributable EBITDA reflects the arithmetic sum of Scientific Games’ Attributable EBITDA (see footnote on page 8 of this presentation) and WMS’ Adjusted EBITDA (see footnote on page 5 of this presentation) for the trailing 12-month period ended September 30, 2012. Combined Attributable EBITDA does not reflect any adjustments resulting from the proposed transaction and does not represent a "pro forma" amount determined in accordance with the SEC's rules and regulations, including Article 11 of Regulation S-X. Combined Attributable EBITDA is a non-GAAP financial measure that is presented herein as a supplemental disclosure and is reconciled in the appendix of this presentation. (2) Includes anticipated run-rate operating synergies of $90 million. Highly Attractive Pro Forma Debt Maturity Profile and Liquidity ($ in millions) Scientific WMS Transaction Games Industries Adjustments Combined Cash and equivalents $136 $55 – $191 Revolver – $85 ($85) – New revolver ($300 million undrawn) – – – – Existing term loan 573 – (561) 12 New term loan – – 2,200 2,200 Total secured debt $573 $85 $1,554 $2,212 Existing notes 900 – – 900 Total debt $1,473 $85 $1,554 $3,112 No Synergies With Synergies (2) LTM 9/30/12 Attributable EBITDA (1) $333 $246 $90 $579 $669 Net Debt / Attributable EBITDA 4.0x 0.1x 5.0x 4.4x |
|
|
Strategically and Financially Compelling Transaction 17 |
|
|
Additional Information 18 Additional Information and Where to Find It WMS intends to file with the SEC a proxy statement in connection with the proposed transaction with Scientific Games. The definitive proxy statement will be sent or given to the stockholders of WMS and will contain important information about the proposed transaction and related matters. SECURITY HOLDERS ARE URGED TO READ THE PROXY STATEMENT CAREFULLY WHEN IT BECOMES AVAILABLE. The proxy statement and other relevant materials (when they become available), and any other documents filed by WMS with the SEC, may be obtained free of charge at the SEC’s website, at www.sec.gov. In addition, security holders will be able to obtain free copies of the proxy statement from WMS by contacting Investor Relations by mail at Attn: Investor Relations, Investor Relations, 800 S. Northpoint Boulevard, Waukegan, IL 60085. Participants in the Solicitation Scientific Games and WMS and their respective directors and executive officers and other persons may be deemed to be participants in the solicitation of proxies in connection with the proposed merger. Information about Scientific Games’ directors and executive officers is included in Scientific Games’ Annual Report on Form 10-K for the year ended December 31, 2011, filed with the SEC on February 29, 2012 and the proxy statement for Scientific Games’ 2012 Annual Meeting of Stockholders, filed with the SEC on April 26, 2012. Information about WMS’ directors and executive officers is included in WMS’ Annual Report on Form 10-K for the fiscal year ended June 30, 2012, filed with the SEC on August 21, 2012 and in the proxy statement for WMS’ 2012 Annual Meeting of Stockholders, filed with the SEC on October 17, 2012. Additional information regarding these persons and their interests in the merger will be included in the proxy statement relating to the merger when it is filed with the SEC. These documents can be obtained free of charge from the sources indicated above. |
|
|
Appendix 19 |
|
|
EBITDA Reconciliation 20 ($ in millions) Three Months Ended LTM 12/31/11 3/31/12 6/30/12 9/30/12 9/30/12 Reconciliation to Scientific Games Attributable EBITDA: Net Income (Loss) ($8.5) $1.8 ($12.6) ($27.1) ($46.4) Income Tax Expense 3.1 4.9 3.3 5.1 16.3 Depreciation and Amortization Expense 30.7 30.5 39.1 39.2 139.5 Interest Expense 25.5 24.9 24.2 26.0 100.6 Early Extinguishment of Debt – – – 15.5 15.5 Other Expense (Income), Net 1.1 (0.5) 1.1 (0.5) 1.2 EBITDA $51.9 $61.6 $55.1 $58.2 $226.7 Credit Agreement Adjustments: Debt-Related Fees and Charges $0.9 – $0.1 $15.5 $16.4 Amortization of Intangibles – – – – – Earn-outs for Permitted Acquisitions – – – – – Extraordinary Charges or Losses under GAAP – – – – – Non-cash Stock-based Compensation Expenses 6.2 5.8 5.9 5.9 23.8 Deferred Contingent Compensation Expense – – – – – Non-recurring Write-offs under GAAP 0.1 – – – 0.1 Acquisition Advisory Fees 0.6 – 0.7 0.5 1.8 Specified Permitted Add-backs 2.7 3.0 6.8 2.3 14.8 Italian Concession Obligations – – – – – Racing Disposition Charges and Expenses – – – – – Playtech Royalties and Fees 1.6 1.6 1.9 1.8 7.0 Less: Interest Income (0.1) (0.0) (0.0) (0.3) (0.4) Less: Extraordinary Income or Gains under GAAP – – – – – Less: Income on Earn-outs for Permitted Acquisitions – – – – – Less: Other Expense (Income), Net (1.1) 0.5 (1.1) 0.5 (1.2) Less: Early Extinguishment of Debt – – – (15.5) (15.5) Less: Earnings from Equity Investments (1.9) (8.8) (6.9) (5.7) (23.4) EBITDA from Equity Investments 19.5 23.1 21.2 19.2 83.0 Attributable EBITDA $80.3 $86.7 $83.5 $82.5 $333.1 |
|
|
EBITDA Reconciliation (cont’d) 21 ($ in millions) Three Months Ended LTM 12/31/11 3/31/12 6/30/12 9/30/12 9/30/12 Attributable EBITDA $80.3 $86.7 $83.5 $82.5 $333.1 EBITDA from Equity Investments: Earnings from Equity Investments $1.9 $8.8 $6.9 $5.7 $23.4 Income Tax Expense 2.2 3.8 3.0 2.5 11.4 Depreciation and Amortization Expense 11.9 9.6 10.1 10.2 41.8 Interest Expense, Net of Other 3.5 0.9 1.2 0.8 6.4 EBITDA from Equity Investments $19.5 $23.1 $21.2 $19.2 $83.0 Reconciliation to WMS Adjusted EBITDA: Net Income $16.1 $22.1 $22.1 $9.3 $69.6 Depreciation 17.8 19.7 21.0 23.0 81.5 Amortization of Intangible and Other Non-current Assets 7.6 6.2 8.6 9.0 31.4 Provision for Income Taxes 8.7 11.3 13.0 5.0 38.0 Interest Expense 0.4 0.4 0.4 0.7 1.9 Share-based Compensation 5.0 3.9 4.3 4.4 17.6 Other Non-cash Items 2.1 1.7 0.4 1.5 5.7 Adjusted EBITDA $57.7 $65.3 $69.8 $52.9 $245.7 Reconciliation to Combined Revenue: SGMS Revenue $239.1 $234.6 $229.3 $227.5 $930.4 WMS Revenue 162.2 176.0 195.9 159.1 693.2 Combined Revenue $401.3 $410.6 $425.2 $386.6 $1,623.6 Reconciliation to Pro Forma Attributable EBITDA: SGMS Attributable EBITDA $80.3 $86.7 $83.5 $82.5 $333.1 WMS Adjusted EBITDA 57.7 65.3 69.8 52.9 245.7 Combined Attributable EBITDA $138.0 $152.0 $153.3 $135.4 $578.8 |
|
|
Reconciliation of Revenue Excluding Racing Business for SGMS 22 Revenue Excluding Racing Business (1) Scientific Games Corporation and Subsidiaries. ($ in millions) Fiscal Year Ended December 31, 9 Months Ended 9/30 LTM 2009 2010 2011 2011 2012 9/30/12 SGC Total (1) $927.7 $882.5 $878.7 $639.6 $691.4 $930.4 Less: Racing Business (108.8) (83.8) – – – – SGC Excluding Racing Business (1) $819.0 $798.7 $878.7 $639.6 $691.4 $930.4 |
|
|
Reconciliation of Adjusted EBITDA of WMS 23 Adjusted EBITDA (1) Includes non-cash impairment and restructuring charges. Note: Adjusted EBITDA is a non-GAAP financial measure that is presented herein as a supplemental disclosure. ($ in millions) Fiscal Year Ended June 30, 3 Months Ended 9/30, LTM 2010 2011 2012 2011 2012 9/30/12 Net income (Loss) $112.9 $81.0 $64.1 $3.8 $9.3 $69.6 Depreciation 67.2 71.1 77.8 19.3 23.0 81.5 Amortization of Intangibles and Other Non-current Assets 21.6 21.6 29.0 6.6 9.0 31.4 Provision for Income Taxes 57.6 42.6 35.0 2.0 5.0 38.0 Interest Expense 3.2 1.2 1.6 0.4 0.7 1.9 Share-based Compensation 20.3 18.7 15.8 2.6 4.4 17.6 Other Non-cash items (1) – 29.8 12.3 8.1 1.5 5.7 Adjusted EBITDA $282.8 $266.0 $235.6 $42.8 $52.9 $245.7 |