Attached files
| file | filename |
|---|---|
| 8-K - FORM 8-K - MERCER INTERNATIONAL INC. | d470197d8k.htm |
Exhibit 99.1
| CIBC Whistler Institutional Investor ConferenceJanuary 23-26, 2013 |

| Forward Looking Statements The Private Securities Litigation Reform Act of 1995 provides a "safe harbor" for forward-looking statements. Certain information included in this presentation contains statements that are forward-looking, such as statements relating to results of operations and financial conditions and business development activities, as well as capital spending and financing sources. Such forward-looking information involves important risks and uncertainties that could significantly affect anticipated results in the future and, accordingly, such results may differ materially from those expressed in any forward-looking statements made by or on behalf of Mercer. For more information regarding these risks and uncertainties, review Mercer's filings with the United States Securities and Exchange Commission. Unless required by law, we do not assume any obligation to update forward-looking statements based on unanticipated events or changed expectations. |
| Introduction to Mercer International Inc. |
| Mercer - A Snapshot World-class, large, modern mills operations that produce high-quality NBSK pulp Strategically located mills, close to excellent fiber baskets and key markets Strong long-term forecast / supply-demand outlook for NBSK Significant and growing revenue from energy & chemical sales Financial structure offers investors high leverage to the pulp cycle Experienced, shareholder-focused management team and board of directors |
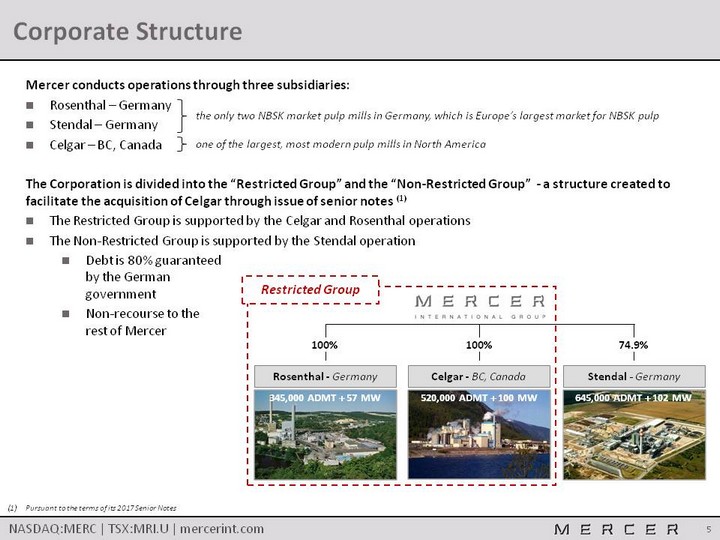
| Corporate Structure Pursuant to the terms of its 2017 Senior Notes Mercer conducts operations through three subsidiaries:Rosenthal - GermanyStendal - GermanyCelgar - BC, CanadaThe Corporation is divided into the "Restricted Group" and the "Non-Restricted Group" - a structure created to facilitate the acquisition of Celgar through issue of senior notes (1)The Restricted Group is supported by the Celgar and Rosenthal operationsThe Non-Restricted Group is supported by the Stendal operationDebt is 80% guaranteed by the German governmentNon-recourse to the rest of Mercer 100% Celgar - BC, Canada 100% Rosenthal - Germany 74.9% Stendal - Germany Restricted Group 520,000 ADMT + 100 MW 345,000 ADMT + 57 MW 645,000 ADMT + 102 MW the only two NBSK market pulp mills in Germany, which is Europe's largest market for NBSK pulp one of the largest, most modern pulp mills in North America |
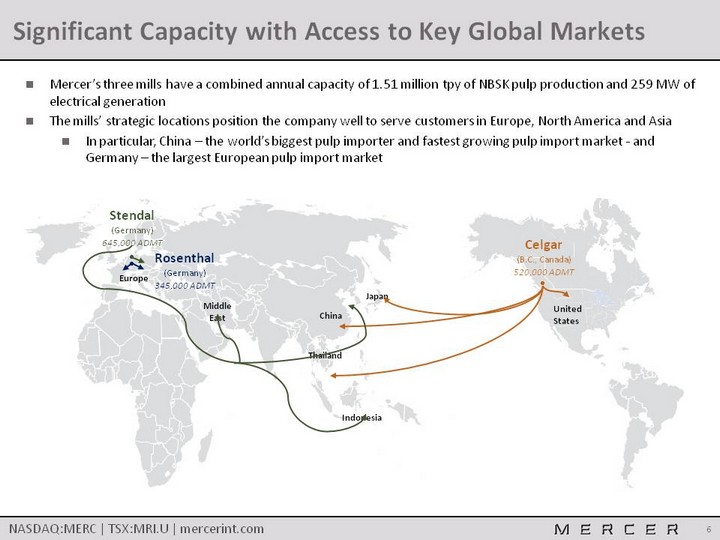
| Significant Capacity with Access to Key Global Markets Mercer's three mills have a combined annual capacity of 1.51 million tpy of NBSK pulp production and 259 MW of electrical generationThe mills' strategic locations position the company well to serve customers in Europe, North America and AsiaIn particular, China - the world's biggest pulp importer and fastest growing pulp import market - and Germany - the largest European pulp import market Celgar (B.C., Canada)520,000 ADMT United States Stendal (Germany)645,000 ADMT Rosenthal (Germany)345,000 ADMT ^ Indonesia China Thailand Middle East Europe Japan ^ ^ |
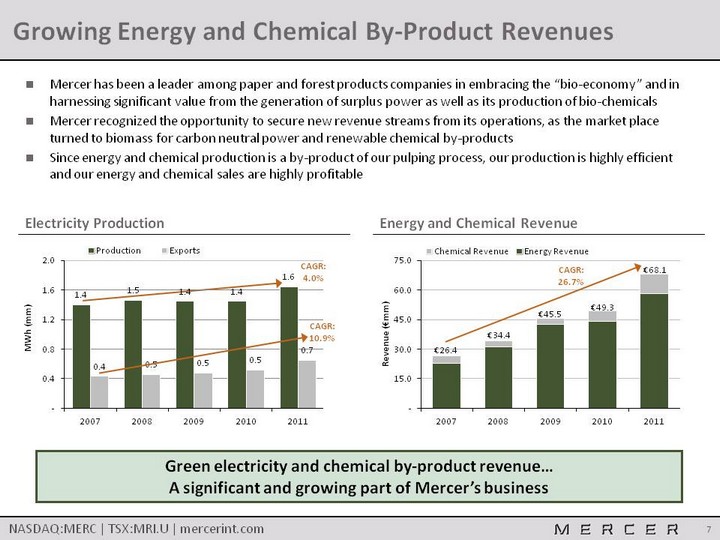
| Growing Energy and Chemical By-Product Revenues Mercer has been a leader among paper and forest products companies in embracing the "bio-economy" and in harnessing significant value from the generation of surplus power as well as its production of bio-chemicals Mercer recognized the opportunity to secure new revenue streams from its operations, as the market place turned to biomass for carbon neutral power and renewable chemical by-productsSince energy and chemical production is a by-product of our pulping process, our production is highly efficient and our energy and chemical sales are highly profitable Green electricity and chemical by-product revenue... A significant and growing part of Mercer's business Electricity Production Energy and Chemical Revenue (CHART) CAGR: 4.0% CAGR: 10.9% (CHART) CAGR: 26.7% |

| The NBSK Market |
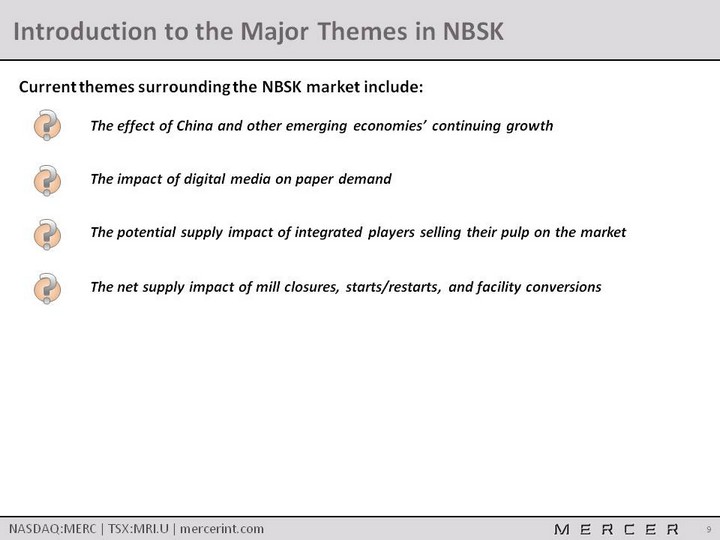
| Introduction to the Major Themes in NBSK The impact of digital media on paper demand ? Current themes surrounding the NBSK market include: The effect of China and other emerging economies' continuing growth ? The net supply impact of mill closures, starts/restarts, and facility conversions ? The potential supply impact of integrated players selling their pulp on the market ? |
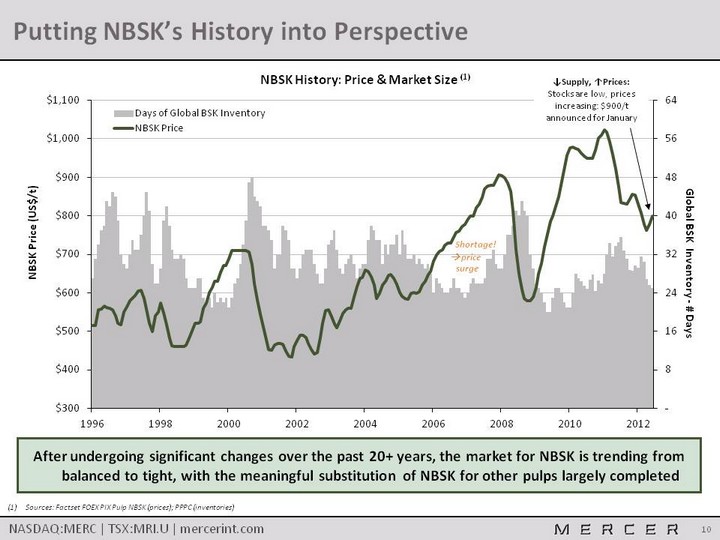
| After undergoing significant changes over the past 20+ years, the market for NBSK is trending from balanced to tight, with the meaningful substitution of NBSK for other pulps largely completed Putting NBSK's History into Perspective (CHART) Shortage! ? price surge Sources: Factset FOEX PIX Pulp NBSK (prices); PPPC (inventories) ^Supply, ^Prices:Stocks are low, prices increasing: $900/t announced for January |

| Source: Brian McClay 2012 (end use) / Hawkins Wright 2012 (total demand)Source: RISI 2011 Changes to NBSK End Use Markets Changes to Papermakers' Demand for NBSK Changes to End Users' Demand for Paper Impact of Paper / Tissue Expansion on NBSK Demand (2011-2016) (2) Impact of Paper / Tissue Expansion on NBSK Demand (2011-2016) (2) Impact of Paper / Tissue Expansion on NBSK Demand (2011-2016) (2) Impact of Paper / Tissue Expansion on NBSK Demand (2011-2016) (2) Impact of Paper / Tissue Expansion on NBSK Demand (2011-2016) (2) Impact of Paper / Tissue Expansion on NBSK Demand (2011-2016) (2) Production Grade Gross ^ Capacity (kt) Approx. Filler * (%) Net ^ Capacity ** (kt) Approx. NBSK *** (%) New NBSK Demand (kt) Freesheet Uncoated +4,112 20% +3,290 12% +395 Freesheet Coated +2,228 25% +1,671 13% +215 Mechanical Uncoated (1,178) 22% (919) 13% (120) Mechanical Coated (33) 27% (24) 14% (5) Newsprint +574 - - 5% - Tissue +5,655 - +5,655 33% +1,865 Specialty / Packaging +1,526 20% +1,221 18% +220 Gross New NBSK Demand Gross New NBSK Demand Gross New NBSK Demand +2,570 Less Terrace Bay & Ilim NBSK Capacity Less Terrace Bay & Ilim NBSK Capacity Less Terrace Bay & Ilim NBSK Capacity (850) Net New NBSK Demand Net New NBSK Demand Net New NBSK Demand +1,720 * Mercer estimate, includes minerals and coatings, **Net of filler, *** Mercer conservative estimate (CHART) 7% 60% 15% 18% 5% 33% 25% 37% NBSK's strength attributes make it a necessary input for many of the fast-growing, high-end grades such as specialty, freesheet, and tissues papers |
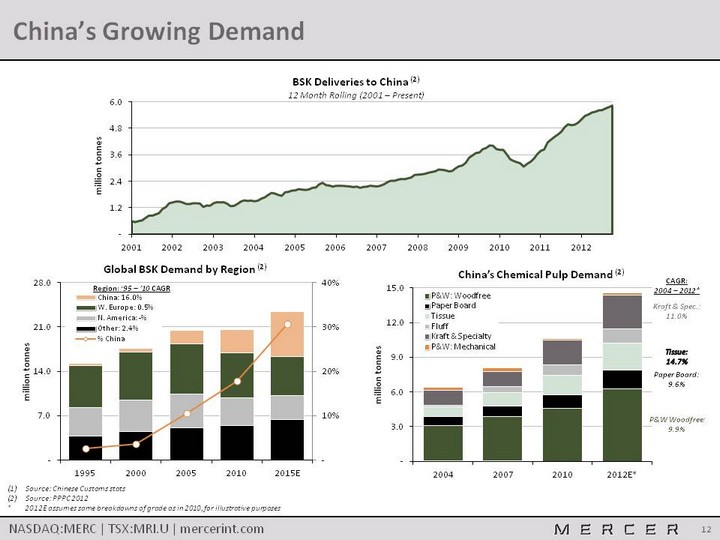
| China's Growing Demand Source: Chinese Customs statsSource: PPPC 2012* 2012E assumes same breakdowns of grade as in 2010, for illustrative purposes (CHART) (CHART) P&W Woodfree:9.9% Paper Board:9.6% Kraft & Spec.:11.0% (CHART) Tissue:14.7% CAGR:2004 - 2012* Region: '95 - '10 CAGR |
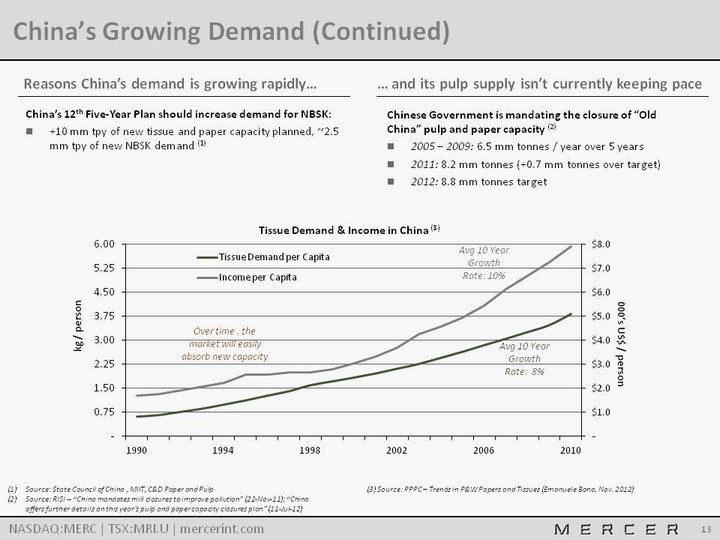
| China's Growing Demand (Continued) Source: State Council of China , MIIT, C&D Paper and PulpSource: RISI -- "China mandates mill closures to improve pollution" (22-Nov-11); "China offers further details on this year's pulp and paper capacity closures plan" (11-Jul-12) Reasons China's demand is growing rapidly... ... and its pulp supply isn't currently keeping pace (CHART) Over time , the market will easily absorb new capacity Avg 10 Year Growth Rate: 10% Avg 10 Year Growth Rate: 8% China's 12th Five-Year Plan should increase demand for NBSK:+10 mm tpy of new tissue and paper capacity planned, ~2.5 mm tpy of new NBSK demand (1) Chinese Government is mandating the closure of "Old China" pulp and paper capacity (2)2005 - 2009: 6.5 mm tonnes / year over 5 years2011: 8.2 mm tonnes (+0.7 mm tonnes over target)2012: 8.8 mm tonnes target (3) Source: PPPC - Trends in P&W Papers and Tissues (Emanuele Bono, Nov. 2012) |
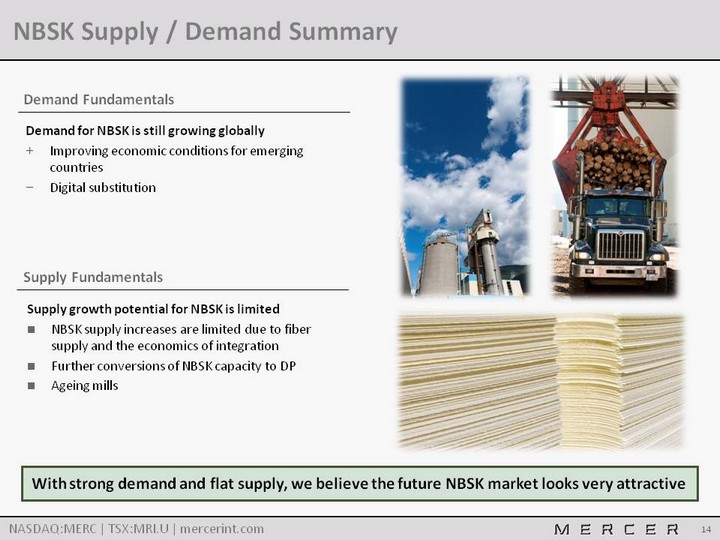
| NBSK Supply / Demand Summary Demand Fundamentals Supply Fundamentals Demand for NBSK is still growing globally Improving economic conditions for emerging countriesDigital substitution Supply growth potential for NBSK is limitedNBSK supply increases are limited due to fiber supply and the economics of integrationFurther conversions of NBSK capacity to DPAgeing mills With strong demand and flat supply, we believe the future NBSK market looks very attractive |

| Appendix A Additional Information on Mercer International Inc. |
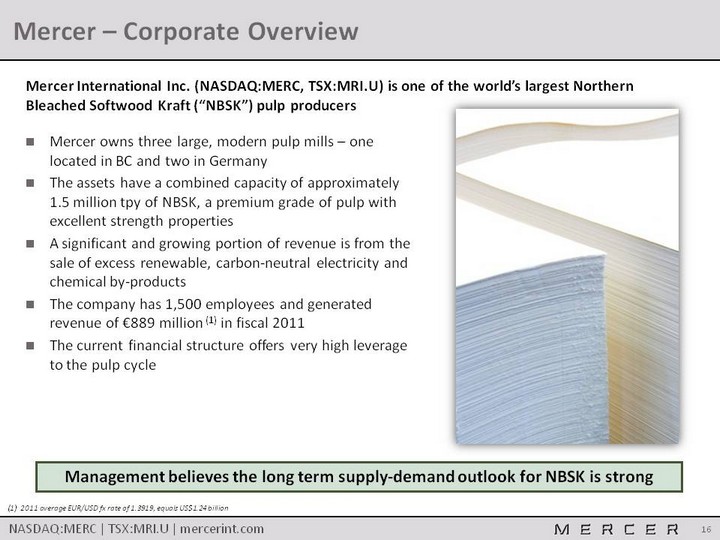
| Mercer - Corporate Overview Mercer owns three large, modern pulp mills - one located in BC and two in GermanyThe assets have a combined capacity of approximately 1.5 million tpy of NBSK, a premium grade of pulp with excellent strength propertiesA significant and growing portion of revenue is from the sale of excess renewable, carbon-neutral electricity and chemical by-productsThe company has 1,500 employees and generated revenue of €889 million (1) in fiscal 2011The current financial structure offers very high leverage to the pulp cycle Management believes the long term supply-demand outlook for NBSK is strong (1) 2011 average EUR/USD fx rate of 1.3919, equals US$1.24 billion Mercer International Inc. (NASDAQ:MERC, TSX:MRI.U) is one of the world's largest Northern Bleached Softwood Kraft ("NBSK") pulp producers |
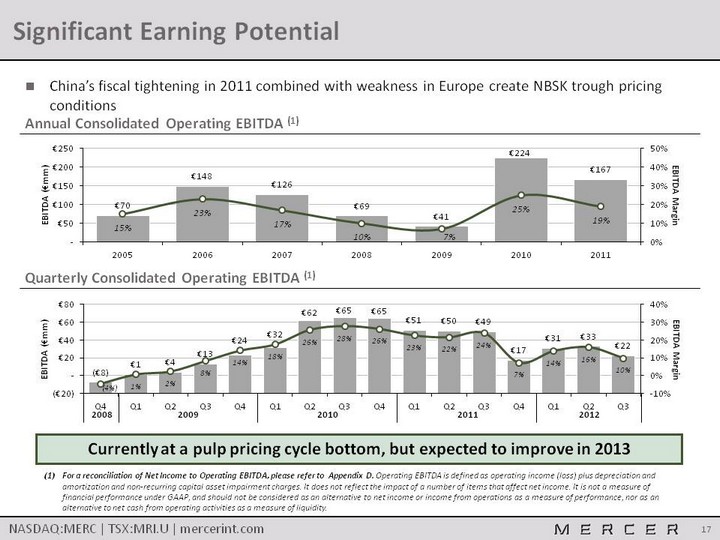
| Significant Earning Potential China's fiscal tightening in 2011 combined with weakness in Europe create NBSK trough pricing conditions Currently at a pulp pricing cycle bottom, but expected to improve in 2013 Annual Consolidated Operating EBITDA (1) (CHART) (CHART) 2008 2009 2010 2011 2012 Quarterly Consolidated Operating EBITDA (1) For a reconciliation of Net Income to Operating EBITDA, please refer to Appendix D. Operating EBITDA is defined as operating income (loss) plus depreciation and amortization and non-recurring capital asset impairment charges. It does not reflect the impact of a number of items that affect net income. It is not a measure of financial performance under GAAP, and should not be considered as an alternative to net income or income from operations as a measure of performance, nor as an alternative to net cash from operating activities as a measure of liquidity. |

| Balance Sheet - September 30, 2012 in millions Restricted Unrestricted Adjustments ConsolidatedASSETS Cash, Cash Equivalents & Marketable Securities € 55.0 € 71.1 - € 126.2 Receivables € 62.3 € 56.3 - € 118.6 Inventories € 69.8 € 43.5 - € 113.4 Other Current Assets € 13.0 € 6.2 - € 19.2Total Current Assets € 200.2 € 177.2 - € 377.4 Property, Plant and Equipment € 356.3 € 459.4 - € 815.7 Due from Unrestricted Group € 100.0 - (€ 100.0) - Other Long-Term Assets € 15.0 € 12.7 - € 27.7Total Long-Term Assets € 471.2 € 472.1 (€ 100.0) € 843.3 TOTAL ASSETS € 671.4 € 649.3 (€ 100.0) € 1,220.7 LIABILITIES & EQUITY Payables € 62.7 € 52.4 - € 115.0 Current Debt € 1.1 € 40.0 - € 41.1 Other Current Liabilities € 0.8 - - € 0.8Total Current Liabilities € 64.6 € 92.4 - € 156.9 Debt € 221.7 € 449.1 - € 670.8 Due to Restricted Group - € 100.0 (€ 100.0) - Other Liabilities € 44.2 € 60.1 - € 104.2Total Long-Term Liabilities € 265.9 € 609.1 (€ 100.0) € 775.0 Total Shareholders' Equity (Deficit) € 341.0 (€ 36.5) - € 304.5 Non-Controlling Interest (Deficit) - (€ 15.7) - (€ 15.7) Total Equity € 341.0 (€ 52.2) - € 288.8 TOTAL LIABILITIES AND EQUITY € 671.4 € 649.3 (€ 100.0) € 1,220.7 Note: Restricted Group consists of Celgar and Rosenthal; Unrestricted Group consists of Stendal (see Corporate Structure slide for more detail) |
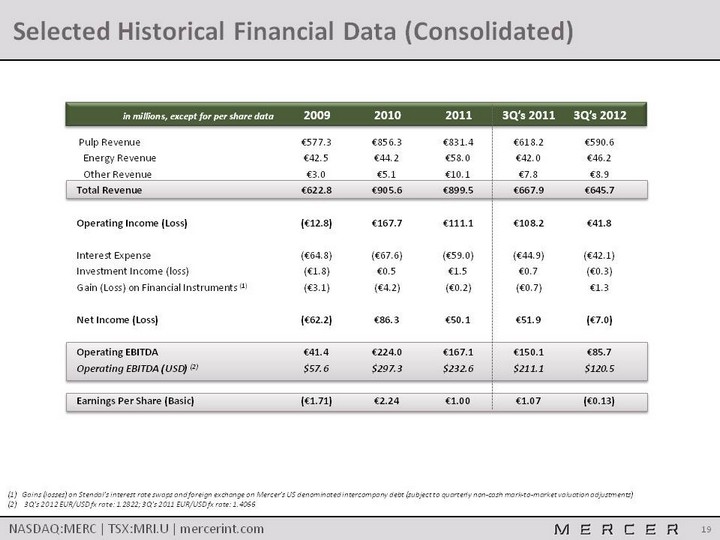
| Selected Historical Financial Data (Consolidated) in millions, except for per share data 2009 2010 2011 3Q's 2011 3Q's 2012 Pulp Revenue €577.3 €856.3 €831.4 €618.2 €590.6 Energy Revenue €42.5 €44.2 €58.0 €42.0 €46.2 Other Revenue €3.0 €5.1 €10.1 €7.8 €8.9Total Revenue €622.8 €905.6 €899.5 €667.9 €645.7Operating Income (Loss) (€12.8) €167.7 €111.1 €108.2 €41.8 Interest Expense (€64.8) (€67.6) (€59.0) (€44.9) (€42.1)Investment Income (loss) (€1.8) €0.5 €1.5 €0.7 (€0.3)Gain (Loss) on Financial Instruments (1) (€3.1) (€4.2) (€0.2) (€0.7) €1.3 Net Income (Loss) (€62.2) €86.3 €50.1 €51.9 (€7.0) Operating EBITDA €41.4 €224.0 €167.1 €150.1 €85.7Operating EBITDA (USD) (2) $57.6 $297.3 $232.6 $211.1 $120.5 Earnings Per Share (Basic) (€1.71) €2.24 €1.00 €1.07 (€0.13) (1) Gains (losses) on Stendal's interest rate swaps and foreign exchange on Mercer's US denominated intercompany debt (subject to quarterly non-cash mark-to-market valuation adjustments)(2) 3Q's 2012 EUR/USD fx rate: 1.2822; 3Q's 2011 EUR/USD fx rate: 1.4066 |
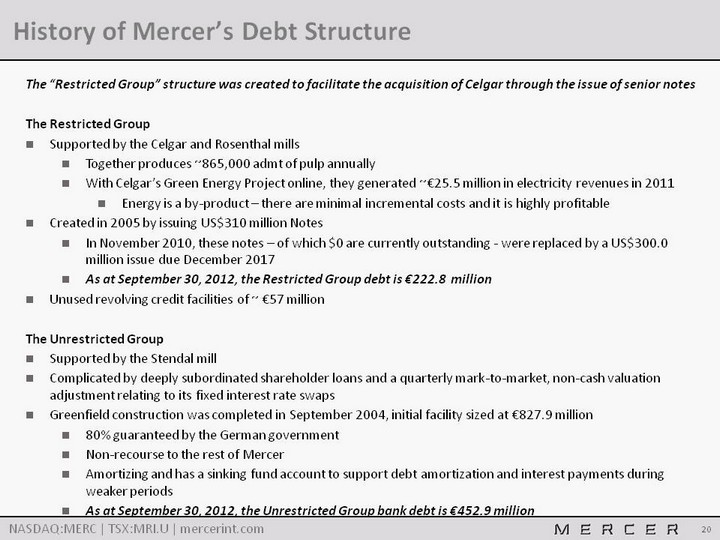
| History of Mercer's Debt Structure The "Restricted Group" structure was created to facilitate the acquisition of Celgar through the issue of senior notesThe Restricted GroupSupported by the Celgar and Rosenthal millsTogether produces ~865,000 admt of pulp annually With Celgar's Green Energy Project online, they generated ~€25.5 million in electricity revenues in 2011Energy is a by-product - there are minimal incremental costs and it is highly profitableCreated in 2005 by issuing US$310 million Notes In November 2010, these notes - of which $0 are currently outstanding - were replaced by a US$300.0 million issue due December 2017As at September 30, 2012, the Restricted Group debt is €222.8 millionUnused revolving credit facilities of ~ €57 millionThe Unrestricted GroupSupported by the Stendal millComplicated by deeply subordinated shareholder loans and a quarterly mark-to-market, non-cash valuation adjustment relating to its fixed interest rate swapsGreenfield construction was completed in September 2004, initial facility sized at €827.9 million80% guaranteed by the German governmentNon-recourse to the rest of MercerAmortizing and has a sinking fund account to support debt amortization and interest payments during weaker periodsAs at September 30, 2012, the Unrestricted Group bank debt is €452.9 million |
| Appendix B Detail on NBSK Supply and Demand |
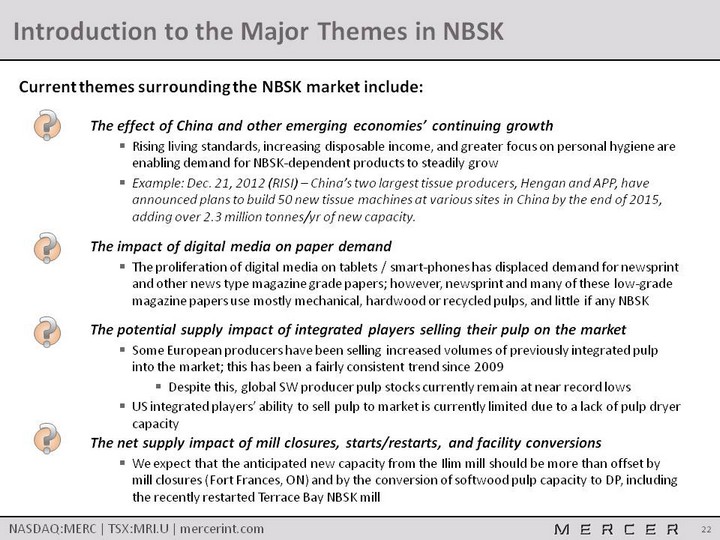
| Introduction to the Major Themes in NBSK The impact of digital media on paper demandThe proliferation of digital media on tablets / smart-phones has displaced demand for newsprint and other news type magazine grade papers; however, newsprint and many of these low-grade magazine papers use mostly mechanical, hardwood or recycled pulps, and little if any NBSK ? Current themes surrounding the NBSK market include: The effect of China and other emerging economies' continuing growthRising living standards, increasing disposable income, and greater focus on personal hygiene are enabling demand for NBSK-dependent products to steadily growExample: Dec. 21, 2012 (RISI) - China's two largest tissue producers, Hengan and APP, have announced plans to build 50 new tissue machines at various sites in China by the end of 2015, adding over 2.3 million tonnes/yr of new capacity. ? The net supply impact of mill closures, starts/restarts, and facility conversionsWe expect that the anticipated new capacity from the Ilim mill should be more than offset by mill closures (Fort Frances, ON) and by the conversion of softwood pulp capacity to DP, including the recently restarted Terrace Bay NBSK mill ? The potential supply impact of integrated players selling their pulp on the marketSome European producers have been selling increased volumes of previously integrated pulp into the market; this has been a fairly consistent trend since 2009Despite this, global SW producer pulp stocks currently remain at near record lows US integrated players' ability to sell pulp to market is currently limited due to a lack of pulp dryer capacity ? |
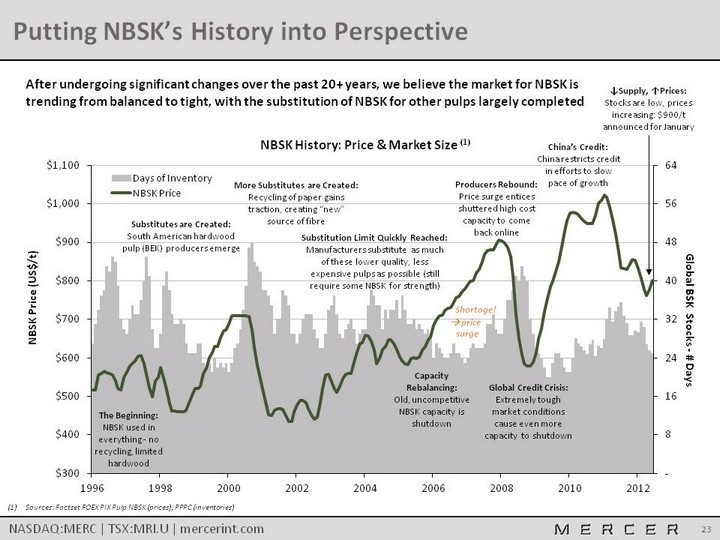
| Putting NBSK's History into Perspective (CHART) After undergoing significant changes over the past 20+ years, we believe the market for NBSK is trending from balanced to tight, with the substitution of NBSK for other pulps largely completed The Beginning:NBSK used in everything - no recycling, limited hardwood Substitutes are Created:South American hardwood pulp (BEK) producers emerge More Substitutes are Created:Recycling of paper gains traction, creating "new" source of fibre Capacity Rebalancing:Old, uncompetitive NBSK capacity is shutdown Global Credit Crisis:Extremely tough market conditions cause even more capacity to shutdown Shortage! ? price surge Substitution Limit Quickly Reached:Manufacturers substitute as much of these lower quality, less expensive pulps as possible (still require some NBSK for strength) Producers Rebound:Price surge entices shuttered high cost capacity to come back online Sources: Factset FOEX PIX Pulp NBSK (prices); PPPC (inventories) China's Credit:China restricts credit in efforts to slow pace of growth ^Supply, ^Prices:Stocks are low, prices increasing: $900/t announced for January |

| Changes to NBSK End Use Markets Changes to Papermakers' Demand for NBSK Changes to End Users' Demand for Paper We believe pulp users are reaching the limit of substituting cheaper HW / recycled pulps in place of NBSKNBSK, a premium pulp grade, has key strength attributes that make it a required input for many paper gradesModern machines with faster production rates, increased recycled content, and lower basis weights require strong materialsLow quality papers can use relatively more HW / recycled pulp than higher quality papers Low-grade papers, requiring little NBSK, are decliningProducts include mechanical papers and newsprintCaused by digital media substitutionHigh-grade papers, requiring a lot of NBSK, are fast growingProducts include tissues and specialtiesIncrease in global demand for NBSK is expected to be nearly 2.6 million tpy which is still much greater than the anticipated increased in supply from new mills Impact of Paper / Tissue Expansion on NBSK Demand (2011-2016) (2) Impact of Paper / Tissue Expansion on NBSK Demand (2011-2016) (2) Impact of Paper / Tissue Expansion on NBSK Demand (2011-2016) (2) Impact of Paper / Tissue Expansion on NBSK Demand (2011-2016) (2) Impact of Paper / Tissue Expansion on NBSK Demand (2011-2016) (2) Impact of Paper / Tissue Expansion on NBSK Demand (2011-2016) (2) Production Grade Gross ^ Capacity (kt) Approx. Filler * (%) Net ^ Capacity ** (kt) Approx. NBSK *** (%) New NBSK Demand (kt) Freesheet Uncoated +4,112 20% +3,290 12% +395 Freesheet Coated +2,228 25% +1,671 13% +215 Mechanical Uncoated (1,178) 22% (919) 13% (120) Mechanical Coated (33) 27% (24) 14% (5) Newsprint +574 - - 5% - Tissue +5,655 - +5,655 33% +1,865 Specialty / Packaging +1,526 20% +1,221 18% +220 Gross New NBSK Demand Gross New NBSK Demand Gross New NBSK Demand +2,570 Less Terrace Bay & Ilim NBSK Capacity Less Terrace Bay & Ilim NBSK Capacity Less Terrace Bay & Ilim NBSK Capacity (850) Net New NBSK Demand Net New NBSK Demand Net New NBSK Demand +1,720 * Mercer estimate, includes minerals and coatings, **Net of filler, *** Mercer estimate (CHART) 7% 60% 15% 18% 5% 33% 25% 37% Source: Brian McClay 2012 (end use) / Hawkins Wright 2012 (total demand)Source: RISI 2011 |
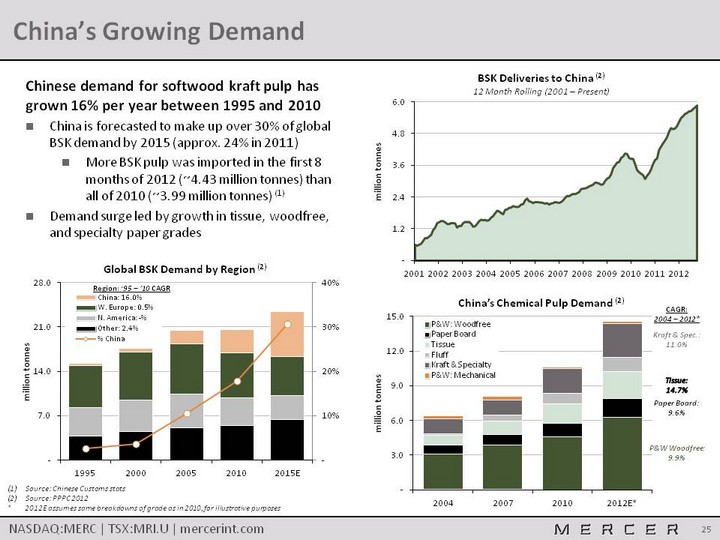
| China's Growing Demand Chinese demand for softwood kraft pulp has grown 16% per year between 1995 and 2010China is forecasted to make up over 30% of global BSK demand by 2015 (approx. 24% in 2011)More BSK pulp was imported in the first 8 months of 2012 (~4.43 million tonnes) than all of 2010 (~3.99 million tonnes) (1)Demand surge led by growth in tissue, woodfree, and specialty paper grades Source: Chinese Customs statsSource: PPPC 2012* 2012E assumes same breakdowns of grade as in 2010, for illustrative purposes (CHART) (CHART) P&W Woodfree:9.9% Paper Board:9.6% Kraft & Spec.:11.0% (CHART) Tissue:14.7% CAGR:2004 - 2012* Region: '95 - '10 CAGR |

| China's Growing Demand (Continued) Source: State Council of China , MIIT, C&D Paper and PulpSource: PPPC - Trends in P&W Papers and Tissues (Emanuele Bono, Nov. 2012) Reasons China's demand is growing rapidly... ... and its pulp supply isn't currently keeping pace (CHART) Over time , the market will easily absorb new capacity Avg 10 Year Growth Rate: 10% Avg 10 Year Growth Rate: 8% China's 12th Five-Year Plan should increase demand for NBSK:+10 mm tpy of new tissue and paper capacity planned, ~2.5 mm tpy of new NBSK demand (1)Growth in Chinese per capita tissue, wood-free, and specialty paper grade consumption is due to:Rising living standardsGrowing disposable incomeIncreased focus on hygiene Shutting down of "Old China" pulp and paper capacitySignificant closures to date and more to come (see RISI data below)Implementing pollution and water / energy constraints to stay operatingModern assets require greater volumes of NBSK to run machines at optimal ratesFocus on wood-based pulps, but limited domestic wood fiber supply, means large pulp import volumesHealthy demand for virgin fibre as paper recovery is nearing feasible maximums in most markets Chinese Government Mandated Closure of "Old China" Capacity2005-2009: 6.5 mm tonnes/year over 5 years2011: 8.2 mm tonnes (+0.7 mm tonnes over target) 2012: 8.8 mm tonnes targetSource: RISI -- "China mandates mill closures to improve pollution" (22- Nov-11); "China offers further details on this year's pulp and paper capacity closures plan" (11-Jul-12) |

| Appendix C Detailed Overview of Operations |
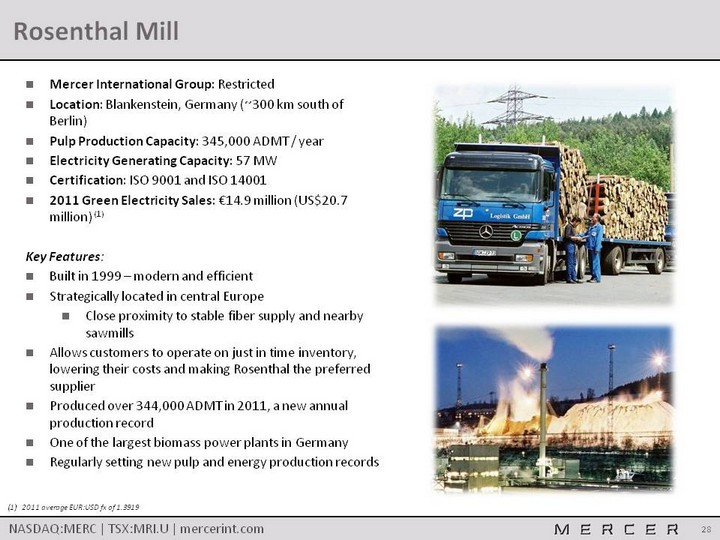
| Rosenthal Mill (1) 2011 average EUR:USD fx of 1.3919 Mercer International Group: RestrictedLocation: Blankenstein, Germany (~300 km south of Berlin)Pulp Production Capacity: 345,000 ADMT / yearElectricity Generating Capacity: 57 MWCertification: ISO 9001 and ISO 14001 2011 Green Electricity Sales: €14.9 million (US$20.7 million) (1)Key Features:Built in 1999 - modern and efficientStrategically located in central EuropeClose proximity to stable fiber supply and nearby sawmillsAllows customers to operate on just in time inventory, lowering their costs and making Rosenthal the preferred supplierProduced over 344,000 ADMT in 2011, a new annual production recordOne of the largest biomass power plants in Germany Regularly setting new pulp and energy production records |
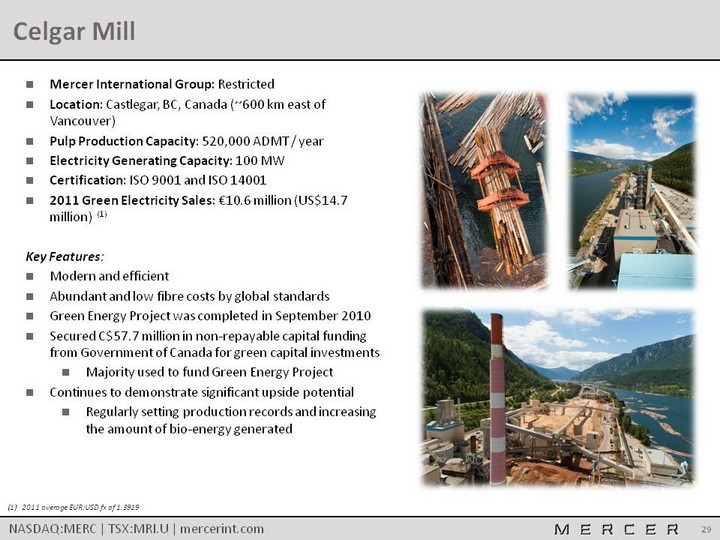
| Celgar Mill Mercer International Group: RestrictedLocation: Castlegar, BC, Canada (~600 km east of Vancouver)Pulp Production Capacity: 520,000 ADMT / yearElectricity Generating Capacity: 100 MWCertification: ISO 9001 and ISO 14001 2011 Green Electricity Sales: €10.6 million (US$14.7 million) (1)Key Features:Modern and efficientAbundant and low fibre costs by global standardsGreen Energy Project was completed in September 2010Secured C$57.7 million in non-repayable capital funding from Government of Canada for green capital investmentsMajority used to fund Green Energy Project Continues to demonstrate significant upside potentialRegularly setting production records and increasing the amount of bio-energy generated (1) 2011 average EUR:USD fx of 1.3919 |
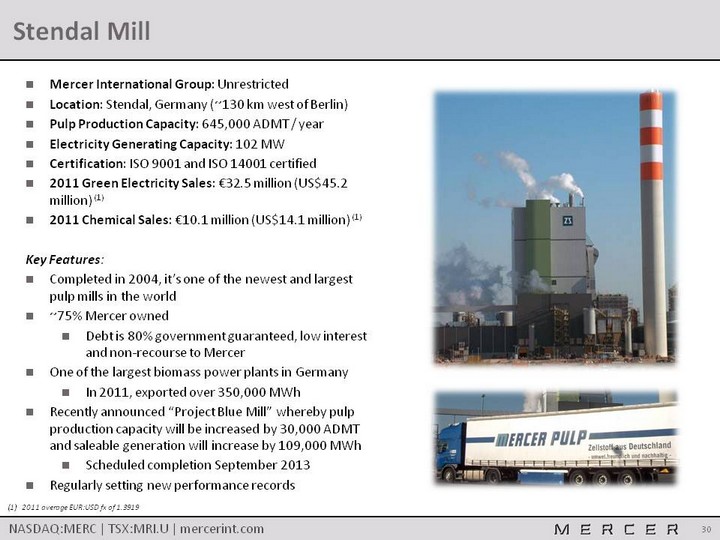
| Stendal Mill Mercer International Group: UnrestrictedLocation: Stendal, Germany (~130 km west of Berlin)Pulp Production Capacity: 645,000 ADMT / yearElectricity Generating Capacity: 102 MWCertification: ISO 9001 and ISO 14001 certified2011 Green Electricity Sales: €32.5 million (US$45.2 million) (1)2011 Chemical Sales: €10.1 million (US$14.1 million) (1)Key Features:Completed in 2004, it's one of the newest and largest pulp mills in the world~75% Mercer ownedDebt is 80% government guaranteed, low interest and non-recourse to MercerOne of the largest biomass power plants in Germany In 2011, exported over 350,000 MWhRecently announced "Project Blue Mill" whereby pulp production capacity will be increased by 30,000 ADMT and saleable generation will increase by 109,000 MWhScheduled completion September 2013Regularly setting new performance records (1) 2011 average EUR:USD fx of 1.3919 |
| Appendix D Reconciliation of Net Income to Operating EBITDA |
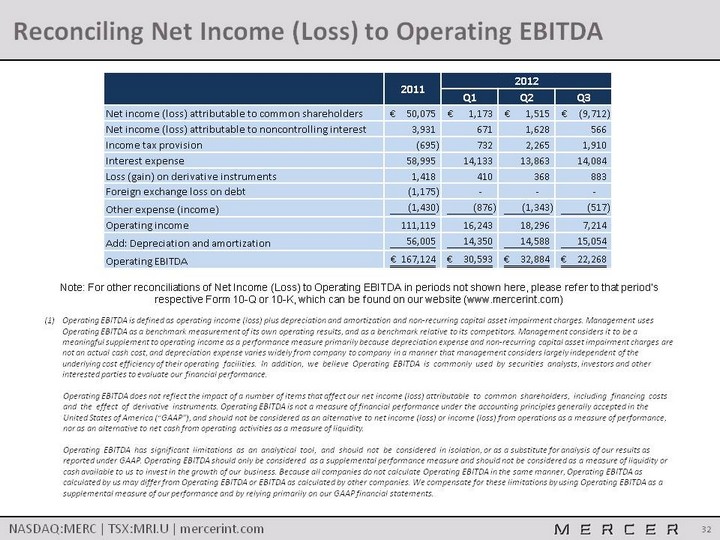
| Reconciling Net Income (Loss) to Operating EBITDA Operating EBITDA is defined as operating income (loss) plus depreciation and amortization and non-recurring capital asset impairment charges. Management uses Operating EBITDA as a benchmark measurement of its own operating results, and as a benchmark relative to its competitors. Management considers it to be a meaningful supplement to operating income as a performance measure primarily because depreciation expense and non-recurring capital asset impairment charges are not an actual cash cost, and depreciation expense varies widely from company to company in a manner that management considers largely independent of the underlying cost efficiency of their operating facilities. In addition, we believe Operating EBITDA is commonly used by securities analysts, investors and other interested parties to evaluate our financial performance.Operating EBITDA does not reflect the impact of a number of items that affect our net income (loss) attributable to common shareholders, including financing costs and the effect of derivative instruments. Operating EBITDA is not a measure of financial performance under the accounting principles generally accepted in the United States of America ("GAAP"), and should not be considered as an alternative to net income (loss) or income (loss) from operations as a measure of performance, nor as an alternative to net cash from operating activities as a measure of liquidity.Operating EBITDA has significant limitations as an analytical tool, and should not be considered in isolation, or as a substitute for analysis of our results as reported under GAAP. Operating EBITDA should only be considered as a supplemental performance measure and should not be considered as a measure of liquidity or cash available to us to invest in the growth of our business. Because all companies do not calculate Operating EBITDA in the same manner, Operating EBITDA as calculated by us may differ from Operating EBITDA or EBITDA as calculated by other companies. We compensate for these limitations by using Operating EBITDA as a supplemental measure of our performance and by relying primarily on our GAAP financial statements. Note: For other reconciliations of Net Income (Loss) to Operating EBITDA in periods not shown here, please refer to that period's respective Form 10-Q or 10-K, which can be found on our website (www.mercerint.com) |