Attached files
| file | filename |
|---|---|
| 8-K - FORM 8-K - NAUTILUS, INC. | d469239d8k.htm |
Exhibit 99.1
|
NAUTILUS Inc The Transformation, The Progress, The Potential 15th Annual ICR XChange JANUARY 2013 |
|
Safe Harbor Statement This presentation includes forward-looking statements (statements which are not historical facts) within the meaning of the Private Securities Litigation Reform Act of 1995, including statements concerning the Company’s prospects, resources, capabilities, current or future financial trends or operating results, demand for the Company’s products, future plans for introduction of new products and the anticipated outcome of new business initiatives. Factors that could cause Nautilus, Inc.’s actual results to differ materially from these forward-looking statements include our ability to acquire inventory from sole source foreign manufacturers at acceptable costs, within timely delivery schedules and that meet our quality control standards, availability and price of media time consistent with our cost and audience profile parameters, a decline in consumer spending due to unfavorable economic conditions in one or more of our current or target markets, an adverse change in the availability of credit for our customers who finance their purchases, our ability to pass along vendor raw material price increases and increased shipping costs, our ability to effectively develop, market and sell future products, our ability to protect our intellectual property, and the introduction of competing products. Additional assumptions, risks and uncertainties are described in detail in our registration statements, reports and other filings with the Securities and Exchange Commission, including the “Risk Factors” set forth in our Annual Report on Form 10-K, as supplemented by our quarterly reports on Form 10-Q. Such filings are available on our website or at www.sec.gov. You are cautioned that such statements are not guarantees of future performance and that actual results or developments may differ materially from those set forth in the forward-looking statements. We undertake no obligation to publicly update or revise forward-looking statements to reflect subsequent events or circumstances. Unless otherwise indicated, all information regarding our operating results pertain to continuing operations. 2 |
|
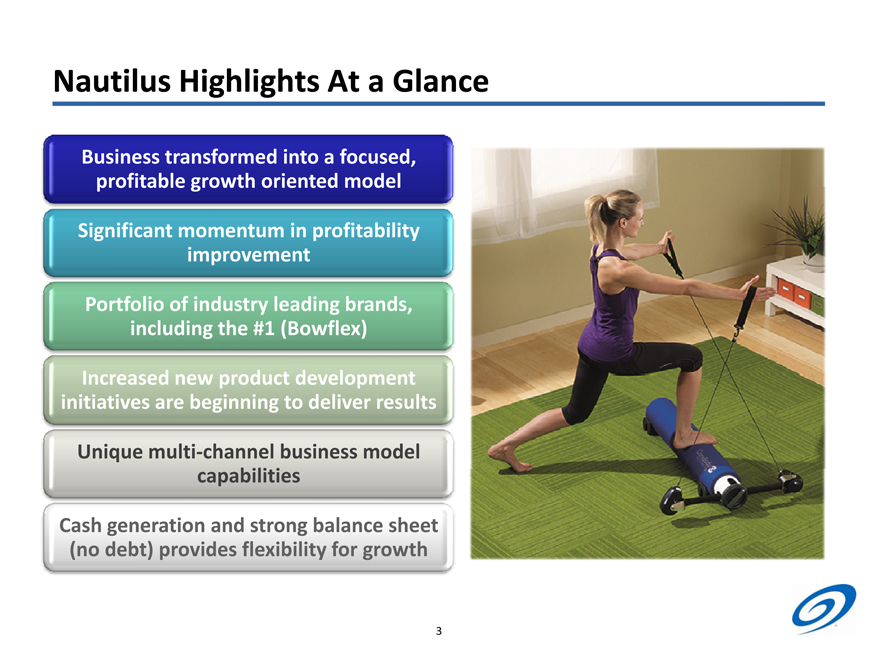
Nautilus Highlights At a Glance Business transformed into a focused, profitable growth oriented model Significant momentum in profitability improvement Portfolio of industry leading brands, including the #1 (Bowflex) Increased new product development initiatives are beginning to deliver results Unique multi-channel business model capabilities Cash generation and strong balance sheet (no debt) provides flexibility for growth 3 |
|
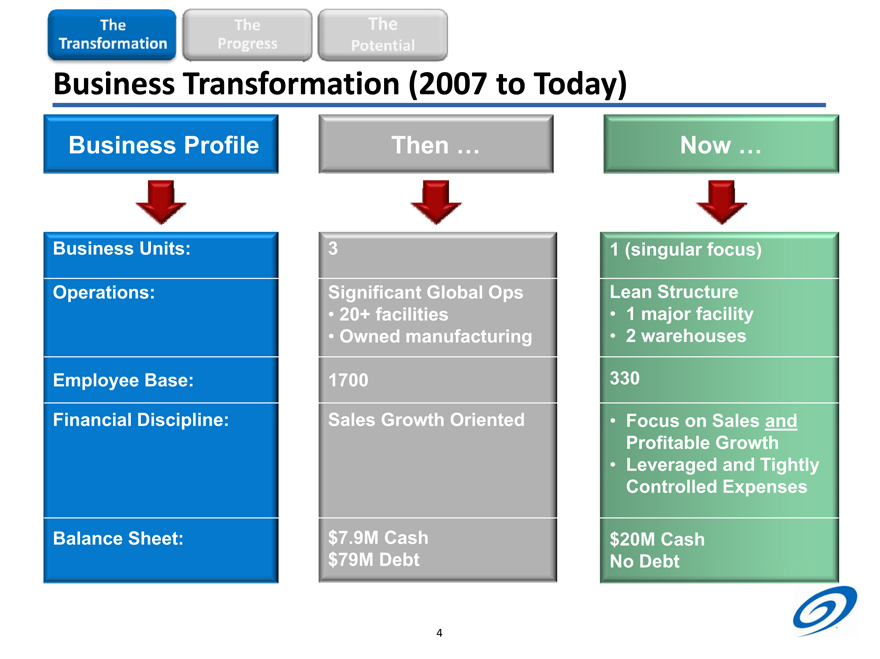
The Transformation The Progress The Potential Business Transformation (2007 to Today) Business Profile Then Now Business Units: 3 1 (singular focus) Operations: Significant Global Ops Lean Structure 20+ facilities 1 major facility Owned manufacturing 2 warehouses Employee Base: 1700 330 Financial Discipline: Sales Growth Oriented Focus on Sales and Profitable Growth Leveraged and Tightly Controlled Expenses Balance Sheet: $7.9M Cash $20M Cash $79M Debt No Debt 4 |
|
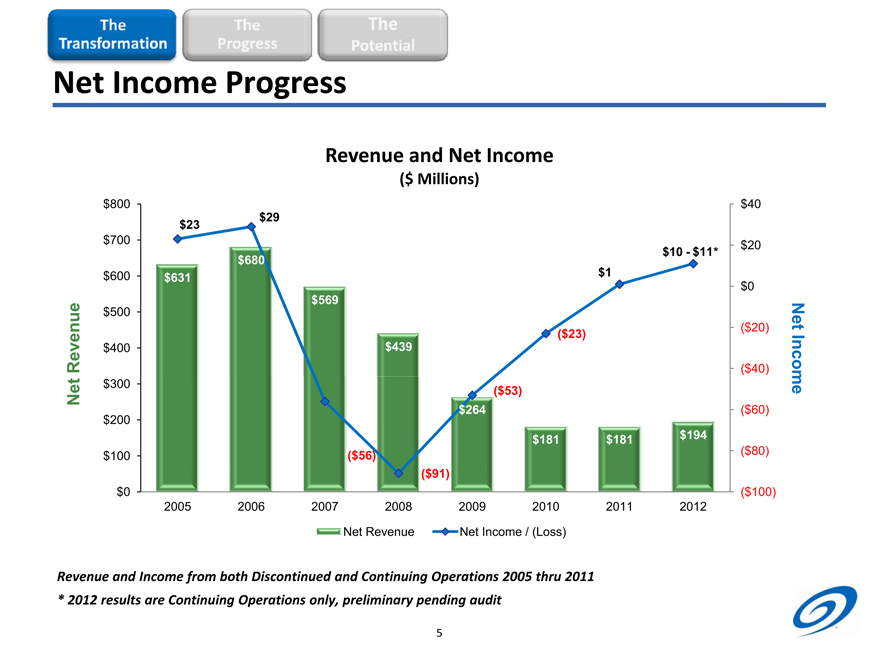
The Transformation The Progress The Potential Net Income Progress Revenue and Net Income ($ Millions) Net Revenue $800 $700 $600 $500 $400 $300 $200 $100 $0 $23 $29 $1 $10 - $11* ($23) ($53) $631 $680 $569 $439 $264 $181 $181 $194 ($56) ($91) $40 $20 $0 ($20) ($40) ($60) ($80) ($100) Net Income 2005 2006 2007 2008 2009 2010 2011 2012 Net Revenue Net Income / (Loss) Revenue and Income from both Discontinued and Continuing Operations 2005 thru 2011 * 2012 results are Continuing Operations only, preliminary pending audit 5 |
|
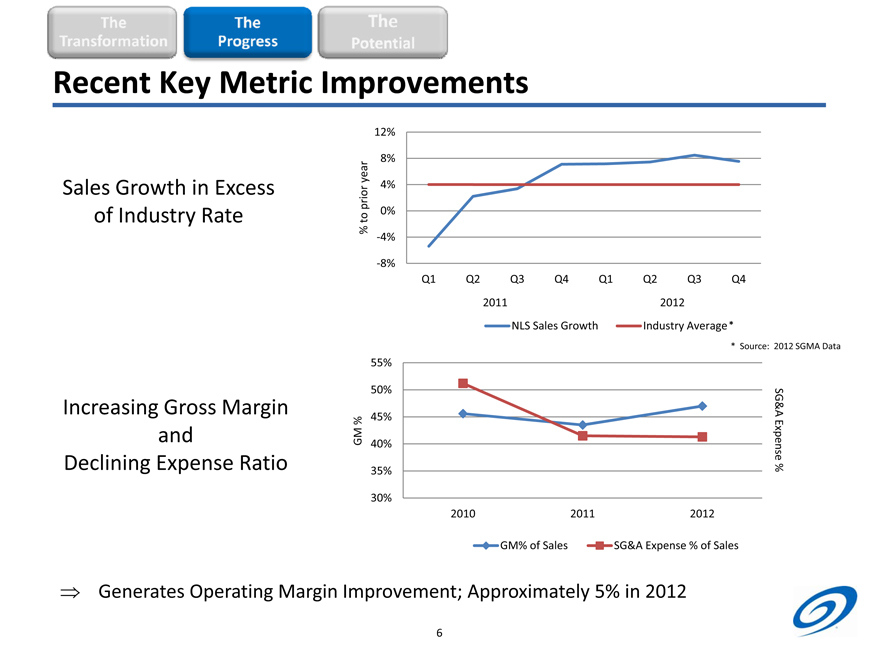
The Transformation The Progress The Potential Recent Key Metric Improvements Sales Growth in Excess of Industry Rate % to prior year 12% 8% 4% 0% -4% -8% Q1 Q2 Q3 Q4 Q1 Q2 Q3 Q4 2011 2012 NLS Sales Growth Industry Average* * Source: 2012 SGMA Data Increasing Gross Margin and Declining Expense Ratio GM% 55% 50% 45% 40% 35% 30% 2010 2011 2012 SG&A Expense % GM% of Sales SG&A Expense % of Sales Generates Operating Margin Improvement; Approximately 5% in 2012 6 |
|
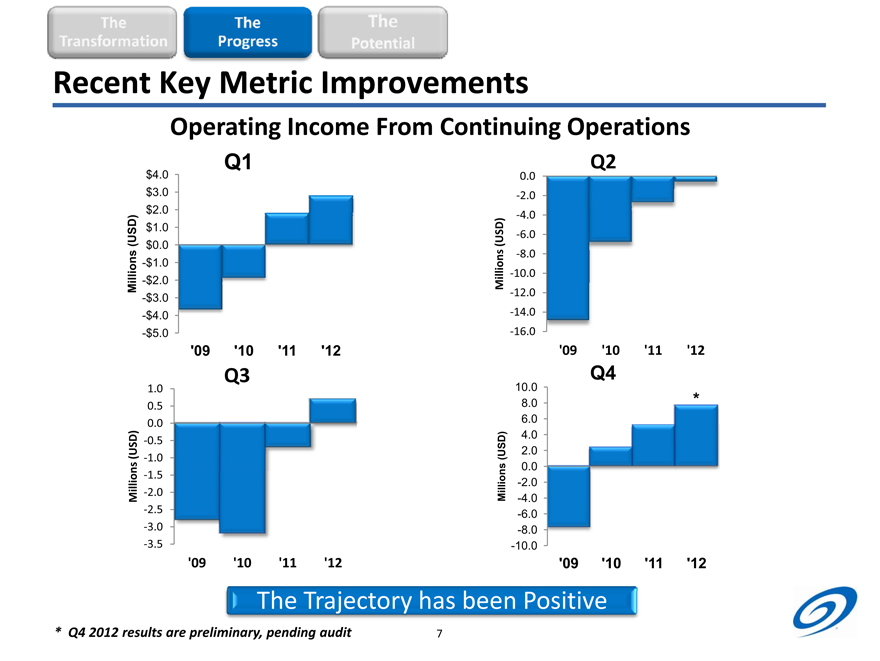
The Transformation The Progress The Potential Recent Key Metric Improvements Operating Income From Continuing Operations Q1 Millions (USD) $4.0 $3.0 $2.0 $1.0 $0.0 -$1.0 -$2.0 -$3.0 -$4.0 -$5.0 ‘09 ‘10 ‘11 ‘12 Q2 Millions (USD) 0.0 -2.0 -4.0 -6.0 -8.0 -10.0 -12.0 -14.0 -16.0 ‘09 ‘10 ‘11 ‘12 Q3 Millions (USD) 1.0 0.5 0.0 -0.5 -1.0 -1.5 -2.0 -2.5 -3.0 -3.5 ‘09 ‘10 ‘11 ‘12 Q4 Millions (USD) 10.0 8.0 6.0 4.0 2.0 0.0 -2.0 -4.0 -6.0 -8.0 -10.0 * ‘09 ‘10 ‘11 ‘12 The Trajectory has been Positive * Q4 2012 results are preliminary, pending audit 7 |
|
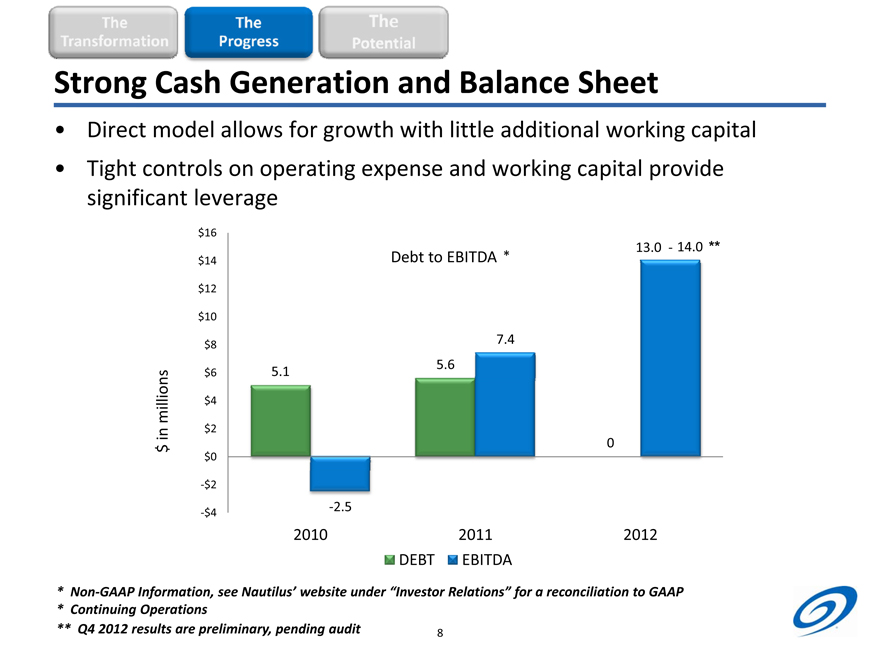
The Transformation The Progress The Potential Strong Cash Generation and Balance Sheet Direct model allows for growth with little additional working capital Tight controls on operating expense and working capital provide significant leverage $16 $14 Debt to EBITDA * 13.0 - 14.0 ** $12 $10 $8 $6 5.1 5.6 7.4 0 $ in millions $4 $2 $0 -$2 -$4 -2.5 2010 2011 2012 DEBT EBITDA * Non-GAAP Information, see Nautilus’ website under “Investor Relations” for a reconciliation to GAAP * Continuing Operations ** Q4 2012 results are preliminary, pending audit 8 |
|
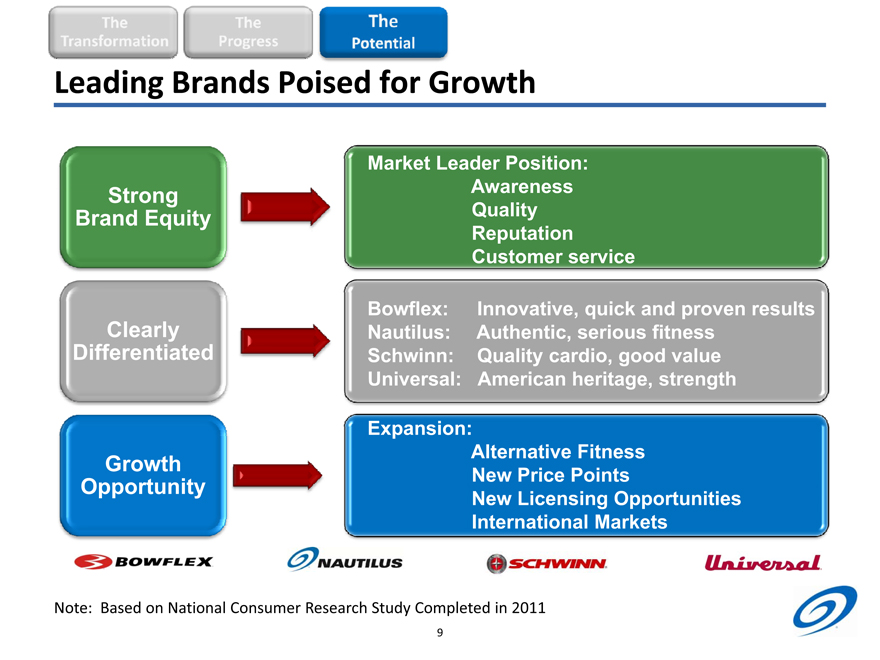
The Transformation The Progress The Potential Leading Brands Poised for Growth Strong Brand Equity Market Leader Position: Awareness Quality Reputation Customer service Clearly Differentiated Bowflex: Innovative, quick and proven results Nautilus: Authentic, serious fitness Schwinn: Quality cardio, good value Universal: American heritage, strength Growth Opportunity Expansion: Alternative Fitness New Price Points New Licensing Opportunities International Markets BOWFLEX NAUTILUS SCHWINN Universal Note: Based on National Consumer Research Study Completed in 2011 9 |
|
The Transformation The Progress The Potential Increased Focus on New Product Development R&D spend and resources were stepped up in 2011 and 2012 Expansion into new price points and alternative fitness in 2012 – CoreBody Reformer, Peak Fitness Extensive complementary network of outside idea resources is yielding positive results Rigorous new product development process ensures market traction and drives improved margins Sales growth, margin improvement, and product reviews prove that the strategy is working 10 |
|
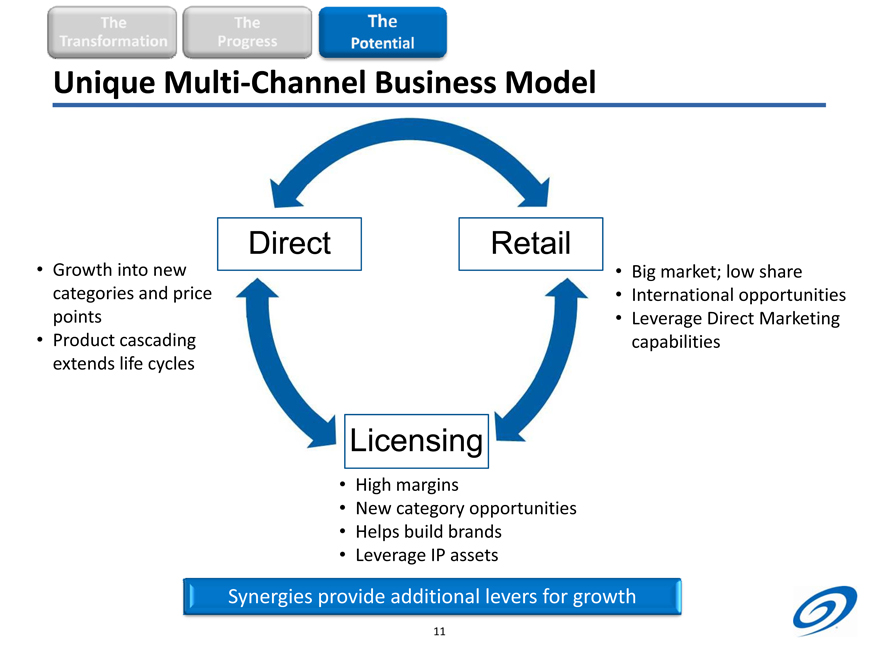
The Transformation The Progress The Potential Unique Multi-Channel Business Model Growth into new categories and price points Product cascading extends life cycles Direct Retail Licensing Big market; low share International opportunities Leverage Direct Marketing capabilities High margins New category opportunities Helps build brands Leverage IP assets Synergies provide additional levers for growth 11 |
|
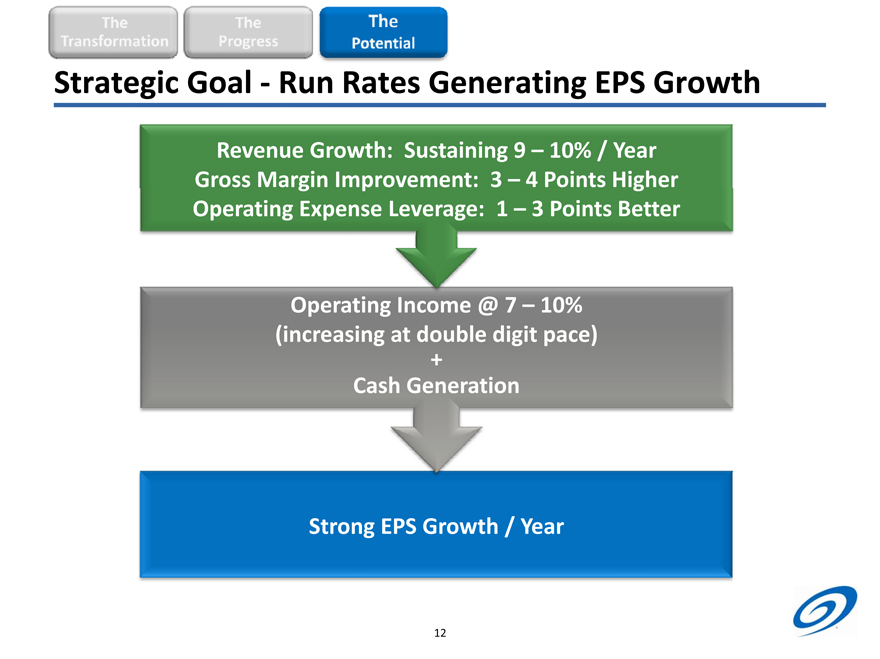
The Transformation The Progress The Potential Strategic Goal - Run Rates Generating EPS Growth Revenue Growth: Sustaining 9 – 10% / Year Gross Margin Improvement: 3 – 4 Points Higher Operating Expense Leverage: 1 – 3 Points Better Operating Income @ 7 – 10% (increasing at double digit pace) + Cash Generation Strong EPS Growth / Year 12 |
|
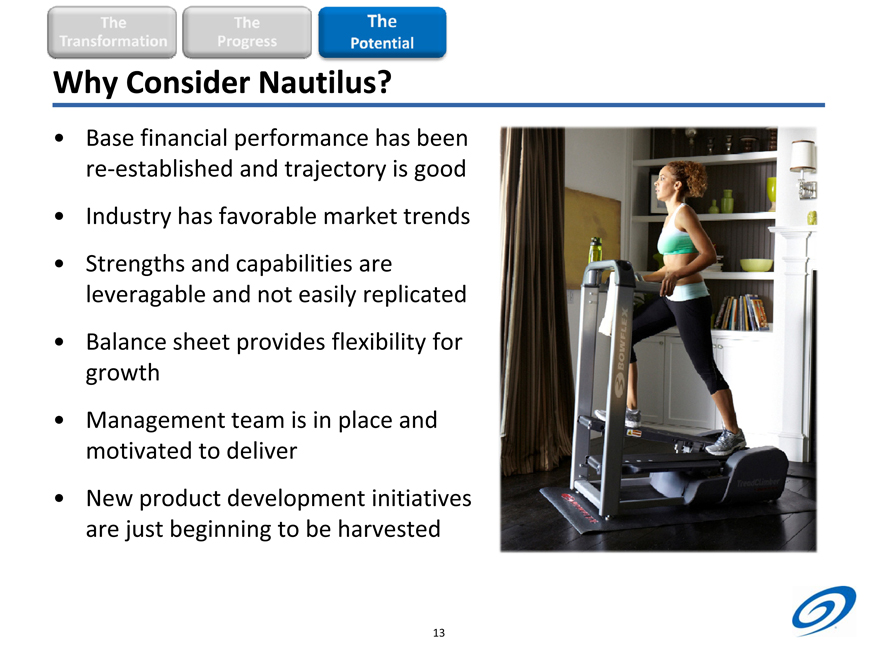
The Transformation The Progress The Potential Why Consider Nautilus? Base financial performance has been re-established and trajectory is good Industry has favorable market trends Strengths and capabilities are leveragable and not easily replicated Balance sheet provides flexibility for growth Management team is in place and motivated to deliver New product development initiatives are just beginning to be harvested 13 |
|
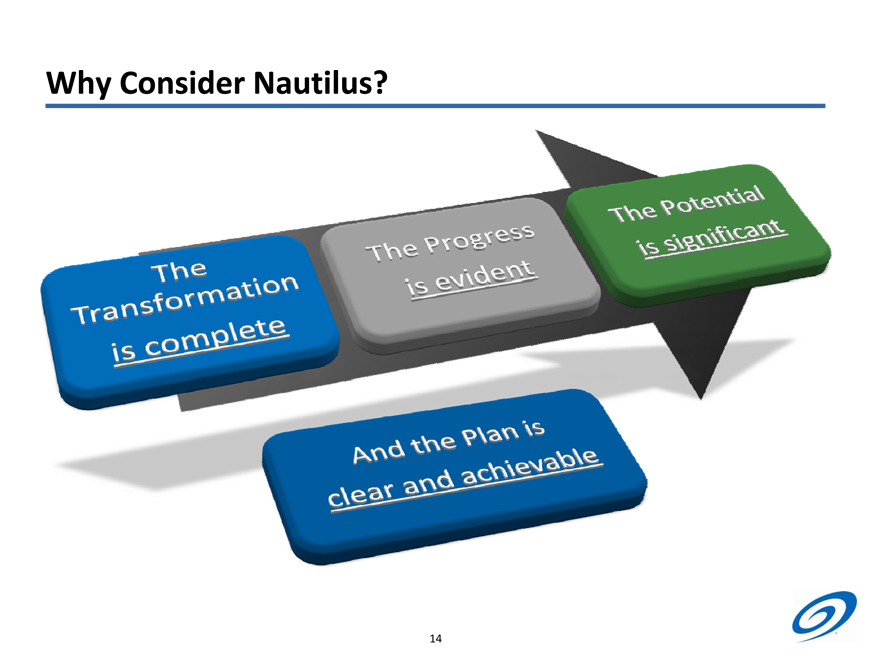
Why Consider Nautilus? The Transformation is complete The Progress is evident The Potential is significant And the Plan is clear and achievable 14 |
|
SCHWINN BOWFLEX NAUTILUS Universal Thank you! |