Attached files
| file | filename |
|---|---|
| 8-K - FORM 8-K - DITECH HOLDING Corp | d469235d8k.htm |
Exhibit 99.1

| Presentation to Lenders $475 million First Lien Term Loan January 2013 0 |
| Forward-Looking Statements This document contains forward-looking statements, including forward-looking statements within the meaning of the Private Securities Litigation Reform Act of 1995. Such forward-looking statements include, but are not limited to, statements concerning Walter Investment's plans, beliefs, objectives, expectations and intentions and other statements that are not historical or current facts. Forward-looking statements are based on Walter Investment's current expectations and involve risks and uncertainties that could cause actual results to differ materially from those expressed or implied in such forward-looking statements. Factors that could cause Walter Investment's results to differ materially from current expectations include, but are not limited to: the achievement of anticipated EBITDA margin levels which can be adversely affected by costs of our business that are higher than expected, the inability to achieve anticipated incentive fees which are subject to factors beyond the Company's control, customer take up rates of HARP refinancing and other factors that may affect the Company's earnings or costs; the close of the ResCap, Security One Lending, and other business and MSR acquisitions on schedule and the efficient integration of the businesses and transfer of the acquired MSRs to the Company's platforms; the accuracy of our assumptions as to platform synergies and the addition of new business in 2013; and other factors relating to our business in general as detailed in Walter Investment's 2011 Annual Report on Form 10-K and other periodic reports filed with the U.S. Securities and Exchange Commission. In addition, these statements are based on a number of assumptions that are subject to change. Accordingly, actual results may be materially higher or lower than those projected. The inclusion of such projections herein should not be regarded as a representation by Walter Investment that the projections will prove to be correct. This document speaks only as of this date. Walter Investment disclaims any duty to update the information herein. 1 |
| Non-GAAP Financial Measures To supplement Walter Investment's consolidated financial statements prepared in accordance with GAAP and to better reflect period-over-period comparisons, Walter Investment uses non-GAAP financial measures of performance, financial position, or cash flows that either exclude or include amounts that are not normally excluded or included in the most directly comparable measure, calculated and presented in accordance with GAAP. Non-GAAP financial measures do not replace and are not superior to the presentation of GAAP financial results, but are provided to (i) measure the Company's financial performance excluding depreciation and amortization costs, corporate and MSR facility interest expense, transaction and merger integration-related costs, certain other non-cash adjustments, the net impact of the consolidated Non-Residual Trust VIEs and certain other items as defined by our first lien credit agreement, including, but not limited to pro-forma synergies, (ii) provide investors a means of evaluating our core operating performance and (iii) improve overall understanding of Walter Investment's current financial performance and its prospects for the future. Specifically, Walter Investment believes the non-GAAP financial results provide useful information to both management and investors regarding certain additional financial and business trends relating to financial condition and operating results. In addition, management uses these measures for reviewing financial results and evaluating financial performance. The non-GAAP adjustments for all periods presented are based upon information and assumptions available as of the date of this presentation. Reconciliations can be found in the Appendix to this presentation. Our expectations regarding the value of, and EBITDA contribution from, acquired MSRs, related intangibles and other assets, are based upon assumptions, including, but not limited to prepayment speeds, delinquency and default rates, HARP eligible population, recapture rates and origination margins. The actual value and EBITDA contribution will depend on many factors, some of which are beyond our control, and could differ materially from our estimates. Errors in our financial models or changes in assumptions could result in our estimates and expectations being materially inaccurate which may adversely affect our earnings. Assumptions with regards to contributions from originations are also subject to the completion of the acquisition of the ResCap originations platform and the organizational structure, capital requirements and performance of the business after the acquisition. 2 |
| Agenda 1. Transaction Overview 2. Executive Summary 3. Key Credit Highlights 4. Industry Overview 5. Solid Financial Profile 6. Mitigating Risk / Platform Expansion 7. Business Line Expansion 8. Syndication Summary 3 |

| Management Presenters Charles Cauthen Denmar Dixon Chief Operating Officer and Chief Financial Officer 32 years of industry experience Over 12 years with Walter Investment Previously Senior Vice President and Chief Financial Officer - Consumer Products Group, Bank of America Vice Chairman and Executive Vice President 26 years of industry experience Over 3 years with Walter Investment Previously Managing Director in the Corporate and Investment Banking Group, Bank of America and Global Head of the Basic Industries Group, Bank of America Kimberly Perez Cheryl Collins Senior Vice President and Chief Accounting Officer 23 years of industry experience Over 15 years with Walter Investment Previously held a variety of senior financial and executive roles at Walter Investment and Walter Energy Senior Vice President and Treasurer 22 years of industry experience 22 years with Walter Investment Previously held a variety of financial and executive roles within Green Tree, including Treasurer and Chief Financial Officer 4 |
| 1. Transaction Overview 5 |
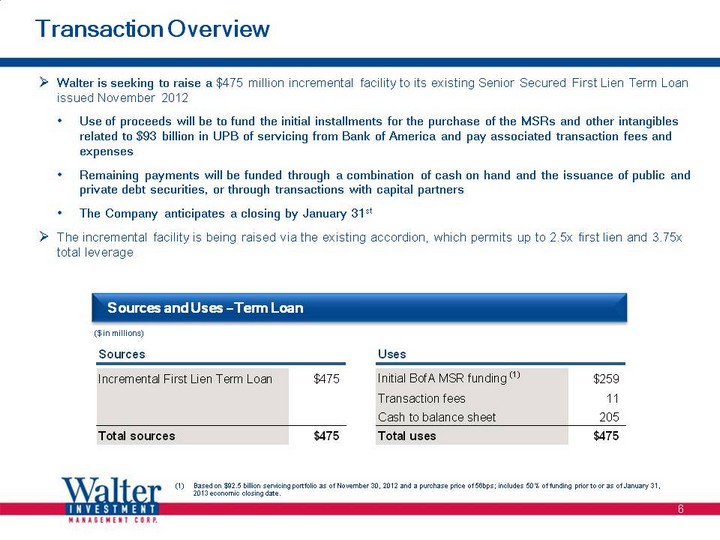
| Transaction Overview Walter is seeking to raise a $475 million incremental facility to its existing Senior Secured First Lien Term Loan issued November 2012 Use of proceeds will be to fund the initial installments for the purchase of the MSRs and other intangibles related to $93 billion in UPB of servicing from Bank of America and pay associated transaction fees and expenses Remaining payments will be funded through a combination of cash on hand and the issuance of public and private debt securities, or through transactions with capital partners The Company anticipates a closing by January 31st The incremental facility is being raised via the existing accordion, which permits up to 2.5x first lien and 3.75x total leverage (1) Based on $92.5 billion servicing portfolio as of November 30, 2012 and a purchase price of 56bps; includes 50% of funding prior to or as of January 31, 2013 economic closing date. Sources and Uses - Term Loan ($ in millions) 6 |
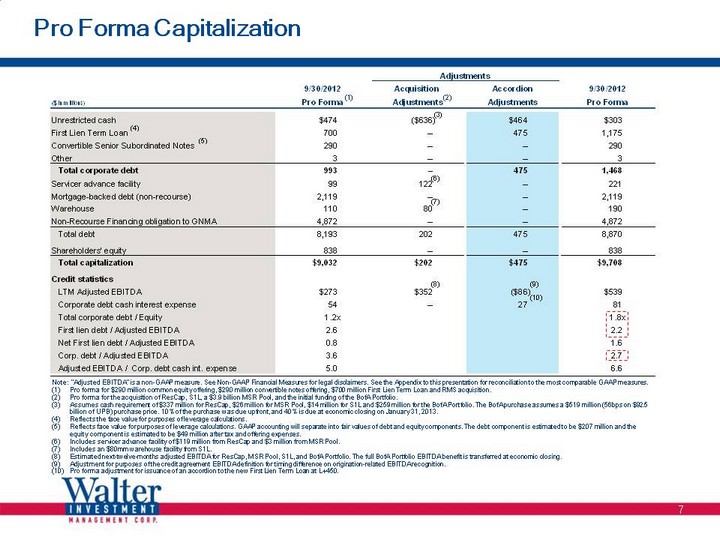
| Pro Forma Capitalization 7 Note: "Adjusted EBITDA" is a non-GAAP measure. See Non-GAAP Financial Measures for legal disclaimers. See the Appendix to this presentation for reconciliation to the most comparable GAAP measures. (1) Pro forma for $290 million common equity offering, $290 million convertible notes offering, $700 million First Lien Term Loan and RMS acquisition. (2) Pro forma for the acquisition of ResCap, S1L, a $3.9 billion MSR Pool, and the initial funding of the BofA Portfolio. (3) Assumes cash requirement of $337 million for ResCap, $26 million for MSR Pool, $14 million for S1L and $259 million for the BofA Portfolio. The BofA purchase assumes a $519 million (56bps on $92.5 billion of UPB) purchase price. 10% of the purchase was due upfront, and 40% is due at economic closing on January 31, 2013. (4) Reflects the face value for purposes of leverage calculations. (5) Reflects face value for purposes of leverage calculations. GAAP accounting will separate into fair values of debt and equity components. The debt component is estimated to be $207 million and the equity component is estimated to be $49 million after tax and offering expenses. (6) Includes servicer advance facility of $119 million from ResCap and $3 million from MSR Pool. (7) Includes an $80mm warehouse facility from S1L. (8) Estimated next-twelve-months adjusted EBITDA for ResCap, MSR Pool, S1L, and BofA Portfolio. The full BofA Portfolio EBITDA benefit is transferred at economic closing. (9) Adjustment for purposes of the credit agreement EBITDA definition for timing difference on origination-related EBITDA recognition. (10) Pro forma adjustment for issuance of an accordion to the new First Lien Term Loan at L+450. |

| Summary Organizational Chart Walter Reverse Acquisition LLC Mid-State Capital, LLC WMC Real Estate Investment LLC Walter Investment Holding Company Hanover SPC-A, Inc. (1) Reverse Mortgage Solutions, Inc. Marix Servicing, LLC Walter Investment Reinsurance Company, Ltd.(2) Best Insurors, Inc. Walter Investment Properties, LLC GTCS Holdings Green Tree subsidiaries Guarantors (1) Securitization trusts - residual cash flows are owned by Walter Investment Management Corp. (2) Represents less than 1% of pro forma LTM 9/30/12 EBITDA. 8 |
| 2. Executive Summary 9 |
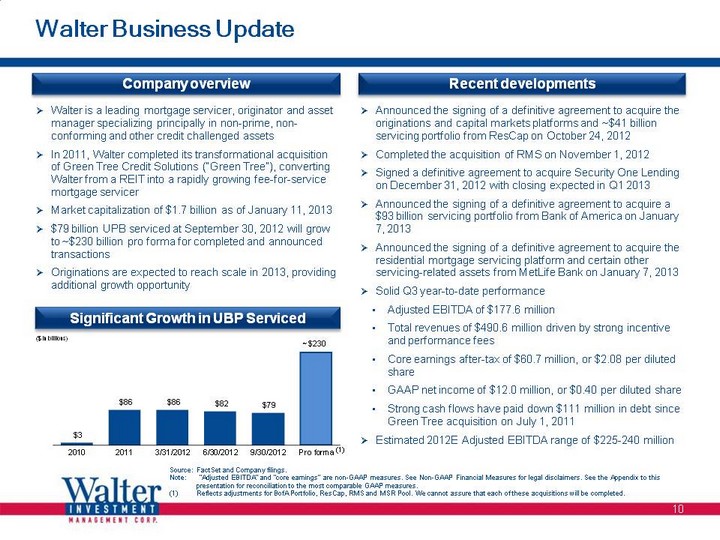
| Walter Business Update Walter is a leading mortgage servicer, originator and asset manager specializing principally in non-prime, non- conforming and other credit challenged assets In 2011, Walter completed its transformational acquisition of Green Tree Credit Solutions ("Green Tree"), converting Walter from a REIT into a rapidly growing fee-for-service mortgage servicer Market capitalization of $1.7 billion as of January 11, 2013 $79 billion UPB serviced at September 30, 2012 will grow to ~$230 billion pro forma for completed and announced transactions Originations are expected to reach scale in 2013, providing additional growth opportunity Announced the signing of a definitive agreement to acquire the originations and capital markets platforms and ~$41 billion servicing portfolio from ResCap on October 24, 2012 Completed the acquisition of RMS on November 1, 2012 Signed a definitive agreement to acquire Security One Lending on December 31, 2012 with closing expected in Q1 2013 Announced the signing of a definitive agreement to acquire a $93 billion servicing portfolio from Bank of America on January 7, 2013 Announced the signing of a definitive agreement to acquire the residential mortgage servicing platform and certain other servicing-related assets from MetLife Bank on January 7, 2013 Solid Q3 year-to-date performance Adjusted EBITDA of $177.6 million Total revenues of $490.6 million driven by strong incentive and performance fees Core earnings after-tax of $60.7 million, or $2.08 per diluted share GAAP net income of $12.0 million, or $0.40 per diluted share Strong cash flows have paid down $111 million in debt since Green Tree acquisition on July 1, 2011 Estimated 2012E Adjusted EBITDA range of $225-240 million Source: FactSet and Company filings. Note: "Adjusted EBITDA" and "core earnings" are non-GAAP measures. See Non-GAAP Financial Measures for legal disclaimers. See the Appendix to this presentation for reconciliation to the most comparable GAAP measures. (1) Reflects adjustments for BofA Portfolio, ResCap, RMS and MSR Pool. We cannot assure that each of these acquisitions will be completed. Company overview Recent developments Significant Growth in UBP Serviced ($ in billions) 10 (1) |
| 3. Key Credit Highlights 11 |
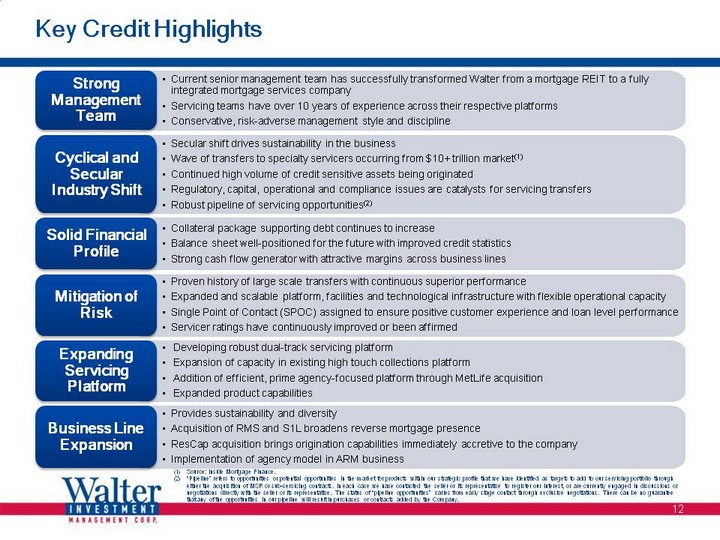
| Collateral package supporting debt continues to increase Balance sheet well-positioned for the future with improved credit statistics Strong cash flow generator with attractive margins across business lines Solid Financial Profile Proven history of large scale transfers with continuous superior performance Expanded and scalable platform, facilities and technological infrastructure with flexible operational capacity Single Point of Contact (SPOC) assigned to ensure positive customer experience and loan level performance Servicer ratings have continuously improved or been affirmed Mitigation of Risk Current senior management team has successfully transformed Walter from a mortgage REIT to a fully integrated mortgage services company Servicing teams have over 10 years of experience across their respective platforms Conservative, risk-adverse management style and discipline Strong Management Team Key Credit Highlights Provides sustainability and diversity Acquisition of RMS and S1L broadens reverse mortgage presence ResCap acquisition brings origination capabilities immediately accretive to the company Implementation of agency model in ARM business Business Line Expansion Developing robust dual-track servicing platform Expansion of capacity in existing high touch collections platform Addition of efficient, prime agency-focused platform through MetLife acquisition Expanded product capabilities Expanding Servicing Platform Secular shift drives sustainability in the business Wave of transfers to specialty servicers occurring from $10+ trillion market(1) Continued high volume of credit sensitive assets being originated Regulatory, capital, operational and compliance issues are catalysts for servicing transfers Robust pipeline of servicing opportunities(2) Cyclical and Secular Industry Shift (1) Source: Inside Mortgage Finance. (2) "Pipeline" refers to opportunities or potential opportunities in the market for products within our strategic profile that we have identified as targets to add to our servicing portfolio through either the acquisition of MSR or sub-servicing contracts. In each case we have contacted the seller or its representative to register our interest, or are currently engaged in discussions or negotiations directly with the seller or its representative. The status of "pipeline opportunities" varies from early stage contact through exclusive negotiations. There can be no guarantee that any of the opportunities in our pipeline will result in purchases or contracts added by the Company. 12 |

| 4. Industry Overview 13 |
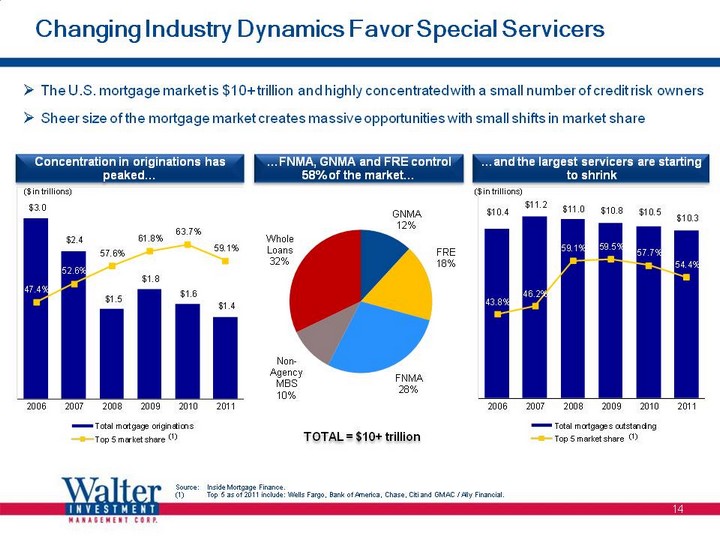
| Changing Industry Dynamics Favor Special Servicers The U.S. mortgage market is $10+ trillion and highly concentrated with a small number of credit risk owners Sheer size of the mortgage market creates massive opportunities with small shifts in market share Concentration in originations has peaked... Source: Inside Mortgage Finance. (1) Top 5 as of 2011 include: Wells Fargo, Bank of America, Chase, Citi and GMAC / Ally Financial. (1) ...and the largest servicers are starting to shrink ($ in trillions) (1) ($ in trillions) ...FNMA, GNMA and FRE control 58% of the market... TOTAL = $10+ trillion 14 |
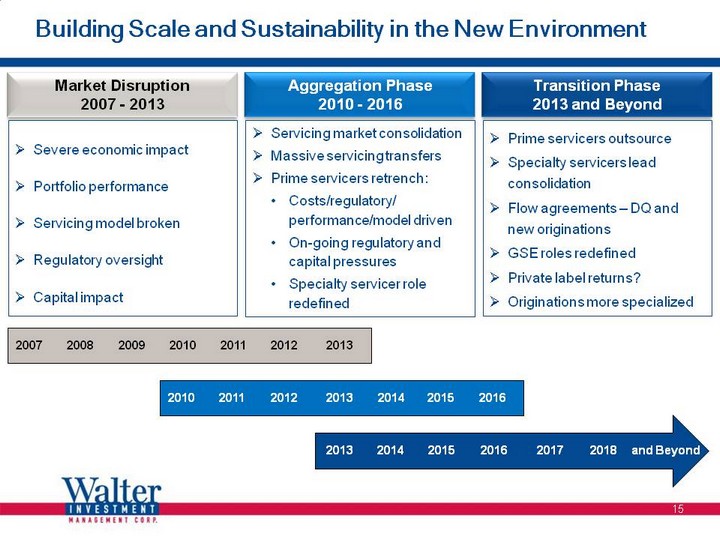
| Building Scale and Sustainability in the New Environment Market Disruption 2007 - 2013 Aggregation Phase 2010 - 2016 Transition Phase 2013 and Beyond Severe economic impact Portfolio performance Servicing model broken Regulatory oversight Capital impact Servicing market consolidation Massive servicing transfers Prime servicers retrench: Costs/regulatory/ performance/model driven On-going regulatory and capital pressures Specialty servicer role redefined Prime servicers outsource Specialty servicers lead consolidation Flow agreements - DQ and new originations GSE roles redefined Private label returns? Originations more specialized 2013 2018 2017 2016 2015 2014 and Beyond 2007 2012 2011 2010 2009 2008 2013 2010 2015 2014 2013 2012 2011 2016 15 |
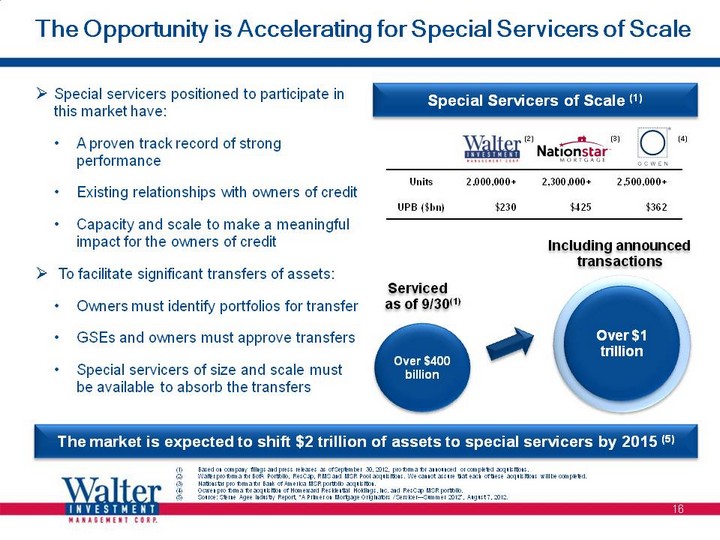
| The Opportunity is Accelerating for Special Servicers of Scale Special Servicers of Scale (1) Over $400 billion Special servicers positioned to participate in this market have: A proven track record of strong performance Existing relationships with owners of credit Capacity and scale to make a meaningful impact for the owners of credit To facilitate significant transfers of assets: Owners must identify portfolios for transfer GSEs and owners must approve transfers Special servicers of size and scale must be available to absorb the transfers Serviced as of 9/30(1) Including announced transactions The market is expected to shift $2 trillion of assets to special servicers by 2015 (5) Over $1 trillion (1) Based on company filings and press releases as of September 30, 2012, pro forma for announced or completed acquisitions. (2) Walter pro forma for BofA Portfolio, ResCap, RMS and MSR Pool acquisitions. We cannot assure that each of these acquisitions will be completed. (3) Nationstar pro forma for Bank of America MSR portfolio acquisition. (4) Ocwen pro forma for acquisition of Homeward Residential Holdings, Inc. and ResCap MSR portfolio. (5) Source: Sterne Agee Industry Report, "A Primer on Mortgage Originators / Servicer-Summer 2012", August 7, 2012. (4) (2) (3) 16 |
| 5. Solid Financial Profile 17 |
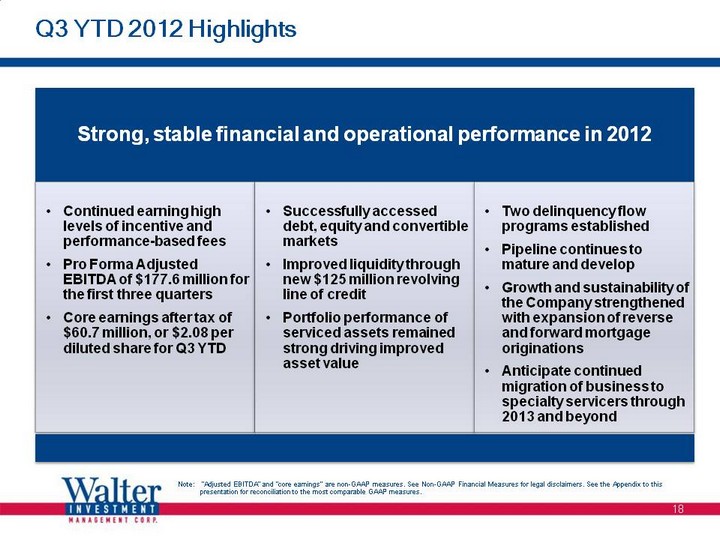
| Q3 YTD 2012 Highlights Strong, stable financial and operational performance in 2012 Continued earning high levels of incentive and performance-based fees Pro Forma Adjusted EBITDA of $177.6 million for the first three quarters Core earnings after tax of $60.7 million, or $2.08 per diluted share for Q3 YTD Successfully accessed debt, equity and convertible markets Improved liquidity through new $125 million revolving line of credit Portfolio performance of serviced assets remained strong driving improved asset value Two delinquency flow programs established Pipeline continues to mature and develop Growth and sustainability of the Company strengthened with expansion of reverse and forward mortgage originations Anticipate continued migration of business to specialty servicers through 2013 and beyond 18 Note: "Adjusted EBITDA" and "core earnings" are non-GAAP measures. See Non-GAAP Financial Measures for legal disclaimers. See the Appendix to this presentation for reconciliation to the most comparable GAAP measures. |
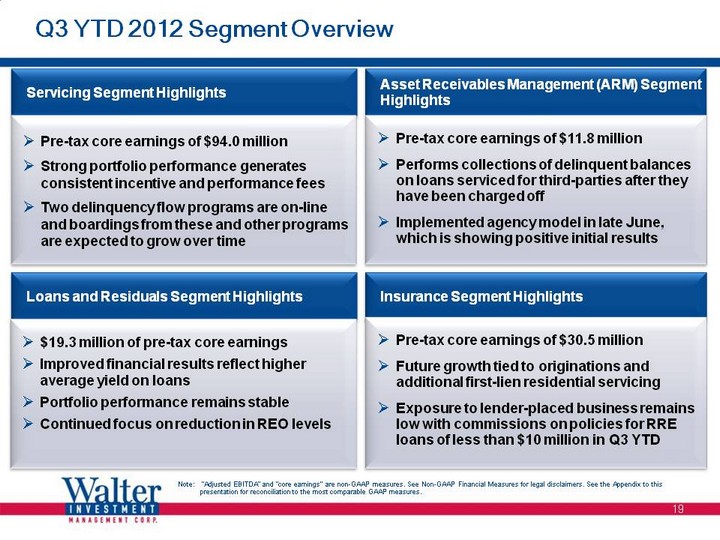
| Q3 YTD 2012 Segment Overview Loans and Residuals Segment Highlights $19.3 million of pre-tax core earnings Improved financial results reflect higher average yield on loans Portfolio performance remains stable Continued focus on reduction in REO levels Servicing Segment Highlights Pre-tax core earnings of $94.0 million Strong portfolio performance generates consistent incentive and performance fees Two delinquency flow programs are on-line and boardings from these and other programs are expected to grow over time Asset Receivables Management (ARM) Segment Highlights Pre-tax core earnings of $11.8 million Performs collections of delinquent balances on loans serviced for third-parties after they have been charged off Implemented agency model in late June, which is showing positive initial results Insurance Segment Highlights Pre-tax core earnings of $30.5 million Future growth tied to originations and additional first-lien residential servicing Exposure to lender-placed business remains low with commissions on policies for RRE loans of less than $10 million in Q3 YTD 19 Note: "Adjusted EBITDA" and "core earnings" are non-GAAP measures. See Non-GAAP Financial Measures for legal disclaimers. See the Appendix to this presentation for reconciliation to the most comparable GAAP measures. |
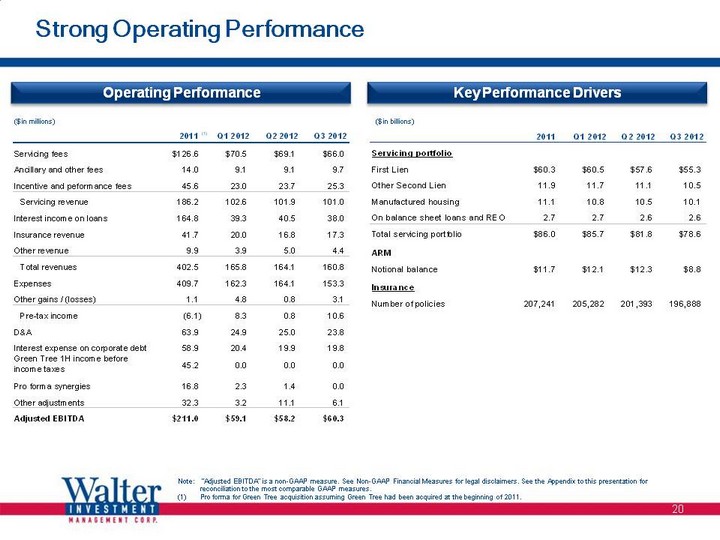
| Strong Operating Performance ($ in millions) ($ in billions) Operating Performance Key Performance Drivers (1) 20 Note: "Adjusted EBITDA" is a non-GAAP measure. See Non-GAAP Financial Measures for legal disclaimers. See the Appendix to this presentation for reconciliation to the most comparable GAAP measures. (1) Pro forma for Green Tree acquisition assuming Green Tree had been acquired at the beginning of 2011. |
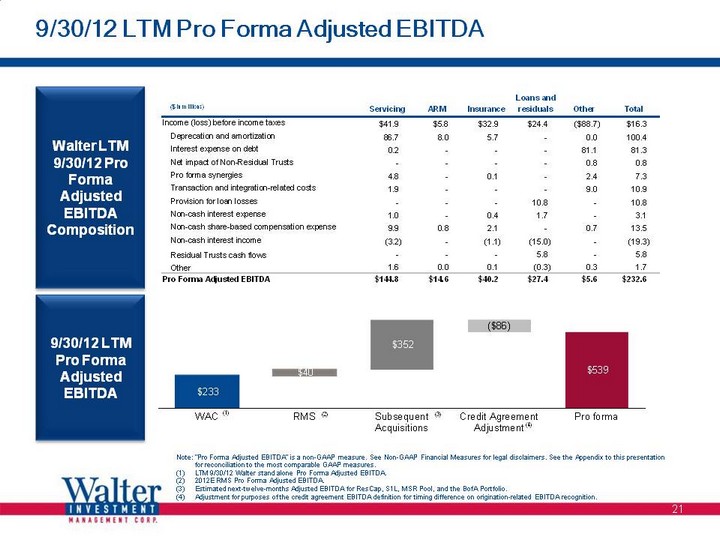
| 9/30/12 LTM Pro Forma Adjusted EBITDA Note: "Pro Forma Adjusted EBITDA" is a non-GAAP measure. See Non-GAAP Financial Measures for legal disclaimers. See the Appendix to this presentation for reconciliation to the most comparable GAAP measures. (1) LTM 9/30/12 Walter stand alone Pro Forma Adjusted EBITDA. (2) 2012E RMS Pro Forma Adjusted EBITDA. (3) Estimated next-twelve-months Adjusted EBITDA for ResCap, S1L, MSR Pool, and the BofA Portfolio. (4) Adjustment for purposes of the credit agreement EBITDA definition for timing difference on origination-related EBITDA recognition. 9/30/12 LTM Pro Forma Adjusted EBITDA 21 Walter LTM 9/30/12 Pro Forma Adjusted EBITDA Composition ($ in millions) (1) (2) (3) (4) |
| 6. Mitigating Risk / Platform Expansion 22 |

| Servicing Growth and Integration Plan Managing the risks associated with growth Operational integrity with emphasis on compliance controls, management, system, facility capacity and trained employee onboarding Green Tree has a proven track record for growing while maintaining performance and oversight - this and every acquisition has been well thought out and planned Compliance Controls: Our Four Lines of Defense will provide excellent oversight as we board these new assets and expand our operations with new and existing personnel in new facilities Management: The Management Team has over 12 years tenure at the company while MetLife has over 10 years tenure Systems: Combining Green Tree's robust and scalable proprietary platform with the well-regarded MSP systems currently used at MetLife provides Green Tree further ability to scale and direct prime versus nonprime assets Facilities: With the Met Life acquisition Green Tree continues with the premise of multiple locations across the nation. Combining our expansion plans already in process provides us with excess capacity for 1,100+ FTE by the end of 2013 Employee Onboarding: The MetLife acquisition will provide a large number of industry trained employees ready to perform. The Green Tree training department and management team will be working side-by-side for complete acclimation Customer/Borrower Transition and Performance: Green Tree has a well-defined process to transfer new borrowers through our loan boarding and welcome calls/letters and subsequent assignment to a Single Point of Contact (SPOC). Our plans will be closely monitored to ensure we execute with positive customer satisfaction and loan level performance 23 |
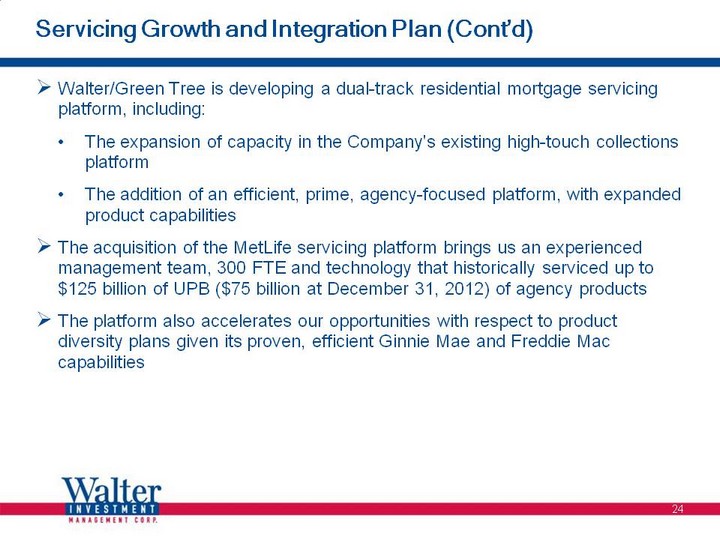
| Servicing Growth and Integration Plan (Cont'd) Walter/Green Tree is developing a dual-track residential mortgage servicing platform, including: The expansion of capacity in the Company's existing high-touch collections platform The addition of an efficient, prime, agency-focused platform, with expanded product capabilities The acquisition of the MetLife servicing platform brings us an experienced management team, 300 FTE and technology that historically serviced up to $125 billion of UPB ($75 billion at December 31, 2012) of agency products The platform also accelerates our opportunities with respect to product diversity plans given its proven, efficient Ginnie Mae and Freddie Mac capabilities 24 |

| 7. Business Line Expansion 25 |
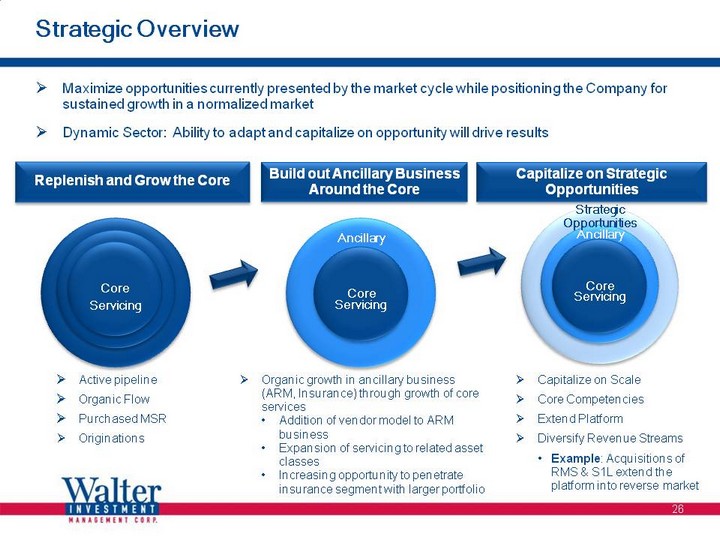
| Strategic Overview Maximize opportunities currently presented by the market cycle while positioning the Company for sustained growth in a normalized market Dynamic Sector: Ability to adapt and capitalize on opportunity will drive results Active pipeline Organic Flow Purchased MSR Originations Organic growth in ancillary business (ARM, Insurance) through growth of core services Addition of vendor model to ARM business Expansion of servicing to related asset classes Increasing opportunity to penetrate insurance segment with larger portfolio Capitalize on Scale Core Competencies Extend Platform Diversify Revenue Streams Example: Acquisitions of RMS & S1L extend the platform into reverse market Replenish and Grow the Core Ancillary Strategic Opportunities Build out Ancillary Business Around the Core Capitalize on Strategic Opportunities Servicing Servicing Servicing 26 |
| ResCap Acquisition Overview On October 24th, Walter, through its partnership with Ocwen, announced that it was awarded the ResCap FNMA MSR and Servicer Advances, as well as the ResCap originations and capital markets platforms The ResCap portfolio consists of ~354,000 units representing ~$41 billion of residential mortgage loans backed by Fannie Mae The Walter and Ocwen bid was confirmed by the bankruptcy court on November 19, 2012, with a targeted close date of January 31, 2013 Current capacity of 12,000 applications and over 50,000 phone calls per month High quality delivery history 100% loans reviewed pre-funding and post-closing Satisfactory findings on ALL state audits and examinations of ResCap Substantial capacity, focused on retention and recapture of HARP eligible loans in the portfolio of serviced assets The HARP program and its significant opportunity will be the primary 2013 focus of the business Utilize correspondent, retail and private label channels to complement current retention and recapture opportunities and drive transition to full service originator Company exploring options for organizational structure (including joint venture/partnership), potential capital partners and levels of capitalization in order to maximize value and contribution of entity 27 |
| Bank of America MSR Portfolio Overview On January 7, 2013, Walter announced that it will acquire a $93 billion UPB(1) portfolio of FNMA-backed MSRs, including related advance receivables of approximately $1 billion from Bank of America The purchase price for the MSRs of $519 million represents approximately 2.05x the 27 bps base contractual servicing fee of the portfolio; the related advance receivables will be purchased at par The portfolio of assets acquired includes over 650,000 loans that are projected to be approximately 80% current at transfer The transaction will have an economic closing as of January 31, and the bulk of the servicing transfers will take place during the first and second quarters of 2013 The MSR purchase will be funded with 10% paid at signing and with an additional 40% due at the January 31 economic close The remainder of the MSR and related advance receivable will be paid for a pro rata basis in conjunction with an agreed-upon servicing transfer schedule The Company expects the revenues from these MSRs to drive servicing EBITDA margins within its targeted range of 40% to 45% over the life of the portfolio The Company expects a servicing EBITDA contribution of between $55 and $60 million in 2013(2), and an average servicing EBITDA contribution of between $70 and $80 million per year for the following two years, with additional EBITDA of $110 to $135 million from originations and insurance(3) FNMA to provide expanded EAF facility to accommodate the corporate and escrow advances of approximately $915 million 28 (1) As of November 30, 2012 cutoff. (2) Estimated 2013 EBITDA is lower in the first year as a result of higher delinquency rates on the portfolio, the incurrence of certain one-time, up front transfer costs and the expected ramp in earnings over time that occurs in incentive and performance-based fees. (3) Amounts are based on the Company's past experience and assumptions about future performance, which may change or otherwise prove incorrect. See Non-GAAP Financial Measures for legal disclaimers regarding EBITDA projections. |
| Security One Lending Acquisition Overview On December 31, 2012, Walter entered into an agreement to purchase the San Diego-based reverse mortgage originator Security One Lending ("S1L") S1L is a retail and wholesale reverse mortgage originator based in San Diego, which has been building its presence in the reverse mortgage space since November 2006 S1L has developed a robust retail and wholesale origination presence in the reverse mortgage market, with 20 branches and nearly 400 loan officers in the field Today, the company has approximately 565 employees. During 2012, S1L originated nearly 5,000 reverse mortgage loans with an aggregate UPB of over $700 million The purchase price consists of $20 million in cash paid at the time of signing and up to an $11 million additional in the form of an earn out to be paid upon the achievement by S1L of certain designated performance targets over the next 12 months Closing on the S1L acquisition is expected to occur in Q1 2013 at which time the S1L business will be consolidated into the RMS business Based on a full $31 million purchase price and estimated pro forma results including expected synergies with the Company's RMS subsidiary; the acquisition represents a 2x multiple of 2012 EBITDA and approximately 1x estimated 2013 EBITDA(1) Strategic Rationale Enhances RMS loan production capabilities Attractive economics and impact to RMS Talented and compatible management 29 (1) See Non-GAAP Financial Measures for legal disclaimers regarding EBITDA projections. |

| 8. Syndication Summary 30 |
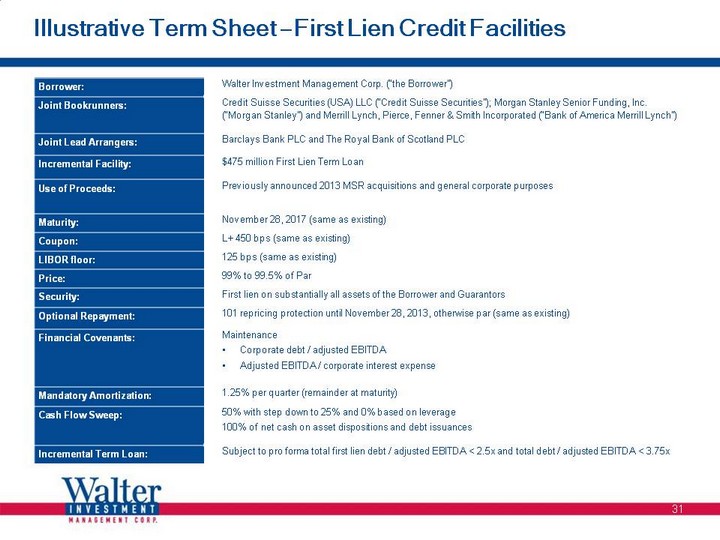
| Illustrative Term Sheet - First Lien Credit Facilities 31 Borrower: Walter Investment Management Corp. ("the Borrower") Joint Bookrunners: Credit Suisse Securities (USA) LLC ("Credit Suisse Securities"); Morgan Stanley Senior Funding, Inc. ("Morgan Stanley") and Merrill Lynch, Pierce, Fenner & Smith Incorporated ("Bank of America Merrill Lynch") Joint Lead Arrangers: Barclays Bank PLC and The Royal Bank of Scotland PLC Incremental Facility: $475 million First Lien Term Loan Use of Proceeds: Previously announced 2013 MSR acquisitions and general corporate purposes Maturity: November 28, 2017 (same as existing) Coupon: L+ 450 bps (same as existing) LIBOR floor: 125 bps (same as existing) Price: 99% to 99.5% of Par Security: First lien on substantially all assets of the Borrower and Guarantors Optional Repayment: 101 repricing protection until November 28, 2013, otherwise par (same as existing) Financial Covenants: Maintenance Corporate debt / adjusted EBITDA Adjusted EBITDA / corporate interest expense Mandatory Amortization: 1.25% per quarter (remainder at maturity) Cash Flow Sweep: 50% with step down to 25% and 0% based on leverage 100% of net cash on asset dispositions and debt issuances Incremental Term Loan: Subject to pro forma total first lien debt / adjusted EBITDA < 2.5x and total debt / adjusted EBITDA < 3.75x 31 |
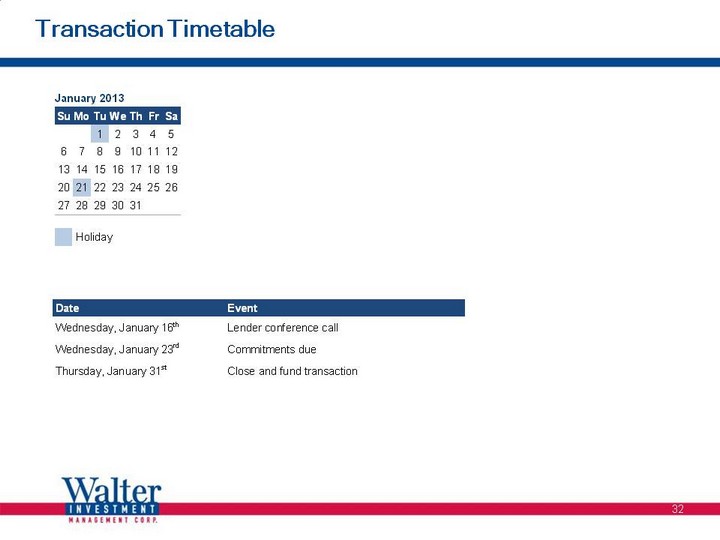
| Transaction Timetable 32 |

| Contacts Credit Suisse Loan Capital Markets Jeff Cohen, Managing Director +1 212 325 7455 Alex Lanuza, Director +1 212 538 2295 Investment Banking Andrew Rosenburgh, Managing Director +1 212 325 5562 Ali Mehdi, Managing Director +1 212 325 2997 David Stolzar, Director +1 212 538 6840 Corporate Banking Robert Hetu, Managing Director +1 212 325 4542 Sanja Gazahi, Associate +1 212 325 2879 33 |
| Appendix 34 |
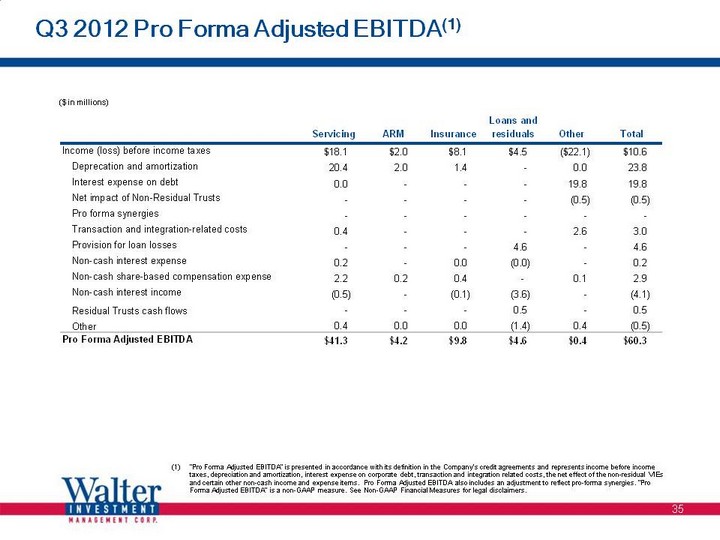
| Q3 2012 Pro Forma Adjusted EBITDA(1) ($ in millions) 35 "Pro Forma Adjusted EBITDA" is presented in accordance with its definition in the Company's credit agreements and represents income before income taxes, depreciation and amortization, interest expense on corporate debt, transaction and integration related costs, the net effect of the non-residual VIEs and certain other non-cash income and expense items. Pro Forma Adjusted EBITDA also includes an adjustment to reflect pro-forma synergies. "Pro Forma Adjusted EBITDA" is a non-GAAP measure. See Non-GAAP Financial Measures for legal disclaimers. |
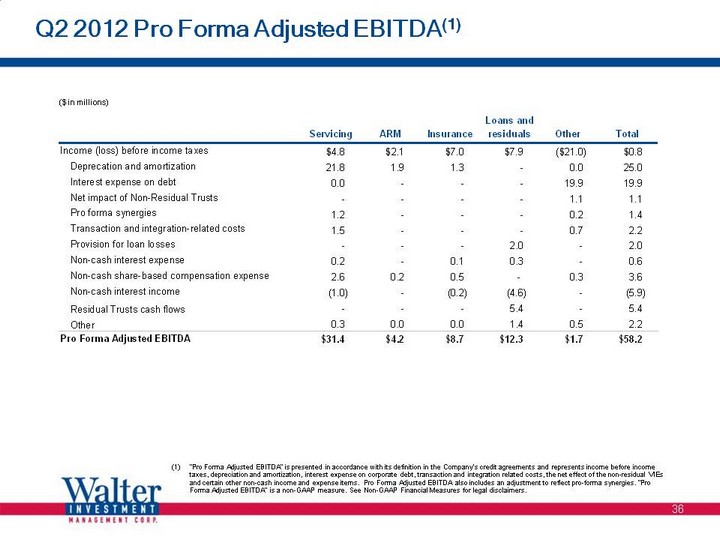
| Q2 2012 Pro Forma Adjusted EBITDA(1) ($ in millions) 36 "Pro Forma Adjusted EBITDA" is presented in accordance with its definition in the Company's credit agreements and represents income before income taxes, depreciation and amortization, interest expense on corporate debt, transaction and integration related costs, the net effect of the non-residual VIEs and certain other non-cash income and expense items. Pro Forma Adjusted EBITDA also includes an adjustment to reflect pro-forma synergies. "Pro Forma Adjusted EBITDA" is a non-GAAP measure. See Non-GAAP Financial Measures for legal disclaimers. |

| Q1 2012 Pro Forma Adjusted EBITDA(1) ($ in millions) 37 "Pro Forma Adjusted EBITDA" is presented in accordance with its definition in the Company's credit agreements and represents income before income taxes, depreciation and amortization, interest expense on corporate debt, transaction and integration related costs, the net effect of the non-residual VIEs and certain other non-cash income and expense items. Pro Forma Adjusted EBITDA also includes an adjustment to reflect pro-forma synergies. "Pro Forma Adjusted EBITDA" is a non-GAAP measure. See Non-GAAP Financial Measures for legal disclaimers. |
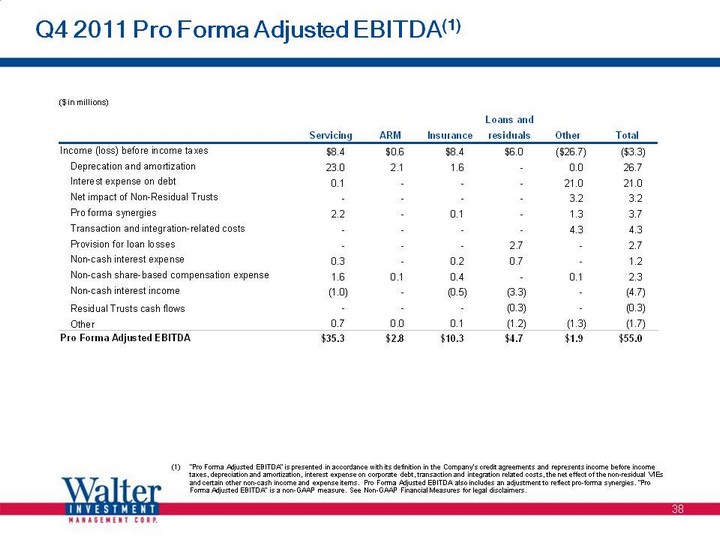
| Q4 2011 Pro Forma Adjusted EBITDA(1) ($ in millions) 38 "Pro Forma Adjusted EBITDA" is presented in accordance with its definition in the Company's credit agreements and represents income before income taxes, depreciation and amortization, interest expense on corporate debt, transaction and integration related costs, the net effect of the non-residual VIEs and certain other non-cash income and expense items. Pro Forma Adjusted EBITDA also includes an adjustment to reflect pro-forma synergies. "Pro Forma Adjusted EBITDA" is a non-GAAP measure. See Non-GAAP Financial Measures for legal disclaimers. |
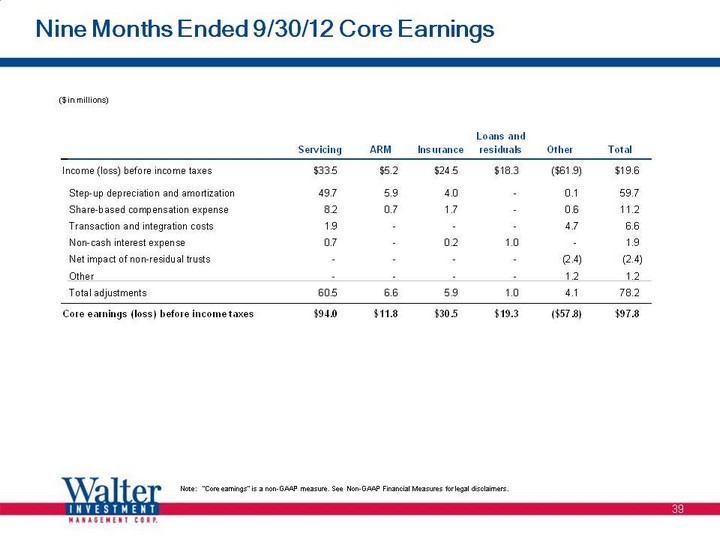
| Nine Months Ended 9/30/12 Core Earnings ($ in millions) 39 Note: "Core earnings" is a non-GAAP measure. See Non-GAAP Financial Measures for legal disclaimers. |
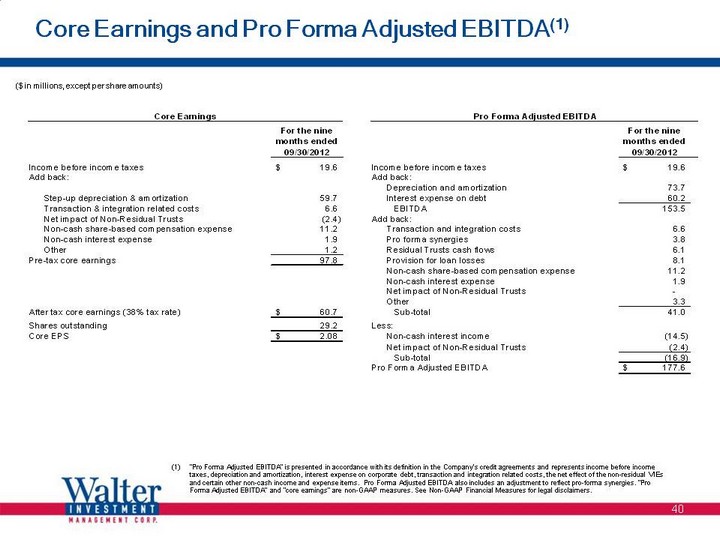
| Core Earnings and Pro Forma Adjusted EBITDA(1) ($ in millions, except per share amounts) 40 "Pro Forma Adjusted EBITDA" is presented in accordance with its definition in the Company's credit agreements and represents income before income taxes, depreciation and amortization, interest expense on corporate debt, transaction and integration related costs, the net effect of the non-residual VIEs and certain other non-cash income and expense items. Pro Forma Adjusted EBITDA also includes an adjustment to reflect pro-forma synergies. "Pro Forma Adjusted EBITDA" and "core earnings" are non-GAAP measures. See Non-GAAP Financial Measures for legal disclaimers. |