Attached files
| file | filename |
|---|---|
| 8-K - 8-K - Front Yard Residential Corp | a13-2989_18k.htm |
Exhibit 99.1
|
|
January 2013 Proprietary and Confidential ALTISOURCE RESIDENTIAL CORPORATION |
|
|
Forward Looking Statements This material has been prepared solely for informational purposes and is not to be construed as a solicitation or an offer to buy or sell any securities and should not be treated as giving investment advice. It is not targeted to the specific investment objectives, financial situation or particular needs of any recipient. No representation or warranty, either express or implied, is made as to the accuracy, completeness or reliability of the information contained herein. It should not be regarded by recipients as a substitute for the exercise of their own judgment. Any opinions expressed in this material are subject to change without notice and the Company is not under obligation to update or keep current the information contained herein. The Company and its respective affiliates, agents, directors, partners and employees accept no liability whatsoever for any loss or damage of any kind arising out of the use of all or any part of this material. You should consult your own legal, regulatory, tax, business, investment, financial and accounting advisers to the extent that you deem necessary, and you must make your own investment, hedging or trading decision based upon your own judgment and advice from such advisers as you deem necessary and not upon any view expressed in this material. This presentation contains forward-looking statements. These statements may be identified by words such as “anticipate,” “intend,” “expect,” “may,” “could,” “should,” “would,” “plan,” “estimate,” “seek,” “believe” and similar expressions. We caution that forward-looking statements are qualified by the existence of certain risks and uncertainties that could cause actual results and events to differ materially from what is contemplated by the forward-looking statements. Factors which could cause actual results to differ materially from these forward-looking statements may include, without limitation, the Company’s ability to successfully operate as an independent stand-alone company, its ability to successfully acquire and monetize single-family rental assets, general economic conditions, conditions in the markets in which the Company is engaged, behavior of customers, suppliers and/or competitors, technological developments and regulatory rules; and other risks and uncertainties detailed in the “Risk Factors” and other sections of the Company’s Registration Statement on Form 10 and described from time to time in the Company’s future reports that it will file with the Securities and Exchange Commission. In addition, financial risks such as currency movements, liquidity and credit risks could influence future results. The foregoing list of factors should not be construed as exhaustive. The Company disclaims any intention or obligation to publicly update or revise any forward-looking statements, whether as a result of new information, future events or otherwise. |
|
|
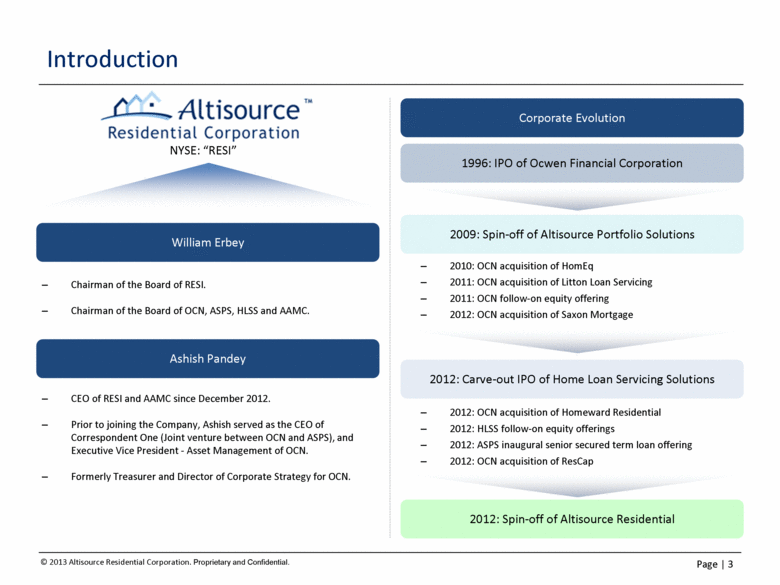
Introduction Chairman of the Board of RESI. Chairman of the Board of OCN, ASPS, HLSS and AAMC. CEO of RESI and AAMC since December 2012. Prior to joining the Company, Ashish served as the CEO of Correspondent One (Joint venture between OCN and ASPS), and Executive Vice President - Asset Management of OCN. Formerly Treasurer and Director of Corporate Strategy for OCN. NYSE: “RESI” 1996: IPO of Ocwen Financial Corporation 2009: Spin-off of Altisource Portfolio Solutions 2012: Carve-out IPO of Home Loan Servicing Solutions 2010: OCN acquisition of HomEq 2011: OCN acquisition of Litton Loan Servicing 2011: OCN follow-on equity offering 2012: OCN acquisition of Saxon Mortgage 2012: OCN acquisition of Homeward Residential 2012: HLSS follow-on equity offerings 2012: ASPS inaugural senior secured term loan offering 2012: OCN acquisition of ResCap 2012: Spin-off of Altisource Residential Corporate Evolution William Erbey Ashish Pandey |
|
|
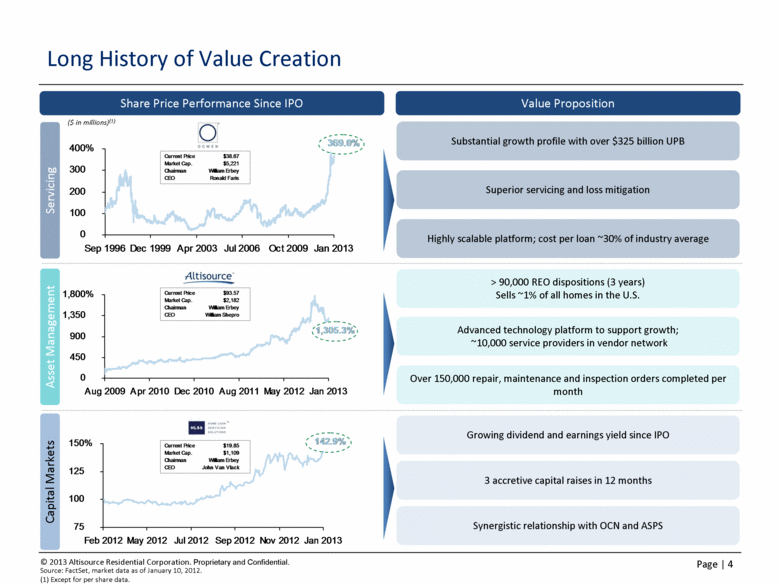
Long History of Value Creation Servicing Share Price Performance Since IPO Value Proposition Substantial growth profile with over $325 billion UPB Highly scalable platform; cost per loan ~30% of industry average Superior servicing and loss mitigation Over 150,000 repair, maintenance and inspection orders completed per month > 90,000 REO dispositions (3 years) Sells ~1% of all homes in the U.S. Advanced technology platform to support growth; ~10,000 service providers in vendor network Growing dividend and earnings yield since IPO 3 accretive capital raises in 12 months Synergistic relationship with OCN and ASPS Asset Management Capital Markets Source: FactSet, market data as of January 10, 2012. (1) Except for per share data. ($ in millions)(1) 0 100 200 300 400% Sep 1996 Dec 1999 Apr 2003 Jul 2006 Oct 2009 Jan 2013 369.0% 75 100 125 150% Feb 2012 May 2012 Jul 2012 Sep 2012 Nov 2012 Jan 2013 142.9% Current Price $38.67 Market Cap. $5,221 Chairman William Erbey CEO Ronald Faris Current Price $19.85 Market Cap. $1,109 Chairman William Erbey CEO John Van Vlack 0 450 900 1,350 1,800% Aug 2009 Apr 2010 Dec 2010 Aug 2011 May 2012 Jan 2013 1,305.3% Current Price $93.57 Market Cap. $2,182 Chairman William Erbey CEO William Shepro |
|
|
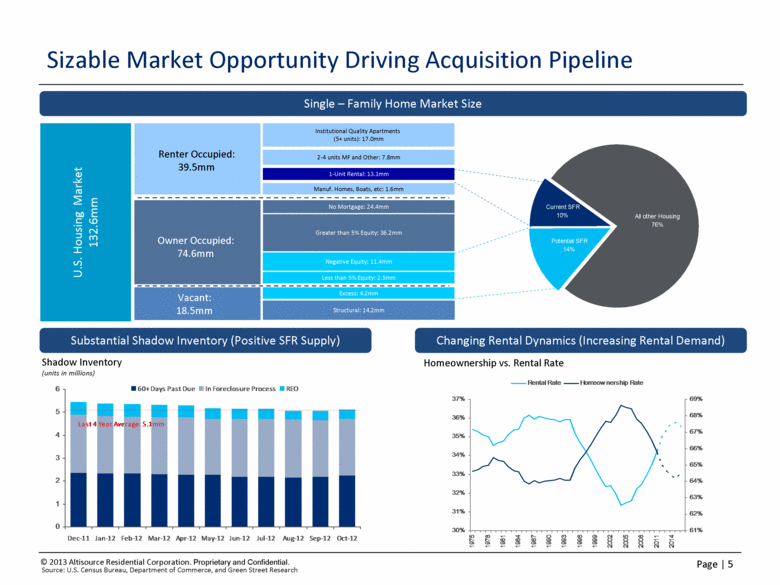
Sizable Market Opportunity Driving Acquisition Pipeline U.S. Housing Market 132.6mm Manuf. Homes, Boats, etc: 1.6mm Institutional Quality Apartments (5+ units): 17.0mm 1-Unit Rental: 13.1mm 2-4 units MF and Other: 7.8mm No Mortgage: 24.4mm Greater than 5% Equity: 36.2mm Less than 5% Equity: 2.5mm Negative Equity: 11.4mm Structural: 14.2mm Excess: 4.2mm Renter Occupied: 39.5mm Owner Occupied: 74.6mm Vacant: 18.5mm Substantial Shadow Inventory (Positive SFR Supply) Changing Rental Dynamics (Increasing Rental Demand) Shadow Inventory (units in millions) Homeownership vs. Rental Rate Single – Family Home Market Size Source: U.S. Census Bureau, Department of Commerce, and Green Street Research Potential SFR 14% All other Housing 76% Current SFR 10% 30% 31% 32% 33% 34% 35% 36% 37% 1975 1978 1981 1984 1987 1990 1993 1996 1999 2002 2005 2008 2011 2014 61% 62% 63% 64% 65% 66% 67% 68% 69% Rental Rate Homeownership Rate 0 1 2 3 4 5 6 Dec-11 Jan-12 Feb-12 Mar-12 Apr-12 May-12 Jun-12 Jul-12 Aug-12 Sep-12 Oct-12 60+ Days Past Due In Foreclosure Process REO Last 4 Year Average: 5.1mm |
|
|
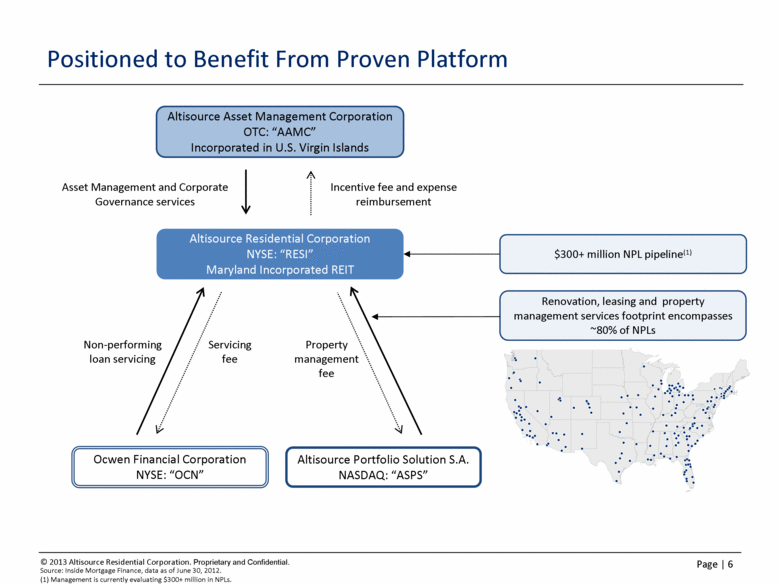
Positioned to Benefit From Proven Platform Altisource Residential Corporation NYSE: “RESI” Maryland Incorporated REIT Ocwen Financial Corporation NYSE: “OCN” Altisource Portfolio Solution S.A. NASDAQ: “ASPS” Altisource Asset Management Corporation OTC: “AAMC” Incorporated in U.S. Virgin Islands Asset Management and Corporate Governance services Incentive fee and expense reimbursement Non-performing loan servicing Property management fee Servicing fee Source: Inside Mortgage Finance, data as of June 30, 2012. (1) Management is currently evaluating $300+ million in NPLs. $300+ million NPL pipeline(1) Renovation, leasing and property management services footprint encompasses ~80% of NPLs |
|
|
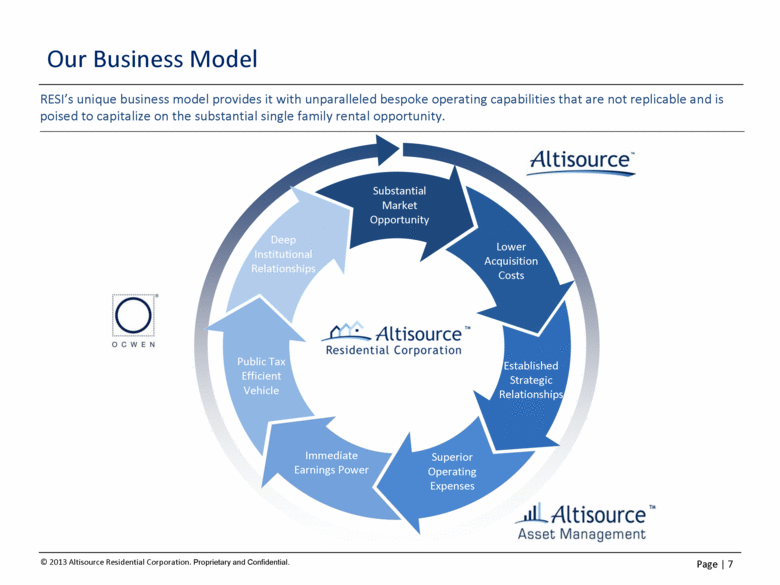
Our Business Model RESI’s unique business model provides it with unparalleled bespoke operating capabilities that are not replicable and is poised to capitalize on the substantial single family rental opportunity. Substantial Market Opportunity Lower Acquisition Costs Established Strategic Relationships Superior Operating Expenses Immediate Earnings Power Public Tax Efficient Vehicle Deep Institutional Relationships |
|
|
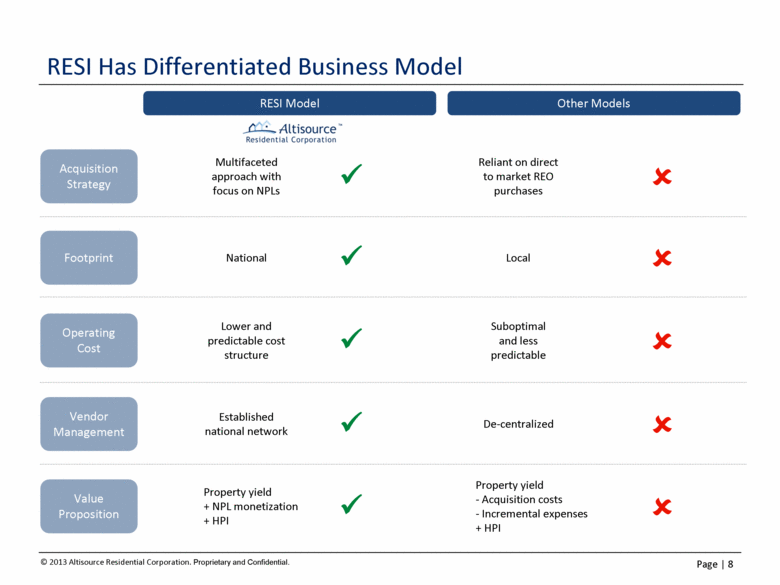
RESI Has Differentiated Business Model RESI Model Other Models Acquisition Strategy Footprint Operating Cost Vendor Management Value Proposition National Lower and predictable cost structure Multifaceted approach with focus on NPLs Established national network Property yield + NPL monetization + HPI Suboptimal and less predictable Reliant on direct to market REO purchases Local De-centralized Property yield - Acquisition costs - Incremental expenses + HPI |
|
|
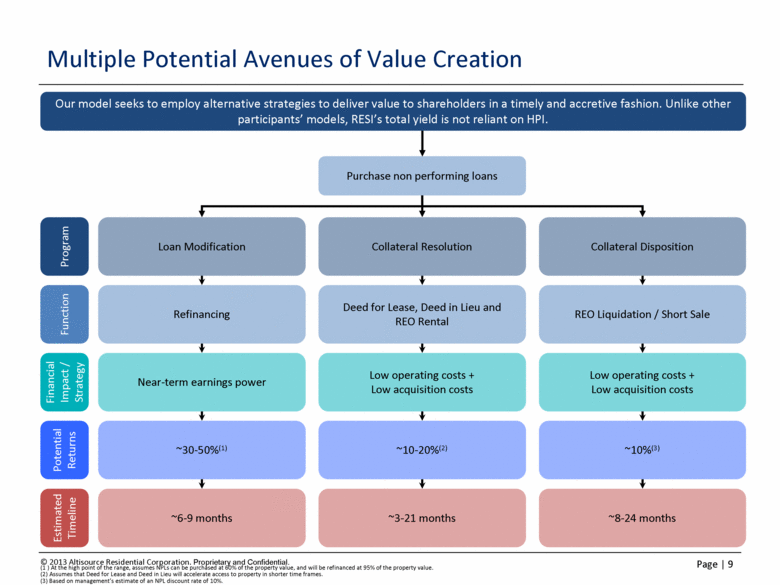
Multiple Potential Avenues of Value Creation Purchase non performing loans Our model seeks to employ alternative strategies to deliver value to shareholders in a timely and accretive fashion. Unlike other participants’ models, RESI’s total yield is not reliant on HPI. Program Loan Modification Collateral Resolution Collateral Disposition Function Refinancing Deed for Lease, Deed in Lieu and REO Rental REO Liquidation / Short Sale Financial Impact / Strategy Near-term earnings power Low operating costs + Low acquisition costs Low operating costs + Low acquisition costs Potential Returns ~30-50%(1) ~10-20%(2) ~10%(3) Estimated Timeline ~6-9 months ~3-21 months ~8-24 months (1 ) At the high point of the range, assumes NPLs can be purchased at 60% of the property value, and will be refinanced at 95% of the property value. (2) Assumes that Deed for Lease and Deed in Lieu will accelerate access to property in shorter time frames. (3) Based on management’s estimate of an NPL discount rate of 10%. |
|
|
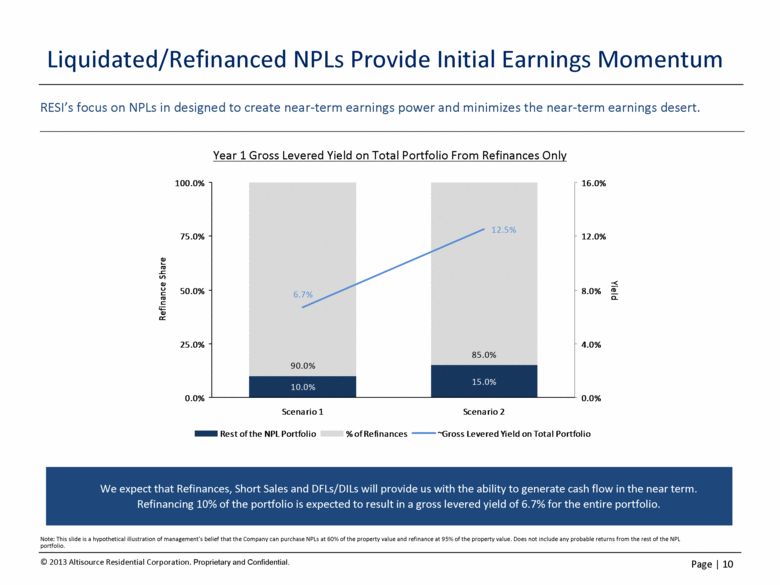
Liquidated/Refinanced NPLs Provide Initial Earnings Momentum We expect that Refinances, Short Sales and DFLs/DILs will provide us with the ability to generate cash flow in the near term. Refinancing 10% of the portfolio is expected to result in a gross levered yield of 6.7% for the entire portfolio. RESI’s focus on NPLs in designed to create near-term earnings power and minimizes the near-term earnings desert. Year 1 Gross Levered Yield on Total Portfolio From Refinances Only Note: This slide is a hypothetical illustration of management’s belief that the Company can purchase NPLs at 60% of the property value and refinance at 95% of the property value. Does not include any probable returns from the rest of the NPL portfolio. 10.0% 15.0% 90.0% 85.0% 12.5% 6.7% 0.0% 25.0% 50.0% 75.0% 100.0% Scenario 1 Scenario 2 Refinance Share 0.0% 4.0% 8.0% 12.0% 16.0% Yield Rest of the NPL Portfolio % of Refinances ~Gross Levered Yield on Total Portfolio |
|
|
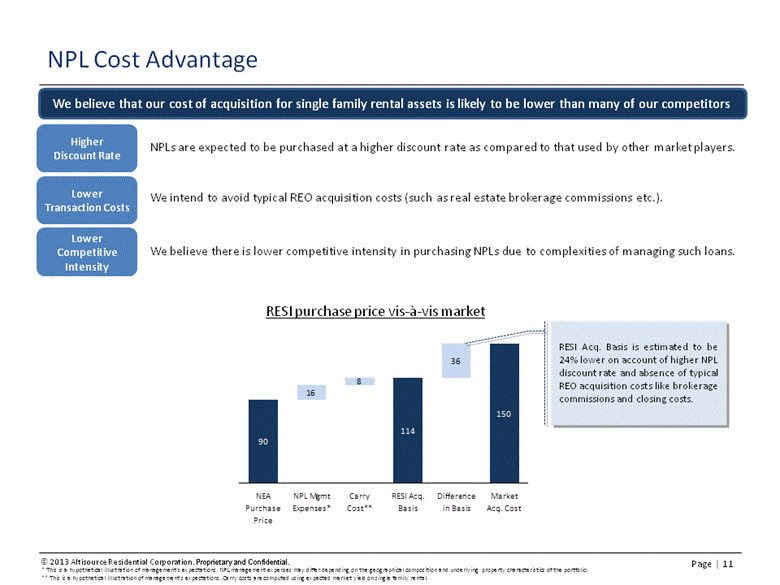
NPLs are expected to be purchased at a higher discount rate as compared to that used by other market players. NPL Cost Advantage We believe that our cost of acquisition for single family rental assets is likely to be lower than many of our competitors RESI purchase price vis-à-vis market * This is a hypothetical illustration of management’s expectations. NPL management expenses may differ depending on the geographical composition and underlying property characteristics of the portfolio. ** This is a hypothetical illustration of management’s expectations. Carry costs are computed using expected market yield on single family rental. RESI Acq. Basis is estimated to be 24% lower on account of higher NPL discount rate and absence of typical REO acquisition costs like brokerage commissions and closing costs. Higher Discount Rate Lower Transaction Costs Lower Competitive Intensity We intend to avoid typical REO acquisition costs (such as real estate brokerage commissions etc.). We believe there is lower competitive intensity in purchasing NPLs due to complexities of managing such loans. 90 114 150 16 8 36 NEA Purchase Price NPL Mgmt Expenses* Carry Cost** RESI Acq. Basis Difference in Basis Market Acq. Cost |
|
|
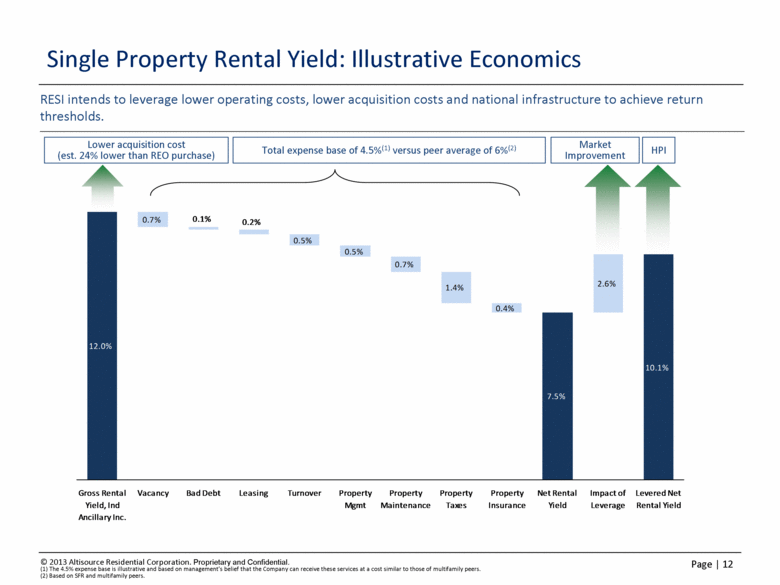
Single Property Rental Yield: Illustrative Economics RESI intends to leverage lower operating costs, lower acquisition costs and national infrastructure to achieve return thresholds. (1) The 4.5% expense base is illustrative and based on management’s belief that the Company can receive these services at a cost similar to those of multifamily peers. (2) Based on SFR and multifamily peers. Total expense base of 4.5%(1) versus peer average of 6%(2) HPI Lower acquisition cost (est. 24% lower than REO purchase) Market Improvement 12.0% 7.5% 10.1% 0.7% 0.5% 0.5% 0.7% 1.4% 0.4% 2.6% 0.2% 0.1% Gross Rental Yield, Ind Ancillary Inc. Vacancy Bad Debt Leasing Turnover Property Mgmt Property Maintenance Property Taxes Property Insurance Net Rental Yield Impact of Leverage Levered Net Rental Yield |
|
|
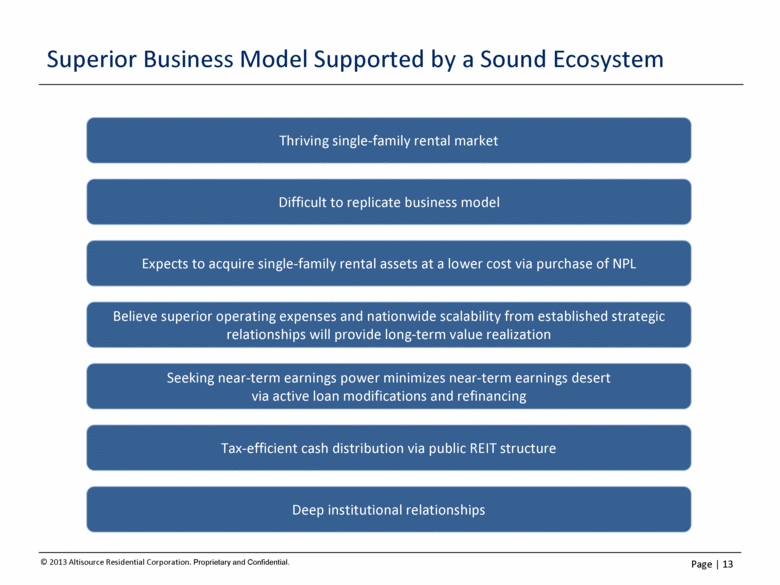
Superior Business Model Supported by a Sound Ecosystem Expects to acquire single-family rental assets at a lower cost via purchase of NPL Seeking near-term earnings power minimizes near-term earnings desert via active loan modifications and refinancing Tax-efficient cash distribution via public REIT structure Thriving single-family rental market Believe superior operating expenses and nationwide scalability from established strategic relationships will provide long-term value realization Difficult to replicate business model Deep institutional relationships |

