Attached files
| file | filename |
|---|---|
| 8-K - 8-K - VIROPHARMA INC | a13-2316_18k.htm |
Exhibit 99.1
|
|
2013 JP Morgan Healthcare Conference ViroPharma Incorporated January 8, 2013 |
|
|
2 This presentation contains certain forward-looking statements, including statements regarding our financial guidance for 2013 and 2015, peak year sales estimates for our commercial products, our projected financial condition, the rate of future growth and the development and commercialization status and prospects of certain of our products and product candidates. Projections and guidance in the biotechnology and pharmaceutical industries are inherently speculative and are based upon assumptions and factors, many of which are beyond our control given the long period of time into the future such statements address. The forward-looking statements included herein are based upon management’s current beliefs and expectations and involve risks and uncertainties. Such risks and uncertainties include interpretations of market research data regarding the prevalence of HAE, our ability to convert patients utilizing steroids to Cinryze, the effects of our sales force optimization efforts, percentage of patients who may choose prophylaxis therapy, the prevalence of adrenal insufficiency, the rate at which we are able to identify new patients for Cinryze in the United States and Europe and new patients for Buccolam and Plenadren in Europe, the size of the markets for each of our products and development candidates, future growth potential and market share for Cinryze in North America and Cinryze, Buccolam and Plendren in Europe, the availability of sufficient pricing and reimbursement for each of our products in the United States and Europe, our ability to achieve peak year sales projections, the timing and impact of potential branded and generic competitive products, supply interruptions or delays that could result from the complex manufacturing of our products and our global supply chain, our ability to develop life cycle management plans for Cinryze, including designing and completing clinical studies for additional indications and modes of administration, our ability to conduct and complete clinical studies in the timeframes we anticipate, the likelihood of success of any clinical trials involving our development candidates or marketed products and tax rates. Actual results and events may differ significantly from results and events discussed in forward-looking statements. Factors that might cause or contribute to such differences include, but are not limited to, those discussed in “Risk Factors” in our annual report on Form 10K for the year ended December 31, 2011 and our quarterly reports on Form 10-Q for the periods ended March 31, 2012, June 30, 2012 and September 30, 2012. There may be additional risks that the Company does not presently know or that the Company currently believes are immaterial which could cause actual results to differ from those contained in these forward looking statements. The statements in this presentation are made as of the date of this presentation and subsequent events may cause our assessment to change. ViroPharma does not assume any responsibility for updating any forward-looking statements. |
|
|
3 ViroPharma Delivering Solutions for Rare Diseases COMMERCIAL PRODUCTS DEVELOPMENT PIPELINE FINANCIAL STRENGTH |
|
|
4 Cinryze® IV (C1 Esterase Inhibitor [human]) Cinryze® IV (C1 Inhibitor [human]) Buccolam® (midazolam, oromucosal solution) Plenadren® (hydrocortisone, modified release) Growing Global Commercial Presence |
|
|
5 U.S. Cinryze Continued Strong Demand Ended 2012 with over 900 active patients dosing at 1.8 doses per week Over 160 net patient adds in 2012 50% of new patient adds have previously used anabolic steroids Diagnosis rates continue to grow Increased amount of first time prescribers and non-allergist prescribers |
|
|
6 Cinryze U.S. Growth Opportunities Continued conversion of existing steroid population Increasing utilization of home and self administration Increasing diagnosis rates Sales Force Optimization |
|
|
7 Fueling the Momentum 8 New HAE Specialists / 1 Regional Manager Increased reach Increased time with physicians Targeted detail of specialties outside of allergy |
|
|
8 Expected 2013 Cinryze N.A. Net Sales: Between $390M - $400M Impressive CINRYZE U.S. Annual Growth * Note: 2012 U.S. Cinryze Net Sales Number is a preliminary, unaudited amount. |
|
|
>$600 million North America $450 million peak sales 2 years ago Execution Has Delivered Progressive Growth in Expected Peak Sales 9 Strategic and tactical performance has exceeded expectations Significant opportunity still exists in Allergy / Immunology and other specialties New N.A. territory – Canadian Cinryze Approval Key areas of focus for 2013 Sales force optimization Enhanced targeting algorithms Continue to develop and maintain programs that patients require to maintain their HAE therapy $250 million peak sales at acquisition IV / HAE Only N.A Peak Sales Projections |
|
|
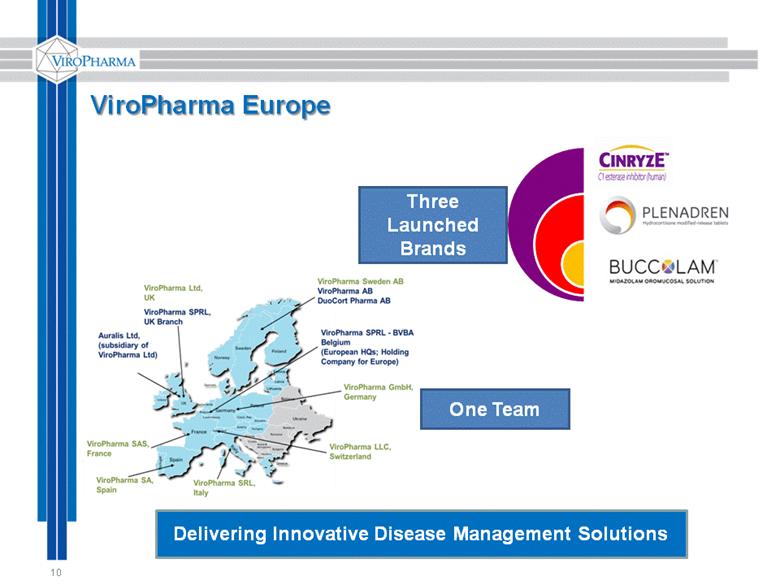
ViroPharma Europe 10 One Team Three Launched Brands Delivering Innovative Disease Management Solutions |
|
|
11 Cinryze in Europe - HAE First Prophylactic Option in European Markets Launched in Germany, Denmark, U.K. and Spain Continue pan-European roll-out 2012 and beyond Additional Efforts Underway to Continue Expanding Cinryze Global Presence |
|
|
12 Plenadren – Adrenal Insufficiency Affects range of 80K – 167K throughout EU Current therapies: side effects from variations in cortisol levels 40-60% of patients are not well controlled or have difficulties with current SOC Designed to mimic natural secretion pattern of cortisol Launched in Norway, Denmark, Germany and U.K Continuation of EU roll-out – 2nd Half 2013 |
|
|
13 Buccolam – Pediatric Epilepsy Buccal delivery a socially acceptable advantage over existing therapies for pediatric seizures Approximately six million affected by epilepsy in EU Launched in the UK and Germany Pan European Roll-out continues throughout 2012-13 Received important positive recommendation from Scottish Medicines Consortium Market protection through PUMA through 2021 |
|
|
Europe Expected to Become a Larger Share of Business and Significant Contributor to Top Line Growth 14 US Sales ~70% EU Sales ~30% 2015 Projected Sales Breakdown US Sales 95% EU Sales 5% 2012 Sales Breakdown |
|
|
Marketed Products Expected to Contribute Approximately 20% CAGR through 2015 15 $700 - $800 |
|
|
16 ViroPharma Delivering Solutions for Rare Diseases COMMERCIAL PRODUCTS DEVELOPMENT PIPELINE FINANCIAL STRENGTH |
|
|
Current Pipeline 17 2012 2013 2014 2015 2016 2017 Formulation Development C1 INH – SC Expansion Plenadren – US Pipeline Maribavir (CMV) VP 20629 ( Friedreich’s Ataxia) VP 20621 (Rec. C - Diff) Oral Budesonide ( EoE ) Cinryze (AMR) C1 Esterase (New Uses) C1 Recombinant Phase 2 Phase 3 Approval Path forward based on FDA feedback Phase 2 Phase 3 Phase 2 Phase 3 Phase 2 Phase 3 Phase 3 Phase 2 Continue funding of Investigator Initiated Studies Phase 1 Phase 2 Option Phase 2 Phase 3 Phase 1 |
|
|
18 Subcutaneous Cinryze Potential to Significantly Expand HAE Market Share Providing patients with options strengthens brand loyalty PH20 Combination Data presented at AAAAI 40 patient Phase 2 Dose-ranging study – Initiated 12/2012 EU centers initiated in December 2012 U.S. initiation this month Goal is to complete study in 2013 – Data Availability to be determined based on enrollment completion timing |
|
|
19 Other Potential Uses for C1 INH C1 Inhibitor: Platform Development Opportunity Preclinical data informing potential targets Investigator Initiated Study Model Potentially proof of concept will drive decision making Current Investigator Initiated Studies: Autoimmune Hemolytic Anemia (AIHA) Refractory Paroxysmal Nocturnal Hemoglobinuria (PNH) Neuromyelitis Optica (NMO) All three studies initiated |
|
|
20 VP-20621 for Recurrence of CDI Need exists for a non-antibiotic treatment effective across all strains Novel non-toxigenic C. difficile spore protective approach International Phase 2 study enrollment complete Interim data demonstrated: VP 20621 was well tolerated Colonized patients did not suffer recurrence Full Phase 2 Data expected in First Half 2013 |
|
|
21 CMV continues to be the most important transplant infection, with direct and indirect adverse effects Current therapy for CMV is limited by toxicity that can restrict use Maribavir has been shown to decrease viral load in preliminary evaluations of CMV-infected transplant patients The unmet need and clinical data support continued development efforts for maribavir Orphan designation has been obtained from US FDA Maribavir for Cytomegalovirus (CMV) |
|
|
Phase 2 dose ranging studies in transplant recipients EU: first line treatment of CMV viremia US: treatment of resistant/ refractory CMV disease Study Number 1263-203 1263-202 Regimens MBV 400 mg BID MBV 400 mg BID MBV 800 mg BID MBV 800 mg BID MBV 1200 mg BID MBV 1200 mg BID Valganciclovir — Treatment Duration Up to 12 weeks Up to 24 weeks Target N 160 120 |
|
|
EU Phase 2 Study (1263-203) Preliminary Virology Data n with data 20 19 17 15 12 6 CMV undetectable 15% 47% 76% 100% 100% 100% Quant. Limit 200 copies/mL NOTE: shown are interim data only, for all MBV dose groups combined; study is ongoing |
|
|
EU Phase 2 Study (1263-203) Preliminary Virology Data n with data 4 4 4 4 2 1 CMV undetectable 25% 75% 100% 100% 100% 0 Quant. Limit 200 copies/mL NOTE: shown are interim data only; study is ongoing |
|
|
25 ViroPharma Delivering Solutions for Rare Diseases COMMERCIAL PRODUCTS DEVELOPMENT PIPELINE FINANCIAL STRENGTH |
|
|
26 2012 Financial Performance 9 Mos. 2012 Total Net Products Sales $321M Reported GAAP Net Income $11.2M Reported Adjusted Net Income* $45M GAAP EPS $0.16 Working Capital $347M Cash Position $304M $323M of share repurchase since beginning of 2011 Authorized to return additional $227M * For Reconciliation of GAAP to Non-GAAP measures, please see press release issued on October 24, 2012 |
|
|
27 2013 ViroPharma Guidance N.A. Cinryze Net Sales - $390 - $400 Million Total Company Net Sales - $450 - $475 Million R&D/SG&A - $240 - $260 Million |
|
|
2015 Outlook - A Growth Story 28 Category Estimate of Future Opportunity ($ in millions) Total Company Net Sales $700M - $800M R&D and SG&A Combined $270M - $320M Effective Tax Rate ~32% Earnings Growth Differentiated |
|
|
Ultra-Orphan Product Sales Analogs Cinryze projections fall in-line with historical analog performance Global Sales in USD$ Soliris Cinryze Replagal Myozyme/Lumizyme Elaprase Cerezyme Aldurazyme Source: Annual USD Sales: DataMonitor, Cinryze: Internal reporting & projections |
|
|
ViroPharma Pipeline Provides Commercial Potential Upside 30 Pipeline opportunities primarily focused on orphan indications Potential to contribute meaningfully to longer-term revenue growth Other components of upside: Plenadren US VP-20629 (Friedreich’s Ataxia) Oral Budesonide (EoE) Recombinant C1-INH |
|
|
31 Critical Growth Catalysts in 2013 Continued Global Commercial Execution Cinryze Buccolam Plenadren +(U.S. Regulatory Pathway) Clinical Study Outcomes Maribavir VP-20621 Cinryze Subcutaneous Development |


