Attached files
| file | filename |
|---|---|
| 8-K - 8-K - Zep Inc. | a13-2203_18k.htm |
| EX-99.1 - EX-99.1 - Zep Inc. | a13-2203_1ex99d1.htm |
Exhibit 99.2
|
|
Zep First Quarter Fiscal 2013 Earnings Conference Call January 7, 2013 John K. Morgan Chairman, President and Chief Executive Officer Mark R. Bachmann Executive Vice President and Chief Financial Officer © 2013 Zep Inc. - All rights reserved. |
|
|
Safe Harbor This presentation and our commentary contain forward-looking statements within the meaning of the Private Securities Litigation Reform Act of 1995. Specifically, forward-looking statements include, but are not limited to, statements relating to our future economic performance, business prospects, revenue, income, and financial condition; and statements preceded by, followed by, or that include the words "expects," "believes," "intends," "will," "anticipates," and similar terms that relate to future events, performance, or our results. Examples of forward-looking statements in this presentation and our commentary include but are not limited to: statements regarding the economic environment and the impact this environment has had or could have on our current and/or future financial results; statements regarding our expectations for pricing actions and gross margin performance; statements regarding benefits that we may realize from our acquisitions and our restructuring activities; statements regarding investments that may be made in the future to grow our business, either organically or otherwise, in accordance with our strategic plan, or that may be made for other purposes; and statements and related estimates concerning the benefits that the execution of our strategic initiatives are expected to have on future financial results. Specifically, the following statements are forward-looking statements within the meaning of the Private Securities Litigation Reform Act of 1995; statements regarding the benefits we may realize from the implementation of the new ERP system; statements regarding the benefits we may realize from our formation of Zep Vehicle Care, statements regarding our expected gross margin percentage; statements regarding the amount of our capital expenditures during the remainder of 2013; statements regarding out interest expense in fiscal 2013; statements regarding the amount and timing of integration expenses related to Zep Vehicle Care; statements regarding the amount of amortization expenses attributable to our acquisition of the assets of the vehicle care division of Ecolab Inc.; and statements regarding our expectations for financial performance during fiscal 2013. Our forward-looking statements are subject to certain risks and uncertainties that could cause actual results, expectations, or outcomes to differ materially from our historical experience as well as our present expectations or projections. These risks and uncertainties include, but are not limited to: economic conditions in general; customer and supplier relationships and prices; competition; ability to realize anticipated benefits from strategic planning initiatives and timing of benefits; market demand; and litigation and other contingent liabilities, such as environmental matters. A variety of other risks and uncertainties could cause our actual results to differ materially from the anticipated results or other expectations expressed in our forward-looking statements. A number of those risks are discussed in Part I, "Item 1A. Risk Factors" of our Annual Report on Form 10-K for the fiscal year ended August 31, 2012. We believe the forward-looking statements are reasonable; however, undue reliance should not be placed on any forward-looking statements, which are based on current expectations. Further, forward-looking statements speak only as of the date they are made, and we undertake no obligation to update publicly any of them in light of new information or future events. 2 © 2013 Zep Inc. - All rights reserved. |
|
|
Agenda First Quarter 2013 Overview Detailed Financial Performance Questions and Answers 3 © 2013 Zep Inc. - All rights reserved. |
|
|
First Quarter 2013 Highlights Solid financial results Completed strategic acquisition and formed Zep Vehicle Care – creating a leading vehicle care business with the finest house of brands in the industry. Successful launch of our new ERP system. 4 © 2013 Zep Inc. - All rights reserved. |
|
|
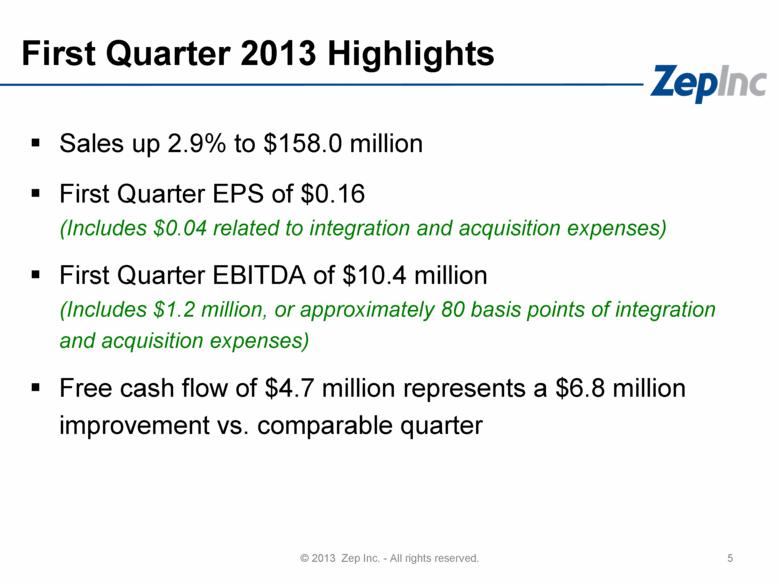
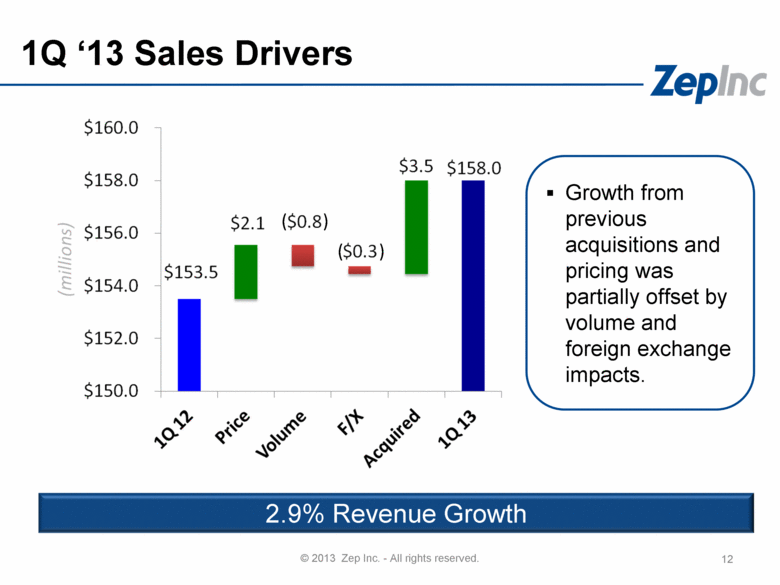
First Quarter 2013 Highlights Sales up 2.9% to $158.0 million First Quarter EPS of $0.16 (Includes $0.04 related to integration and acquisition expenses) First Quarter EBITDA of $10.4 million (Includes $1.2 million, or approximately 80 basis points of integration and acquisition expenses) Free cash flow of $4.7 million represents a $6.8 million improvement vs. comparable quarter 5 © 2013 Zep Inc. - All rights reserved. |
|
|
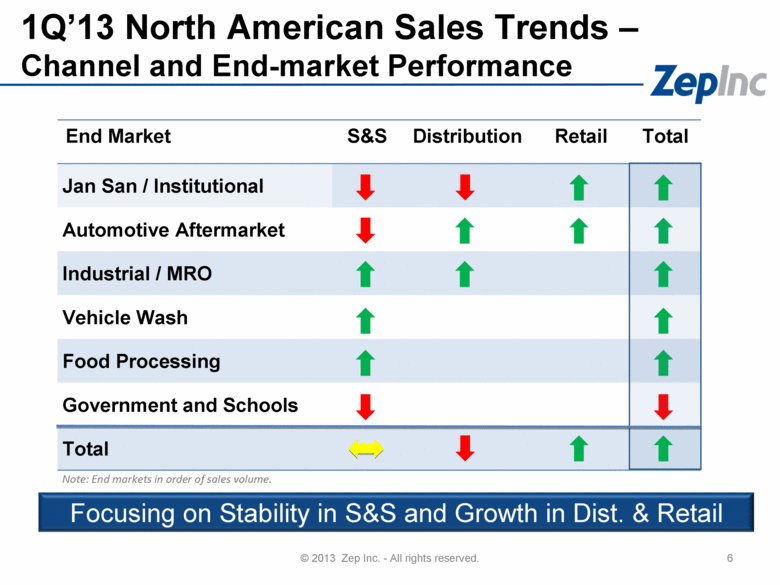
End Market S&S Distribution Retail Total Jan San / Institutional Automotive Aftermarket Industrial / MRO Vehicle Wash Food Processing Government and Schools Total 1Q’13 North American Sales Trends – Channel and End-market Performance © 2013 Zep Inc. - All rights reserved. 6 Focusing on Stability in S&S and Growth in Dist. & Retail Note: End markets in order of sales volume. |
|
|
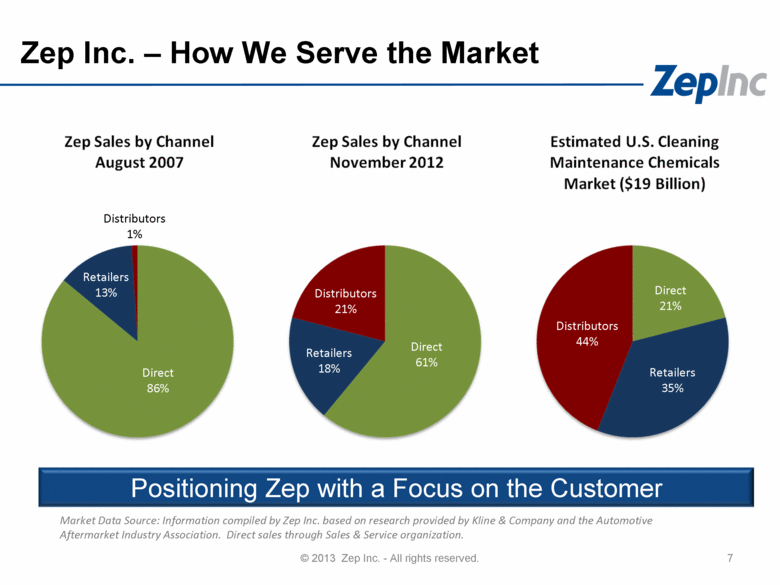
Zep Inc. – How We Serve the Market 7 © 2013 Zep Inc. - All rights reserved. Distributors 1% Retailers 13% Direct 86% Distributors 21% Retailers 18% Direct 61% Distributors 44% Retailers 35% Direct 21% Market Data Source: Information compiled by Zep Inc. based on research provided by Kline & Company and the Automotive Aftermarket Industry Association. Direct sales through Sales & Service organization. Positioning Zep with a Focus on the Customer |
|
|
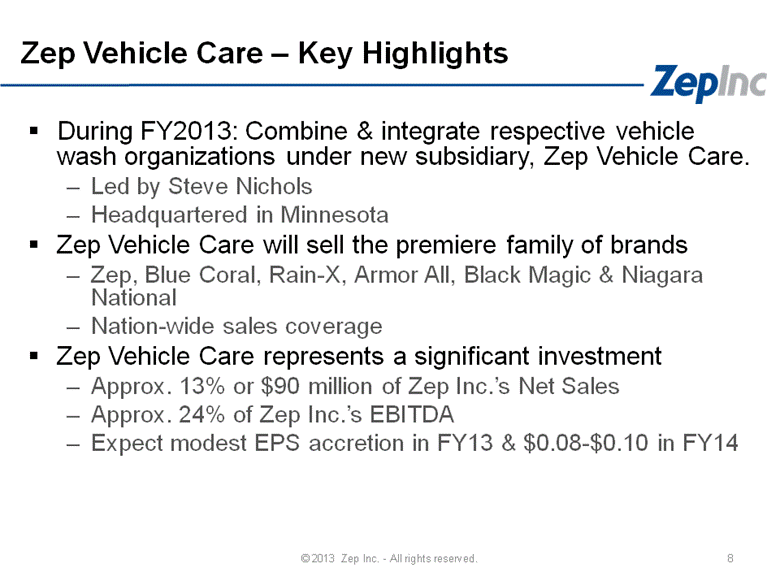
Zep Vehicle Care – Key Highlights During FY2013: Combine & integrate respective vehicle wash organizations under new subsidiary, Zep Vehicle Care. Led by Steve Nichols Headquartered in Minnesota Zep Vehicle Care will sell the premiere family of brands Zep, Blue Coral, Rain-X, Armor All, Black Magic & Niagara National Nation-wide sales coverage Zep Vehicle Care represents a significant investment Approx. 13% or $90 million of Zep Inc.’s Net Sales Approx. 24% of Zep Inc.’s EBITDA Expect modest EPS accretion in FY13 & $0.08-$0.10 in FY14 8 © 2013 Zep Inc. - All rights reserved. |
|
|
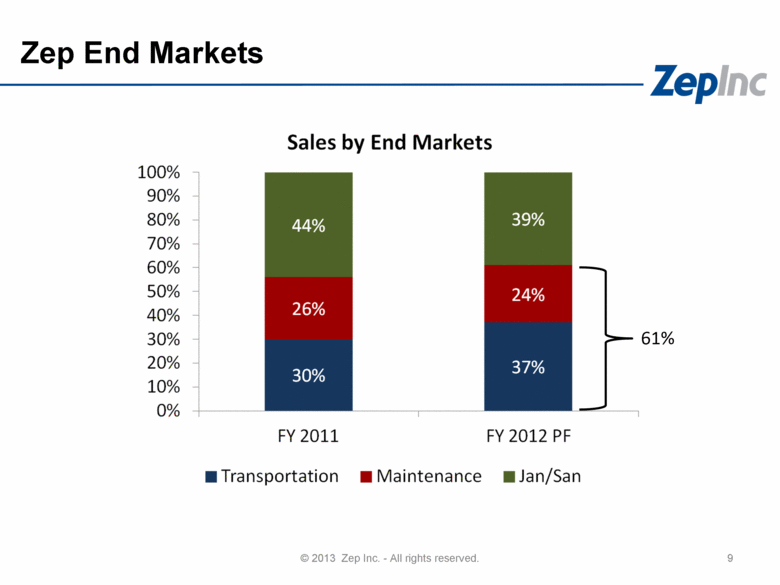
Zep End Markets Sales by End Markets 100% 90% 80% 44% 39% 70% 60% 50% 24% 40% 26% 30% 61% 20% 37% 30% 10% 0% FY 2011 FY 2012 PF Transportation Maintenance Jan/San 9 © 2013 Zep Inc. - All rights reserved. |
|
|
Near Term Strategic Objectives Successful integration of Zep Vehicle Care Optimize operations with new data and intelligence from SAP implementation Pay down debt De-lever balance sheet Prepare for future opportunities 10 © 2013 Zep Inc. - All rights reserved. |
|
|
Detailed Financial Performance |
|
|
1Q ‘13 Sales Drivers $160.0 $3.5 $158.0 $158.0 $2.1 ( $0.8) $156.0 ( $0.3) $153.5 (millions) $154.0 $152.0 $150.0 1Q 12 Price Volume F/X Acquired 1Q 13 Growth from previous acquisitions and pricing was partially offset by volume and foreign exchange impacts. 2.9% Revenue Growth © 2013 Zep Inc. - All rights reserved. 12 |
|
|
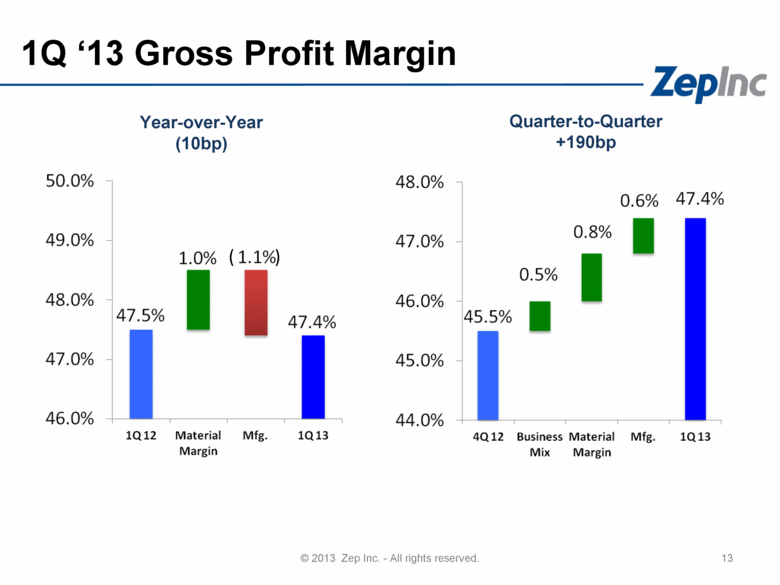
1Q ‘13 Gross Profit Margin Year-over-Year (10bp) Quarter-to-Quarter +190bp 47.5% 47.4% 1.0% 1.1% 46.0% 47.0% 48.0% 49.0% 50.0% 1Q 12 Material Margin Mfg. 1Q 13 ( ) 45.5% 47.4% 0.5% 0.8% 0.6% 44.0% 45.0% 46.0% 47.0% 48.0% 4Q 12 Business Mix Material Margin Mfg. 1Q 13 © 2013 Zep Inc. - All rights reserved. 13 |
|
|
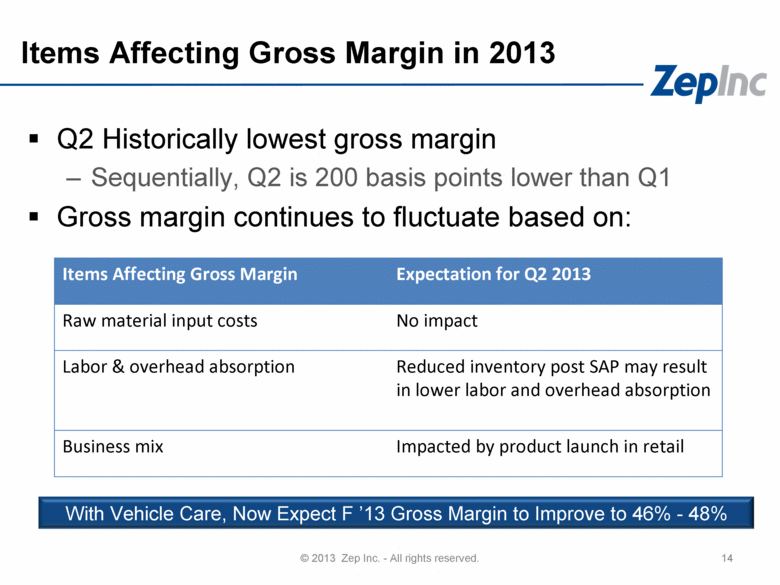
Items Affecting Gross Margin in 2013 Q2 Historically lowest gross margin Sequentially, Q2 is 200 basis points lower than Q1 Gross margin continues to fluctuate based on: 14 © 2013 Zep Inc. - All rights reserved. With Vehicle Care, Now Expect F ’13 Gross Margin to Improve to 46% - 48% Items Affecting Gross Margin Expectation for Q2 2013 Raw material input costs No impact Labor & overhead absorption Reduced inventory post SAP may result in lower labor and overhead absorption Business mix Impacted by product launch in retail |
|
|
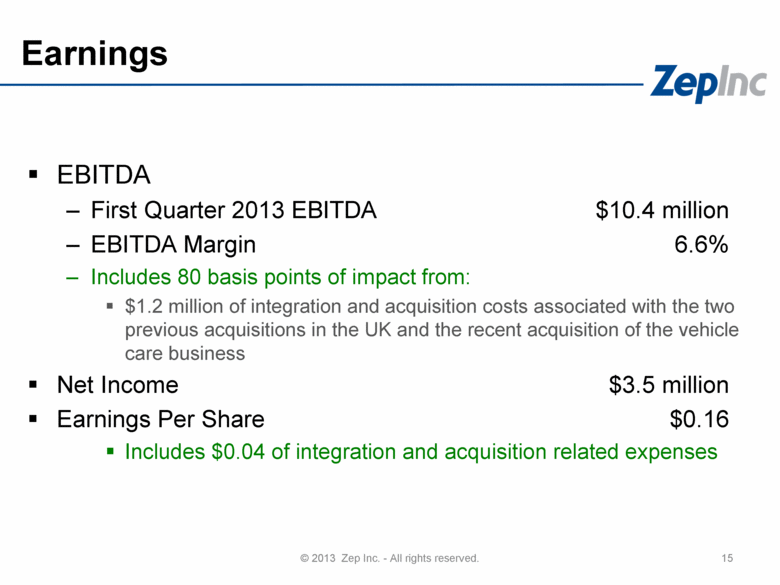
Earnings EBITDA First Quarter 2013 EBITDA $10.4 million EBITDA Margin 6.6% Includes 80 basis points of impact from: $1.2 million of integration and acquisition costs associated with the two previous acquisitions in the UK and the recent acquisition of the vehicle care business Net Income $3.5 million Earnings Per Share $0.16 Includes $0.04 of integration and acquisition related expenses 15 © 2013 Zep Inc. - All rights reserved. |
|
|
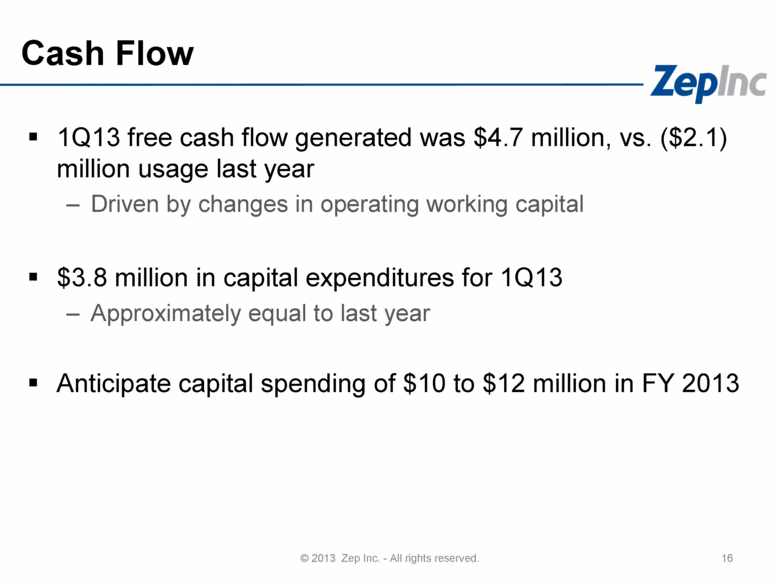
Cash Flow 1Q13 free cash flow generated was $4.7 million, vs. ($2.1) million usage last year Driven by changes in operating working capital $3.8 million in capital expenditures for 1Q13 Approximately equal to last year Anticipate capital spending of $10 to $12 million in FY 2013 16 © 2013 Zep Inc. - All rights reserved. |
|
|
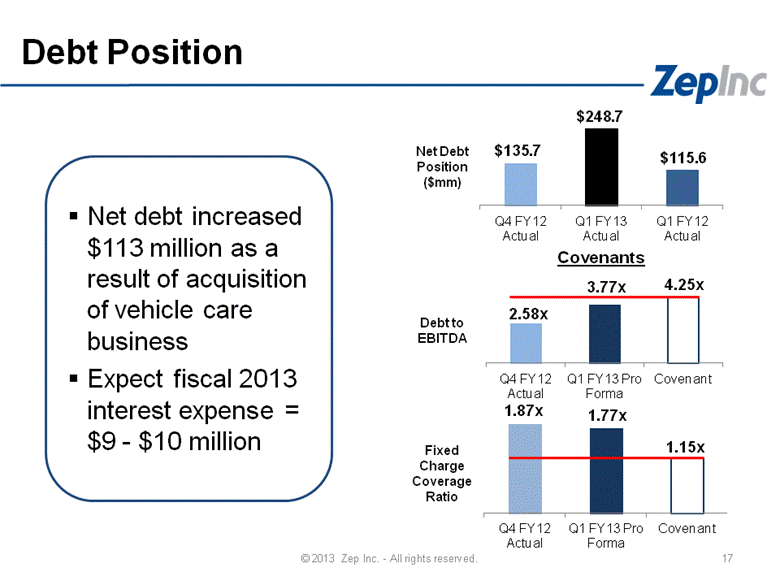
Debt Position Net debt increased $113 million as a result of acquisition of vehicle care business Expect fiscal 2013 interest expense = $9 - $10 million 2.58x 3.77x 4.25x Q4 FY12 Actual Q1 FY13 Pro Forma Covenant $135.7 $248.7 $115.6 Q4 FY12 Actual Q1 FY13 Actual Q1 FY12 Actual 1.87x 1.77x 1.15x Q4 FY12 Actual Q1 FY13 Pro Forma Covenant Fixed Charge Coverage Ratio Debt to EBITDA Net Debt Position ($mm) Covenants © 2013 Zep Inc. - All rights reserved. 17 |
|
|
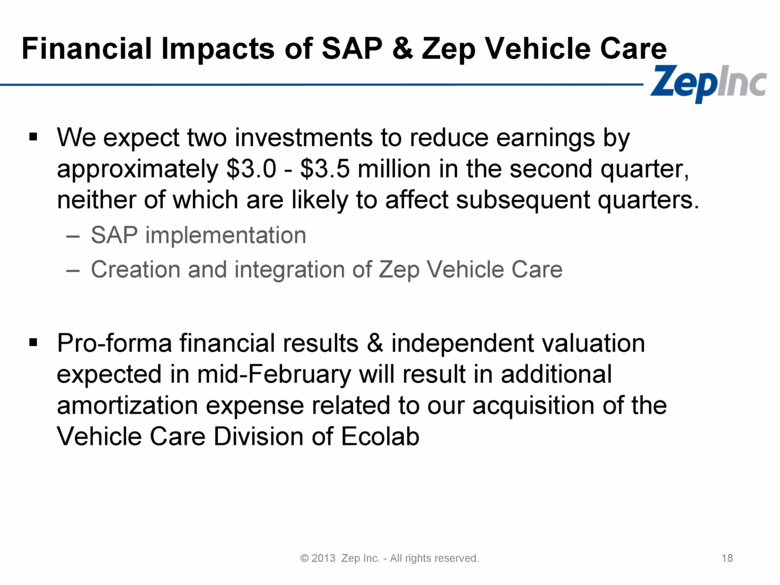
Financial Impacts of SAP & Zep Vehicle Care We expect two investments to reduce earnings by approximately $3.0 - $3.5 million in the second quarter, neither of which are likely to affect subsequent quarters. SAP implementation Creation and integration of Zep Vehicle Care Pro-forma financial results & independent valuation expected in mid-February will result in additional amortization expense related to our acquisition of the Vehicle Care Division of Ecolab 18 © 2013 Zep Inc. - All rights reserved. |
|
|
Summary Solid 1st Quarter Progress on Strategic Initiatives During Quarter Optimistic Regarding Progress Toward Long-Term Financial Objectives 19 © 2013 Zep Inc. - All rights reserved. |
|
|
Questions and Answers |

