Attached files
| file | filename |
|---|---|
| 8-K - 8-K - SquareTwo Financial Corp | a8-kforpresentation12512.htm |

SQUARETWO FINANCIAL CORPORATION accelerating assets BACK TO BLACK December 5th, 2012

SAFE HARBOR PROVISIONS 2 Certain statements made in this presentation are forward-looking statements under the Private Securities Litigation Reform Act of 1995. These can be identified by words such as "intend," "believe," and "expect," and phrases using those or similar terms. Specifically, statements relating to projections of future proceeds, revenue, income, profitability, cash flow, non-GAAP financial measures such as Adjusted EBITDA, Estimated Remaining Proceeds (“ERP”), and our ability to expand and utilize flexibility under our credit facility are forward-looking statements. These forward‐looking statements are not guarantees of our future performance and are subject to risks and uncertainties that could cause actual results to differ materially from the results contemplated by the forward‐looking statements. Factors that could affect our results and cause them to materially differ from those contained in the forward looking statements include those that we discuss in “Risk Factors” or comparable headings in our December 31, 2011 Form 10-K filed with the SEC. Adjusted EBITDA and ERP are supplemental measures of our performance and purchased debt asset value, respectively, that are not required by, or presented in accordance with, accounting principles generally accepted in the U.S., also known as “GAAP.” They are not measurements of our financial performance or asset value under GAAP and should not be considered as alternatives to net income, asset value, or any other performance measures derived in accordance with GAAP, or as alternatives to cash flows from operating activities or a measure of our liquidity. We believe adjusted EBITDA is representative of our cash flow generation that can be used to purchase charged-off receivables, pay down or service debt, pay income taxes, and for other uses. ERP represents the expected cash proceeds of our then-current purchased debt portfolios over a nine year period. You are, however, cautioned not to place undue reliance on adjusted EBITDA and ERP.

SquareTwo Financial Headquarters Denver, Colorado SQUARETWO OVERVIEW • Leader in $100 billion asset recovery industry • Assist companies and consumers resolve debt commitments • Award-winning, proprietary technology and analytics • Unique Partners Network • KRG Holding – Private equity owner since 2005 • New management team in late 2009 • New capital structure, included $290M of bonds in Q2 2010 3

LIQUIDATION EXAMPLE 4 ($ 000’s) ____________________ Note: Does note include cash proceeds from recourse. Face Value: $10,000 Time Acquisition Cost @ 8.5%: $850 Purchase date Approximately 100-120 purchases made annually Non-legal Collections – 60% to 65% Gross Proceeds: $1,320 40 – 45% in 1 st 6 months Cash proceeds that are collected by the Franchise Partners via letters or phone calls using firm name Legal Collections – 30% to 35% Gross Proceeds: $725 2–6 years (Majority after 3 years) Cash proceeds that are collected by the Franchise Partners via suit filing on an account Sales – 0% to 5% Gross Proceeds: $80 Throughout collection cycle Cash proceeds received for sale of an account Gross Proceeds $2,125 2.5x gross ROI or 80% annual IRR Costs ($765) Consists of payments to Franchise Partners and court costs expenditures Net Proceeds $1,360 1.6x net ROI or 40% annual IRR

- 0.1 0.2 0.3 0.4 0.5 0.6 0.7 0.8 Year 1 Year 2 Year 3 Year 4 Year 5 Year 6 Year 7 Year 8 Year 9 Year 10 Re tur n o n I nv es tm en t 10-Year Return on Investment (2009-2012*) SquareTwo Comp 1 Comp 2 CASH FLOW SPEED 5 *As of September 30, 2012. Actual and estimated cash flows from public filings. Timing of certain competitor forecasted cash flows based on historical patterns. Highest IRR’s in Industry; Averaging 1.0x ROI <18 Months

BUSINESS MODEL GROWTH • Purchasing +7% • Cash Proceeds +32% 6 • Year over year leverage: 4% decrease † • Year over year Operating Leverage = 4X+ All full year 2012 information annualized based on actual year-to-date September 30, 2012 data. † YTD September 30 vs. YTD September 30 470.7 623.5 300 450 600 2011 2012 Cash Proceeds ($ millions) 267.7 287.4 200 250 300 2011 2012 Purchases ($ millions)

ACCELERATED FINANCIAL TRENDING 7 • Adjusted EBITDA growth of 36% • GAAP EBITDA growth of 241% • Consolidated ERP growth to $929 million • Net Income of $9.9 million 142.1 199.0 271.6 50 100 150 200 250 YTD Q3 2010 YTD Q3 2011 YTD Q3 2012 Adjusted EBITDA ($ millions) (35.6) 16.3 55.4 (50) (25) - 25 50 YTD Q3 2010 YTD Q3 2011 YTD Q3 2012 GAAP EBITDA ($ millions) 569.7 752.5 929.2 300 500 700 900 Q3 2010 Q3 2011 Q3 2012 Consolidated ERP ($ millions) (62.6) (24.9) 9.9 (75) (45) (15) 15 YTD Q3 2010 YTD Q3 2011 YTD Q3 2012 Net Income ($ millions)

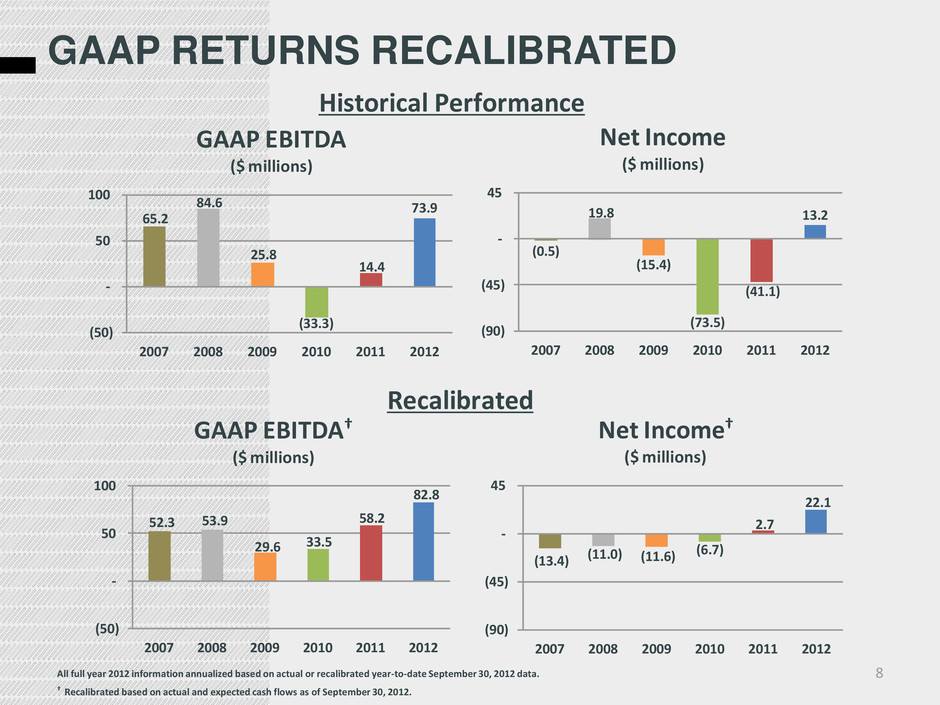
GAAP RETURNS RECALIBRATED 8 All full year 2012 information annualized based on actual or recalibrated year-to-date September 30, 2012 data. † Recalibrated based on actual and expected cash flows as of September 30, 2012. (13.4) (11.0) (11.6) (6.7) 2.7 22.1 (90) (45) - 45 2007 2008 2009 2010 2011 2012 Net Income† ($ millions) 52.3 53.9 29.6 33.5 58.2 82.8 (50) - 50 100 2007 2008 2009 2010 2011 2012 GAAP EBITDA† ($ millions) (0.5) 19.8 (15.4) (73.5) (41.1) 13.2 (90) (45) - 45 2007 2008 2009 2010 2011 2012 Net Income ($ millions) 65.2 84.6 25.8 (33.3) 14.4 73.9 (50) - 50 100 2007 2008 2009 2010 2011 2012 GAAP EBITDA ($ millions) Recalibrated Historical Performance

INVESTMENT HIGHLIGHTS 9 • Significant and stable base of assets • Differentiated attorney-based franchise business model • Highly flexible and scalable platform • Diversified investment focus • Best-in-class technology and analytics platform • Favorable industry dynamics • Strong history of ROIs and IRRs • Disciplined purchasing efforts and capital deployment • Major emphasis on compliance, training and process support

QUESTIONS?
