Attached files
| file | filename |
|---|---|
| 8-K - 8-K - REGIONS FINANCIAL CORP | d444561d8k.htm |
 Goldman Sachs Financial
Services Conference
December 5, 2012
Grayson Hall
President and Chief Executive Officer
Exhibit 99.1 |
 2
Regions’
mission is to achieve superior economic
value for our shareholders over time by
making life better for our customers, our
associates and our communities
and creating shared value as we help them meet their
financial goals and aspirations.
Regions
makes life better. |
 3
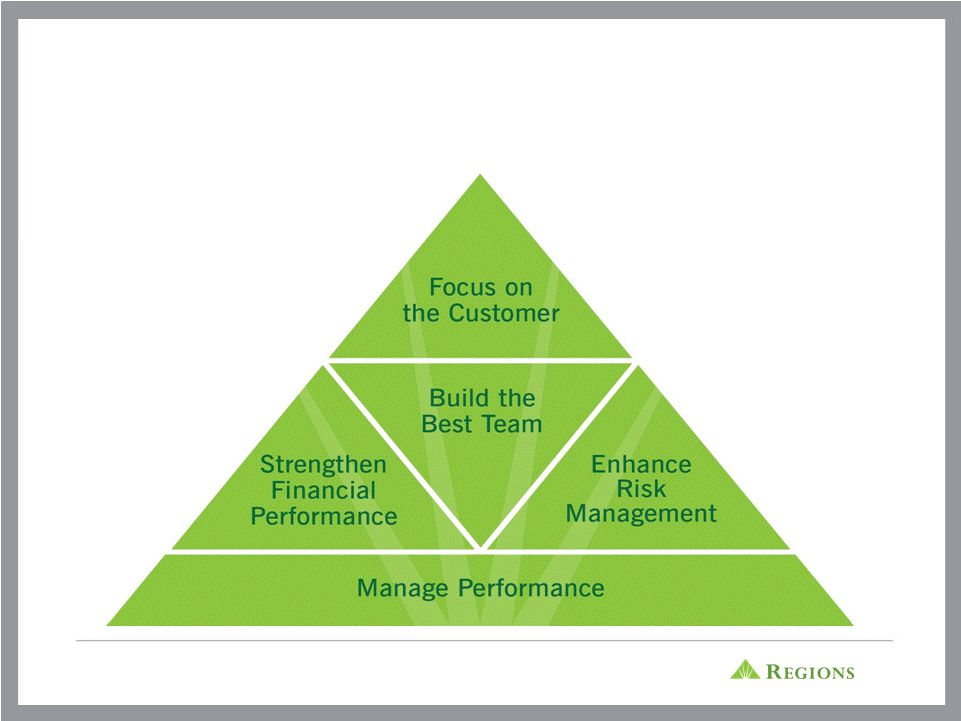
BUSINESS PRIORITIES
Four strategic priorities based on a foundation of managing performance
provide direction for all business decisions |
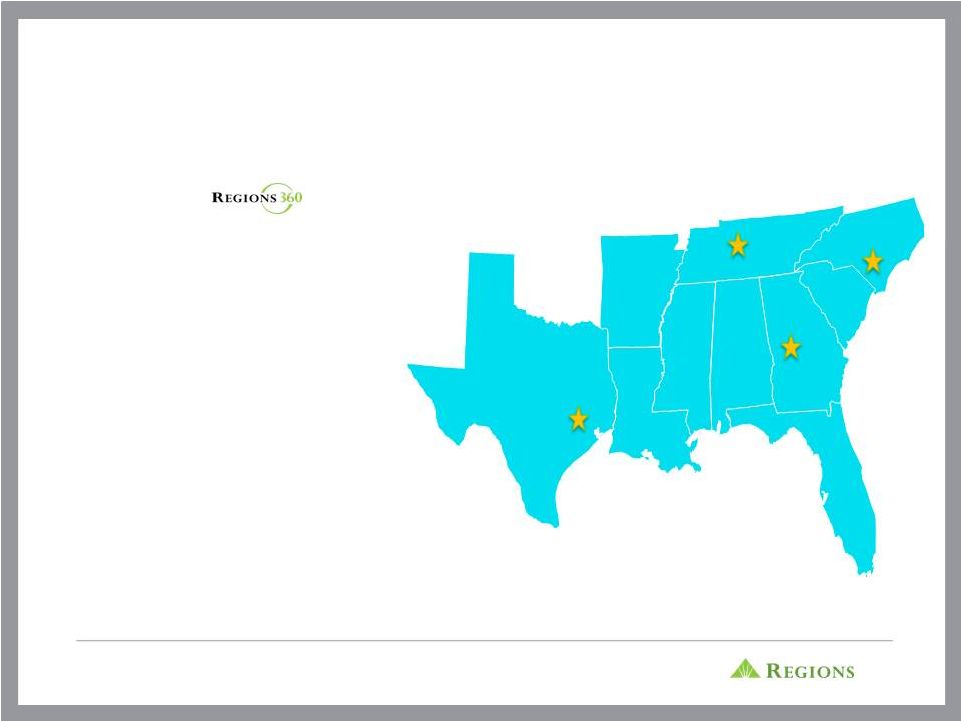
 4
OUR COMPANY TODAY…
COMPANY SNAPSHOT
September 2012
Associates
23,361
Assets
$122B
Loans
$75B
Deposits
$95B
Branches
1,716
ATMs
2,061
Market Cap*
$9.3B
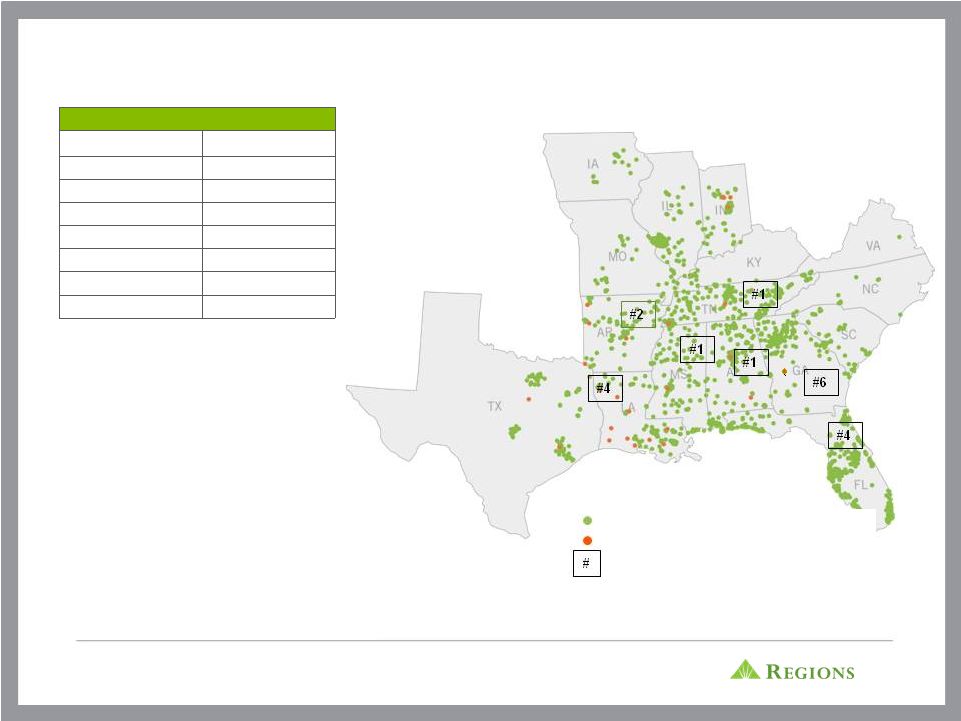
•
Operating in sixteen states; however,
seven states represent 85% of total
deposits
•
Primary business lines: Consumer
Services, Business Services, and
Wealth Management
•
22nd Largest Mortgage Servicer, with
$41 billion servicing portfolio
•
Full line insurance brokerage firm
offering all lines of personal and
commercial insurance
* As of November 26, 2012
Regions Branches
Regions Insurance Group
Deposit Market Share |
 5
Top 10 MSAs
Deposits
Market
Rank
Birmingham, AL
$10.1
1
Nashville, TN
$7.0
1
Tampa, FL
$5.0
4
Miami, FL
$4.0
11
Memphis, TN
$3.9
2
Atlanta, GA
$3.3
6
St. Louis, MO
$3.0
4
Jackson, MS
$2.9
2
New Orleans, LA
$2.4
4
Mobile, AL
$2.3
1
($ in billions)
National Average: 3.9%
Source: SNL Financial
Note: Core Markets include AL, FL, LA, MS, AR, TN
Rank
Name
Market
Share
1
Bank of America
11.1%
2
Wells Fargo
9.9%
3
Regions
9.4%
4
SunTrust
6.7%
5
JPMorgan Chase
3.8%
6
BB&T
3.0%
7
Capital One
2.2%
8
First Horizon
2.0%
9
Hancock
1.7%
10
Citi
1.6%
FOOTPRINT POSITIONING
CHARACTERIZED BY HIGH MARKET SHARE, HIGH
GROWTH MARKETS
Weighted Average Deposit Market
Share
in
Regions’
Core
Markets
1.0%
8.8%
4.4%
2.0%
10.1%
4.3%
1.4%
3.7%
9.6%
3.4%
’10-’15
Population
Growth |
 6
2012 ACCOMPLISHMENT HIGHLIGHTS
Enhance Risk
Management
Focus on the
Customer
Strengthen
Financial
Performance
Build the Best
Team
Manage Performance
Strategic Priorities
•
Capital plan approved and executed
•
Executed MK transaction, raised $900 million in equity, repaid TARP, repurchased
warrant •
Achieved sustainable profitability
•
Investment grade rating improvement
•
Enhanced technology platform; teller image capture, sales and service, mainframe
replacement •
Strengthened
enterprise
risk
management
disciplines
and
improved
credit
risk
profile
•
I
Issued preferred stock of $500 million and redeemed $345 million of Trust Preferred Securities |
 7
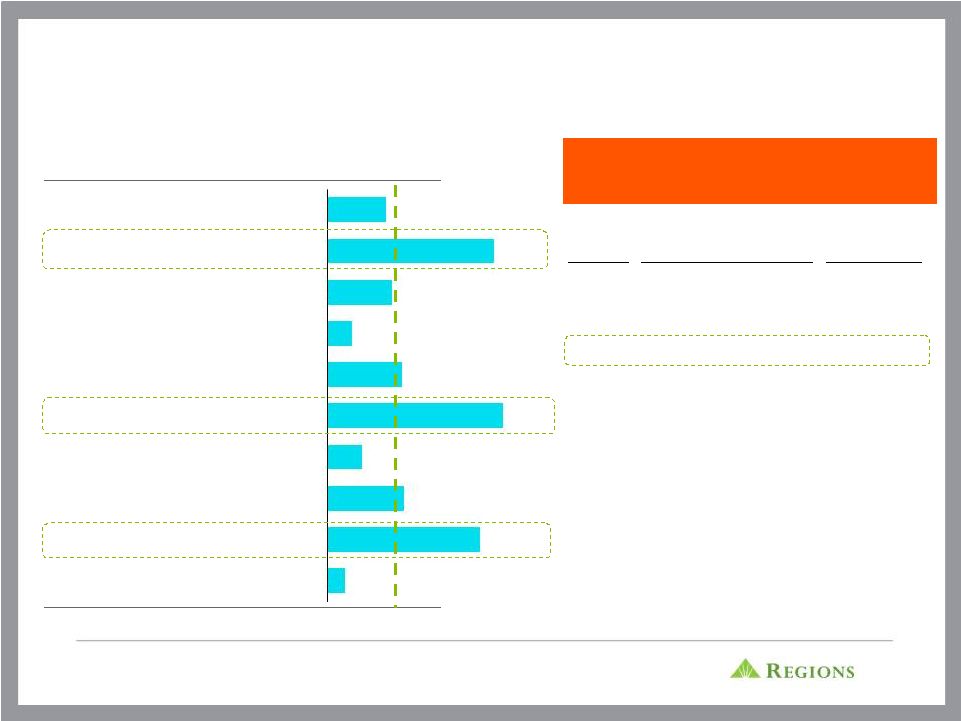
REVENUE
GROWTH
–
STEADY
PROGRESS
Note: Peer banks include BBT, CMA, FHN, FITB, HBAN, KEY, PNC, STI, USB, WFC,
ZION Source: SNL Financial
Growth in Total Revenue Linked Quarter vs Peers
-0.5%
-0.4%
0.4%
1.3%
0.1%
2.2%
0.8%
1.2%
-0.7%
-1.1%
3Q11
4Q11
1Q12
2Q12
3Q12
Regions
Peer Median |
 8
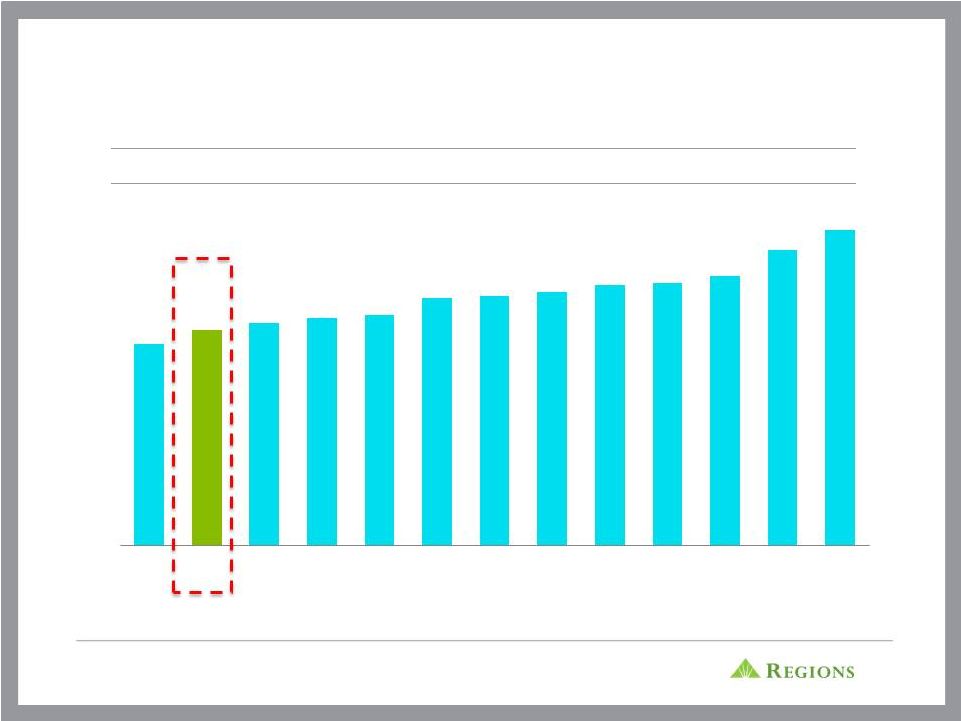
REGIONS HAS THE SECOND LOWEST EXPENSE TO
ASSETS RATIO VS PEERS
(1) Adjusted
to
exclude
non-core
items,
ratios
are
annualized
–
See
appendix
for
reconciliation
Peer banks include: BBT, CMA, FHN, FITB, HBAN, KEY, MTB, PNC, STI, USB, WFC,
ZION Source: SNL Financial
Non-Interest
Expense
(1)
/
Average
Assets
2.7%
2.8%
2.9%
3.0%
3.1%
3.3%
3.3%
3.4%
3.4%
3.5%
3.6%
3.9%
4.2%
Bank
#1
RF
Bank
#3
Bank
#4
Bank
#5
Bank
#6
Bank
#7
Bank
#8
Bank
#9
Bank
#10
Bank
#11
Bank
#12
Bank
#13 |
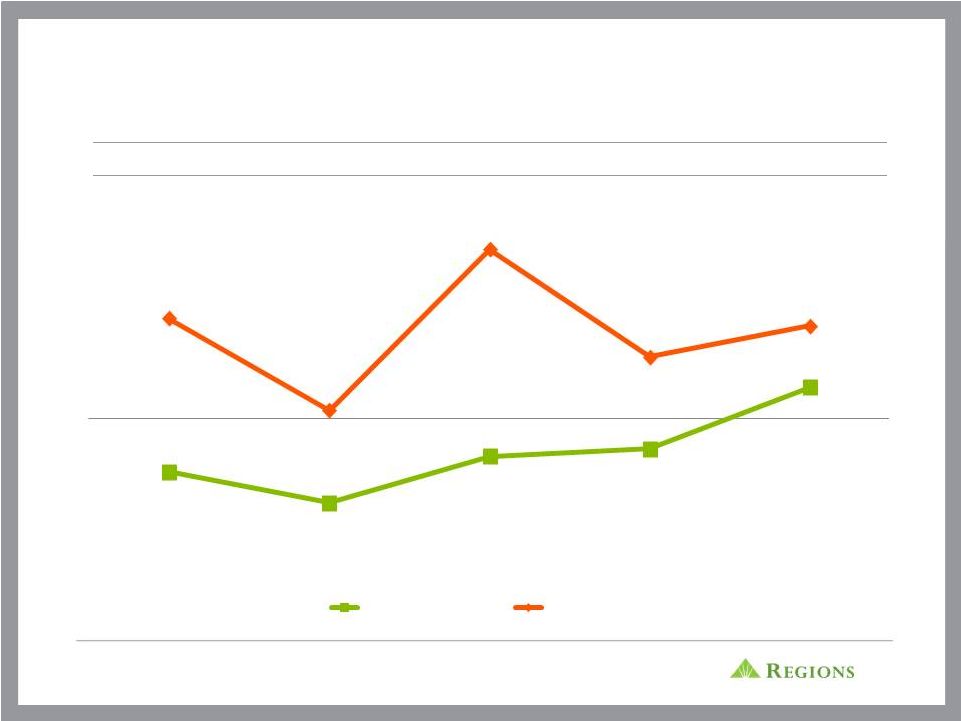
 9
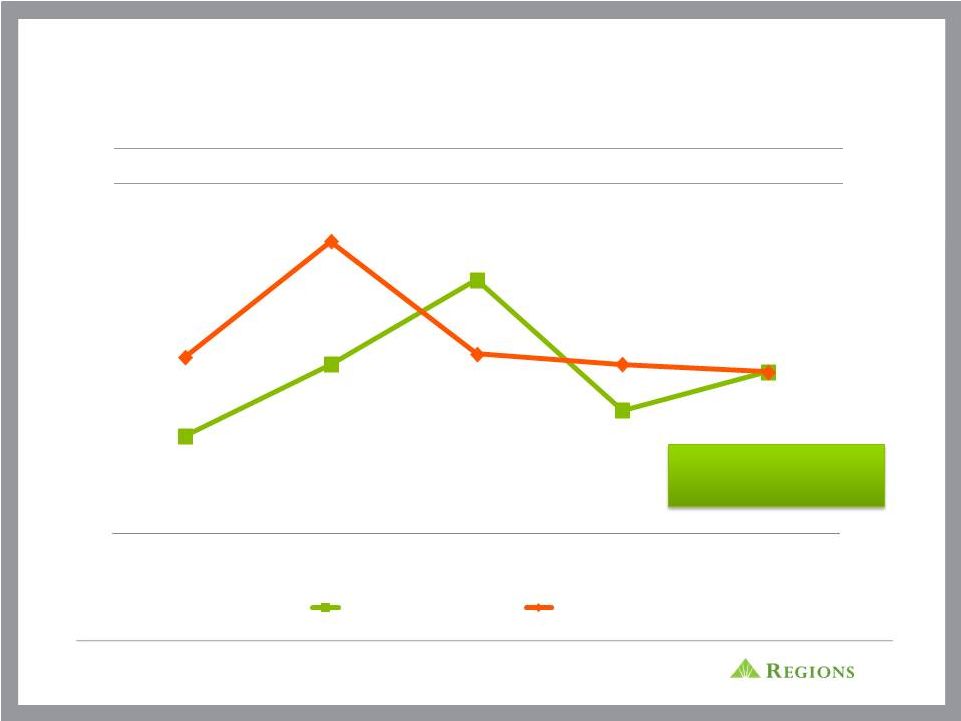
FOCUSED ON IMPROVED EFFICIENCY
(1) Non-GAAP
–
See
appendix
for
reconciliation
Note: Results from Continuing Operations
Peer banks include: BBT, CMA, FHN, FITB, HBAN, KEY, MTB, PNC, STI, USB, WFC,
ZION Source: SNL Financial
Efficiency Ratio
(1)
Target-
Mid to
High 50s
3Q11
4Q11
1Q12
2Q12
3Q12
Regions
Peer Median
61.8%
64.6%
67.9%
64.6%
64.3%
64.9%
69.4%
65.0%
62.8%
64.3% |
 10
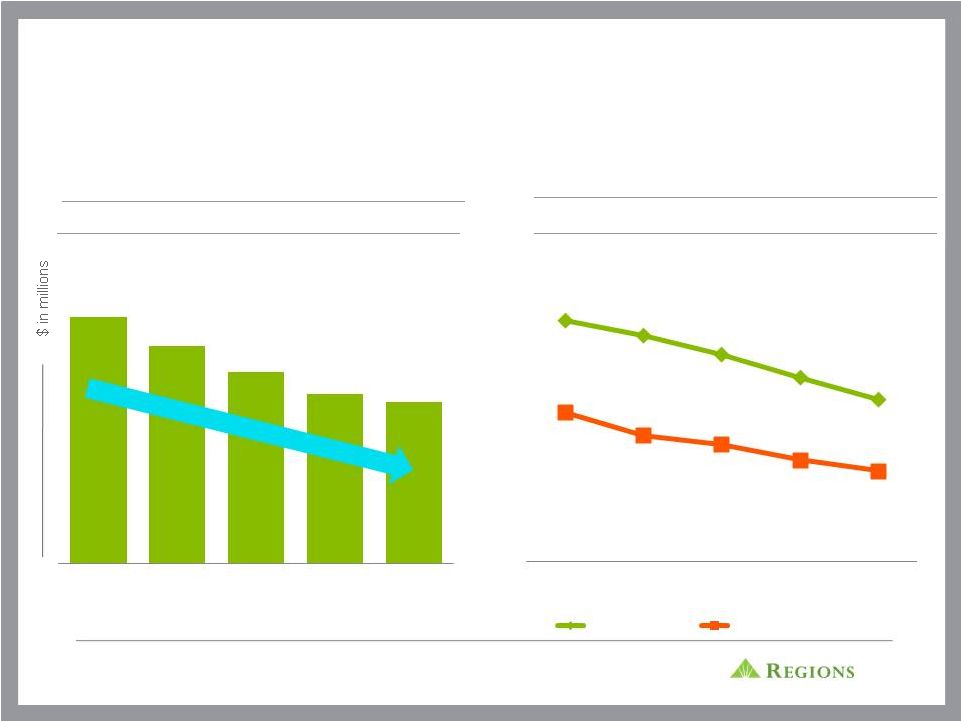
CONTINUED ASSET QUALITY IMPROVEMENT;
SIGNIFICANT CREDIT LEVERAGE REMAINS
Allowance for Loan Losses / Total Loans
Note: Peer banks include BBT, CMA, FHN, FITB, HBAN, KEY, PNC, STI, USB, WFC,
ZION Source: SNL Financial
35% decrease Y-O-Y
Non-Performing Assets
$3,391
$2,996
$2,641
$2,331
$2,215
3Q11
4Q11
1Q12
2Q12
3Q12
3Q11
4Q11
1Q12
2Q12
3Q12
Regions
Peer Group Median
3.73%
2.74%
2.58%
1.84% |
 11
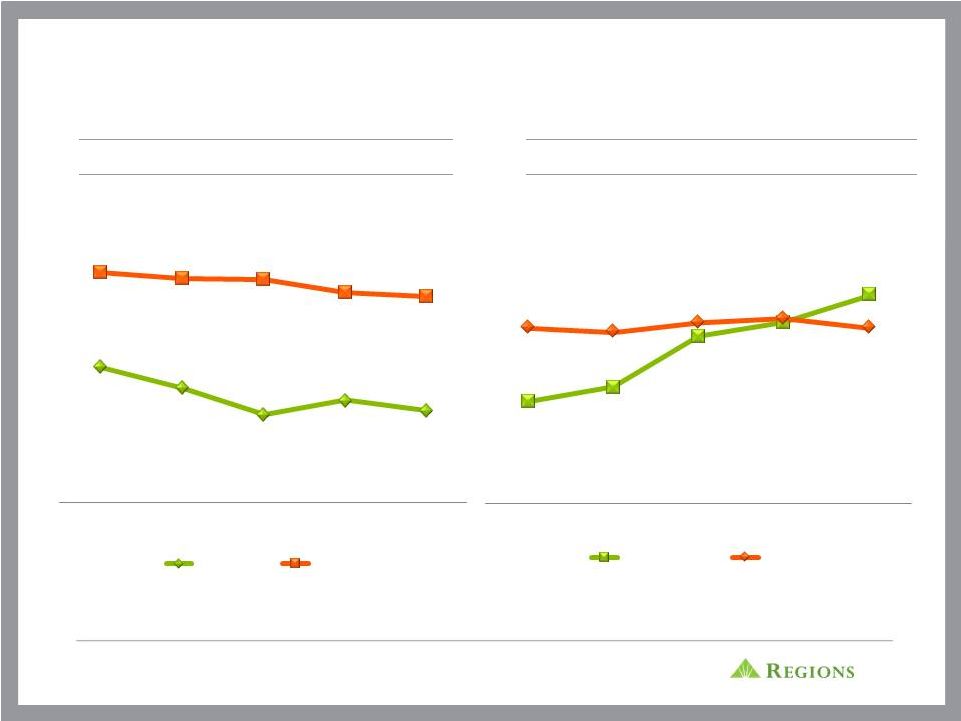
SOLID CAPITAL AND LIQUIDITY
Loan to Deposit Ratio
(1) Non-GAAP
–
See
appendix
for
reconciliation
Note: Peer banks include BBT, CMA, FHN, FITB, HBAN, KEY, PNC, STI, USB, WFC,
ZION Source: SNL Financial
Tier
1
Common
Ratio
(1)
3Q11
4Q11
1Q12
2Q12
3Q12
3Q11
4Q11
1Q12
2Q12
3Q12
82.8%
81.1%
79.0%
80.1%
79.3%
90.3%
89.8%
89.7%
88.7%
88.4%
8.2%
8.5%
9.6%
9.9%
10.5%
9.8%
9.7%
9.9%
10.0%
9.8%
Regions
Peer Median
Regions
Peer Median |
 12
•
Getting
a
full
and
detailed
view
of
customer
financial
needs
–
360°
View
•
Deepening customer relationships through cross-sell
•
Going
to
market
as
One
bank,
One
team,
One
Regions
–
making
referrals and meeting needs
•
Providing service quality that creates exceptional loyalty & retention
CREATING SHARED VALUE FOR OUR CUSTOMERS, OUR
COMMUNITIES, OUR ASSOCIATES AND OUR
SHAREHOLDERS THROUGH… |
 13
Community Service
Housing Assistance
Disaster Response Policy
•
Regions associates
volunteered for nearly 5,300
community service activities
in first-half 2012
•
Included teaching 3,300-plus
financial education classes
•
Impacted students at all
levels, potential first-time
homebuyers, small business
owners
•
Significant increase over
previous years due to
company-wide emphasis on
service
•
Regions Customer
Assistance Program (CAP)
has helped more than 45,000
homeowners restructure $3.9
billion in mortgages, keeping
people in their homes after
job loss, natural disasters
and other setbacks
•
Regions foreclosure rate
remains well below industry
average
•
Regions promotes affordable
housing by investing in Low
Income Housing Tax Credits
•
Penalty free withdrawals on
CDs
•
Personal and business loan
deferral
•
Up to 3 months payment
forbearance/extensions for
all Consumer Loan/Line
Products
•
ATM fees waived
•
NSF/OD Fees waived
•
Mobile ATM available for
deployment
OUR APPROACH TO SERVING OUR COMMUNITIES |
 14
Business Services –
Key Focus Areas for 2013
TRANSITION TO GROWTH
Healthcare
Technology/Defense
Energy
(Houston)
(Atlanta)
(Charlotte)
(Nashville)
•
Acquire, retain and deepen
relationships
•
Maintain disciplined focus on
specialized industries to drive growth
•
Specialized Industries:
Healthcare, Restaurant,
Transportation, Technology &
Defense, and Energy
•
We are still in the Investor Real
Estate business, where appropriate
•
Get paid for the risks we take
•
Stay focused on prudent Risk
Management disciplines, including
risk rating accuracy
Transportation
Restaurant |
 15
Continue Executing our new Wealth Management Strategy -
Key
Focus Areas for 2013
•
Broaden and deepen relationships
•
Grow trust assets under management
•
Roll out branch-based Financial Consultants-
Cetera
•
Enhance performance management and
coaching culture
•
Stay focused on prudent risk management
disciplines
•
Listen to customers’
goals and deliver
products and services they need
•
Expand service and product offerings
TRANSITION TO GROWTH |
 16
Consumer Services –
Key Focus Areas for 2013
•
Deepen relationships
•
Attract, retain and expand quality consumer households
•
Stabilize
and
grow
quality
earning
assets
–
get
paid
for
the risks we take
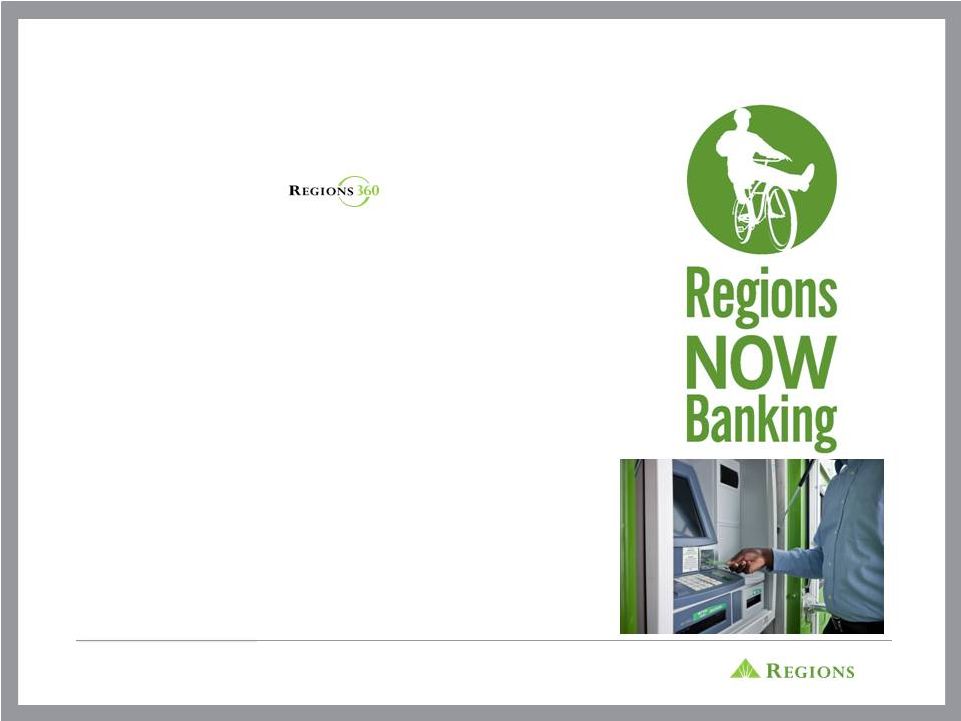
•
Leverage NOW Banking products to bank the under-
banked markets
•
Continue to prudently grow credit cards, mortgage and
indirect lending
•
Remain focused on disciplined risk management,
compliance and regulatory issues
•
Provide trustworthy advice, guidance and education to
help our customers succeed financially
•
Leverage technology to improve channel capabilities,
sales and efficiency
TRANSITION TO GROWTH |
 17
APPENDIX |
 18
FORWARD-LOOKING STATEMENTS
This presentation may include forward-looking statements which reflect Regions’ current views
with respect to future events and financial performance. The Private Securities Litigation
Reform Act of 1995 (“ the Act” ) provides a “ safe harbor” for forward-looking statements which are identified as such and are accompanied by the
identification of important factors that could cause actual results to differ materially from the
forward-looking statements. For these statements, we, together with our subsidiaries,
claim the protection afforded by the safe harbor in the Act. Forward-looking statements are not based on historical information, but rather are related to
future operations, strategies, financial results or other developments. Forward-looking statements
are based on management’s expectations as well as certain assumptions and estimates
made by, and information available to, management at the time the statements are made. Those statements are based on general assumptions and are
subject to various risks, uncertainties and other factors that may cause actual results to differ
materially from the views, beliefs and projections expressed in such statements. These
risks, uncertainties and other factors include, but are not limited to, those described below: › The Dodd-Frank Wall Street Reform and Consumer Protection Act (the “ Dodd-Frank
Act” ) became law in July 2010, and a number of legislative, regulatory and tax
proposals remain pending. Additionally, the U.S. Treasury Department and federal banking regulators continue to implement, but are also beginning to wind down, a number of
programs to address capital and liquidity in the banking system. Future and proposed rules, including
those that are part of the Basel III process are expected to require banking institutions to
increase levels of capital. All of the foregoing may have significant effects on Regions and the financial services industry, the exact nature and extent of which cannot be determined
at this time.
› Possible additional loan losses, impairment of goodwill and other intangibles, and adjustment
of valuation allowances on deferred tax assets and the impact on earnings and capital.
› Possible changes in interest rates may increase funding costs and reduce earning asset yields,
thus reducing margins. Increases in benchmark interest rates would also increase debt
service requirements for customers whose terms include a variable interest rate, which may negatively impact the ability of borrowers to pay as contractually obligated.
› Possible changes in general economic and business conditions in the United States in general
and in the communities Regions serves in particular, including any prolonging or
worsening of the current unfavorable economic conditions including unemployment levels.
› Possible changes in the creditworthiness of customers and the possible impairment of the
collectability of loans. › Possible changes in trade, monetary and fiscal policies, laws
and regulations and other activities of governments, agencies, and similar organizations, may have an adverse effect
on business.
› Possible regulations issued by the Consumer Financial Protection Bureau or other regulators
which might adversely impact Regions' business model or products and services. › Possible
stresses in the financial and real estate markets, including possible deterioration in property values.
› Regions' ability to manage fluctuations in the value of assets and liabilities and
off-balance sheet exposure so as to maintain sufficient capital and liquidity to support Regions'
business.
› Regions' ability to expand into new markets and to maintain profit margins in the face of
competitive pressures. › Regions' ability to develop competitive new products and services
in a timely manner and the acceptance of such products and services by Regions' customers and potential
customers.
› Regions' ability to keep pace with technological changes.
› Regions' ability to effectively manage credit risk, interest rate risk, market risk,
operational risk, legal risk, liquidity risk, reputational risk, and regulatory and compliance risk.
› Regions’ ability to ensure adequate capitalization which is impacted by inherent
uncertainties in forecasting credit losses. › The cost and other effects of material
contingencies, including litigation contingencies, and any adverse judicial, administrative or arbitral rulings or proceedings.
› The effects of increased competition from both banks and non-banks.
› The effects of geopolitical instability and risks such as terrorist attacks.
› Possible changes in consumer and business spending and saving habits could affect Regions'
ability to increase assets and to attract deposits. › The effects of weather and natural
disasters such as floods, droughts, wind, tornados and hurricanes, and the effects of man-made disasters.
› Possible downgrades in ratings issued by rating agencies.
› Possible changes in the speed of loan prepayments by Regions’ customers and loan
origination or sales volumes. › Possible acceleration of prepayments on
mortgage-backed securities due to low interest rates and the related acceleration of premium amortization on those securities.
› The effects of problems encountered by larger or similar financial institutions that adversely
affect Regions or the banking industry generally. › Regions’ ability to receive
dividends from its subsidiaries. › The effects of the failure of any component of
Regions’ business infrastructure which is provided by a third party. › Changes in
accounting policies or procedures as may be required by the Financial Accounting Standards Board or other regulatory agencies.
› The effects of any damage to Regions reputation resulting from developments
related to any of the items identified above. The foregoing list of factors is not exhaustive. For discussion of these and other factors that may
cause actual results to differ from expectations, look under the captions “Forward-
Looking Statements” and “ Risk Factors” in Regions’ Annual Report on Form 10-K
for the year ended December 31, 2011 and the "Forward-Looking Statements" section of Regions'
Quarterly Reports on Form 10-Q for the quarters ended March 31, June 30, and September 30, 2012.
The words "believe," "expect," "anticipate," "project," and similar expressions
often signify forward-looking statements. You should not place undue reliance on any
forward-looking statements, which speak only as of the date made. We assume no obligation to
update or revise any forward-looking statements that are made from time to time.
|
 19
NON-GAAP RECONCILIATION: NON-INTEREST EXPENSE
The table below presents non-interest expense (GAAP) excluding certain
adjustments to arrive at adjusted non-interest expense (non-
GAAP).
Regions
believes
that
the
exclusion
of
these
adjustments
provides
a
meaningful
base
for
period-to-period
comparisons,
which
management believes will assist investors in analyzing the operating results of the
Company and predicting future performance. This non-GAAP financial
measure is also used by management to assess the performance of Regions' business. It is possible that the
activities
related
to
the
adjustments
may
recur;
however,
management
does
not
consider
the
activities
related
to
the
adjustments
to
be
indications of ongoing operations. Regions believes that presentation of this
non-GAAP financial measure will permit investors to assess the
performance of the Company on the same basis as that applied by management.
($ amounts in millions)
9/30/12
6/30/12
3/31/12
12/31/11
9/30/11
Continuing Operations
Non-interest expense (GAAP)
869
$
842
$
913
$
1,124
$
850
$
Adjustments:
Securities impairment, net
-
(2)
-
(2)
-
Branch consolidation and property and equipment charges
-
-
-
2
-
Goodwill impairment
-
-
-
(253)
-
Adjusted non-interest expense (non-GAAP)
G
869
$
840
$
913
$
871
$
850
$
Quarter Ended |
 20
NON-GAAP RECONCILIATION: FEE INCOME RATIOS AND
EFFICIENCY RATIOS
($ amounts in millions)
9/30/12
6/30/12
3/31/12
12/31/11
9/30/11
Continuing Operations
Non-interest expense (GAAP)
869
$
842
$
913
$
1,124
$
850
$
Adjustments:
Securities impairment, net
-
(2)
-
(2)
-
Branch consolidation and property and equipment charges
-
-
-
2
-
Goodwill impairment
-
-
-
(253)
-
Adjusted non-interest expense (non-GAAP)
G
869
$
840
$
913
$
871
$
850
$
Net interest income, taxable-equivalent basis (GAAP)
830
$
850
$
839
$
858
$
859
$
Non-interest income (GAAP)
533
$
507
$
524
$
507
$
513
$
Adjustments:
Securities (gains) losses, net
(12)
(12)
(12)
(7)
1
Leveraged lease termination (gains) losses, net
-
(7)
(7)
(10)
2
Adjusted non-interest income (non-GAAP)
H
521
488
505
490
516
Adjusted total revenue (non-GAAP)
I
1,351
$
1,338
$
1,344
$
1,348
$
1,375
$
Fee income ratio (non-GAAP)
H/I
38.6%
36.5%
37.6%
36.4%
37.5%
Efficiency ratio (non-GAAP)
G/I
64.3%
62.8%
67.9%
64.6%
61.8%
Quarter Ended
The table below presents computations of the efficiency ratio (non-GAAP), which
is a measure of productivity, generally calculated as non-interest expense divided by
total revenue. The table also shows the fee ratio (non-GAAP), generally
calculated as non-interest income divided by total revenue. Management uses these ratios to
monitor performance and believes these measures provide meaningful information to
investors. Non-interest expense (GAAP) is presented excluding certain
adjustments to arrive at adjusted non-interest expense (non-GAAP), which is
the numerator for the efficiency ratio. Non-interest income (GAAP) is presented
excluding certain adjustments to arrive at adjusted non-interest income
(non-GAAP), which is the numerator for the fee ratio. Net interest income on a fully taxable-
equivalent basis (GAAP) and non-interest income are added together to arrive at
total revenue (GAAP). Adjustments are made to arrive at adjusted total revenue
(non-GAAP), which is the denominator for the fee and efficiency ratios. Regions
believes that the exclusion of these adjustments provides a meaningful base for
period-to-period comparisons, which management believes will assist
investors in analyzing the operating results of the Company and predicting future performance.
These non-GAAP financial measures are also used by management to assess the
performance of Regions' business. It is possible that the activities related to the
adjustments
may
recur;
however,
management
does
not
consider
the
activities
related
to
the
adjustments
to
be
indications
of
ongoing
operations.
Regions
believes
that presentation of these non-GAAP financial measures will permit investors to
assess the performance of the Company on the same basis as that applied by
management. |
 21
NON-GAAP RECONCILIATION: TIER 1 COMMON
The following table provides calculations of Tier 1 capital (regulatory) and
"Tier 1 common equity" (non-GAAP). Traditionally, the Federal Reserve and other banking
regulatory bodies have assessed a bank's capital adequacy based on Tier 1 capital,
the calculation of which is prescribed in amount by federal banking regulations.
In connection with the Company's Comprehensive Capital Assessment and Review
("CCAR"), these regulators are supplementing their assessment of the capital
adequacy
of
a
bank
based
on
a
variation
of
Tier
1
capital,
known
as
Tier
1
common
equity.
While
not
prescribed
in
amount
by
federal
banking
regulations,
analysts
and banking regulators have assessed Regions' capital adequacy using the Tier 1
common equity measure. Because Tier 1 common equity is not formally defined
by GAAP or prescribed in any amount by federal banking regulations, this measure is
considered to be a non-GAAP financial measure and other entities may
calculate it differently than Regions' disclosed calculations. Since analysts
and banking regulators may assess Regions' capital adequacy using Tier 1 common
equity,
management
believe s
that
it
is
useful
to
provide
investors
the
ability
to
assess
Regions'
capital
adequacy
on
this
same
bases.
Tier 1 common equity is often expressed as a percentage of risk-weighted
assets. Under the risk-based capital framework, a company's balance sheet assets and
credit equivalent amounts of off-balance sheet items are assigned to one of
four broad risk categories. The aggregated dollar amount in each category is then
multiplied by the risk-weighted category. The resulting weighted values
from each of the four categories are added together and this sum is the risk-weighted assets
total that, as adjusted, comprises the denominator of certain risk-based
capital ratios. Tier 1 capital is then divided by this denominator (risk-weighted assets) to
determine the Tier 1 capital ratio. Adjustments are made to Tier 1 capital to
arrive at Tier 1 common equity (non-GAAP). Tier 1 common equity (non-GAAP) is also
divided by the risk-weighted assets to determine the Tier 1 common equity ratio
(non-GAAP). The amounts disclosed as risk-weighted assets are calculated
consistent with banking regulatory requirements.
TIER 1 COMMON RISK-BASED RATIO CONSOLIDATED
Stockholders' equity (GAAP)
14,901
$
14,455
$
17,534
$
16,499
$
17,263
$
Accumulated other comprehensive (income) loss
(202)
(54)
60
69
(92)
Non-qualifying goodwill and intangibles
(4,836)
(4,852)
(4,881)
(4,900)
(5,649)
Disallowed deferred tax assets
(238)
(336)
(345)
(432)
(506)
Disallowed servicing assets
(33)
(33)
(36)
(35)
(35)
Qualifying non-controlling interests
93
92
92
92
92
Qualifying trust preferred securities
846
846
846
846
846
Tier 1 capital (regulatory)
10,531
$
10,118
$
13,270
$
12,139
$
11,919
$
Qualifying non-controlling interests
(93)
(92)
(92)
(92)
(92)
Qualifying trust preferred securities
(846)
(846)
(846)
(846)
(846)
Preferred stock
-
-
(3,429)
(3,419)
(3,409)
Tier 1 common equity (non-GAAP)
O
9,592
$
9,180
$
8,903
$
7,782
$
7,572
$
Risk-weighted assets (regulatory)
P
91,723
91,779
92,546
91,449
92,786
Tier 1 common risk-based ratio (non-GAAP)
O/P
10.5%
10.0%
9.6%
8.5%
8.2%
($ amounts in millions, except per share data)
9/30/12
6/30/12
3/31/12
12/31/11
9/30/11
As of and for Quarter Ended |
 |