Attached files
| file | filename |
|---|---|
| 8-K - 8-K - FIFTH THIRD BANCORP | d448810d8k.htm |
 ©
Fifth Third Bank | All Rights Reserved
Goldman Sachs
U.S. Financial Services Conference
Kevin T. Kabat
Chief Executive Officer
December 5, 2012
Refer to earnings release dated October 18, 2012
and 10-Q dated November 7, 2012 for further information
Exhibit 99.1 |
 2
©
Fifth Third Bank | All Rights Reserved
Well-positioned for success and leadership in new banking landscape
Key themes
Strong levels of
profitability
Broad-based
credit
improvements
Exceed fully
Phased-in Basel
III capital
standards today
Well-established
franchise in key
markets
Commitment to
our customers
and our
communities
Continued
investments to
maintain and
enhance
revenue-
generation
Disciplined
expense control
Traditional
banking focus
consistent with
direction of
financial reform |
 3
©
Fifth Third Bank | All Rights Reserved
A strong franchise showing momentum
1
Strong results underscored by
continued loan growth, solid fee
income, expense control, and ongoing
improvement in credit metrics
2
Traditional banking model moderate
risk profile and strong execution
contribute to above average returns
3
New product offerings consistent with
our mission, our customer value
proposition, and regulatory reform
4
Return capital from robust internal
capital generation through
appropriate dividend payout and
share repurchase plans
5
Current and forecasted fully phased-in
pro-forma capital ratios would
substantially exceed new fully
phased-in well-capitalized minimums
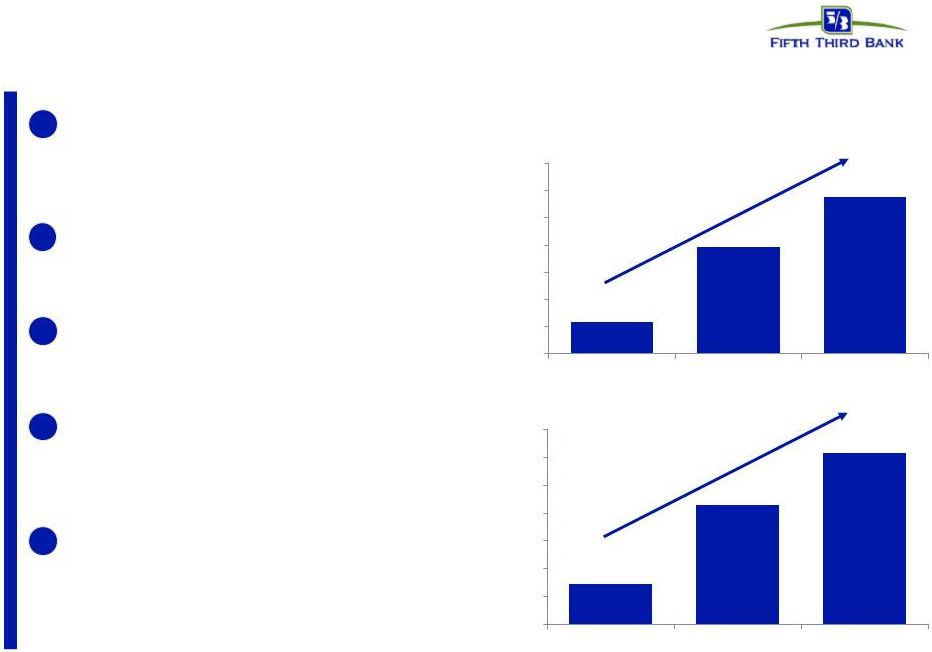
Earnings Growth
Net income available to common shareholders ($MM)
Diluted EPS
Diluted EPS
$233
$789
$1,152
$0
$200
$400
$600
$800
$1,000
$1,200
$1,400
2010 YTD
2011 YTD
2012 YTD
$0.29
$0.86
$1.23
$0.00
$0.20
$0.40
$0.60
$0.80
$1.00
$1.20
$1.40
2010 YTD
2011 YTD
2012 YTD |
 4
©
Fifth Third Bank | All Rights Reserved
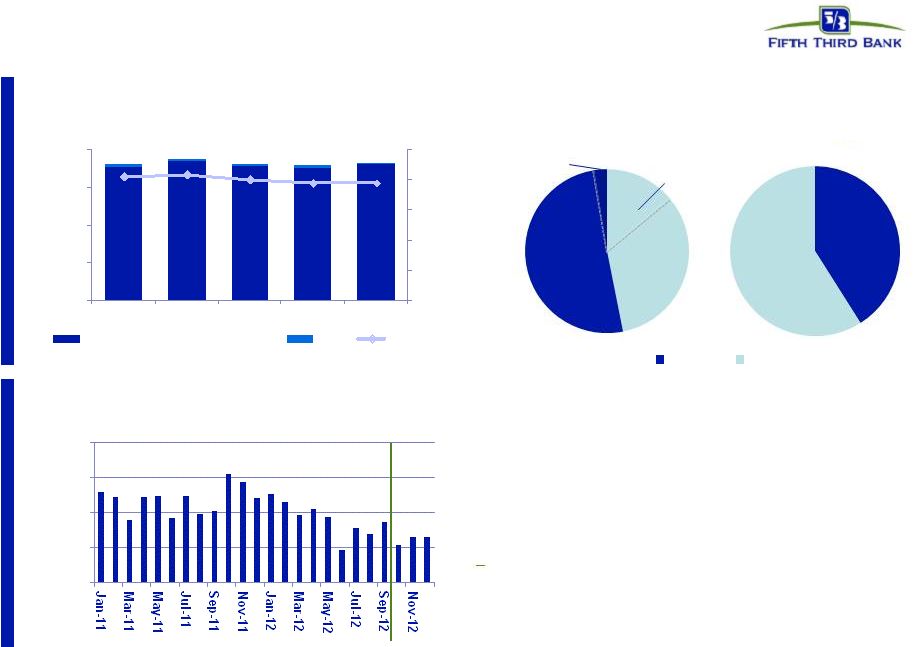
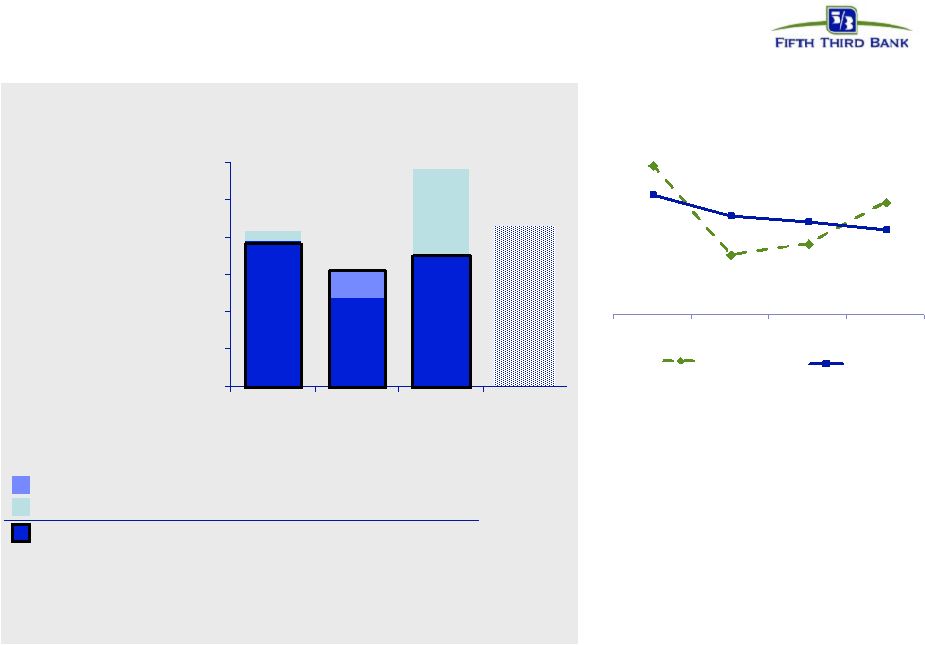
NII results reflect continued moderate NIM
pressure offset by balance sheet growth
* Represents purchase accounting adjustments included in net interest income.
^ Estimate; funding (DDAs + interest-bearing liabilities); liabilities
attributed to fixed or floating using terms and expected beta
Fixed / Floating Portfolio
Interest-Earning
Assets
Funding^
Fixed
~55-60%
NII and NIM (FTE)
($MM)
Loans
50%
Loans
33%
Investment
Portfolio 3%
Trend: fixed rate loan origination coupons
relative to fixed portfolio weighted avg
Larger portfolio repricing effects
3.65%
3.67%
3.61%
3.56%
3.56%
$450
$550
$650
$750
$850
$950
2.0%
2.5%
3.0%
3.5%
4.0%
3Q11
4Q11
1Q12
2Q12
3Q12
$902
$920
$903
$899
$907
Net Interest Income (right axis)
PAA*
NIM
Floating
Fixed
Fixed
47%
Floating
53%
Investment
Portfolio
14%
Floating
40
-
45%
0.00
0.50
1.00
1.50
2.00
•
3Q12 NII included $10MM of non-recurring benefits (4
bps positive impact to NIM)
•
NIM pressure created by low rate environment, higher
prepayment speeds, repricing in securities and loan
portfolios, and modest natural asset sensitivity, but
overall is expected to be manageable
•
Spreads on new originations of variable rate assets
consistent with historical spreads
•
Coupons on new fixed rate loan originations
converging with portfolio average coupons
•
Current trends have pressured net interest income
levels, but expect to mitigate much of impact with
continued loan growth and liability management
Emphasis on variable rate C&I lending |
 5
©
Fifth Third Bank | All Rights Reserved
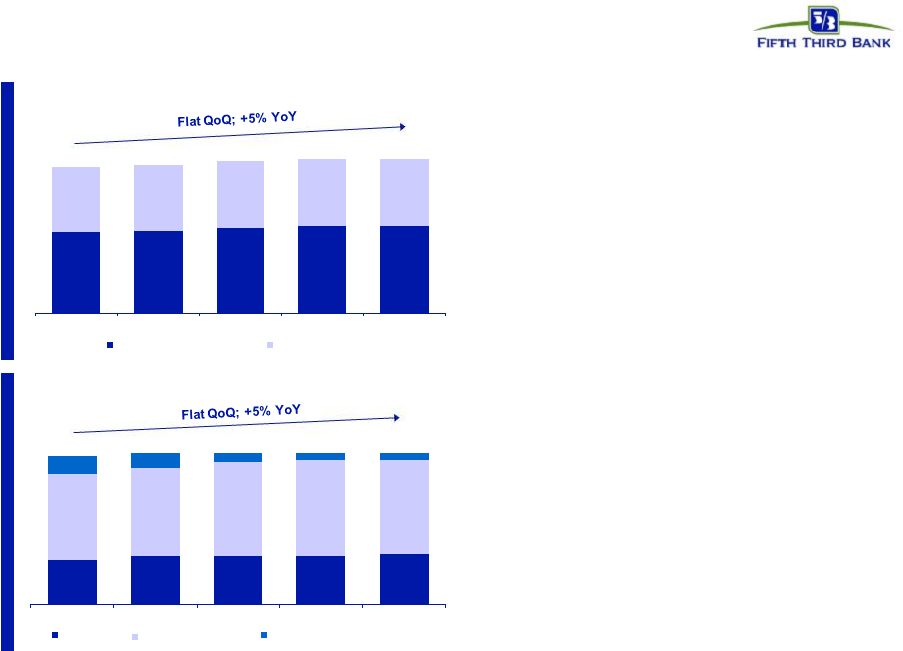
Balance sheet growth mitigates rate environment
Average loan growth ($B)^
Average core deposit growth ($B)
83
79
82
78
^ Excludes loans held-for-sale
Note: Numbers may not sum due to rounding
80
81
82
82
83
82
•
Core deposit to loan ratio of 99% consistent with
3Q11
–
DDAs up 15% year-over-year
–
Consumer average transaction deposits up 5%
year-over-year
–
Commercial average transaction deposits up
10% year-over-year
•
Short-term wholesale borrowings represent only
7% of total funding
•
Growth driven by C&I and residential mortgage
loans; portfolios in run-off mode are of moderate
size
–
Commercial line utilization stable at 32%;
potential source of future growth
•
CRE portfolio continues to run-off, with modest
selective current origination volume
•
Managing auto volumes to ensure appropriate
returns; spread pressure due to competition
•
Branch mortgage refi product has FICO over 780,
LTV ~60% and avg. term ~15 years while yielding
above market rates due to process convenience
44
45
46
47
47
3Q11
4Q11
1Q12
2Q12
3Q12
24
26
26
26
27
45
46
49
50
49
9
8
7
6
6
3Q11
4Q11
1Q12
2Q12
3Q12
Commercial Loans
Consumer Loans
Demand
IBT/Savings/MMDA
Consumer CD/Core foreign
35
35
36
36
36 |
 6
©
Fifth Third Bank | All Rights Reserved
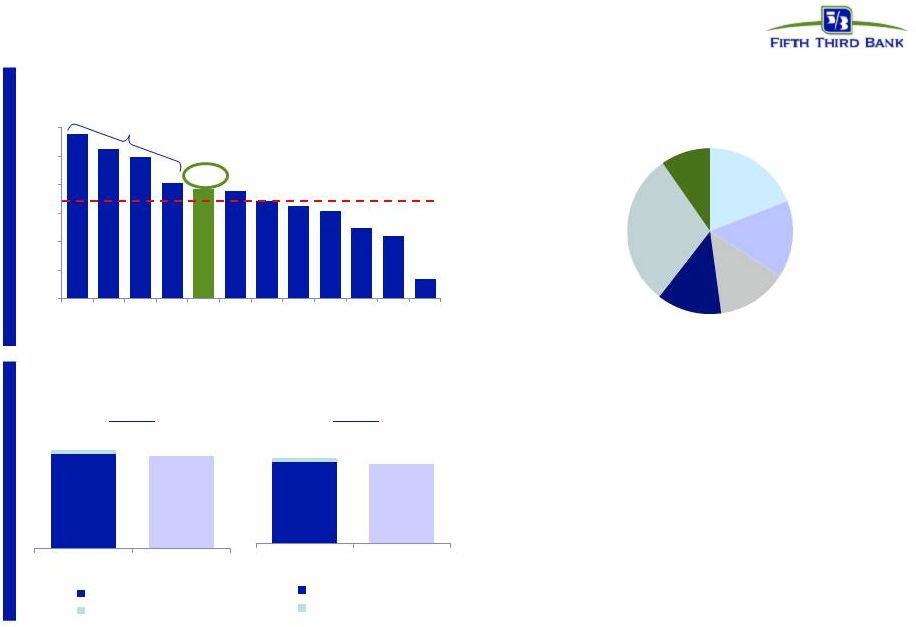
Strong revenue and profit generation
Source: SNL Financial and Company Reports. Peer median includes: BBT, CMA, HBAN,
KEY, MTB, PNC, RF, STI, USB, WFC, and ZION * Excludes securities gains /
losses for FITB and peers. Non-GAAP measure. See Reg. G reconciliation in the Appendix to the presentation.
^ Excludes $16 million negative valuation adjustment on the Vantiv warrant in
3Q12 PPNR* / Average Assets
Peer med. 1.7%
1.9%
Deposit fees
Corporate
banking
Investment
advisors
Other
Mortgage
Card &
Processing
Fee Income Distribution
Significant purchase
accounting benefit
3Q12 returns strong relative to peers
ROAA
ROAE
•
Business mix provides higher than average
diversity among spread and fee revenues (40+%
of revenue)
•
Relatively strong margin and relatively high fee
income contribution drives strong revenue and
PPNR generation profitability despite sluggish
economy
•
Income from ownership in Vantiv $25MM in
3Q12 (full year 2011 quarterly avg ~$14MM,
despite selling ~10% in 1Q12)
0.0%
0.5%
1.0%
1.5%
2.0%
2.5%
3.0%
USB
WFC
MTB
BBT
FITB
PNC
KEY
HBAN
RF
ZION
CMA
STI
19%
15%
14%
13%
30%
10%
10.4%
10.1%
10.9%
FITB
Peer Median
ROAE
Adjusted ROAE^
1.23%
1.20%
1.28%
FITB
Peer Median
ROAA
Adjusted ROAA^ |
 7
©
Fifth Third Bank | All Rights Reserved
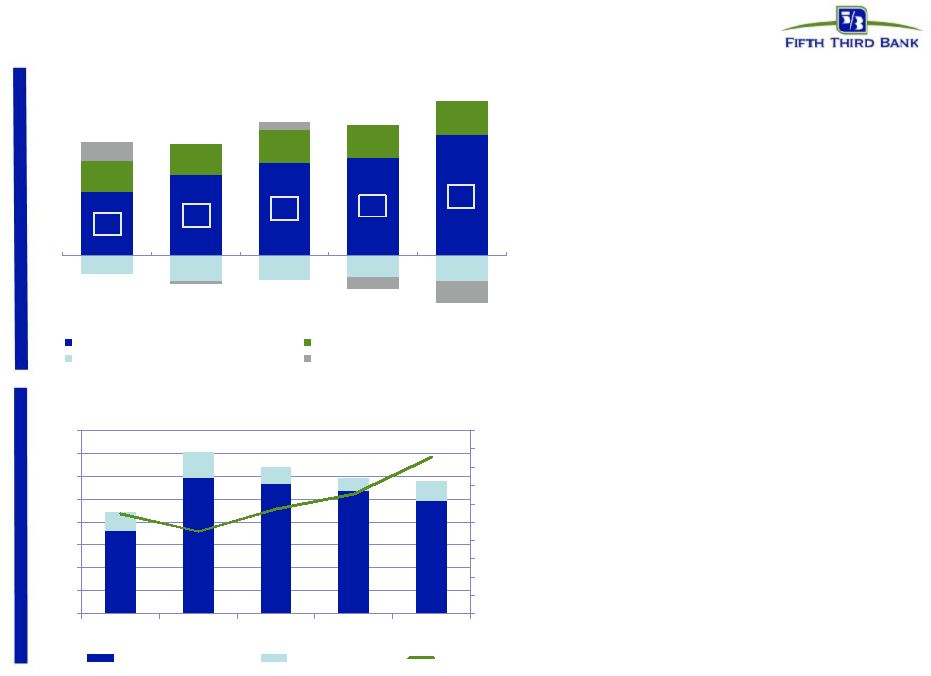
Strong mortgage banking results
•
Record origination fees and gain on
loan sales in 3Q12
•
Highest ranking among all servicers
and peer groups in Fannie Mae’s
2011 STAR
TM
Program for servicing
performance
Looking forward:
•
Stronger originations / deliveries in
4Q12 vs 3Q12
–
Results should remain robust
while rates remain low
•
Gain on sale margins benefitting
from:
–
Strong demand
–
Industry capacity constraints
–
Strong mortgage-backed securities
pricing
•
HARP 2.0 originations expected to
remain similar percentage of total
originations in 4Q12 vs 3Q12
Mortgage originations and gain-on-sale margins*
Mortgage Banking Revenue ($MM)
* Gain-on-sale margin represents margin on loans originated for sale.
119
152
174
183
226
59
58
61
63
62
(34)
(47)
(46)
(41)
(48)
34
(7)
15
(22)
(40)
3Q11
4Q11
1Q12
2Q12
3Q12
Orig fees and gains on loan sales
Gross servicing fees
Servicing rights amortization
MSR valuation adjustments
$178
$200
$183
$156
$204
0.00%
0.50%
1.00%
1.50%
2.00%
2.50%
3.00%
3.50%
4.00%
4.50%
5.00%
$0
$1
$2
$3
$4
$5
$6
$7
$8
3Q11
4Q11
1Q12
2Q12
3Q12
Originations for sale
Originations HFI
Margins*
($B) |
 8
©
Fifth Third Bank | All Rights Reserved
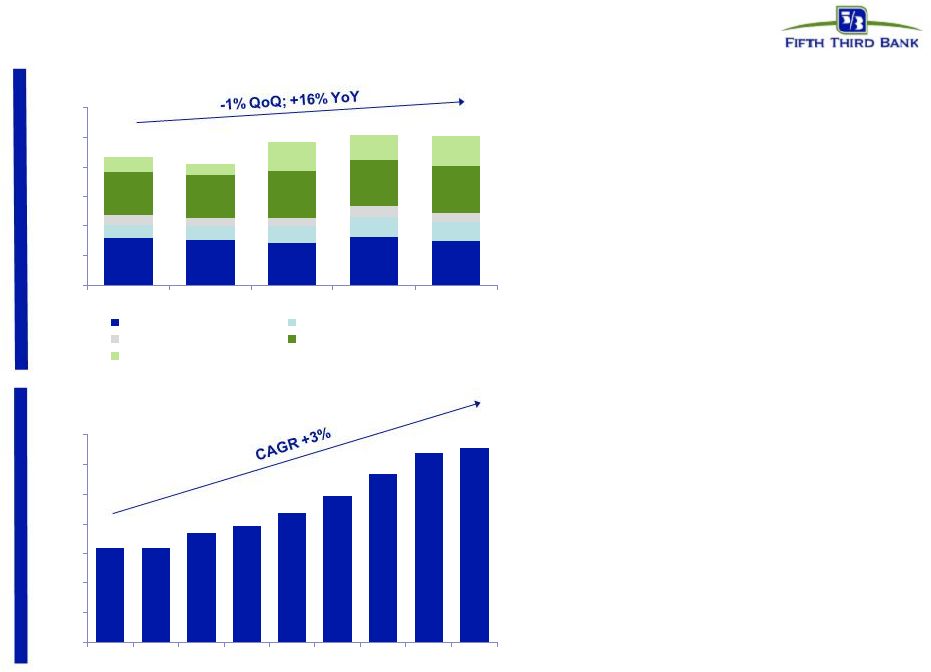
Momentum building in corporate banking
Corporate banking revenue ($MM)
$87
$82
$97
$102
•
YTD corporate banking revenue up
12% versus YTD 2011
•
Continued demand in large
corporate and mid-corporate space
•
C&I loans as a percent of total
commercial loans was 71% at 3Q12
versus peer average of 63%
•
C&I production continues to be
broad based across industries and
sectors
–
Strength in manufacturing and
healthcare industries
–
Launch of Energy Lending
vertical expected to contribute to
future growth in C&I
$101
C&I Portfolio^ ($B)
^ Presented on an average basis; Excluding held-for-sale loans.
32
30
29
33
30
9
9
11
14
13
7
6
6
8
7
28
29
31
30
31
11
7
19
17
20
$0
$20
$40
$60
$80
$100
$120
3Q11
4Q11
1Q12
2Q12
3Q12
Letter of Credit / FX
Institutional Sales
Interest Rate Derivatives
Business Lending Fees
Other Corporate Banking
26.3
26.3
27.3
27.9
28.8
29.9
31.4
32.7
33.1
$20
$22
$24
$26
$28
$30
$32
$34
3Q10
4Q10
1Q11
2Q11
3Q11
4Q11
1Q12
2Q12
3Q12 |
 9
©
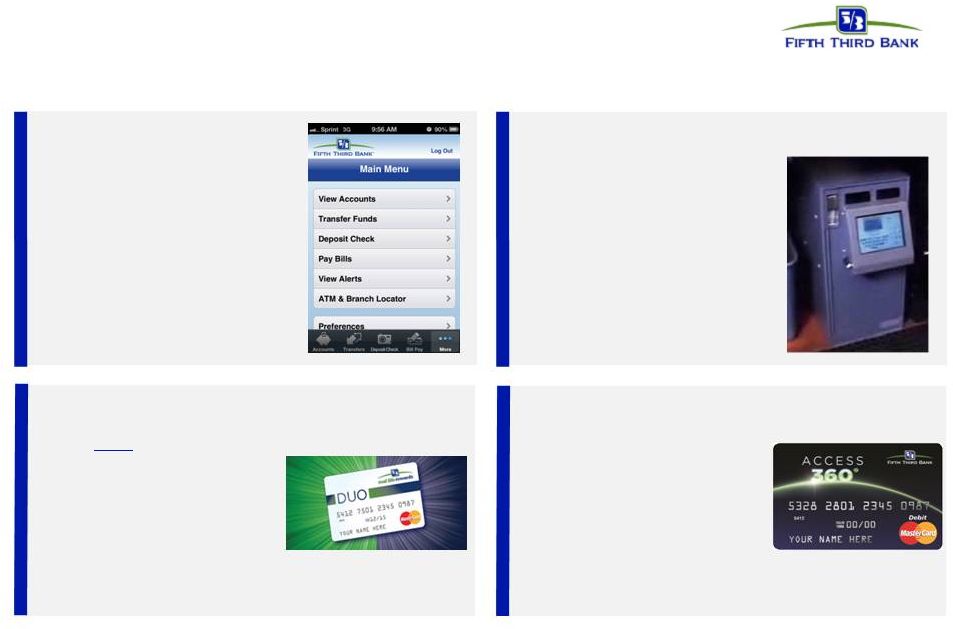
Fifth Third Bank | All Rights Reserved
•
Deposit checks, view
balances, transfer
funds, pay bills, view
alerts, and more
•
App available on
iPhone, Android, and
BlackBerry
•
The only
combined credit
and a debit card
•
Convenience, security,
and financial flexibility
•
New sales consistently
increasing; ~30% of new
consumer card accounts
•
Reloadable Prepaid Card
•
Add money anytime
without incurring a "load
fee“; low monthly fee
•
Use card anywhere Debit
MasterCard is accepted
•
Innovative, end-to-end
remote cash
management solution
•
Maximize cash flow while
boosting control over
cash handling
•
~7,000 RCM locations;
has more than doubled
since 2009
Mobile Experience
Access 360°
DUO Card
Remote Currency Manager
Providing customers with products and services they find valuable
New products developed by listening to the voice of the customer
and a
deliberate approach to mitigate regulatory and legislative impacts
Customer oriented solutions
•
Withdraw cash at any Fifth Third ATM or
Banking Center free of charge
® |
 10
©
Fifth Third Bank | All Rights Reserved
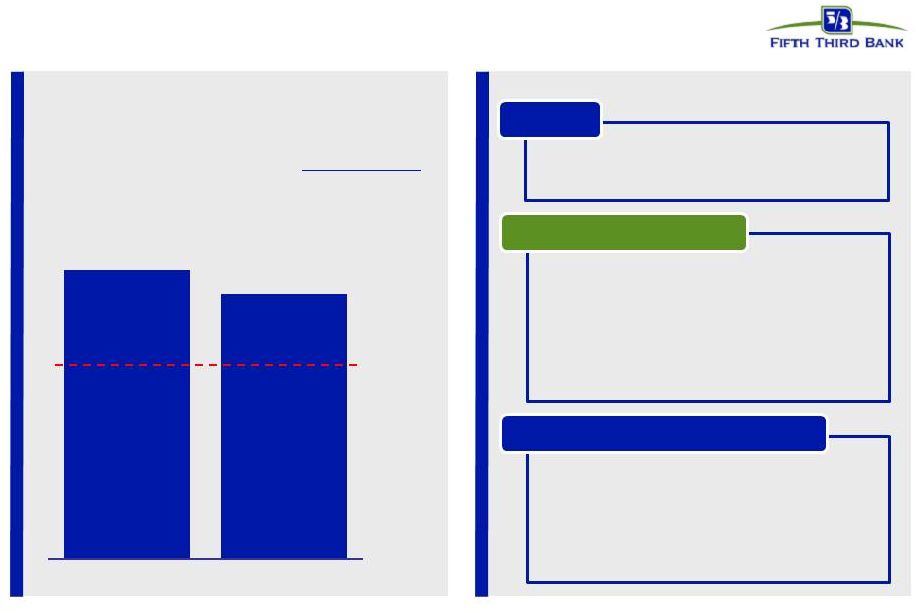
Simplifying deposit structure:
Aligning value to our customers with value to Fifth Third
Value to our customers
Value to Fifth Third
1
2
3
1
2
3
Accounts straightforward and easy to
use
Simplified service charges with
elimination of certain fees
Greater benefits, including competitive
rates and identity theft protection, for
total relationship value
Simplifies relationship building
for our sales force by reducing
complexity across checking and
savings products
Payment and deposit fee results
and balances expected to
contribute to revenue growth
Changes are compatible with
Fifth Third’s strategic direction
and new regulatory landscape
We are committed to providing valuable products
and services at a fair price
–
25 checking products simplified to
5 segment-focused products
–
17 savings products simplified to 3
–
Elimination of daily overdraft fees
on continuing customer overdraft
positions
–
Broader and deeper banking
relationships with Fifth Third earn
better rates and lower costs |
 11
©
Fifth Third Bank | All Rights Reserved
Disciplined expense management
2012 expense trend ($MM)
* Non-recurring items described on page 19 in the appendix to this
presentation. Reported expense
Increasing expense
Non-recurring items*:
Adjusted expense
Decreasing expense
$973
$937
$1,006
$23
$17
$5
($28)
($2)
($50)
$968
$952
$961
Managing expenses carefully in response to revenue
environment; continuous process of expense evaluation
Efficiency ratio trend
$890
$910
$930
$950
$970
$990
$1,010
1Q12
2Q12
3Q12
4Q12
68%
58%
59%
64%
65%
62%
62%
61%
4Q11
1Q12
2Q12
3Q12
Efficiency Ratio
Adjusted*
•
Expect similar adjusted efficiency ratio in
4Q12; target mid-50% in normalized
environment (with higher interest rate
environment)
–
Current impact of credit costs on
revenue and expenses; impact of
regulatory reforms (e.g., debit
interchange) not fully mitigated
–
Reflects below-capacity balance sheet
and lower revenue than we expect and
can support longer term |
 12
©
Fifth Third Bank | All Rights Reserved
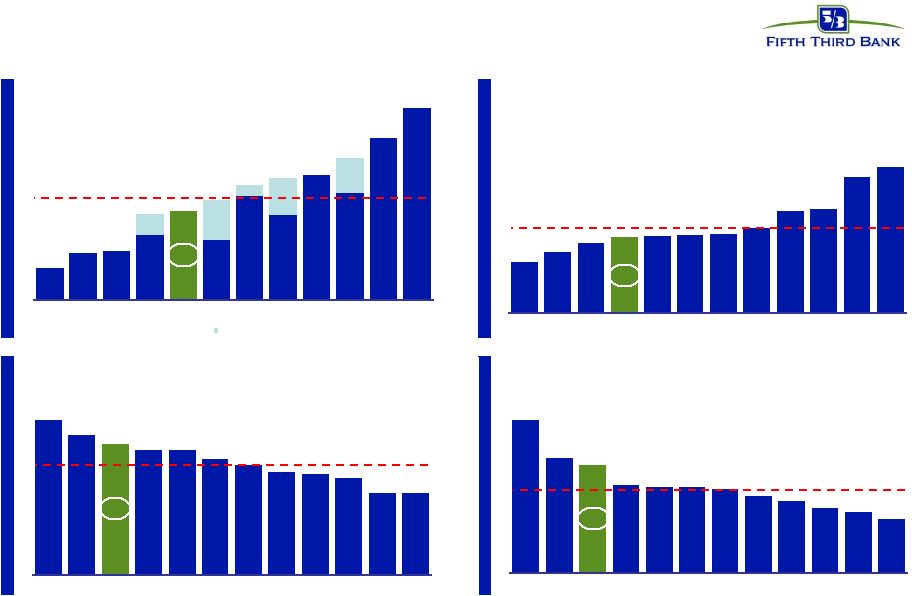
Credit trends continue to improve
with strong reserve coverage levels
Source: SNL Financial and Company Reports. Data as of 3Q12. HFI NPLs exclude loans
held-for-sale and also exclude covered assets for BBT, USB, and ZION
* HBAN, KEY, PNC, USB, WFC include the implementation of newly issued 3Q12 OCC
guidance which requires write-down of performing consumer loans restructured in bankruptcy to
collateral value. The light blue section indicates the additional charge-offs
due to this guidance. Continued
decline
in
problem
assets
and
corresponding
decline
in
charge-offs
combined
with strong reserves on an absolute and relative basis
NPLs / Loans
Loan loss reserves / Loans
Net charge-off ratio
Reserves / NPLs
0.3%
0.4%
0.4%
0.5%
0.8%
0.5%
0.9%
0.7%
1.1%
0.9%
1.4%
1.6%
MTB
CMA
ZION
PNC*
FITB
KEY*
USB*
HBAN*
BBT
WFC*
RF
STI
NCO
OCC Guidance
0.7%
1.2%
1.0%
1.0%
0.9%
Peer average: 0.9%
2.7%
2.5%
2.3%
2.2%
2.2%
2.1%
2.0%
1.8%
1.8%
1.7%
1.5%
1.5%
RF
ZION
FITB
WFC
PNC
USB
HBAN
STI
BBT
KEY
CMA
MTB
Peer average: 2.0%
0.9%
1.1%
1.3%
1.4%
1.4%
1.4%
1.4%
1.6%
1.9%
1.9%
2.5%
2.7%
USB
HBAN
KEY
FITB
BBT
STI
MTB
CMA
PNC
ZION
RF
WFC
Peer average: 1.6%
234%
177%
167%
136%
133%
132%
129%
118%
109%
100%
93%
83%
USB
HBAN
FITB
KEY
BBT
ZION
STI
PNC
RF
MTB
CMA
WFC
Peer average: 131% |
 13
©
Fifth Third Bank | All Rights Reserved
Capital management philosophy
* Subject to Board of Directors and regulatory approval
Organic growth opportunities
•
Support growth of core banking franchise
•
Continued loan growth despite sluggish
economy
Strategic opportunities
*
•
Prudently evaluate franchise including
increasing density in core markets via
disciplined acquisitions or selective de
novos
•
Expect future acquisition opportunities
although activity remains muted in near-term
•
Attain top 3 market position in 65% of
markets or more longer term
Dividends*
•
Move towards levels more consistent with
Fed’s near-term payout ratio guidance of
30%
•
Strong levels of profitability would support
higher dividend than current level
•
Quarterly dividend increased to $0.10 in
3Q12
Repurchases / Redemptions
*
•
Common share repurchases to limit and
manage growth of excess capital levels
•
Redeemed $1.4bn in TruPS in 3Q12
Expect capital philosophy to remain consistent
pending evaluation of results in 2013 CCAR process
Capital Deployment
Capital Return
–
Manage capital in light of regulatory
environment, other alternatives,
maintenance of desired / required buffers,
stock price
–
$600MM of potential repurchases through
1Q13 ($350MM ASR completed in October;
$125MM ASR entered into in November) |
 14
©
Fifth Third Bank | All Rights Reserved
Capital position remains strong
* The pro forma Tier I common equity ratio is management’s estimate based upon
its current interpretation of the three draft Federal Register notices proposing enhancements to regulatory
capital requirements published in June 2012. The actual impact to the
Bancorp’s Tier I common equity ratio may change significantly due to further clarification of the agencies proposals or
revisions to the agencies final rules, which remain subject to public
comment. Proposed new U.S. capital standards would have manageable impact, if
adopted Primary Basel III Adjustments*
Proposed
fully
phased in
buffered
minimum
of 7.0%
Basel III Impacts
•
3Q12 Tier 1 common equity ratio of
9.67% under Basel I
Current
•
Capital impact increase primarily
from inclusion of AOCI
•
RWA increase primarily from 1-4
family senior and junior lien
residential mortgages,
commitments under one year
Estimated NPR Impact
•
Pro forma 3Q12 Tier 1 common
equity ratio of ~9%* under Basel III
•
Does not include the effect of any
mitigating actions Fifth Third may
take
Pro forma Tier 1 Common Equity
NPR Capital Impact
~45 bps +/-
NPR RWA Impact
~(110 bps) +/-
Total Tier 1 Change
Tier 1 Common Equity
9.67%
Basel I
Pro forma Basel III
~9%*
~(65 bps) +/- |
 15
©
Fifth Third Bank | All Rights Reserved
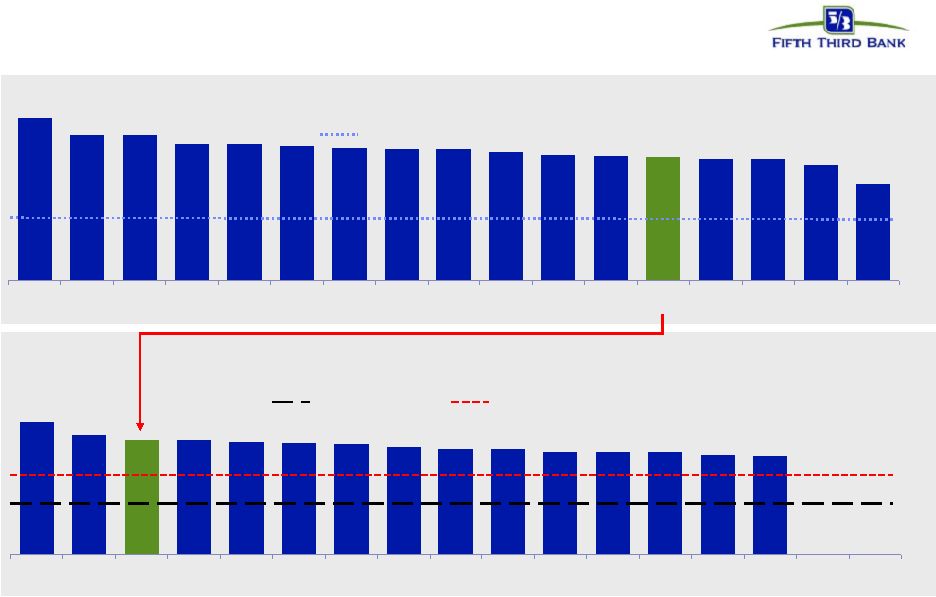
Fifth Third’s balance sheet and business model
relatively advantaged under new capital standards
Fifth Third’s capital position already well in excess of any established
standards, likely standards, and most peers 5.0%
7.0%
4.5%
Unofficial CCAR supervisory reference minimum
3Q12 Pro forma Tier 1 common / RWA
U.S. proposed Basel III**
3Q12 Tier 1 common / RWA
Basel I
2019 Basel III buffered minimum
2015 Basel III minimum
Not disclosed
High
7%
range
12.7%
11.4%
11.4%
10.7%
10.7%
10.5%
10.4%
10.3%
10.3%
10.1%
9.8%
9.8%
9.7%
9.5%
9.5%
9.0%
7.5%
C
KEY
BAC
FHN
COF
RF
JPM
CMA
HBAN
WFC
STI
ZION
FITB
BBT
PNC
USB
MTB
10.4%
9.4%
9.0%
8.8%
8.7%
8.6%
8.4%
8.2%
8.2%
8.0%
8.0%
8.0%
7.8%
KEY
CMA
FITB
BAC
HBAN*
RF
C
JPM
FHN
USB
BBT
WFC
STI
ZION*
COF
MTB
PNC
~9%
Source: SNL Financial and company reports (financial data as of 3Q12).
* Data sourced form SNL Financial 2Q12. In 2Q12, HBAN stated Basel III Tier 1 common ratio would be
negatively impacted by approximately 150 basis points. ** Note: Fifth Third’s pro forma
Tier I common equity ratio is management’s estimate based upon its current interpretation of the three draft Federal Register notices proposing
enhancements to regulatory capital requirements published in June 2012. The actual impact to the
Bancorp’s Tier I common equity ratio may change significantly due to further clarification
of the agencies proposals or revisions to the agencies final rules, which remain subject to public
comment. Not adjusted for potential mitigation efforts. |
 16
©
Fifth Third Bank | All Rights Reserved
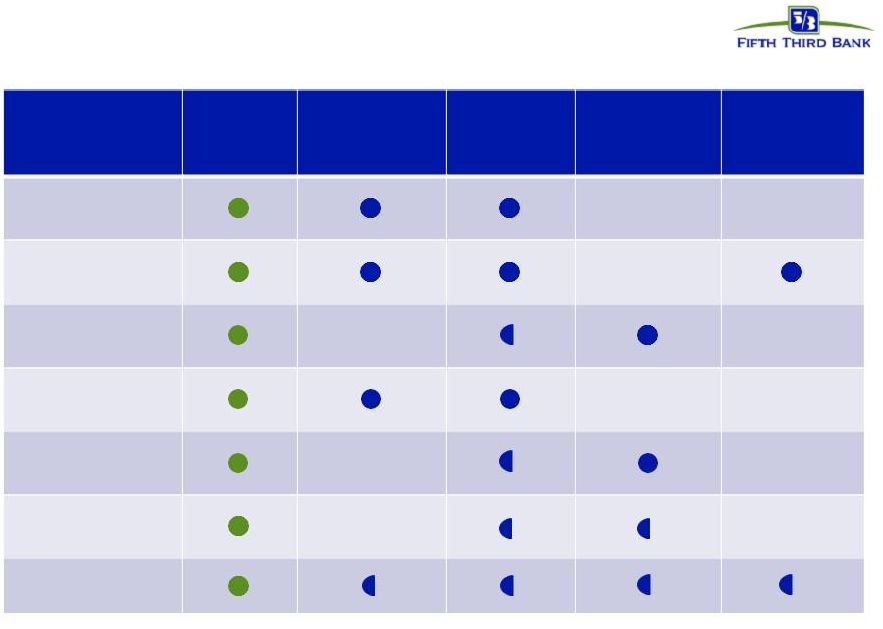
Fifth Third: A differentiated business model
Competitively well-positioned in new landscape
FITB
“Trillionaire”
Banks
Regional
Banks
Community
Banks
Investment
Banks
Diverse businesses
Efficiencies
of scale
market focus
Multi-
channel
delivery
Customer-
centric
model
Moderate risk
profile
Strong
profitability
and well-
capitalized
Local |
 17
©
Fifth Third Bank | All Rights Reserved
Cautionary statement
This report contains statements that we believe are “forward-looking statements” within
the meaning of Section 27A of the Securities Act of 1933, as amended, and Rule 175 promulgated
thereunder, and Section 21E of the Securities Exchange Act of 1934, as amended, and Rule
3b-6 promulgated thereunder. These statements relate to our financial condition, results of operations, plans, objectives, future
performance or business. They usually can be identified by the use of forward-looking language
such as “will likely result,” “may,” “are expected
to,”
“is
anticipated,”
“estimate,”
“forecast,”
“projected,”
“intends
to,”
or
may
include
other
similar
words
or
phrases
such
as
“believes,” “plans,” “trend,” “objective,”
“continue,” “remain,” or similar expressions, or future or conditional verbs such as “will,” “would,”
“should,” “could,” “might,” “can,” or similar verbs. You
should not place undue reliance on these statements, as they are subject to risks and
uncertainties, including but not limited to the risk factors set forth in our most recent Annual
Report on Form 10-K. When considering these forward-looking statements, you should keep
in mind these risks and uncertainties, as well as any cautionary statements we may make.
Moreover, you should treat these statements as speaking only as of the date they are made and based
only on information then actually known to us.
There are a number of important factors that could cause future results to differ materially from
historical performance and these forward- looking statements. Factors that might cause such
a difference include, but are not limited to: (1) general economic conditions and weakening in
the economy, specifically the real estate market, either nationally or in the states in which Fifth Third, one or more acquired
entities and/or the combined company do business, are less favorable than expected; (2) deteriorating
credit quality; (3) political developments, wars or other hostilities may disrupt or increase
volatility in securities markets or other economic conditions; (4) changes in the
interest
rate
environment
reduce
interest
margins;
(5)
prepayment
speeds,
loan
origination
and
sale
volumes,
charge-offs
and
loan
loss
provisions;
(6)
Fifth
Third’s
ability
to
maintain
required
capital
levels
and
adequate
sources
of
funding
and
liquidity;
(7)
maintaining
capital requirements may limit Fifth Third’s operations and potential growth; (8) changes and
trends in capital markets; (9) problems encountered by larger or similar financial institutions
may adversely affect the banking industry and/or Fifth Third; (10) competitive pressures
among
depository
institutions
increase
significantly;
(11)
effects
of
critical
accounting
policies
and
judgments;
(12)
changes
in
accounting policies or procedures as may be required by the Financial Accounting Standards Board
(FASB) or other regulatory agencies; (13) legislative or regulatory changes or actions, or
significant litigation, adversely affect Fifth Third, one or more acquired entities and/or
the combined company or the businesses in which Fifth Third, one or more acquired entities
and/or the combined company are engaged, including the Dodd-Frank Wall Street Reform and
Consumer Protection Act; (14) ability to maintain favorable ratings from rating agencies; (15)
fluctuation of Fifth Third’s stock price; (16) ability to attract and retain key personnel; (17) ability to receive dividends from its
subsidiaries;
(18)
potentially
dilutive
effect
of
future
acquisitions
on
current
shareholders’
ownership
of
Fifth
Third;
(19)
effects
of
accounting or financial results of one or more acquired entities; (20) difficulties from the
separation of or the results of operations of Vantiv, LLC from Fifth Third; (21) loss of income
from any sale or potential sale of businesses that could have an adverse effect on Fifth Third’s
earnings and future growth; (22) ability to secure confidential information through the use of
computer systems and telecommunications networks; and (23) the impact of reputational risk
created by these developments on such matters as business generation and retention, funding and
liquidity. You
should
refer
to
our
periodic
and
current
reports
filed
with
the
Securities
and
Exchange
Commission,
or
“SEC,”
for
further
information
on other factors, which could cause actual results to be significantly different from those expressed
or implied by these forward-looking statements. |
 18
©
Fifth Third Bank | All Rights Reserved
Appendix |
 19
©
Fifth Third Bank | All Rights Reserved
637
531
582
596
593
25
33
14
17
14
45
44
34
40
59
$0
$100
$200
$300
$400
$500
$600
$700
$800
3Q11
4Q11
1Q12
2Q12
3Q12
Noninterest Expense Credit Items
Fee Income Credit Items
Adjusted
PPNR
$617 $473
$694 $636 $568
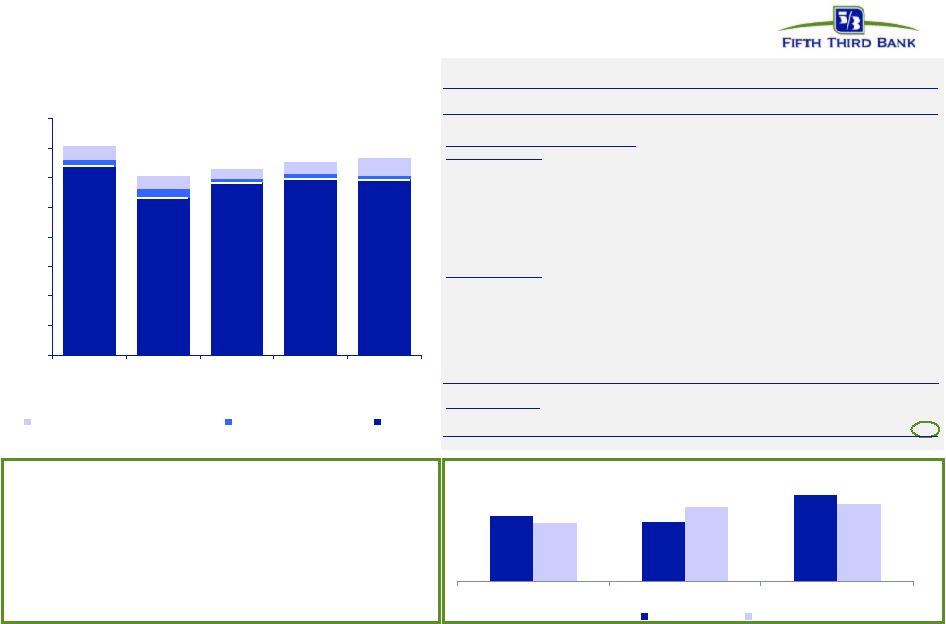
Pre-tax pre-provision earnings*
PPNR trend
•
PPNR of $568MM down 11% from 2Q12 levels and
8% from prior year
•
Adjusted PPNR of $593MM, including positive
adjustments totaling $25MM, down 1% sequentially
and 7% year-over-year
—
Including 3Q12 mortgage repurchase reserve
build, PPNR of $617MM
PPNR reconciliation
Efficiency ratio
60%
59%
64%
59%
62%
62%
#
3Q11
2Q12
3Q12
Efficiency Ratio
Adjusted
* Non-GAAP measure. See Reg. G reconciliation on pages 21 and 22.
** There are limitations on the usefulness of credit-adjusted PPNR, including the significant
degree to which changes in credit and fair value are integral, recurring components of the
Bancorp’s core operations as a financial institution. This measure has been included herein to
facilitate a greater understanding of the Bancorp’s financial condition. ^ Prior quarters
include similar adjustments. ^^ See page 20 for detailed breakout of credit-related
items. # 61% also excluding $22MM 3Q12 mortgage repurchase reserve build
($ in millions)
3Q11
4Q11
1Q12
2Q12
3Q12
Income before income taxes (U.S. GAAP) (a)
$530
$418
$603
$565
$503
Add: Provision expense (U.S. GAAP) (b)
87
55
91
71
65
PPNR (a) + (b)
$617
$473
$694
$636
$568
Adjustments to remove (benefit) / detriment^:
In noninterest income:
Vantiv IPO gain
-
-
(115)
-
-
Vantiv debt refinancing
-
-
34
-
-
Valuation of 2009 Visa total return swap
17
54
19
11
1
Vantiv warrants & puts
(3)
(10)
(46)
(56)
16
Valuation of bank premises moved to HFS
-
-
-
17
-
Litigation reserve additions in revenue
-
-
-
6
-
Sale of certain Fifth Third funds
-
-
-
-
(13)
Securities (gains) / losses
(26)
(5)
(9)
(3)
(2)
In noninterest expense:
Debt extinguishment (gains) / losses
-
-
9
-
26
Non-income tax related assessment resolution
-
-
(23)
-
-
Sale of certain Fifth Third funds
-
-
-
-
2
Termination of certain borrowing & hedging transactions
28
-
-
-
-
Severance expense
-
-
6
-
-
FDIC insurance expense
-
-
-
(9)
-
Gain on sale of affordable housing
-
-
-
(8)
(5)
Litigation reserve additions in expense
4
19
13
2
-
Adjusted PPNR
$637
$531
$582
$596
$593
Credit-related items^^:
In noninterest income
25
33
14
17
14
In noninterest expense
45
44
34
40
59
Credit-adjusted PPNR**
$707
$608
$630
$653
$666 |
 20
©
Fifth Third Bank | All Rights Reserved
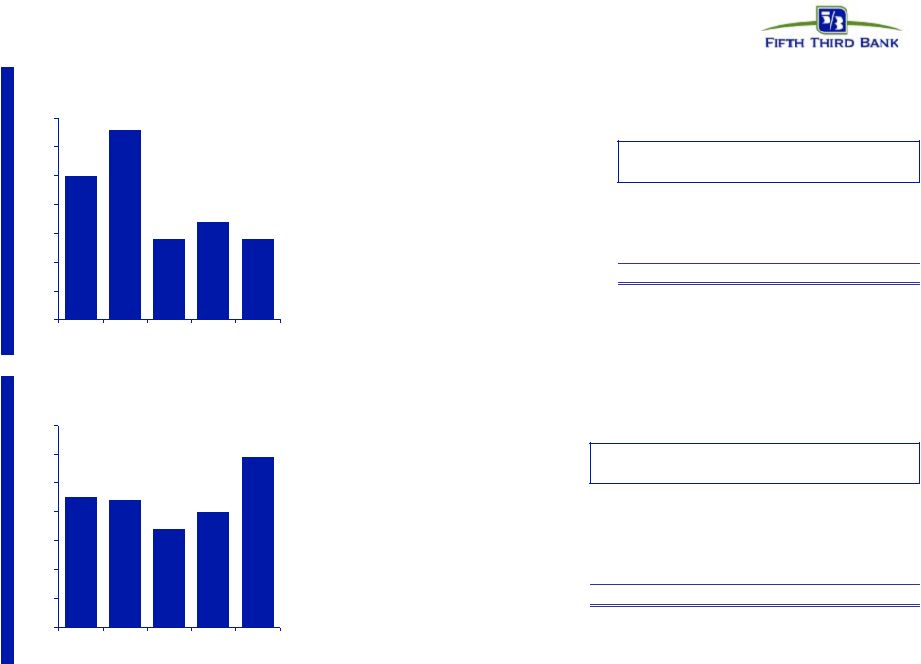
Credit-related costs
In noninterest income ($MM)
In noninterest expense ($MM)
Note: Numbers may not sum due to rounding
25
33
14
17
14
$0
$5
$10
$15
$20
$25
$30
$35
3Q11
4Q11
1Q12
2Q12
3Q12
45
44
34
40
59
$0
$10
$20
$30
$40
$50
$60
$70
3Q11
4Q11
1Q12
2Q12
3Q12
Actual
($ in millions)
3Q11
4Q11
1Q12
2Q12
3Q12
Mortgage
repurchase expense
$19
$18
$15
$18
$36
Provision for unfunded commitments
(10)
(6)
(2)
(1)
(2)
Derivative valuation adjustments
4
(5)
(4)
(0)
(2)
OREO expense
7
8
5
5
6
Other problem asset related expenses
25
28
19
19
21
Total credit-related operating expenses
$45
$44
$34
$40
$59
Actual
($ in millions)
3Q11
4Q11
1Q12
2Q12
3Q12
Gain / (loss) on sale of loans
$3
$9
$5
$8
$2
Commercial loans HFS FV adjustment
(6)
(18)
(1)
(5)
(3)
Gain / (loss) on sale of OREO properties
(21)
(22)
(17)
(19)
(11)
Mortgage repurchase costs
(2)
(1)
(2)
(2)
(2)
Total credit-related revenue impact
($25)
($33)
($14)
($17)
($14) |
 21
©
Fifth Third Bank | All Rights Reserved
Regulation G Non-GAAP reconciliation
Fifth Third Bancorp and Subsidiaries
Regulation G Non-GAAP Reconcilation
$ and shares in millions
(unaudited)
September
June
March
December
September
2012
2012
2012
2011
2011
Income before income taxes (U.S. GAAP)
$503
$565
$603
$418
$530
Add:
Provision expense (U.S. GAAP)
65
71
91
55
87
Pre-provision net revenue (a)
568
636
694
473
617
Pre-provision net revenue (annualized) (b)
2,260
2,530
2,791
1,877
2,448
Net income available to common shareholders (U.S. GAAP)
354
376
421
305
373
Add:
Intangible amortization, net of tax
2
2
3
3
3
Tangible net income available to common shareholders
356
378
424
308
376
Tangible net income available to common shareholders (annualized) (c)
1,416
1,520
1,705
1,222
1,492
Average Bancorp shareholders' equity (U.S. GAAP)
13,887
13,628
13,366
13,147
12,841
Less:
Average preferred stock
(398)
(398)
(398)
(398)
(398)
Average goodwill
(2,417)
(2,417)
(2,417)
(2,417)
(2,417)
Average intangible assets
(31)
(34)
(38)
(42)
(47)
Average tangible common equity (d)
11,041
10,779
10,513
10,290
9,979
Total Bancorp shareholders' equity (U.S. GAAP)
13,718
13,773
13,560
13,201
13,029
Less:
Preferred stock
(398)
(398)
(398)
(398)
(398)
Goodwill
(2,417)
(2,417)
(2,417)
(2,417)
(2,417)
Intangible assets
(30)
(33)
(36)
(40)
(45)
Tangible common equity, including unrealized gains / losses (e)
10,873
10,925
10,709
10,346
10,169
Less: Accumulated other comprehensive income / loss
(468)
(454)
(468)
(470)
(542)
Tangible common equity, excluding unrealized gains / losses (f)
10,405
10,471
10,241
9,876
9,627
Total assets (U.S. GAAP)
117,483
117,543
116,747
116,967
114,905
Less:
Goodwill
(2,417)
(2,417)
(2,417)
(2,417)
(2,417)
Intangible assets
(30)
(33)
(36)
(40)
(45)
Tangible assets, including unrealized gains / losses (g)
115,036
115,093
114,294
114,510
112,443
Less: Accumulated other comprehensive income / loss, before tax
(720)
(698)
(720)
(723)
(834)
Tangible assets, excluding unrealized gains / losses (h)
114,316
114,395
113,574
113,787
111,609
Common shares outstanding (i)
897
919
920
920
920
Securities gains, net
2
Securities gains, net (annualized) (j)
8
Average assets (k)
118
Ratios:
Return on average tangible common equity (c) / (d)
12.8%
14.1%
16.2%
11.9%
15.0%
Tangible common equity (excluding unrealized gains/losses) (f) /
(h)
9.10%
9.15%
9.02%
8.68%
8.63%
Tangible common equity (including unrealized gains/losses) (e) /
(g)
9.45%
9.49%
9.37%
9.04%
9.04%
Tangible book value per share (e) / (i)
12.12
11.89
11.64
11.25
11.05
Pre-provision net revenue / Average assets (b-j) / (k)
1.92%
For the Three Months Ended |
 22
©
Fifth Third Bank | All Rights Reserved
Regulation G Non-GAAP reconciliation
Fifth Third Bancorp and Subsidiaries
Regulation G Non-GAAP Reconcilation
$ and shares in millions
(unaudited)
September
June
March
December
September
2012
2012
2012
2011
2011
Total Bancorp shareholders' equity (U.S. GAAP)
$13,718
$13,773
$13,560
$13,201
$13,029
Goodwill and certain other intangibles
(2,504)
(2,512)
(2,518)
(2,514)
(2,514)
Unrealized gains
(468)
(454)
(468)
(470)
(542)
Qualifying trust preferred securities
810
2,248
2,248
2,248
2,273
Other
38
38
38
38
20
Tier I capital
11,594
13,093
12,860
12,503
12,266
Less:
Preferred stock
(398)
(398)
(398)
(398)
(398)
Qualifying trust preferred securities
(810)
(2,248)
(2,248)
(2,248)
(2,273)
Qualifying noncontrolling interest in consolidated subsidiaries
(51)
(51)
(50)
(50)
(30)
Tier I common equity (a)
10,335
10,396
10,164
9,807
9,565
Risk-weighted assets, determined in accordance with
prescribed regulatory requirements¹
(b) 106,858
106,398
105,412
104,945
102,562
Ratio:
Tier I common equity (a) / (b)
9.67%
9.77%
9.64%
9.35%
9.33%
Basel III - Estimated Tier 1 common equity ratio
September
2012
Tier 1 common equity (Basel I)
$10,333
Add:
Adjustment related to AOCI for AFS securities
507
Estimated Tier 1 common equity under Basel III
rules² 10,840
Estimated risk-weighted assets under Basel III
rules³ 120,308
Estimated Tier 1 common equity ratio under Basel III rules
9.01%
(1)
(2)
(3)
For the Three Months Ended
Tier I common equity under Basel III includes the unrealized gains and losses for AFS securities. Other
adjustments include mortgage servicing rights and deferred tax assets subject to threshold
limitations and deferred tax liabilities related to intangible assets.
Key differences under Basel III in the calculation of risk-weighted assets compared to Basel I
include: (1) risk weighting for commitments under 1 year; (2) higher risk weighting for exposures to
residential mortgage, home equity, past due loans, foreign banks and certain commercial real estate;
(3) higher risk weighting for mortgage servicing rights and deferred tax assets that are under
certain thresholds as a percent of Tier I capital; (4)incremental capital requirements for stress VaR;
and (5) derivatives are differentiated between exchange clearing and over-the-counter and the
50% risk-weight cap is removed. The estimated Basel III risk-weighted assets are based upon the
Bancorp’s interpretations of the three draft Federal Register notices proposing enhancements to
the regulatory capital requirements that were published in June of 2012. These amounts are preliminary
and subject to change depending on the adoption of final Basel III capital rules by the
Regulatory Agencies.
For the Three
Months Ended
Under the banking agencies’ risk-based capital guidelines, assets and credit equivalent
amounts of derivatives and off-balance sheet exposures are assigned to broad risk categories. The
aggregate dollar amount in each risk category is multiplied by the associated risk weight of the
category. The resulting weighted values are added together, along with the measure for market risk,
resulting in the Bancorp’s total risk-weighted assets. |