Attached files
| file | filename |
|---|---|
| 8-K - FORM 8-K - US BANCORP \DE\ | d448255d8k.htm |
Exhibit 99.1

| Goldman Sachs U.S. Financial Services Conference 2012 Richard K. Davis Chairman, President and CEO December 4, 2012 |
| The following information appears in accordance with the Private Securities Litigation Reform Act of 1995: This presentation contains forward-looking statements about U.S. Bancorp. Statements that are not historical or current facts, including statements about beliefs and expectations, are forward-looking statements and are based on the information available to, and assumptions and estimates made by, management as of the date made. These forward-looking statements cover, among other things, anticipated future revenue and expenses and the future plans and prospects of U.S. Bancorp. Forward-looking statements involve inherent risks and uncertainties, and important factors could cause actual results to differ materially from those anticipated. Global and domestic economies could fail to recover from the recent economic downturn or could experience another severe contraction, which could adversely affect U.S. Bancorp's revenues and the values of its assets and liabilities. Global financial markets could experience a recurrence of significant turbulence, which could reduce the availability of funding to certain financial institutions and lead to a tightening of credit, a reduction of business activity, and increased market volatility. Continued stress in the commercial real estate markets, as well as a delay or failure of recovery in the residential real estate markets, could cause additional credit losses and deterioration in asset values. In addition, U.S. Bancorp's business and financial performance is likely to be negatively impacted by effects of recently enacted and future legislation and regulation. U.S. Bancorp's results could also be adversely affected by continued deterioration in general business and economic conditions; changes in interest rates; deterioration in the credit quality of its loan portfolios or in the value of the collateral securing those loans; deterioration in the value of securities held in its investment securities portfolio; legal and regulatory developments; increased competition from both banks and non-banks; changes in customer behavior and preferences; effects of mergers and acquisitions and related integration; effects of critical accounting policies and judgments; and management's ability to effectively manage credit risk, residual value risk, market risk, operational risk, interest rate risk and liquidity risk. For discussion of these and other risks that may cause actual results to differ from expectations, refer to U.S. Bancorp's Annual Report on Form 10-K for the year ended December 31, 2011, on file with the Securities and Exchange Commission, including the sections entitled "Risk Factors" and "Corporate Risk Profile" contained in Exhibit 13, and all subsequent filings with the Securities and Exchange Commission under Sections 13(a), 13(c), 14 or 15(d) of the Securities Exchange Act of 1934. Forward-looking statements speak only as of the date they are made, and U.S. Bancorp undertakes no obligation to update them in light of new information or future events.This presentation includes non-GAAP financial measures to describe U.S. Bancorp's performance. The reconciliations of those measures to GAAP measures are provided within or in the appendix of the presentation. These disclosures should not be viewed as a substitute for operating results determined in accordance with GAAP, nor are they necessarily comparable to non-GAAP performance measures that may be presented by other companies. Forward-looking Statements and Additional Information |
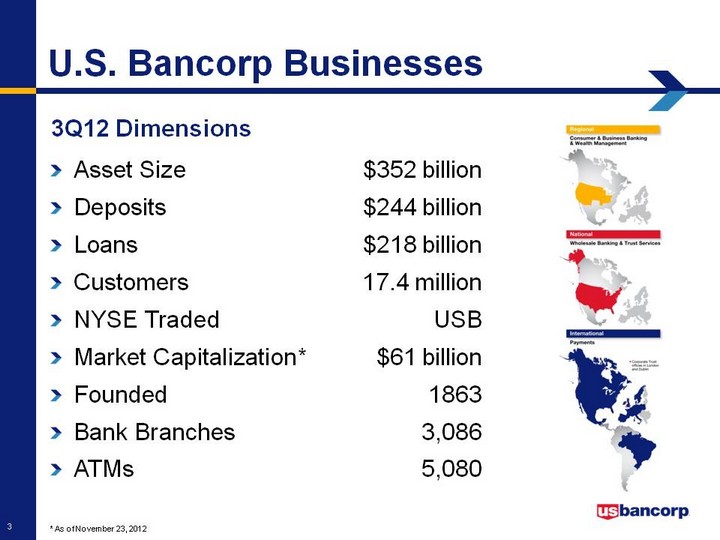
| 3Q12 Dimensions * As of November 23, 2012 U.S. Bancorp Businesses Asset Size $352 billionDeposits $244 billionLoans $218 billionCustomers 17.4 millionNYSE Traded USBMarket Capitalization* $61 billionFounded 1863Bank Branches 3,086ATMs 5,080 |
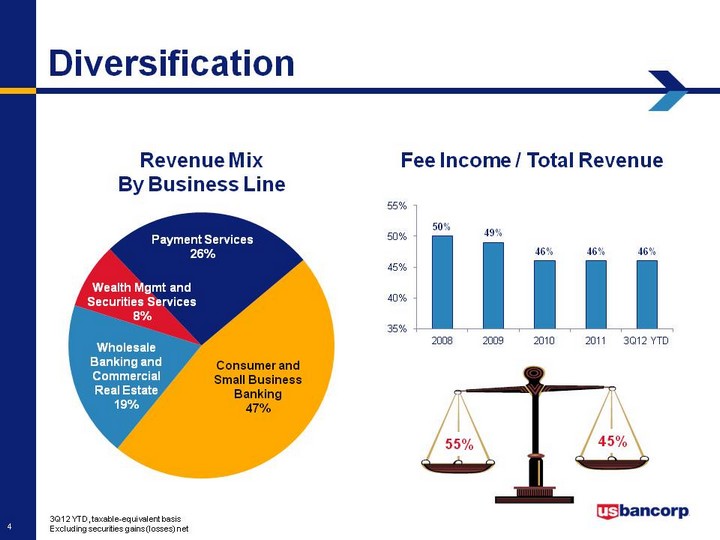
| 3Q12 YTD, taxable-equivalent basisExcluding securities gains (losses) net Revenue MixBy Business Line Fee Income / Total Revenue Diversification (CHART) Consumer andSmall Business Banking47% Payment Services26% Wealth Mgmt and Securities Services8% Wholesale Banking and Commercial Real Estate19% 55% 45% (CHART) |

| * Gain on merchant processing agreement settlement$ in millions, taxable-equivalent basis (CHART) (CHART) Prior 5 YearsYear-Over-Year Growth 2.3% 4.4% 13.6% 8.9% 5.3% Prior 5 QuartersYear-Over-Year Growth 4.5% 8.1% 9.1% 8.1% 8.0% Revenue Growth USB RecordRevenue 2011 USB RecordRevenue 3Q12 |

| $ in billions (CHART) (CHART) 6% 12% 8% 5% 17% 6% 11% 11% 18% 1% 7% 7% 20% 5% 11% 13% 5% 21% 15% Loans Deposits Prior 5 YearsEnding BalancesYear-Over-Year Growth Prior 5 QuartersAverage BalancesYear-Over-Year Growth Loan and Deposit Growth 7% |
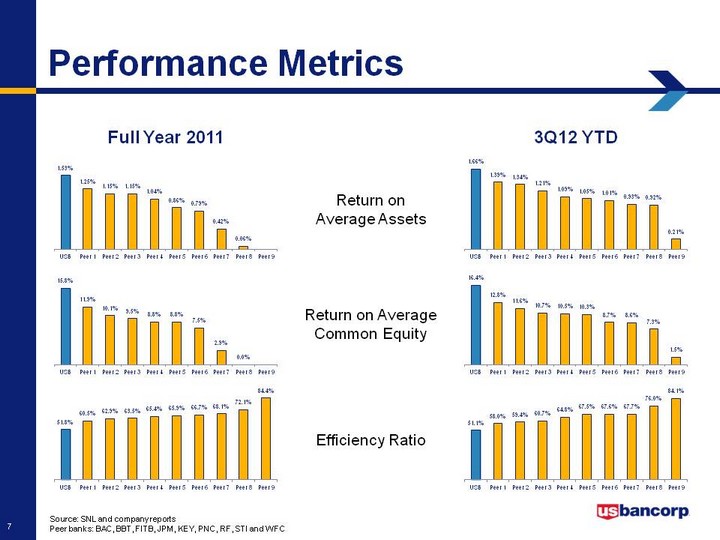
| Source: SNL and company reportsPeer banks: BAC, BBT, FITB, JPM, KEY, PNC, RF, STI and WFC Return onAverage Assets Return on AverageCommon Equity Efficiency Ratio 3Q12 YTD Full Year 2011 Performance Metrics (CHART) (CHART) (CHART) (CHART) (CHART) (CHART) |

| Middle Market Loan 19th 7th BookrunnerInvestment Grade Loan 11th 6th BookrunnerInvestment Grade Bond NA 10th Lead / Co-leadSource: Thomson Reuters based on number of issues 2011 2007 USB Market Rank MarketShareChange Core Deposits 2.0% 2.6% Consumer Loans 1.8% 3.2%Mortgage Origination 0.7% 4.8%C&I Loans 3.2% 3.6%CRE Loans 1.6% 2.5%Source: SNL and Inside Mortgage Finance 3Q12 1Q07 USB Market Share MarketShareChange 2011 2007 USB Market Share MarketShareChange Credit Card (total volume) 4% 6% Fund Services (# of funds) 18% 22%Wealth Management (AUM) 1% 1%Source: Nilson (card), Visa and MasterCard issuers;Investment Co Institute (fund services); Barron's (wealth management) Municipal Trust 27% 30%Corporate Trust 8% 25%Structured Trust 12% 20%Source: Securities Data Corp based on number of issues 3Q12 YTD 2007 USB Market Share MarketShareChange Growing Market Share |
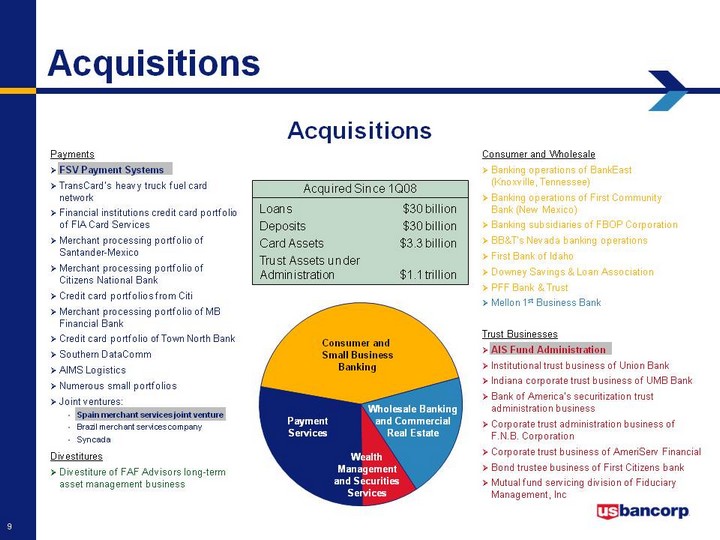
| PaymentsFSV Payment SystemsTransCard's heavy truck fuel card networkFinancial institutions credit card portfolio of FIA Card ServicesMerchant processing portfolio of Santander-MexicoMerchant processing portfolio of Citizens National Bank Credit card portfolios from CitiMerchant processing portfolio of MB Financial BankCredit card portfolio of Town North BankSouthern DataCommAIMS LogisticsNumerous small portfoliosJoint ventures:Spain merchant services joint ventureBrazil merchant services companySyncada Consumer and WholesaleBanking operations of BankEast (Knoxville, Tennessee)Banking operations of First Community Bank (New Mexico)Banking subsidiaries of FBOP CorporationBB&T's Nevada banking operationsFirst Bank of IdahoDowney Savings & Loan AssociationPFF Bank & TrustMellon 1st Business Bank Trust BusinessesAIS Fund AdministrationInstitutional trust business of Union BankIndiana corporate trust business of UMB BankBank of America's securitization trust administration businessCorporate trust administration business of F.N.B. Corporation Corporate trust business of AmeriServ FinancialBond trustee business of First Citizens bankMutual fund servicing division of Fiduciary Management, Inc DivestituresDivestiture of FAF Advisors long-term asset management business Acquisitions (CHART) Consumer and Small BusinessBanking PaymentServices WealthManagementand SecuritiesServices Wholesale Bankingand CommercialReal Estate Loans $30 billionDeposits $30 billionCard Assets $3.3 billionTrust Assets underAdministration $1.1 trillion Acquired Since 1Q08 Acquisitions |
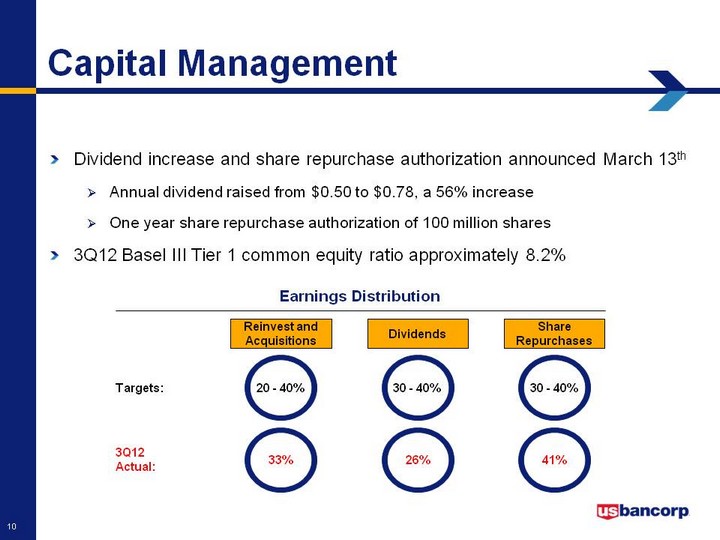
| Capital Management Dividend increase and share repurchase authorization announced March 13thAnnual dividend raised from $0.50 to $0.78, a 56% increaseOne year share repurchase authorization of 100 million shares3Q12 Basel III Tier 1 common equity ratio approximately 8.2% Reinvest andAcquisitions Dividends ShareRepurchases 20 - 40% Targets: 30 - 40% 30 - 40% 33% 3Q12Actual: 41% 26% Earnings Distribution |

| 4Q12 Update Loan GrowthNet Interest MarginEconomic Environment |
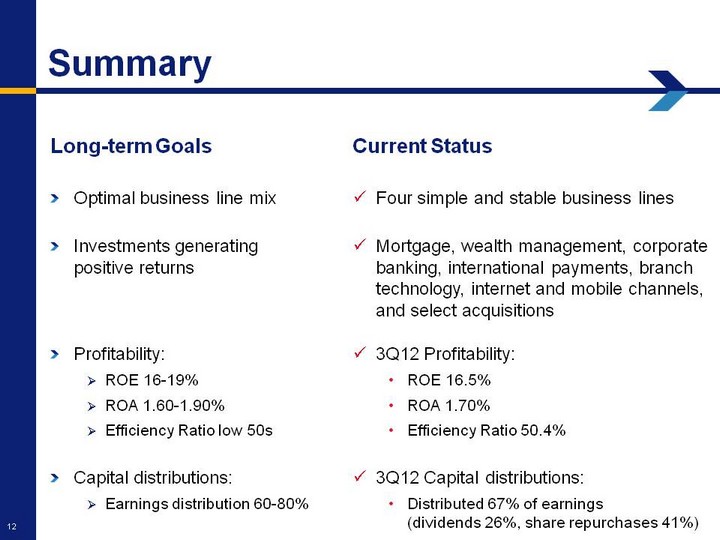
| Long-term GoalsOptimal business line mixInvestments generating positive returns Profitability:ROE 16-19%ROA 1.60-1.90%Efficiency Ratio low 50sCapital distributions:Earnings distribution 60-80% Summary Current StatusFour simple and stable business linesMortgage, wealth management, corporate banking, international payments, branch technology, internet and mobile channels, and select acquisitions3Q12 Profitability:ROE 16.5%ROA 1.70%Efficiency Ratio 50.4%3Q12 Capital distributions:Distributed 67% of earnings (dividends 26%, share repurchases 41%) |
| continues Momentum |
| Appendix |
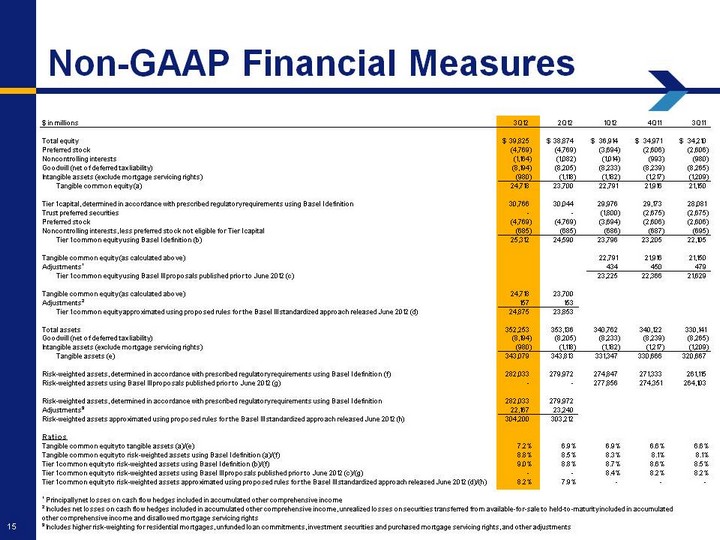
| Non-GAAP Financial Measures |
| Goldman Sachs U.S. Financial Services Conference 2012 |