Attached files
| file | filename |
|---|---|
| 8-K - FORM 8-K - JPMORGAN CHASE & CO | d444830d8k.htm |
EXHIBIT 99.1
|
REVISED FINANCIAL SUPPLEMENT (Business Segment Reorganization)
SEVEN QUARTER TREND THROUGH 3Q12 AND FULL YEARS OF 2011 & 2010 |

| JPMORGAN CHASE & CO. |

| |
| TABLE OF CONTENTS |
| Page(s) | ||
| Summary of Revisions |
2-3 | |
| Business Detail |
||
| Line of Business Financial Highlights - Managed Basis |
4 | |
| Consumer & Community Banking |
5-6 | |
| Consumer & Business Banking |
7 | |
| Mortgage Production and Servicing |
8-9 | |
| Real Estate Portfolios |
10-11 | |
| Card, Merchant Services & Auto |
12-13 | |
| Corporate & Investment Bank |
14-17 | |
| Corporate/Private Equity |
18 | |
| Credit-Related Information |
19-22 | |
| Non-GAAP Financial Measures |
23 | |
| Glossary of Terms |
24-26 | |
Page 1
| JPMORGAN CHASE & CO. |
| |
| REVISED FINANCIAL DISCLOSURE |
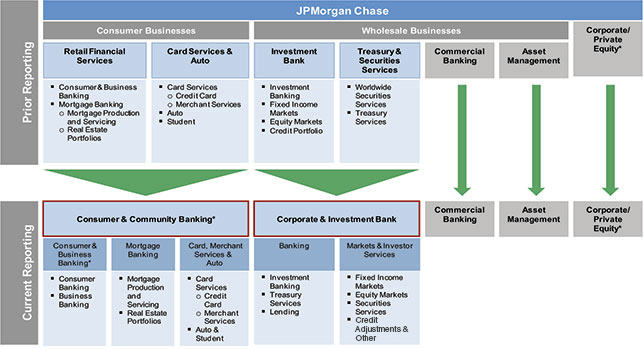
JPMorgan Chase & Co. (“JPMorgan Chase” or the “Firm”) is furnishing this Current Report on Form 8-K to provide supplemental financial disclosures related to the reorganization of its business segments. The reorganization became effective in the fourth quarter of 2012. As a result of the reorganization:
| ¡ | Consumer business segment change. The Retail Financial Services (“RFS”) and Card Services & Auto (“Card”) business segments were combined to form one business segment called Consumer & Community Banking (“CCB”). |
| ¡ | Wholesale business segment change. The Investment Bank (“IB”) and Treasury & Securities Services (“TSS”) business segments were combined to form one business segment called Corporate & Investment Bank (“CIB”). |
| ¡ | The Firm’s other business segments, Commercial Banking (“CB”) and Asset Management (“AM”), were not affected by the aforementioned changes. A technology function supporting online and mobile banking was transferred from Corporate/Private Equity (“Corp/PE”) to the CCB business segment. This transfer did not materially affect the results of either the CCB business segment or Corp/PE. |
The pages that follow provide: (i) a summary mapping of the Firm’s prior and current business segments (page 3), and (ii) more detailed presentations of the supplemental financial information in order to assist investors in understanding how the Firm’s business segment results would have been presented in previously-filed reports had such results been reported in the manner in which JPMorgan Chase’s business segments are being managed commencing in the fourth quarter of 2012 (pages 4 – 22). Only financial information affected by the reorganization is included in this Current Report on Form 8-K.
Page 2
| JPMORGAN CHASE & CO. REVISED FINANCIAL DISCLOSURE |
|
* A technology function supporting online and mobile banking was transferred from Corp/PE to the CCB business segment.
Page 3
| JPMORGAN CHASE & CO. |
| |
| LINE OF BUSINESS FINANCIAL HIGHLIGHTS - MANAGED BASIS |
||
| (in millions) |
| QUARTERLY TRENDS | FULL YEAR | |||||||||||||||||||||||||||||||||||
| 3Q12 | 2Q12 | 1Q12 | 4Q11 | 3Q11 | 2Q11 | 1Q11 | 2011 | 2010 | ||||||||||||||||||||||||||||
| TOTAL NET REVENUE (fully taxable-equivalent (“FTE”)) |
||||||||||||||||||||||||||||||||||||
| Consumer & Community Banking |
$ | 12,738 | $ | 12,466 | $ | 12,363 | $ | 11,209 | $ | 12,312 | $ | 11,909 | $ | 10,257 | $ | 45,687 | $ | 48,927 | ||||||||||||||||||
| Corporate & Investment Bank |
8,360 | 8,986 | 9,338 | 6,320 | 8,286 | 9,278 | 10,100 | 33,984 | 33,477 | |||||||||||||||||||||||||||
| Commercial Banking |
1,732 | 1,691 | 1,657 | 1,687 | 1,588 | 1,627 | 1,516 | 6,418 | 6,040 | |||||||||||||||||||||||||||
| Asset Management |
2,459 | 2,364 | 2,370 | 2,284 | 2,316 | 2,537 | 2,406 | 9,543 | 8,984 | |||||||||||||||||||||||||||
| Corporate/Private Equity |
574 | (2,615) | 1,029 | 698 | (134) | 2,059 | 1,512 | 4,135 | 7,414 | |||||||||||||||||||||||||||
|
|
|
|
|
|
|
|
|
|
|
|
|
|
|
|
|
|
|
|||||||||||||||||||
| TOTAL NET REVENUE |
$ | 25,863 | $ | 22,892 | $ | 26,757 | $ | 22,198 | $ | 24,368 | $ | 27,410 | $ | 25,791 | $ | 99,767 | $ | 104,842 | ||||||||||||||||||
|
|
|
|
|
|
|
|
|
|
|
|
|
|
|
|
|
|
|
|||||||||||||||||||
| TOTAL NONINTEREST EXPENSE |
||||||||||||||||||||||||||||||||||||
| Consumer & Community Banking |
$ | 6,954 | $ | 6,832 | $ | 7,038 | $ | 6,763 | $ | 6,680 | $ | 7,282 | $ | 6,819 | $ | 27,544 | $ | 23,706 | ||||||||||||||||||
| Corporate & Investment Bank |
5,350 | 5,293 | 6,211 | 4,532 | 5,269 | 5,785 | 6,393 | 21,979 | 22,869 | |||||||||||||||||||||||||||
| Commercial Banking |
601 | 591 | 598 | 579 | 573 | 563 | 563 | 2,278 | 2,199 | |||||||||||||||||||||||||||
| Asset Management |
1,731 | 1,701 | 1,729 | 1,752 | 1,796 | 1,794 | 1,660 | 7,002 | 6,112 | |||||||||||||||||||||||||||
| Corporate/Private Equity |
735 | 549 | 2,769 | 914 | 1,216 | 1,418 | 560 | 4,108 | 6,310 | |||||||||||||||||||||||||||
|
|
|
|
|
|
|
|
|
|
|
|
|
|
|
|
|
|
|
|||||||||||||||||||
| TOTAL NONINTEREST EXPENSE |
$ | 15,371 | $ | 14,966 | $ | 18,345 | $ | 14,540 | $ | 15,534 | $ | 16,842 | $ | 15,995 | $ | 62,911 | $ | 61,196 | ||||||||||||||||||
|
|
|
|
|
|
|
|
|
|
|
|
|
|
|
|
|
|
|
|||||||||||||||||||
| PRE-PROVISION PROFIT/(LOSS) |
||||||||||||||||||||||||||||||||||||
| Consumer & Community Banking |
$ | 5,784 | $ | 5,634 | $ | 5,325 | $ | 4,446 | $ | 5,632 | $ | 4,627 | $ | 3,438 | $ | 18,143 | $ | 25,221 | ||||||||||||||||||
| Corporate & Investment Bank |
3,010 | 3,693 | 3,127 | 1,788 | 3,017 | 3,493 | 3,707 | 12,005 | 10,608 | |||||||||||||||||||||||||||
| Commercial Banking |
1,131 | 1,100 | 1,059 | 1,108 | 1,015 | 1,064 | 953 | 4,140 | 3,841 | |||||||||||||||||||||||||||
| Asset Management |
728 | 663 | 641 | 532 | 520 | 743 | 746 | 2,541 | 2,872 | |||||||||||||||||||||||||||
| Corporate/Private Equity |
(161) | (3,164) | (1,740) | (216) | (1,350) | 641 | 952 | 27 | 1,104 | |||||||||||||||||||||||||||
|
|
|
|
|
|
|
|
|
|
|
|
|
|
|
|
|
|
|
|||||||||||||||||||
| PRE-PROVISION PROFIT |
$ | 10,492 | $ | 7,926 | $ | 8,412 | $ | 7,658 | $ | 8,834 | $ | 10,568 | $ | 9,796 | $ | 36,856 | $ | 43,646 | ||||||||||||||||||
|
|
|
|
|
|
|
|
|
|
|
|
|
|
|
|
|
|
|
|||||||||||||||||||
| PROVISION FOR CREDIT LOSSES |
||||||||||||||||||||||||||||||||||||
| Consumer & Community Banking |
$ | 1,862 | $ | 179 | $ | 642 | $ | 1,839 | $ | 2,291 | $ | 1,938 | $ | 1,552 | $ | 7,620 | $ | 17,489 | ||||||||||||||||||
| Corporate & Investment Bank |
(60) | 29 | (3) | 291 | 34 | (185) | (425) | (285) | (1,247) | |||||||||||||||||||||||||||
| Commercial Banking |
(16) | (17) | 77 | 40 | 67 | 54 | 47 | 208 | 297 | |||||||||||||||||||||||||||
| Asset Management |
14 | 34 | 19 | 24 | 26 | 12 | 5 | 67 | 86 | |||||||||||||||||||||||||||
| Corporate/Private Equity |
(11) | (11) | (9) | (10) | (7) | (9) | (10) | (36) | 14 | |||||||||||||||||||||||||||
|
|
|
|
|
|
|
|
|
|
|
|
|
|
|
|
|
|
|
|||||||||||||||||||
| PROVISION FOR CREDIT LOSSES |
$ | 1,789 | $ | 214 | $ | 726 | $ | 2,184 | $ | 2,411 | $ | 1,810 | $ | 1,169 | $ | 7,574 | $ | 16,639 | ||||||||||||||||||
|
|
|
|
|
|
|
|
|
|
|
|
|
|
|
|
|
|
|
|||||||||||||||||||
| NET INCOME/(LOSS) |
||||||||||||||||||||||||||||||||||||
| Consumer & Community Banking |
$ | 2,366 | $ | 3,295 | $ | 2,936 | $ | 1,574 | $ | 2,011 | $ | 1,483 | $ | 1,134 | $ | 6,202 | $ | 4,578 | ||||||||||||||||||
| Corporate & Investment Bank |
1,992 | 2,376 | 2,033 | 976 | 1,941 | 2,390 | 2,686 | 7,993 | 7,718 | |||||||||||||||||||||||||||
| Commercial Banking |
690 | 673 | 591 | 643 | 571 | 607 | 546 | 2,367 | 2,084 | |||||||||||||||||||||||||||
| Asset Management |
443 | 391 | 386 | 302 | 385 | 439 | 466 | 1,592 | 1,710 | |||||||||||||||||||||||||||
| Corporate/Private Equity |
217 | (1,775) | (1,022) | 233 | (646) | 512 | 723 | 822 | 1,280 | |||||||||||||||||||||||||||
|
|
|
|
|
|
|
|
|
|
|
|
|
|
|
|
|
|
|
|||||||||||||||||||
| TOTAL NET INCOME |
$ | 5,708 | $ | 4,960 | $ | 4,924 | $ | 3,728 | $ | 4,262 | $ | 5,431 | $ | 5,555 | $ | 18,976 | $ | 17,370 | ||||||||||||||||||
|
|
|
|
|
|
|
|
|
|
|
|
|
|
|
|
|
|
|
|||||||||||||||||||
Page 4
| JPMORGAN CHASE & CO. |
| |
| CONSUMER & COMMUNITY BANKING |
||
| FINANCIAL HIGHLIGHTS |
||
| (in millions, except ratio and headcount data) |
| QUARTERLY TRENDS | FULL YEAR | |||||||||||||||||||||||||||||||||||
| 3Q12 | 2Q12 | 1Q12 | 4Q11 | 3Q11 | 2Q11 | 1Q11 | 2011 | 2010 | ||||||||||||||||||||||||||||
| INCOME STATEMENT (a) |
||||||||||||||||||||||||||||||||||||
| REVENUE |
||||||||||||||||||||||||||||||||||||
| Lending- and deposit-related fees |
$ | 797 | $ | 782 | $ | 753 | $ | 812 | $ | 838 | $ | 822 | $ | 747 | $ | 3,219 | $ | 3,117 | ||||||||||||||||||
| Asset management, administration and commissions |
522 | 540 | 535 | 508 | 524 | 512 | 500 | 2,044 | 1,831 | |||||||||||||||||||||||||||
| Mortgage fees and related income |
2,376 | 2,265 | 2,008 | 723 | 1,380 | 1,100 | (489) | 2,714 | 3,855 | |||||||||||||||||||||||||||
| Credit card income |
1,376 | 1,359 | 1,263 | 1,358 | 1,664 | 1,695 | 1,435 | 6,152 | 5,469 | |||||||||||||||||||||||||||
| All other income |
352 | 340 | 416 | 321 | 323 | 299 | 234 | 1,177 | 1,241 | |||||||||||||||||||||||||||
|
|
|
|
|
|
|
|
|
|
|
|
|
|
|
|
|
|
|
|||||||||||||||||||
| Noninterest revenue |
5,423 | 5,286 | 4,975 | 3,722 | 4,729 | 4,428 | 2,427 | 15,306 | 15,513 | |||||||||||||||||||||||||||
| Net interest income |
7,315 | 7,180 | 7,388 | 7,487 | 7,583 | 7,481 | 7,830 | 30,381 | 33,414 | |||||||||||||||||||||||||||
|
|
|
|
|
|
|
|
|
|
|
|
|
|
|
|
|
|
|
|||||||||||||||||||
| TOTAL NET REVENUE |
12,738 | 12,466 | 12,363 | 11,209 | 12,312 | 11,909 | 10,257 | 45,687 | 48,927 | |||||||||||||||||||||||||||
| Provision for credit losses |
1,862 | 179 | 642 | 1,839 | 2,291 | 1,938 | 1,552 | 7,620 | 17,489 | |||||||||||||||||||||||||||
| NONINTEREST EXPENSE |
||||||||||||||||||||||||||||||||||||
| Compensation expense |
2,847 | 2,817 | 2,819 | 2,619 | 2,585 | 2,409 | 2,358 | 9,971 | 8,804 | |||||||||||||||||||||||||||
| Noncompensation expense |
3,970 | 3,871 | 4,072 | 3,991 | 3,939 | 4,709 | 4,295 | 16,934 | 14,159 | |||||||||||||||||||||||||||
| Amortization of intangibles |
137 | 144 | 147 | 153 | 156 | 164 | 166 | 639 | 743 | |||||||||||||||||||||||||||
|
|
|
|
|
|
|
|
|
|
|
|
|
|
|
|
|
|
|
|||||||||||||||||||
| TOTAL NONINTEREST EXPENSE |
6,954 | 6,832 | 7,038 | 6,763 | 6,680 | 7,282 | 6,819 | 27,544 | 23,706 | |||||||||||||||||||||||||||
|
|
|
|
|
|
|
|
|
|
|
|
|
|
|
|
|
|
|
|||||||||||||||||||
| Income before income tax expense |
3,922 | 5,455 | 4,683 | 2,607 | 3,341 | 2,689 | 1,886 | 10,523 | 7,732 | |||||||||||||||||||||||||||
| Income tax expense |
1,556 | 2,160 | 1,747 | 1,033 | 1,330 | 1,206 | 752 | 4,321 | 3,154 | |||||||||||||||||||||||||||
|
|
|
|
|
|
|
|
|
|
|
|
|
|
|
|
|
|
|
|||||||||||||||||||
| NET INCOME |
$ | 2,366 | $ | 3,295 | $ | 2,936 | $ | 1,574 | $ | 2,011 | $ | 1,483 | $ | 1,134 | $ | 6,202 | $ | 4,578 | ||||||||||||||||||
|
|
|
|
|
|
|
|
|
|
|
|
|
|
|
|
|
|
|
|||||||||||||||||||
| FINANCIAL RATIOS (a) |
||||||||||||||||||||||||||||||||||||
| ROE |
22 | % | 31 | % | 27 | % | 15 | % | 19 | % | 15 | % | 11 | % | 15 | % | 11 | % | ||||||||||||||||||
| Overhead ratio |
55 | 55 | 57 | 60 | 54 | 61 | 66 | 60 | 48 | |||||||||||||||||||||||||||
| SELECTED BALANCE SHEET DATA (period-end) (a) |
||||||||||||||||||||||||||||||||||||
| Total assets |
$ | 460,124 | $ | 463,198 | $ | 469,084 | $ | 483,307 | $ | 476,313 | $ | 481,717 | $ | 490,559 | $ | 483,307 | $ | 508,775 | ||||||||||||||||||
| Loans: |
||||||||||||||||||||||||||||||||||||
| Loans retained |
402,431 | 408,066 | 413,373 | 425,581 | 423,023 | 427,449 | 433,618 | 425,581 | 452,249 | |||||||||||||||||||||||||||
| Loans held-for-sale and loans at fair value (b) |
15,356 | 14,366 | 13,352 | 12,796 | 13,247 | 13,558 | 16,246 | 12,796 | 17,015 | |||||||||||||||||||||||||||
|
|
|
|
|
|
|
|
|
|
|
|
|
|
|
|
|
|
|
|||||||||||||||||||
| Total loans |
417,787 | 422,432 | 426,725 | 438,377 | 436,270 | 441,007 | 449,864 | 438,377 | 469,264 | |||||||||||||||||||||||||||
| Deposits |
422,068 | 415,531 | 415,942 | 397,825 | 390,783 | 380,453 | 381,541 | 397,825 | 371,861 | |||||||||||||||||||||||||||
| Equity |
43,000 | 43,000 | 43,000 | 41,000 | 41,000 | 41,000 | 41,000 | 41,000 | 43,000 | |||||||||||||||||||||||||||
| SELECTED BALANCE SHEET DATA (average) (a) |
||||||||||||||||||||||||||||||||||||
| Total assets |
$ | 460,386 | $ | 465,873 | $ | 471,476 | $ | 480,766 | $ | 483,472 | $ | 485,325 | $ | 502,415 | $ | 487,923 | $ | 527,101 | ||||||||||||||||||
| Loans: |
||||||||||||||||||||||||||||||||||||
| Loans retained |
404,772 | 410,774 | 418,017 | 422,970 | 425,222 | 429,893 | 442,078 | 429,975 | 475,549 | |||||||||||||||||||||||||||
| Loans held-for-sale and loans at fair value (b) |
17,988 | 18,476 | 16,442 | 16,777 | 16,609 | 14,889 | 20,521 | 17,187 | 16,663 | |||||||||||||||||||||||||||
|
|
|
|
|
|
|
|
|
|
|
|
|
|
|
|
|
|
|
|||||||||||||||||||
| Total loans |
422,760 | 429,250 | 434,459 | 439,747 | 441,831 | 444,782 | 462,599 | 447,162 | 492,212 | |||||||||||||||||||||||||||
| Deposits |
416,653 | 411,255 | 401,580 | 391,521 | 384,288 | 380,892 | 373,798 | 382,678 | 363,645 | |||||||||||||||||||||||||||
| Equity |
43,000 | 43,000 | 43,000 | 41,000 | 41,000 | 41,000 | 41,000 | 41,000 | 43,000 | |||||||||||||||||||||||||||
| Headcount (a) |
160,342 | 162,807 | 162,991 | 161,443 | 157,280 | 150,286 | 145,960 | 161,443 | 143,226 | |||||||||||||||||||||||||||
|
|
||||||||||||||||||||||||||||||||||||
| (a) | Effective January 1, 2011, the commercial card business that was previously in Corporate & Investment Bank (“CIB”) was transferred to Consumer & Community Banking (“CCB”). There is no material impact on the financial data; prior-year periods were not revised. Headcount included 1,274 employees related to the transfer of this business. |
| (b) | Predominantly consists of prime mortgages originated with the intent to sell that are accounted for at fair value and classified as trading assets on the Consolidated Balance Sheets and Condensed Average Balance Sheets. |
Page 5
| JPMORGAN CHASE & CO. |
| |
| CONSUMER & COMMUNITY BANKING | ||
| FINANCIAL HIGHLIGHTS, CONTINUED | ||
| (in millions, except ratio data and where otherwise noted) |
| QUARTERLY TRENDS | FULL YEAR | |||||||||||||||||||||||||||||||||||
| 3Q12 | 2Q12 | 1Q12 | 4Q11 | 3Q11 | 2Q11 | 1Q11 | 2011 | 2010 | ||||||||||||||||||||||||||||
| CREDIT DATA AND QUALITY STATISTICS (a) |
||||||||||||||||||||||||||||||||||||
| Net charge-offs (b) |
$ | 2,817 | $ | 2,280 | $ | 2,392 | $ | 2,569 | $ | 2,661 | $ | 3,033 | $ | 3,552 | $ | 11,815 | $ | 21,943 | ||||||||||||||||||
| Nonaccrual loans: |
||||||||||||||||||||||||||||||||||||
| Nonaccrual loans retained |
9,398 | 8,016 | 8,395 | 7,354 | 7,759 | 8,275 | 8,501 | 7,354 | 8,770 | |||||||||||||||||||||||||||
| Nonaccrual loans held-for-sale and loans at fair value |
89 | 98 | 101 | 103 | 132 | 142 | 150 | 103 | 145 | |||||||||||||||||||||||||||
|
|
|
|
|
|
|
|
|
|
|
|
|
|
|
|
|
|
|
|||||||||||||||||||
| Total nonaccrual loans (c)(d)(e)(f)(g) |
9,487 | 8,114 | 8,496 | 7,457 | 7,891 | 8,417 | 8,651 | 7,457 | 8,915 | |||||||||||||||||||||||||||
| Nonperforming assets (c)(d)(e)(f)(g) |
10,185 | 8,864 | 9,351 | 8,292 | 8,808 | 9,408 | 9,907 | 8,292 | 10,268 | |||||||||||||||||||||||||||
| Allowance for loan losses |
18,454 | 19,405 | 21,508 | 23,256 | 24,016 | 24,400 | 25,494 | 23,256 | 27,487 | |||||||||||||||||||||||||||
| Net charge-off rate (b)(h) |
2.77 | % | 2.23 | % | 2.30 | % | 2.41 | % | 2.48 | % | 2.83 | % | 3.26 | % | 2.75 | % | 4.61 | % | ||||||||||||||||||
| Net charge-off rate, excluding purchased credit-impaired (“PCI”) loans (b)(h) |
3.27 | 2.64 | 2.72 | 2.86 | 2.96 | 3.38 | 3.89 | 3.27 | 5.50 | |||||||||||||||||||||||||||
| Allowance for loan losses to period-end loans retained |
4.59 | 4.76 | 5.20 | 5.46 | 5.68 | 5.71 | 5.88 | 5.46 | 6.08 | |||||||||||||||||||||||||||
| Allowance for loan losses to period-end loans retained, excluding PCI loans (i) |
3.73 | 3.96 | 4.52 | 4.87 | 5.36 | 5.43 | 5.66 | 4.87 | 5.94 | |||||||||||||||||||||||||||
| Allowance for loan losses to nonaccrual loans retained, excluding credit card (c)(f)(g)(i) |
77 | 102 | 114 | 143 | 149 | 138 | 135 | 143 | 131 | |||||||||||||||||||||||||||
| Nonaccrual loans to total period-end loans, excluding credit card (f)(g) |
3.23 | 2.72 | 2.82 | 2.44 | 2.55 | 2.67 | 2.69 | 2.44 | 2.69 | |||||||||||||||||||||||||||
| Nonaccrual loans to total period-end loans, excluding credit card and PCI loans (c)(f)(g) |
4.09 | 3.45 | 3.58 | 3.10 | 3.26 | 3.41 | 3.46 | 3.10 | 3.44 | |||||||||||||||||||||||||||
| BUSINESS METRICS |
||||||||||||||||||||||||||||||||||||
| Number of: |
||||||||||||||||||||||||||||||||||||
| Branches |
5,596 | 5,563 | 5,541 | 5,508 | 5,396 | 5,340 | 5,292 | 5,508 | 5,268 | |||||||||||||||||||||||||||
| ATMs |
18,485 | 18,132 | 17,654 | 17,235 | 16,708 | 16,443 | 16,265 | 17,235 | 16,145 | |||||||||||||||||||||||||||
| Active online customers (in thousands) |
30,765 | 30,361 | 30,680 | 29,749 | 29,544 | 29,246 | 29,761 | 29,749 | 28,708 | |||||||||||||||||||||||||||
| Active mobile customers (in thousands) |
11,573 | 10,646 | 10,016 | 8,203 | 7,299 | 6,485 | 5,770 | 8,203 | 4,873 | |||||||||||||||||||||||||||
|
|
||||||||||||||||||||||||||||||||||||
| (a) | Effective January 1, 2011, the commercial card business that was previously in CIB was transferred to CCB. There is no material impact on the financial data; prior-year periods were not revised. |
| (b) | Net charge-offs and net charge-off rates for the three months ended September 30, 2012 included $880 million of incremental charge-offs recorded in accordance with regulatory guidance requiring loans discharged under Chapter 7 bankruptcy and not reaffirmed by the borrower (“Chapter 7 loans”) to be charged off to the net realizable value of the collateral and to be considered nonaccrual, regardless of their delinquency status. Excluding these incremental charges-offs, the third quarter of 2012 net charge-offs would have been $1.9 billion and, excluding these incremental charge-offs and PCI loans, the third quarter of 2012 net charge-off rate would have been 2.25%. For further information, see Consumer Credit Portfolio on pages 84-86 of JPMorgan Chase’s third quarter 2012 Form 10-Q. |
| (c) | Excludes PCI loans. Because the Firm is recognizing interest income on each pool of PCI loans, they are all considered to be performing. |
| (d) | Certain mortgages originated with the intent to sell are classified as trading assets on the Consolidated Balance Sheets. |
| (e) | At September 30, 2012, June 30, 2012, March 31, 2012, December 31, 2011, September 30, 2011, June 30, 2011 March 31, 2011 and December 31, 2010, nonperforming assets excluded: (1) mortgage loans insured by U.S. government agencies of $11.0 billion, $11.9 billion, $11.8 billion, $11.5 billion, $9.5 billion, $9.1 billion, $8.8 billion and $9.4 billion, respectively, that are 90 or more days past due; (2) real estate owned insured by U.S. government agencies of $1.5 billion, $1.3 billion, $1.2 billion, $954 million, $2.4 billion, $2.4 billion, $2.3 billion and $1.9 billion, respectively; and (3) student loans insured by U.S government agencies under the Federal Family Education Loan Program (“FFELP”) of $536 million, $547 million, $586 million, $551 million, $567 million, $558 million, $615 million and $625 million, respectively, that are 90 or more days past due. These amounts were excluded from nonaccrual loans as reimbursement of insured amounts is proceeding normally. |
| (f) | Nonaccrual loans included $1.7 billion of Chapter 7 loans, based upon regulatory guidance, at September 30, 2012. |
| (g) | Nonaccrual loans included $1.3 billion, $1.5 billion and $1.6 billion of performing junior liens that are subordinate to senior liens that were 90 days or more past due at September 30, 2012, June 30, 2012 and March 31, 2012, respectively. Of these totals, $1.2 billion, $1.3 billion and $1.4 billion were current at the respective period ends. Beginning March 31, 2012, such junior liens were reported as nonaccrual loans based upon regulatory guidance issued in the first quarter of 2012. |
| (h) | Loans held-for-sale and loans accounted for at fair value were excluded when calculating the net charge-off rate. |
| (i) | An allowance for loan losses of $5.7 billion at September 30, 2012, June 30, 2012, March 31, 2012 and December 31, 2011 and $4.9 billion at September 30, 2011, June 30, 2011, March 31, 2011 and December 31, 2010 was recorded for PCI loans; these amounts were also excluded from the applicable ratios. |
Page 6
| JPMORGAN CHASE & CO. |
| |
| CONSUMER & COMMUNITY BANKING | ||
| FINANCIAL HIGHLIGHTS, CONTINUED | ||
| (in millions, except ratio data and where otherwise noted) |
| QUARTERLY TRENDS | FULL YEAR | |||||||||||||||||||||||||||||||||||||
| 3Q12 | 2Q12 | 1Q12 | 4Q11 | 3Q11 | 2Q11 | 1Q11 | 2011 | 2010 | ||||||||||||||||||||||||||||||
| CONSUMER & BUSINESS BANKING |
||||||||||||||||||||||||||||||||||||||
| Lending- and deposit-related fees |
$ | 785 | $ | 770 | $ | 742 | $ | 800 | $ | 826 | $ | 807 | $ | 727 | $ | 3,160 | $ | 3,025 | ||||||||||||||||||||
| Asset management, administration and commissions |
406 | 415 | 412 | 385 | 399 | 395 | 380 | 1,559 | 1,390 | |||||||||||||||||||||||||||||
| Credit card income |
343 | 344 | 315 | 305 | 611 | 571 | 537 | 2,024 | 1,953 | |||||||||||||||||||||||||||||
| All other income |
121 | 123 | 116 | 113 | 118 | 123 | 113 | 467 | 484 | |||||||||||||||||||||||||||||
|
|
|
|
|
|
|
|
|
|
|
|
|
|
|
|
|
|
|
|||||||||||||||||||||
| Noninterest revenue |
1,655 | 1,652 | 1,585 | 1,603 | 1,954 | 1,896 | 1,757 | 7,210 | 6,852 | |||||||||||||||||||||||||||||
| Net interest income |
2,685 | 2,680 | 2,675 | 2,714 | 2,730 | 2,705 | 2,659 | 10,808 | 10,884 | |||||||||||||||||||||||||||||
|
|
|
|
|
|
|
|
|
|
|
|
|
|
|
|
|
|
|
|||||||||||||||||||||
| Total net revenue |
4,340 | 4,332 | 4,260 | 4,317 | 4,684 | 4,601 | 4,416 | 18,018 | 17,736 | |||||||||||||||||||||||||||||
| Provision for credit losses |
107 | (2) | 96 | 132 | 126 | 42 | 119 | 419 | 630 | |||||||||||||||||||||||||||||
| Noninterest expense |
2,911 | 2,752 | 2,866 | 2,864 | 2,842 | 2,736 | 2,801 | 11,243 | 10,762 | |||||||||||||||||||||||||||||
|
|
|
|
|
|
|
|
|
|
|
|
|
|
|
|
|
|
|
|||||||||||||||||||||
| Income before income tax expense |
1,322 | 1,582 | 1,298 | 1,321 | 1,716 | 1,823 | 1,496 | 6,356 | 6,344 | |||||||||||||||||||||||||||||
|
|
|
|
|
|
|
|
|
|
|
|
|
|
|
|
|
|
|
|||||||||||||||||||||
| Net income |
$ | 789 | $ | 944 | $ | 774 | $ | 792 | $ | 1,024 | $ | 1,088 | $ | 892 | $ | 3,796 | $ | 3,630 | ||||||||||||||||||||
|
|
|
|
|
|
|
|
|
|
|
|
|
|
|
|
|
|
|
|||||||||||||||||||||
| Overhead ratio |
67 | % | 64 | % | 67 | % | 66 | % | 61 | % | 59 | % | 63 | % | 62 | % | 61 | % | ||||||||||||||||||||
| Overhead ratio excluding core deposit intangibles (a) |
66 | 62 | 66 | 65 | 59 | 58 | 62 | 61 | 59 | |||||||||||||||||||||||||||||
| BUSINESS METRICS |
||||||||||||||||||||||||||||||||||||||
| Business banking origination volume |
$ | 1,685 | $ | 1,787 | $ | 1,540 | $ | 1,389 | $ | 1,440 | $ | 1,573 | $ | 1,425 | $ | 5,827 | $ | 4,688 | ||||||||||||||||||||
| Period-end loans |
18,568 | 18,218 | 17,822 | 17,652 | 17,272 | 17,141 | 16,957 | 17,652 | 16,812 | |||||||||||||||||||||||||||||
| Period-end deposits: |
||||||||||||||||||||||||||||||||||||||
| Checking |
159,527 | 156,449 | 159,075 | 147,779 | 142,064 | 136,297 | 137,463 | 147,779 | 131,702 | |||||||||||||||||||||||||||||
| Savings |
208,272 | 203,910 | 200,662 | 191,891 | 186,733 | 182,127 | 180,345 | 191,891 | 170,604 | |||||||||||||||||||||||||||||
| Time and other |
32,783 | 34,406 | 35,643 | 36,745 | 39,017 | 41,951 | 44,002 | 36,745 | 45,967 | |||||||||||||||||||||||||||||
|
|
|
|
|
|
|
|
|
|
|
|
|
|
|
|
|
|
|
|||||||||||||||||||||
| Total period-end deposits |
400,582 | 394,765 | 395,380 | 376,415 | 367,814 | 360,375 | 361,810 | 376,415 | 348,273 | |||||||||||||||||||||||||||||
| Average loans |
18,279 | 17,934 | 17,667 | 17,363 | 17,172 | 17,057 | 16,886 | 17,121 | 16,863 | |||||||||||||||||||||||||||||
| Average deposits: |
||||||||||||||||||||||||||||||||||||||
| Checking |
153,982 | 151,733 | 147,455 | 140,672 | 137,033 | 136,558 | 131,954 | 136,579 | 123,490 | |||||||||||||||||||||||||||||
| Savings |
206,298 | 202,685 | 197,199 | 189,553 | 184,590 | 180,892 | 175,133 | 182,587 | 166,112 | |||||||||||||||||||||||||||||
| Time and other |
33,472 | 35,099 | 36,123 | 37,709 | 40,592 | 43,056 | 45,035 | 41,576 | 51,152 | |||||||||||||||||||||||||||||
|
|
|
|
|
|
|
|
|
|
|
|
|
|
|
|
|
|
|
|||||||||||||||||||||
| Total average deposits |
393,752 | 389,517 | 380,777 | 367,934 | 362,215 | 360,506 | 352,122 | 360,742 | 340,754 | |||||||||||||||||||||||||||||
| Deposit margin |
2.56 | % | 2.62 | % | 2.68 | % | 2.76 | % | 2.82 | % | 2.83 | % | 2.88 | % | 2.82 | % | 3.00 | % | ||||||||||||||||||||
| Average assets |
$ | 30,702 | $ | 30,340 | $ | 30,911 | $ | 30,416 | $ | 30,129 | $ | 29,093 | $ | 29,445 | $ | 29,774 | $ | 29,321 | ||||||||||||||||||||
| CREDIT DATA AND QUALITY STATISTICS |
||||||||||||||||||||||||||||||||||||||
| Net charge-offs |
$ | 107 | $ | 98 | $ | 96 | $ | 132 | $ | 126 | $ | 117 | $ | 119 | $ | 494 | $ | 730 | ||||||||||||||||||||
| Net charge-off rate |
2.33 | % | 2.20 | % | 2.19 | % | 3.02 | % | 2.91 | % | 2.74 | % | 2.86 | % | 2.89 | % | 4.32 | % | ||||||||||||||||||||
| Allowance for loan losses |
$ | 698 | $ | 698 | $ | 798 | $ | 798 | $ | 800 | $ | 800 | $ | 875 | $ | 798 | $ | 875 | ||||||||||||||||||||
| Nonperforming assets |
532 | 597 | 663 | 710 | 773 | 784 | 822 | 710 | 846 | |||||||||||||||||||||||||||||
| RETAIL BRANCH BUSINESS METRICS |
||||||||||||||||||||||||||||||||||||||
| Investment sales volume |
$ | 6,280 | $ | 6,171 | $ | 6,598 | $ | 4,696 | $ | 5,102 | $ | 6,334 | $ | 6,584 | $ | 22,716 | $ | 23,579 | ||||||||||||||||||||
| Client investment assets |
154,637 | 147,641 | 147,083 | 137,853 | 132,255 | 140,285 | 138,150 | 137,853 | 133,114 | |||||||||||||||||||||||||||||
| % managed accounts |
28 | % | 26 | % | 26 | % | 24 | % | 23 | % | 23 | % | 22 | % | 24 | % | 20 | % | ||||||||||||||||||||
| Number of: |
||||||||||||||||||||||||||||||||||||||
| Chase Private Client branch locations |
960 | 738 | 366 | 262 | 139 | 16 | 16 | 262 | 16 | |||||||||||||||||||||||||||||
| Personal bankers |
23,622 | 24,052 | 24,198 | 24,308 | 24,205 | 23,330 | 21,894 | 24,308 | 21,735 | |||||||||||||||||||||||||||||
| Sales specialists |
6,205 | 6,179 | 6,110 | 6,017 | 5,639 | 5,289 | 5,039 | 6,017 | 4,876 | |||||||||||||||||||||||||||||
| Client advisors |
3,034 | 3,075 | 3,131 | 3,201 | 3,177 | 3,112 | 3,051 | 3,201 | 3,066 | |||||||||||||||||||||||||||||
| Chase Private Clients |
75,766 | 50,649 | 32,857 | 21,723 | 11,711 | 5,807 | 4,829 | 21,723 | 4,242 | |||||||||||||||||||||||||||||
| Accounts (in thousands) (b) |
27,840 | 27,406 | 27,034 | 26,626 | 26,541 | 26,266 | 26,622 | 26,626 | 27,252 | |||||||||||||||||||||||||||||
|
|
||||||||||||||||||||||||||||||||||||||
| (a) | Consumer & Business Banking (“CBB”) uses the overhead ratio (excluding the amortization of core deposit intangibles (“CDI”)), a non-GAAP financial measure, to evaluate the underlying expense trends of the business. Including CDI amortization expense in the overhead ratio calculation would result in a higher overhead ratio in the earlier years and a lower overhead ratio in later years; this method would therefore result in an improving overhead ratio over time, all things remaining equal. This non-GAAP ratio excluded CBB’s CDI amortization expense related to prior business combination transactions of $51 million, $50 million, $51 million, $58 million, $60 million, $60 million and $60 million for the three months ended September 30, 2012, June 30, 2012, March 31, 2012, December 31, 2011, September 30, 2011, June 30, 2011 and March 31, 2011, respectively, and $238 million and $276 million for full year 2011 and 2010, respectively. |
| (b) | Includes checking accounts and Chase Liquid® cards beginning in the second quarter of 2012. |
Page 7
| JPMORGAN CHASE & CO. |
| |
| CONSUMER & COMMUNITY BANKING | ||
| FINANCIAL HIGHLIGHTS, CONTINUED | ||
| (in millions, except ratio data) |
| QUARTERLY TRENDS | FULL YEAR | |||||||||||||||||||||||||||||||||||
| 3Q12 | 2Q12 | 1Q12 | 4Q11 | 3Q11 | 2Q11 | 1Q11 | 2011 | 2010 | ||||||||||||||||||||||||||||
| MORTGAGE PRODUCTION AND SERVICING |
||||||||||||||||||||||||||||||||||||
| Mortgage fees and related income |
$ | 2,376 | $ | 2,265 | $ | 2,008 | $ | 723 | $ | 1,380 | $ | 1,100 | $ | (489) | $ | 2,714 | $ | 3,855 | ||||||||||||||||||
| All other income |
103 | 110 | 123 | 124 | 118 | 106 | 104 | 452 | 413 | |||||||||||||||||||||||||||
|
|
|
|
|
|
|
|
|
|
|
|
|
|
|
|
|
|
|
|||||||||||||||||||
| Noninterest revenue |
2,479 | 2,375 | 2,131 | 847 | 1,498 | 1,206 | (385) | 3,166 | 4,268 | |||||||||||||||||||||||||||
| Net interest income |
190 | 194 | 177 | 171 | 204 | 124 | 271 | 770 | 904 | |||||||||||||||||||||||||||
|
|
|
|
|
|
|
|
|
|
|
|
|
|
|
|
|
|
|
|||||||||||||||||||
| Total net revenue |
2,669 | 2,569 | 2,308 | 1,018 | 1,702 | 1,330 | (114) | 3,936 | 5,172 | |||||||||||||||||||||||||||
| Provision for credit losses |
4 | 1 | - | 1 | 2 | (2) | 4 | 5 | 58 | |||||||||||||||||||||||||||
| Noninterest expense |
1,737 | 1,572 | 1,724 | 1,442 | 1,360 | 2,187 | 1,746 | 6,735 | 4,139 | |||||||||||||||||||||||||||
|
|
|
|
|
|
|
|
|
|
|
|
|
|
|
|
|
|
|
|||||||||||||||||||
| Income/(loss) before income tax expense/(benefit) |
928 | 996 | 584 | (425) | 340 | (855) | (1,864) | (2,804) | 975 | |||||||||||||||||||||||||||
|
|
|
|
|
|
|
|
|
|
|
|
|
|
|
|
|
|
|
|||||||||||||||||||
| Net income/(loss) |
$ | 563 | $ | 604 | $ | 461 | $ | (258) | $ | 205 | $ | (649) | $ | (1,130) | $ | (1,832) | $ | 569 | ||||||||||||||||||
|
|
|
|
|
|
|
|
|
|
|
|
|
|
|
|
|
|
|
|||||||||||||||||||
| Overhead ratio |
65 | % | 61 | % | 75 | % | 142 | % | 80 | % | 164 | % | NM | % | 171 | % | 80 | % | ||||||||||||||||||
| FUNCTIONAL RESULTS |
||||||||||||||||||||||||||||||||||||
| Production |
||||||||||||||||||||||||||||||||||||
| Production revenue |
$ | 1,582 | $ | 1,362 | $ | 1,432 | $ | 859 | $ | 1,090 | $ | 767 | $ | 679 | $ | 3,395 | $ | 3,440 | ||||||||||||||||||
| Production-related net interest & other income |
196 | 199 | 187 | 210 | 213 | 199 | 218 | 840 | 869 | |||||||||||||||||||||||||||
|
|
|
|
|
|
|
|
|
|
|
|
|
|
|
|
|
|
|
|||||||||||||||||||
| Production-related revenue, excl. repurchase losses |
1,778 | 1,561 | 1,619 | 1,069 | 1,303 | 966 | 897 | 4,235 | 4,309 | |||||||||||||||||||||||||||
| Production expense |
678 | 620 | 573 | 518 | 496 | 457 | 424 | 1,895 | 1,613 | |||||||||||||||||||||||||||
|
|
|
|
|
|
|
|
|
|
|
|
|
|
|
|
|
|
|
|||||||||||||||||||
| Income, excluding repurchase losses |
1,100 | 941 | 1,046 | 551 | 807 | 509 | 473 | 2,340 | 2,696 | |||||||||||||||||||||||||||
| Repurchase losses |
(13) | (10) | (302) | (390) | (314) | (223) | (420) | (1,347) | (2,912) | |||||||||||||||||||||||||||
|
|
|
|
|
|
|
|
|
|
|
|
|
|
|
|
|
|
|
|||||||||||||||||||
| Income/(loss) before income tax expense/(benefit) |
1,087 | 931 | 744 | 161 | 493 | 286 | 53 | 993 | (216) | |||||||||||||||||||||||||||
| Servicing |
||||||||||||||||||||||||||||||||||||
| Loan servicing revenue |
946 | 1,004 | 1,039 | 1,032 | 1,039 | 1,011 | 1,052 | 4,134 | 4,575 | |||||||||||||||||||||||||||
| Servicing-related net interest & other income |
98 | 108 | 112 | 90 | 115 | 29 | 156 | 390 | 433 | |||||||||||||||||||||||||||
|
|
|
|
|
|
|
|
|
|
|
|
|
|
|
|
|
|
|
|||||||||||||||||||
| Servicing-related revenue |
1,044 | 1,112 | 1,151 | 1,122 | 1,154 | 1,040 | 1,208 | 4,524 | 5,008 | |||||||||||||||||||||||||||
| MSR asset modeled amortization |
(290) | (327) | (351) | (406) | (457) | (478) | (563) | (1,904) | (2,384) | |||||||||||||||||||||||||||
| Default servicing expense |
819 | 705 | 890 | 702 | 585 | 1,449 | 1,078 | 3,814 | 1,747 | |||||||||||||||||||||||||||
| Core servicing expense |
244 | 248 | 261 | 223 | 281 | 279 | 248 | 1,031 | 837 | |||||||||||||||||||||||||||
|
|
|
|
|
|
|
|
|
|
|
|
|
|
|
|
|
|
|
|||||||||||||||||||
| Income/(loss), excluding MSR risk management |
(309) | (168) | (351) | (209) | (169) | (1,166) | (681) | (2,225) | 40 | |||||||||||||||||||||||||||
| MSR risk management, including related net interest income/(expense) |
150 | 233 | 191 | (377) | 16 | 25 | (1,236) | (1,572) | 1,151 | |||||||||||||||||||||||||||
|
|
|
|
|
|
|
|
|
|
|
|
|
|
|
|
|
|
|
|||||||||||||||||||
| Income/(loss) before income tax expense/(benefit) |
(159) | 65 | (160) | (586) | (153) | (1,141) | (1,917) | (3,797) | 1,191 | |||||||||||||||||||||||||||
|
|
|
|
|
|
|
|
|
|
|
|
|
|
|
|
|
|
|
|||||||||||||||||||
| Net Income/(loss) |
$ | 563 | $ | 604 | $ | 461 | $ | (258) | $ | 205 | $ | (649) | $ | (1,130) | $ | (1,832) | $ | 569 | ||||||||||||||||||
|
|
|
|
|
|
|
|
|
|
|
|
|
|
|
|
|
|
|
|||||||||||||||||||
| SUPPLEMENTAL MORTGAGE FEES AND RELATED INCOME DETAILS |
||||||||||||||||||||||||||||||||||||
| Net production revenue: |
||||||||||||||||||||||||||||||||||||
| Production revenue |
$ | 1,582 | $ | 1,362 | $ | 1,432 | $ | 859 | $ | 1,090 | $ | 767 | $ | 679 | $ | 3,395 | $ | 3,440 | ||||||||||||||||||
| Repurchase losses |
(13) | (10) | (302) | (390) | (314) | (223) | (420) | (1,347) | (2,912) | |||||||||||||||||||||||||||
|
|
|
|
|
|
|
|
|
|
|
|
|
|
|
|
|
|
|
|||||||||||||||||||
| Net production revenue |
1,569 | 1,352 | 1,130 | 469 | 776 | 544 | 259 | 2,048 | 528 | |||||||||||||||||||||||||||
| Net mortgage servicing revenue: |
||||||||||||||||||||||||||||||||||||
| Operating revenue: |
||||||||||||||||||||||||||||||||||||
| Loan servicing revenue |
946 | 1,004 | 1,039 | 1,032 | 1,039 | 1,011 | 1,052 | 4,134 | 4,575 | |||||||||||||||||||||||||||
| Changes in MSR asset fair value due to modeled amortization |
(290) | (327) | (351) | (406) | (457) | (478) | (563) | (1,904) | (2,384) | |||||||||||||||||||||||||||
|
|
|
|
|
|
|
|
|
|
|
|
|
|
|
|
|
|
|
|||||||||||||||||||
| Total operating revenue |
656 | 677 | 688 | 626 | 582 | 533 | 489 | 2,230 | 2,191 | |||||||||||||||||||||||||||
| Risk management: |
||||||||||||||||||||||||||||||||||||
| Changes in MSR asset fair value due to market interest rates |
(323) | (1,193) | 644 | (263) | (4,574) | (932) | 379 | (5,390) | (2,224) | |||||||||||||||||||||||||||
| Other changes in MSR asset fair value due to inputs or assumptions in model (a) |
(5) | 76 | (48) | (569) | - | (28) | (1,130) | (1,727) | (44) | |||||||||||||||||||||||||||
| Derivative valuation adjustments and other |
479 | 1,353 | (406) | 460 | 4,596 | 983 | (486) | 5,553 | 3,404 | |||||||||||||||||||||||||||
|
|
|
|
|
|
|
|
|
|
|
|
|
|
|
|
|
|
|
|||||||||||||||||||
| Total risk management |
151 | 236 | 190 | (372) | 22 | 23 | (1,237) | (1,564) | 1,136 | |||||||||||||||||||||||||||
|
|
|
|
|
|
|
|
|
|
|
|
|
|
|
|
|
|
|
|||||||||||||||||||
| Total net mortgage servicing revenue |
807 | 913 | 878 | 254 | 604 | 556 | (748) | 666 | 3,327 | |||||||||||||||||||||||||||
|
|
|
|
|
|
|
|
|
|
|
|
|
|
|
|
|
|
|
|||||||||||||||||||
| Mortgage fees and related income |
$ | 2,376 | $ | 2,265 | $ | 2,008 | $ | 723 | $ | 1,380 | $ | 1,100 | $ | (489) | $ | 2,714 | $ | 3,855 | ||||||||||||||||||
|
|
|
|
|
|
|
|
|
|
|
|
|
|
|
|
|
|
|
|||||||||||||||||||
|
|
||||||||||||||||||||||||||||||||||||
| (a) | Represents the aggregate impact of changes in model inputs and assumptions such as costs to service, home prices, mortgage spreads, ancillary income, and assumptions used to derive prepayment speeds, as well as changes to the valuation models themselves. |
Page 8
| JPMORGAN CHASE & CO. |
| |
| CONSUMER & COMMUNITY BANKING | ||
| FINANCIAL HIGHLIGHTS, CONTINUED | ||
| (in millions, except ratio data and where otherwise noted) |
| QUARTERLY TRENDS | FULL YEAR | |||||||||||||||||||||||||||||||||||
| 3Q12 | 2Q12 | 1Q12 | 4Q11 | 3Q11 | 2Q11 | 1Q11 | 2011 | 2010 | ||||||||||||||||||||||||||||
| MORTGAGE PRODUCTION AND SERVICING (continued) |
||||||||||||||||||||||||||||||||||||
| SELECTED BALANCE SHEET DATA |
||||||||||||||||||||||||||||||||||||
| Period-end loans: |
||||||||||||||||||||||||||||||||||||
| Prime mortgage, including option ARMs (a) |
$ | 17,153 | $ | 17,454 | $ | 17,268 | $ | 16,891 | $ | 14,800 | $ | 14,260 | $ | 14,147 | $ | 16,891 | $ | 14,186 | ||||||||||||||||||
| Loans held-for-sale and loans at fair value (b) |
15,250 | 14,254 | 12,496 | 12,694 | 13,153 | 13,558 | 12,234 | 12,694 | 14,863 | |||||||||||||||||||||||||||
| Average loans: |
||||||||||||||||||||||||||||||||||||
| Prime mortgage, including option ARMs (a) |
17,381 | 17,478 | 17,238 | 15,733 | 14,451 | 14,083 | 14,037 | 14,580 | 13,422 | |||||||||||||||||||||||||||
| Loans held-for-sale and loans at fair value (b) |
17,879 | 17,694 | 15,621 | 16,680 | 16,608 | 14,613 | 17,519 | 16,354 | 15,395 | |||||||||||||||||||||||||||
| Average assets |
59,769 | 60,534 | 58,862 | 60,473 | 59,677 | 58,072 | 61,354 | 59,891 | 57,778 | |||||||||||||||||||||||||||
| Repurchase liability (period-end) |
2,779 | 2,997 | 3,213 | 3,213 | 3,213 | 3,213 | 3,205 | 3,213 | 3,000 | |||||||||||||||||||||||||||
| CREDIT DATA AND QUALITY STATISTICS |
||||||||||||||||||||||||||||||||||||
| Net charge-offs/(recoveries): |
||||||||||||||||||||||||||||||||||||
| Prime mortgage, including option ARMs |
4 | 1 | - | 1 | 2 | (2) | 4 | 5 | 41 | |||||||||||||||||||||||||||
| Net charge-off/(recovery) rate: |
||||||||||||||||||||||||||||||||||||
| Prime mortgage, including option ARMs |
0.09 | % | 0.02 | % | - | % | 0.03 | % | 0.06 | % | (0.06) | % | 0.12 | % | 0.03 | % | 0.31 | % | ||||||||||||||||||
| 30+ day delinquency rate (c) |
3.10 | 3.00 | 3.01 | 3.15 | 3.35 | 3.30 | 3.21 | 3.15 | 3.44 | |||||||||||||||||||||||||||
| Nonperforming assets (d) |
$ | 700 | $ | 708 | $ | 708 | $ | 716 | $ | 691 | $ | 662 | $ | 658 | $ | 716 | 729 | |||||||||||||||||||
| BUSINESS METRICS (in billions) |
||||||||||||||||||||||||||||||||||||
| Origination volume by channel |
||||||||||||||||||||||||||||||||||||
| Retail |
$ | 25.5 | $ | 26.1 | $ | 23.4 | $ | 23.1 | $ | 22.4 | $ | 20.7 | $ | 21.0 | $ | 87.2 | $ | 68.8 | ||||||||||||||||||
| Wholesale (e) |
- | 0.2 | - | 0.1 | 0.1 | 0.1 | 0.2 | 0.5 | 1.3 | |||||||||||||||||||||||||||
| Correspondent (e) |
20.1 | 16.5 | 14.2 | 14.9 | 13.4 | 10.3 | 13.5 | 52.1 | 75.3 | |||||||||||||||||||||||||||
| CNT (negotiated transactions) |
1.7 | 1.1 | 0.8 | 0.5 | 0.9 | 2.9 | 1.5 | 5.8 | 10.2 | |||||||||||||||||||||||||||
|
|
|
|
|
|
|
|
|
|
|
|
|
|
|
|
|
|
|
|||||||||||||||||||
| Total origination volume |
47.3 | 43.9 | 38.4 | 38.6 | 36.8 | 34.0 | 36.2 | 145.6 | 155.6 | |||||||||||||||||||||||||||
|
|
|
|
|
|
|
|
|
|
|
|
|
|
|
|
|
|
|
|||||||||||||||||||
| Application volume by channel |
||||||||||||||||||||||||||||||||||||
| Retail |
44.7 | 43.1 | 40.0 | 34.6 | 37.7 | 33.6 | 31.3 | 137.2 | 115.1 | |||||||||||||||||||||||||||
| Wholesale (e) |
0.2 | 0.1 | 0.2 | 0.2 | 0.2 | 0.3 | 0.3 | 1.0 | 2.4 | |||||||||||||||||||||||||||
| Correspondent (e) |
28.3 | 23.7 | 19.7 | 17.8 | 20.2 | 14.9 | 13.6 | 66.5 | 97.3 | |||||||||||||||||||||||||||
|
|
|
|
|
|
|
|
|
|
|
|
|
|
|
|
|
|
|
|||||||||||||||||||
| Total application volume |
73.2 | 66.9 | 59.9 | 52.6 | 58.1 | 48.8 | 45.2 | 204.7 | 214.8 | |||||||||||||||||||||||||||
|
|
|
|
|
|
|
|
|
|
|
|
|
|
|
|
|
|
|
|||||||||||||||||||
| Third-party mortgage loans serviced (period-end) |
811.4 | 860.0 | 884.2 | 902.2 | 924.5 | 940.8 | 955.0 | 902.2 | 967.5 | |||||||||||||||||||||||||||
| Third-party mortgage loans serviced (average) |
825.7 | 866.7 | 892.6 | 913.2 | 931.4 | 947.0 | 958.7 | 937.6 | 1,037.6 | |||||||||||||||||||||||||||
| MSR net carrying value (period-end) |
7.1 | 7.1 | 8.0 | 7.2 | 7.8 | 12.2 | 13.1 | 7.2 | 13.6 | |||||||||||||||||||||||||||
| Ratio of MSR net carrying value (period-end) to third-party mortgage loans serviced (period-end) |
0.88 | % | 0.83 | % | 0.90 | % | 0.80 | % | 0.84 | % | 1.30 | % | 1.37 | % | 0.80 | % | 1.41 | % | ||||||||||||||||||
| Ratio of annualized loan servicing-related revenue to third-party mortgage loans serviced (average) |
0.46 | 0.47 | 0.47 | 0.45 | 0.44 | 0.43 | 0.45 | 0.44 | 0.44 | |||||||||||||||||||||||||||
| MSR revenue multiple (f) |
1.91x | 1.77x | 1.91x | 1.78x | 1.91x | 3.02x | 3.04x | 1.82x | 3.20x | |||||||||||||||||||||||||||
|
|
||||||||||||||||||||||||||||||||||||
| (a) | Predominantly represents prime loans repurchased from Government National Mortgage Association (“Ginnie Mae”) pools, which are insured by U.S. government agencies. |
| (b) | Predominantly consists of prime mortgages originated with the intent to sell that are accounted for at fair value and classified as trading assets on the Consolidated Balance Sheets and Condensed Average Balance Sheets. |
| (c) | At September 30, 2012, June 30, 2012, March 31, 2012, December 31, 2011, September 30, 2011, June 30, 2011, March 31, 2011 and December 31, 2010, excluded mortgage loans insured by U.S. government agencies of $12.1 billion, $13.0 billion, $12.7 billion, $12.6 billion, $10.5 billion, $10.1 billion, $9.5 billion and $10.3 billion, respectively, that are 30 or more days past due. These amounts were excluded as reimbursement of insured amounts is proceeding normally. |
| (d) | At September 30, 2012, June 30, 2012, March 31, 2012, December 31, 2011, September 30, 2011, June 30, 2011, March 31, 2011 and December 31, 2010, nonperforming assets excluded: (1) mortgage loans insured by U.S. government agencies of $11.0 billion, $11.9 billion, $11.8 billion, $11.5 billion, $9.5 billion, $9.1 billion, $8.8 billion and $9.4 billion, respectively, that are 90 or more days past due; and (2) real estate owned insured by U.S. government agencies of $1.5 billion, $1.3 billion, $1.2 billion, $954 million, $2.4 billion, $2.4 billion, $2.3 billion and $1.9 billion, respectively. These amounts were excluded from nonaccrual loans as reimbursement of insured amounts is proceeding normally. |
| (e) | Includes rural housing loans sourced through brokers and correspondents, which are underwritten and closed with pre-funding loan approval from the U.S. Department of Agriculture Rural Development, which acts as the guarantor in the transaction. |
| (f) | Represents the ratio of MSR net carrying value (period-end) to third-party mortgage loans serviced (period-end) divided by the ratio of annualized loan servicing-related revenue to third-party mortgage loans serviced (average). |
Page 9
| JPMORGAN CHASE & CO. |
| |
| CONSUMER & COMMUNITY BANKING | ||
| FINANCIAL HIGHLIGHTS, CONTINUED | ||
| (in millions, except ratio data) |
| QUARTERLY TRENDS | FULL YEAR | |||||||||||||||||||||||||||||||||||
| 3Q12 | 2Q12 | 1Q12 | 4Q11 | 3Q11 | 2Q11 | 1Q11 | 2011 | 2010 | ||||||||||||||||||||||||||||
| REAL ESTATE PORTFOLIOS |
||||||||||||||||||||||||||||||||||||
| Noninterest revenue |
$ | 9 | $ | 13 | $ | 8 | $ | (13) | $ | 23 | $ | 20 | $ | 8 | $ | 38 | $ | 115 | ||||||||||||||||||
| Net interest income |
997 | 1,027 | 1,073 | 1,073 | 1,128 | 1,197 | 1,156 | 4,554 | 5,432 | |||||||||||||||||||||||||||
|
|
|
|
|
|
|
|
|
|
|
|
|
|
|
|
|
|
|
|||||||||||||||||||
| Total net revenue |
1,006 | 1,040 | 1,081 | 1,060 | 1,151 | 1,217 | 1,164 | 4,592 | 5,547 | |||||||||||||||||||||||||||
| Provision for credit losses |
520 | (554) | (192) | 646 | 899 | 954 | 1,076 | 3,575 | 8,231 | |||||||||||||||||||||||||||
| Noninterest expense |
386 | 412 | 419 | 432 | 363 | 371 | 355 | 1,521 | 1,627 | |||||||||||||||||||||||||||
|
|
|
|
|
|
|
|
|
|
|
|
|
|
|
|
|
|
|
|||||||||||||||||||
| Income/(loss) before income tax expense/(benefit) |
100 | 1,182 | 854 | (18) | (111) | (108) | (267) | (504) | (4,311) | |||||||||||||||||||||||||||
|
|
|
|
|
|
|
|
|
|
|
|
|
|
|
|
|
|
|
|||||||||||||||||||
| Net income/(loss) |
$ | 60 | $ | 717 | $ | 518 | $ | (11) | $ | (67) | $ | (66) | $ | (162) | $ | (306) | $ | (2,493) | ||||||||||||||||||
|
|
|
|
|
|
|
|
|
|
|
|
|
|
|
|
|
|
|
|||||||||||||||||||
| Overhead ratio |
38 | % | 40 | % | 39 | % | 41 | % | 32 | % | 30 | % | 30 | % | 33 | % | 29 | % | ||||||||||||||||||
| BUSINESS METRICS |
||||||||||||||||||||||||||||||||||||
| Loans, excluding PCI loans |
||||||||||||||||||||||||||||||||||||
| Period-end loans owned: |
||||||||||||||||||||||||||||||||||||
| Home equity |
$ | 69,686 | $ | 72,833 | $ | 75,207 | $ | 77,800 | $ | 80,278 | $ | 82,751 | $ | 85,253 | $ | 77,800 | $ | 88,385 | ||||||||||||||||||
| Prime mortgage, including option ARMs |
41,404 | 42,037 | 43,152 | 44,284 | 45,439 | 46,994 | 48,552 | 44,284 | 49,768 | |||||||||||||||||||||||||||
| Subprime mortgage |
8,552 | 8,945 | 9,289 | 9,664 | 10,045 | 10,441 | 10,841 | 9,664 | 11,287 | |||||||||||||||||||||||||||
| Other |
653 | 675 | 692 | 718 | 741 | 767 | 801 | 718 | 857 | |||||||||||||||||||||||||||
|
|
|
|
|
|
|
|
|
|
|
|
|
|
|
|
|
|
|
|||||||||||||||||||
| Total period-end loans owned |
$ | 120,295 | $ | 124,490 | $ | 128,340 | $ | 132,466 | $ | 136,503 | $ | 140,953 | $ | 145,447 | $ | 132,466 | $ | 150,297 | ||||||||||||||||||
| Average loans owned: |
||||||||||||||||||||||||||||||||||||
| Home equity |
$ | 71,620 | $ | 74,069 | $ | 76,600 | $ | 79,106 | $ | 81,568 | $ | 84,065 | $ | 86,907 | $ | 82,886 | $ | 94,835 | ||||||||||||||||||
| Prime mortgage, including option ARMs |
41,628 | 42,543 | 43,701 | 44,886 | 46,165 | 47,615 | 49,273 | 46,971 | 53,431 | |||||||||||||||||||||||||||
| Subprime mortgage |
8,774 | 9,123 | 9,485 | 9,880 | 10,268 | 10,667 | 11,086 | 10,471 | 12,729 | |||||||||||||||||||||||||||
| Other |
665 | 684 | 707 | 729 | 753 | 785 | 829 | 773 | 954 | |||||||||||||||||||||||||||
|
|
|
|
|
|
|
|
|
|
|
|
|
|
|
|
|
|
|
|||||||||||||||||||
| Total average loans owned |
$ | 122,687 | $ | 126,419 | $ | 130,493 | $ | 134,601 | $ | 138,754 | $ | 143,132 | $ | 148,095 | $ | 141,101 | $ | 161,949 | ||||||||||||||||||
| PCI loans |
||||||||||||||||||||||||||||||||||||
| Period-end loans owned: |
||||||||||||||||||||||||||||||||||||
| Home equity |
$ | 21,432 | $ | 21,867 | $ | 22,305 | $ | 22,697 | $ | 23,105 | $ | 23,535 | $ | 23,973 | $ | 22,697 | $ | 24,459 | ||||||||||||||||||
| Prime mortgage |
14,038 | 14,395 | 14,781 | 15,180 | 15,626 | 16,200 | 16,725 | 15,180 | 17,322 | |||||||||||||||||||||||||||
| Subprime mortgage |
4,702 | 4,784 | 4,870 | 4,976 | 5,072 | 5,187 | 5,276 | 4,976 | 5,398 | |||||||||||||||||||||||||||
| Option ARMs |
21,024 | 21,565 | 22,105 | 22,693 | 23,325 | 24,072 | 24,791 | 22,693 | 25,584 | |||||||||||||||||||||||||||
|
|
|
|
|
|
|
|
|
|
|
|
|
|
|
|
|
|
|
|||||||||||||||||||
| Total period-end loans owned |
$ | 61,196 | $ | 62,611 | $ | 64,061 | $ | 65,546 | $ | 67,128 | $ | 68,994 | $ | 70,765 | $ | 65,546 | $ | 72,763 | ||||||||||||||||||
| Average loans owned: |
||||||||||||||||||||||||||||||||||||
| Home equity |
$ | 21,620 | $ | 22,076 | $ | 22,488 | $ | 22,872 | $ | 23,301 | $ | 23,727 | $ | 24,170 | $ | 23,514 | $ | 25,455 | ||||||||||||||||||
| Prime mortgage |
14,185 | 14,590 | 14,975 | 15,405 | 15,909 | 16,456 | 16,974 | 16,181 | 18,526 | |||||||||||||||||||||||||||
| Subprime mortgage |
4,717 | 4,824 | 4,914 | 5,024 | 5,128 | 5,231 | 5,301 | 5,170 | 5,671 | |||||||||||||||||||||||||||
| Option ARMs |
21,237 | 21,823 | 22,395 | 23,009 | 23,666 | 24,420 | 25,113 | 24,045 | 27,220 | |||||||||||||||||||||||||||
|
|
|
|
|
|
|
|
|
|
|
|
|
|
|
|
|
|
|
|||||||||||||||||||
| Total average loans owned |
$ | 61,759 | $ | 63,313 | $ | 64,772 | $ | 66,310 | $ | 68,004 | $ | 69,834 | $ | 71,558 | $ | 68,910 | $ | 76,872 | ||||||||||||||||||
| Total Real Estate Portfolios |
||||||||||||||||||||||||||||||||||||
| Period-end loans owned: |
||||||||||||||||||||||||||||||||||||
| Home equity |
$ | 91,118 | $ | 94,700 | $ | 97,512 | $ | 100,497 | $ | 103,383 | $ | 106,286 | $ | 109,226 | $ | 100,497 | $ | 112,844 | ||||||||||||||||||
| Prime mortgage, including option ARMs |
76,466 | 77,997 | 80,038 | 82,157 | 84,390 | 87,266 | 90,068 | 82,157 | 92,674 | |||||||||||||||||||||||||||
| Subprime mortgage |
13,254 | 13,729 | 14,159 | 14,640 | 15,117 | 15,628 | 16,117 | 14,640 | 16,685 | |||||||||||||||||||||||||||
| Other |
653 | 675 | 692 | 718 | 741 | 767 | 801 | 718 | 857 | |||||||||||||||||||||||||||
|
|
|
|
|
|
|
|
|
|
|
|
|
|
|
|
|
|
|
|||||||||||||||||||
| Total period-end loans owned |
$ | 181,491 | $ | 187,101 | $ | 192,401 | $ | 198,012 | $ | 203,631 | $ | 209,947 | $ | 216,212 | $ | 198,012 | $ | 223,060 | ||||||||||||||||||
| Average loans owned: |
||||||||||||||||||||||||||||||||||||
| Home equity |
$ | 93,240 | $ | 96,145 | $ | 99,088 | $ | 101,978 | $ | 104,869 | $ | 107,792 | $ | 111,077 | $ | 106,400 | $ | 120,290 | ||||||||||||||||||
| Prime mortgage, including option ARMs |
77,050 | 78,956 | 81,071 | 83,300 | 85,740 | 88,491 | 91,360 | 87,197 | 99,177 | |||||||||||||||||||||||||||
| Subprime mortgage |
13,491 | 13,947 | 14,399 | 14,904 | 15,396 | 15,898 | 16,387 | 15,641 | 18,400 | |||||||||||||||||||||||||||
| Other |
665 | 684 | 707 | 729 | 753 | 785 | 829 | 773 | 954 | |||||||||||||||||||||||||||
|
|
|
|
|
|
|
|
|
|
|
|
|
|
|
|
|
|
|
|||||||||||||||||||
| Total average loans owned |
$ | 184,446 | $ | 189,732 | $ | 195,265 | $ | 200,911 | $ | 206,758 | $ | 212,966 | $ | 219,653 | $ | 210,011 | $ | 238,821 | ||||||||||||||||||
| Average assets |
173,613 | 177,698 | 182,254 | 187,651 | 193,692 | 200,116 | 207,175 | 197,096 | 226,961 | |||||||||||||||||||||||||||
| Home equity origination volume |
375 | 360 | 312 | 277 | 294 | 307 | 249 | 1,127 | 1,203 | |||||||||||||||||||||||||||
Page 10
| JPMORGAN CHASE & CO. |
| |
| CONSUMER & COMMUNITY BANKING | ||
| FINANCIAL HIGHLIGHTS, CONTINUED | ||
| (in millions, except ratio data) |
| QUARTERLY TRENDS | FULL YEAR | |||||||||||||||||||||||||||||||||||
| 3Q12 | 2Q12 | 1Q12 | 4Q11 | 3Q11 | 2Q11 | 1Q11 | 2011 | 2010 | ||||||||||||||||||||||||||||
| REAL ESTATE PORTFOLIOS (continued) |
||||||||||||||||||||||||||||||||||||
| CREDIT DATA AND QUALITY STATISTICS |
||||||||||||||||||||||||||||||||||||
| Net charge-offs, excluding PCI loans (a) |
||||||||||||||||||||||||||||||||||||
| Home equity |
$ | 1,120 | $ | 466 | $ | 542 | $ | 579 | $ | 581 | $ | 592 | $ | 720 | $ | 2,472 | $ | 3,444 | ||||||||||||||||||
| Prime mortgage, including option ARMs |
143 | 114 | 131 | 151 | 172 | 198 | 161 | 682 | 1,573 | |||||||||||||||||||||||||||
| Subprime mortgage |
152 | 112 | 130 | 143 | 141 | 156 | 186 | 626 | 1,374 | |||||||||||||||||||||||||||
| Other |
5 | 4 | 5 | 3 | 5 | 8 | 9 | 25 | 59 | |||||||||||||||||||||||||||
|
|
|
|
|
|
|
|
|
|
|
|
|
|
|
|
|
|
|
|||||||||||||||||||
| Total net charge-offs |
$ | 1,420 | $ | 696 | $ | 808 | $ | 876 | $ | 899 | $ | 954 | $ | 1,076 | $ | 3,805 | $ | 6,450 | ||||||||||||||||||
| Net charge-off rate, excluding PCI loans (a) |
||||||||||||||||||||||||||||||||||||
| Home equity |
6.22 | % | 2.53 | % | 2.85 | % | 2.90 | % | 2.82 | % | 2.83 | % | 3.36 | % | 2.98 | % | 3.63 | % | ||||||||||||||||||
| Prime mortgage, including option ARMs |
1.37 | 1.08 | 1.21 | 1.33 | 1.48 | 1.67 | 1.32 | 1.45 | 2.95 | |||||||||||||||||||||||||||
| Subprime mortgage |
6.89 | 4.94 | 5.51 | 5.74 | 5.43 | 5.85 | 6.80 | 5.98 | 10.82 | |||||||||||||||||||||||||||
| Other |
2.99 | 2.35 | 2.84 | 1.63 | 2.83 | 4.01 | 4.56 | 3.23 | 5.90 | |||||||||||||||||||||||||||
| Total net charge-off rate, excluding PCI loans |
4.60 | 2.21 | 2.49 | 2.58 | 2.57 | 2.67 | 2.95 | 2.70 | 3.98 | |||||||||||||||||||||||||||
| Net charge-off rate - reported (a) |
||||||||||||||||||||||||||||||||||||
| Home equity |
4.78 | % | 1.95 | % | 2.20 | % | 2.25 | % | 2.20 | % | 2.20 | % | 2.63 | % | 2.32 | % | 2.86 | % | ||||||||||||||||||
| Prime mortgage, including option ARMs |
0.74 | 0.58 | 0.65 | 0.72 | 0.80 | 0.90 | 0.71 | 0.78 | 1.59 | |||||||||||||||||||||||||||
| Subprime mortgage |
4.48 | 3.23 | 3.63 | 3.81 | 3.63 | 3.94 | 4.60 | 4.00 | 7.47 | |||||||||||||||||||||||||||
| Other |
2.99 | 2.35 | 2.84 | 1.63 | 2.83 | 4.01 | 4.56 | 3.23 | 5.90 | |||||||||||||||||||||||||||
| Total net charge-off rate - reported |
3.06 | 1.48 | 1.66 | 1.73 | 1.72 | 1.80 | 1.99 | 1.81 | 2.70 | |||||||||||||||||||||||||||
| 30+ day delinquency rate, excluding PCI loans (b) |
5.12 | % | 5.16 | % | 5.32 | % | 5.69 | % | 5.80 | % | 5.98 | % | 6.22 | % | 5.69 | % | 6.45 | % | ||||||||||||||||||
| Allowance for loan losses, excluding PCI loans |
$ | 5,568 | $ | 6,468 | $ | 7,718 | $ | 8,718 | $ | 9,718 | $ | 9,718 | $ | 9,718 | $ | 8,718 | $ | 9,718 | ||||||||||||||||||
| Allowance for PCI loans |
5,711 | 5,711 | 5,711 | 5,711 | 4,941 | 4,941 | 4,941 | 5,711 | 4,941 | |||||||||||||||||||||||||||
|
|
|
|
|
|
|
|
|
|
|
|
|
|
|
|
|
|
|
|||||||||||||||||||
| Allowance for loan losses |
$ | 11,279 | $ | 12,179 | $ | 13,429 | $ | 14,429 | $ | 14,659 | $ | 14,659 | $ | 14,659 | $ | 14,429 | $ | 14,659 | ||||||||||||||||||
| Nonperforming assets (c)(d)(e) |
8,669 | 7,340 | 7,738 | 6,638 | 7,112 | 7,729 | 8,152 | 6,638 | 8,424 | |||||||||||||||||||||||||||
| Allowance for loan losses to period-end loans retained |
6.21 | % | 6.51 | % | 6.98 | % | 7.29 | % | 7.20 | % | 6.98 | % | 6.78 | % | 7.29 | % | 6.57 | % | ||||||||||||||||||
| Allowance for loan losses to period-end loans retained, excluding PCI loans |
4.63 | 5.20 | 6.01 | 6.58 | 7.12 | 6.90 | 6.68 | 6.58 | 6.47 | |||||||||||||||||||||||||||
|
|
||||||||||||||||||||||||||||||||||||
| (a) | Net charge-offs and net charge-off rates for the three months ended September 30, 2012 included $825 million of incremental charge-offs of Chapter 7 loans. Excluding these incremental charges-offs, for the third quarter of 2012, net charge-offs would have been $402 million, $97 million and $91 million for the home equity, prime mortgage, including option ARMs, and subprime mortgage portfolios, respectively. Net charge-off rates for the same period excluding these incremental charge-offs and PCI loans would have been 2.23%, 0.93% and 4.13% for the home equity, prime mortgage, including option ARMs, and subprime mortgage portfolios, respectively. For further information, see Consumer and Credit Portfolio on pages 84-86 of JPMorgan Chase’s third quarter 2012 Form 10-Q. |
| (b) | The delinquency rate for PCI loans was 20.65%, 21.38%, 21.72%, 23.30%, 24.44%, 26.20%, 27.36% and 28.20% at September 30, 2012, June 30, 2012, March 31, 2012, December 31, 2011, September 30, 2011, June 30, 2011, March 31, 2011 and December 31, 2010, respectively. |
| (c) | Excludes PCI loans. Because the Firm is recognizing interest income on each pool of PCI loans, they are all considered to be performing. |
| (d) | Nonperforming assets at September 30, 2012 included Chapter 7 loans, based upon regulatory guidance. |
| (e) | Beginning March 31, 2012, and for all periods thereafter, nonperforming assets included performing junior liens that are subordinate to senior liens that are 90 days or more past due based on regulatory guidance issued in the first quarter of 2012. For further information, see footnote (g) on page 6. |
Page 11
| JPMORGAN CHASE & CO. |
| |
| CONSUMER & COMMUNITY BANKING | ||
| FINANCIAL HIGHLIGHTS, CONTINUED | ||
| (in millions, except ratio data and where otherwise noted) |
| QUARTERLY TRENDS | FULL YEAR | |||||||||||||||||||||||||||||||||||
| 3Q12 | 2Q12 | 1Q12 | 4Q11 | 3Q11 | 2Q11 | 1Q11 | 2011 | 2010 | ||||||||||||||||||||||||||||
| CARD, MERCHANT SERVICES & AUTO (a) |
||||||||||||||||||||||||||||||||||||
| Credit card income |
$ | 1,032 | $ | 1,015 | $ | 948 | $ | 1,053 | $ | 1,053 | $ | 1,123 | $ | 898 | $ | 4,127 | $ | 3,514 | ||||||||||||||||||
| All other income |
248 | 231 | 303 | 232 | 201 | 183 | 149 | 765 | 764 | |||||||||||||||||||||||||||
|
|
|
|
|
|
|
|
|
|
|
|
|
|
|
|
|
|
|
|||||||||||||||||||
| Noninterest revenue |
1,280 | 1,246 | 1,251 | 1,285 | 1,254 | 1,306 | 1,047 | 4,892 | 4,278 | |||||||||||||||||||||||||||
| Net interest income |
3,443 | 3,279 | 3,463 | 3,529 | 3,521 | 3,455 | 3,744 | 14,249 | 16,194 | |||||||||||||||||||||||||||
|
|
|
|
|
|
|
|
|
|
|
|
|
|
|
|
|
|
|
|||||||||||||||||||
| Total net revenue |
4,723 | 4,525 | 4,714 | 4,814 | 4,775 | 4,761 | 4,791 | 19,141 | 20,472 | |||||||||||||||||||||||||||
| Provision for credit losses |
1,231 | 734 | 738 | 1,060 | 1,264 | 944 | 353 | 3,621 | 8,570 | |||||||||||||||||||||||||||
| Noninterest expense |
1,920 | 2,096 | 2,029 | 2,025 | 2,115 | 1,988 | 1,917 | 8,045 | 7,178 | |||||||||||||||||||||||||||
|
|
|
|
|
|
|
|
|
|
|
|
|
|
|
|
|
|
|
|||||||||||||||||||
| Income before income tax expense |
1,572 | 1,695 | 1,947 | 1,729 | 1,396 | 1,829 | 2,521 | 7,475 | 4,724 | |||||||||||||||||||||||||||
|
|
|
|
|
|
|
|
|
|
|
|
|
|
|
|
|
|
|
|||||||||||||||||||
| Net income |
$ | 954 | $ | 1,030 | $ | 1,183 | $ | 1,051 | $ | 849 | $ | 1,110 | $ | 1,534 | $ | 4,544 | $ | 2,872 | ||||||||||||||||||
|
|
|
|
|
|
|
|
|
|
|
|
|
|
|
|
|
|
|
|||||||||||||||||||
| Overhead ratio |
41 | % | 46 | % | 43 | % | 42 | % | 44 | % | 42 | % | 40 | % | 42 | % | 35 | % | ||||||||||||||||||
| SELECTED BALANCE SHEET DATA (period-end) |
||||||||||||||||||||||||||||||||||||
| Loans: |
||||||||||||||||||||||||||||||||||||
| Credit Card |
$ | 124,537 | $ | 124,705 | $ | 125,331 | $ | 132,277 | $ | 127,135 | $ | 125,523 | $ | 128,803 | $ | 132,277 | $ | 137,676 | ||||||||||||||||||
| Auto |
48,920 | 48,468 | 48,245 | 47,426 | 46,659 | 46,796 | 47,411 | 47,426 | 48,367 | |||||||||||||||||||||||||||
| Student |
11,868 | 12,232 | 13,162 | 13,425 | 13,751 | 14,003 | 14,288 | 13,425 | 14,454 | |||||||||||||||||||||||||||
|
|
|
|
|
|
|
|
|
|
|
|
|
|
|
|
|
|
|
|||||||||||||||||||
| Total loans |
$ | 185,325 | $ | 185,405 | $ | 186,738 | $ | 193,128 | $ | 187,545 | $ | 186,322 | $ | 190,502 | $ | 193,128 | $ | 200,497 | ||||||||||||||||||
| SELECTED BALANCE SHEET DATA (average) |
||||||||||||||||||||||||||||||||||||
| Total assets |
$ | 196,302 | $ | 197,301 | $ | 199,449 | $ | 202,226 | $ | 199,974 | $ | 198,044 | $ | 204,441 | $ | 201,162 | $ | 213,041 | ||||||||||||||||||
| Loans: |
||||||||||||||||||||||||||||||||||||
| Credit Card |
124,339 | 125,195 | 127,616 | 128,619 | 126,536 | 125,038 | 132,537 | 128,167 | 144,367 | |||||||||||||||||||||||||||
| Auto |
48,399 | 48,273 | 47,704 | 46,947 | 46,549 | 46,966 | 47,690 | 47,034 | 47,603 | |||||||||||||||||||||||||||
| Student |
12,037 | 12,944 | 13,348 | 13,543 | 13,865 | 14,135 | 14,410 | 13,986 | 15,945 | |||||||||||||||||||||||||||
|
|
|
|
|
|
|
|
|
|
|
|
|
|
|
|
|
|
|
|||||||||||||||||||
| Total loans |
$ | 184,775 | $ | 186,412 | $ | 188,668 | $ | 189,109 | $ | 186,950 | $ | 186,139 | $ | 194,637 | $ | 189,187 | $ | 207,915 | ||||||||||||||||||
| BUSINESS METRICS |
||||||||||||||||||||||||||||||||||||
| Credit Card, excluding Commercial Card |
||||||||||||||||||||||||||||||||||||
| Sales volume (in billions) |
$ | 96.6 | $ | 96.0 | $ | 86.9 | $ | 93.4 | $ | 87.3 | $ | 85.5 | $ | 77.5 | $ | 343.7 | $ | 313.0 | ||||||||||||||||||
| New accounts opened |
1.6 | 1.6 | 1.7 | 2.2 | 2.0 | 2.0 | 2.6 | 8.8 | 11.3 | |||||||||||||||||||||||||||
| Open accounts |
63.9 | 63.7 | 64.2 | 65.2 | 64.3 | 65.4 | (b) | 91.9 | 65.2 | 90.7 | ||||||||||||||||||||||||||
| Number of accounts with sales activity |
29.1 | 29.3 | 29.0 | 30.7 | 28.6 | 28.8 | 35.1 | 30.7 | 39.9 | |||||||||||||||||||||||||||
| % of accounts acquired online |
52 | % | 49 | % | 46 | % | 44 | % | 35 | % | 29 | % | 22 | % | 32 | % | 15 | % | ||||||||||||||||||
| Merchant Services |
||||||||||||||||||||||||||||||||||||
| Merchant processing volume (in billions) |
$ | 163.6 | $ | 160.2 | $ | 152.8 | $ | 152.6 | $ | 138.1 | $ | 137.3 | $ | 125.7 | $ | 553.7 | $ | 469.3 | ||||||||||||||||||
| Total transactions (in billions) |
7.4 | 7.1 | 6.8 | 6.8 | 6.1 | 5.9 | 5.6 | 24.4 | 20.5 | |||||||||||||||||||||||||||
| Auto and Student |
||||||||||||||||||||||||||||||||||||
| Origination volume (in billions) |
||||||||||||||||||||||||||||||||||||
| Auto |
$ | 6.3 | $ | 5.8 | $ | 5.8 | $ | 4.9 | $ | 5.9 | $ | 5.4 | $ | 4.8 | $ | 21.0 | $ | 23.0 | ||||||||||||||||||
| Student |
0.1 | - | 0.1 | 0.1 | 0.1 | - | 0.1 | 0.3 | 1.9 | |||||||||||||||||||||||||||
|
|
||||||||||||||||||||||||||||||||||||
| (a) | Effective January 1, 2011, the commercial card business that was previously in CIB was transferred to CCB. There is no material impact on the financial data; prior-year periods were not revised. |
| (b) | The decrease in the second quarter of 2011 reflected the impact of portfolio sales. |
Page 12
| JPMORGAN CHASE & CO. |
| |
| CONSUMER & COMMUNITY BANKING | ||
| FINANCIAL HIGHLIGHTS, CONTINUED | ||
| (in millions, except ratio data) |
| QUARTERLY TRENDS | FULL YEAR | |||||||||||||||||||||||||||||||||||||
| 3Q12 | 2Q12 | 1Q12 | 4Q11 | 3Q11 | 2Q11 | 1Q11 | 2011 | 2010 | ||||||||||||||||||||||||||||||
| CARD, MERCHANT SERVICES & AUTO (continued) (a) |
||||||||||||||||||||||||||||||||||||||
| CREDIT DATA AND QUALITY STATISTICS |
||||||||||||||||||||||||||||||||||||||
| Net charge-offs: |
||||||||||||||||||||||||||||||||||||||
| Credit Card |
$ | 1,116 | $ | 1,345 | $ | 1,386 | $ | 1,390 | $ | 1,499 | $ | 1,810 | $ | 2,226 | $ | 6,925 | $ | 14,037 | ||||||||||||||||||||
| Auto (b) |
90 | 21 | 33 | 44 | 42 | 19 | 47 | 152 | 298 | |||||||||||||||||||||||||||||
| Student |
80 | 119 | 69 | 126 | 93 | 135 | 80 | 434 | 387 | |||||||||||||||||||||||||||||
|
|
|
|
|
|
|
|
|
|
|
|
|
|
|
|
|
|
|
|||||||||||||||||||||
| Total net charge-offs |
1,286 | 1,485 | 1,488 | 1,560 | 1,634 | 1,964 | 2,353 | 7,511 | 14,722 | |||||||||||||||||||||||||||||
| Net charge-off rate: |
||||||||||||||||||||||||||||||||||||||
| Credit Card (c) |
3.57 | % | 4.35 | % | 4.40 | % | 4.29 | % | 4.70 | % | 5.82 | % | 6.97 | % | 5.44 | % | 9.73 | % | ||||||||||||||||||||
| Auto (b) |
0.74 | 0.17 | 0.28 | 0.37 | 0.36 | 0.16 | 0.40 | 0.32 | 0.63 | |||||||||||||||||||||||||||||
| Student (d) |
2.64 | 3.70 | 2.08 | 3.69 | 2.66 | 3.83 | 2.25 | 3.10 | 2.61 | |||||||||||||||||||||||||||||
| Total net charge-off rate |
2.77 | 3.22 | 3.19 | 3.27 | 3.47 | 4.24 | 4.98 | 3.99 | 7.12 | |||||||||||||||||||||||||||||
| Delinquency rates |
||||||||||||||||||||||||||||||||||||||
| 30+ day delinquency rate: |
||||||||||||||||||||||||||||||||||||||
| Credit Card (e) |
2.15 | 2.14 | 2.56 | 2.81 | 2.90 | 2.98 | 3.57 | 2.81 | 4.14 | |||||||||||||||||||||||||||||
| Auto |
1.11 | 0.90 | 0.79 | 1.13 | 1.01 | 0.98 | 0.97 | 1.13 | 1.22 | |||||||||||||||||||||||||||||
| Student (f) |
2.38 | 1.95 | 2.06 | 1.78 | 1.93 | 1.70 | 2.01 | 1.78 | 1.53 | |||||||||||||||||||||||||||||
| Total 30+ day delinquency rate |
1.89 | 1.80 | 2.07 | 2.32 | 2.36 | 2.38 | 2.79 | 2.32 | 3.23 | |||||||||||||||||||||||||||||
| 90+ day delinquency rate - Credit Card (e) |
0.99 | 1.04 | 1.37 | 1.44 | 1.43 | 1.55 | 1.93 | 1.44 | 2.25 | |||||||||||||||||||||||||||||
| Nonperforming assets (b)(g) |
$ | 284 | $ | 219 | $ | 242 | $ | 228 | $ | 232 | $ | 233 | $ | 275 | $ | 228 | $ | 269 | ||||||||||||||||||||
| Allowance for loan losses: |
||||||||||||||||||||||||||||||||||||||
| Credit Card |
5,503 | 5,499 | 6,251 | 6,999 | 7,528 | 8,042 | 9,041 | 6,999 | 11,034 | |||||||||||||||||||||||||||||
| Auto and Student |
954 | 1,009 | 1,010 | 1,010 | 1,009 | 879 | 899 | 1,010 | 899 | |||||||||||||||||||||||||||||
|
|
|
|
|
|
|
|
|
|
|
|
|
|
|
|
|
|
|
|||||||||||||||||||||
| Total allowance for loan losses |
6,457 | 6,508 | 7,261 | 8,009 | 8,537 | 8,921 | 9,940 | 8,009 | 11,933 | |||||||||||||||||||||||||||||
| Allowance for loan losses to period-end loans: |
||||||||||||||||||||||||||||||||||||||
| Credit Card (e) |
4.42 | % | 4.41 | % | 5.02 | % | 5.30 | % | 5.93 | % | 6.41 | % | 7.24 | % | 5.30 | % | 8.14 | % | ||||||||||||||||||||
| Auto and Student |
1.57 | 1.66 | 1.64 | 1.66 | 1.67 | 1.45 | 1.46 | 1.66 | 1.43 | |||||||||||||||||||||||||||||
| Total allowance for loan losses to period-end loans |
3.49 | 3.51 | 3.91 | 4.15 | 4.55 | 4.79 | 5.33 | 4.15 | 6.02 | |||||||||||||||||||||||||||||
| CARD SERVICES SUPPLEMENTAL INFORMATION |
||||||||||||||||||||||||||||||||||||||
| Noninterest revenue |
$ | 971 | $ | 953 | $ | 949 | $ | 985 | $ | 957 | $ | 1,016 | $ | 782 | $ | 3,740 | $ | 3,277 | ||||||||||||||||||||
| Net interest income |
2,923 | 2,755 | 2,928 | 2,989 | 2,984 | 2,911 | 3,200 | 12,084 | 13,886 | |||||||||||||||||||||||||||||
|
|
|
|
|
|
|
|
|
|
|
|
|
|
|
|
|
|
|
|||||||||||||||||||||
| Total net revenue |
3,894 | 3,708 | 3,877 | 3,974 | 3,941 | 3,927 | 3,982 | 15,824 | 17,163 | |||||||||||||||||||||||||||||
| Provision for credit losses |
1,116 | 595 | 636 | 890 | 999 | 810 | 226 | 2,925 | 8,037 | |||||||||||||||||||||||||||||
| Noninterest expense |
1,517 | 1,703 | 1,636 | 1,633 | 1,734 | 1,622 | 1,555 | 6,544 | 5,797 | |||||||||||||||||||||||||||||
|
|
|
|
|
|
|
|
|
|
|
|
|
|
|
|
|
|
|
|||||||||||||||||||||
| Income before income tax expense |
1,261 | 1,410 | 1,605 | 1,451 | 1,208 | 1,495 | 2,201 | 6,355 | 3,329 | |||||||||||||||||||||||||||||
|
|
|
|
|
|
|
|
|
|
|
|
|
|
|
|
|
|
|
|||||||||||||||||||||
| Net income |
$ | 769 | $ | 860 | $ | 979 | $ | 885 | $ | 737 | $ | 911 | $ | 1,343 | $ | 3,876 | $ | 2,074 | ||||||||||||||||||||
|
|
|
|
|
|
|
|
|
|
|
|
|
|
|
|
|
|
|
|||||||||||||||||||||
| Percentage of average loans: |
||||||||||||||||||||||||||||||||||||||
| Noninterest revenue |
3.11 | % | 3.06 | % | 2.99 | % | 3.04 | % | 3.00 | % | 3.26 | % | 2.39 | % | 2.92 | % | 2.27 | % | ||||||||||||||||||||
| Net interest income |
9.35 | 8.85 | 9.23 | 9.22 | 9.36 | 9.34 | 9.79 | 9.43 | 9.62 | |||||||||||||||||||||||||||||
| Total net revenue |
12.46 | 11.91 | 12.22 | 12.26 | 12.36 | 12.60 | 12.18 | 12.35 | 11.89 | |||||||||||||||||||||||||||||
|
|
||||||||||||||||||||||||||||||||||||||
| (a) | Effective January 1, 2011, the commercial card business that was previously in CIB was transferred to CCB. There is no material impact on the financial data; prior-year periods were not revised. |
| (b) | Net charge-offs and net charge-off rates for the three months ended September 30, 2012 included $55 million of incremental charge-offs of Chapter 7 loans. Excluding these incremental charge-offs, for the third quarter of 2012, net charge-offs would have been $35 million, and the net charge-off rate would have been 0.29%. Nonperforming assets at September 30, 2012 included $65 million of Chapter 7 loans, based upon regulatory guidance. |
| (c) | Average credit card loans included loans held-for-sale of $109 million, $782 million, $821 million, $97 million, $1 million, $276 million and $3.0 billion for the three months ended September 30, 2012, June 30, 2012, March 31, 2012, December 31, 2011, September 30, 2011, June 30, 2011 and March 31, 2011, respectively, and $833 million and $148 million for full year 2011 and 2010, respectively. These amounts are excluded when calculating the net charge-off rate. |
| (d) | Average student loans included loans held-for-sale of $1.1 billion for full year 2010. There were no loans held-for-sale for all other periods. This amount is excluded when calculating the net charge-off rate. |
| (e) | Period-end credit card loans included loans held-for-sale of $106 million, $112 million, $856 million, $102 million, $94 million, $4.0 billion and $2.2 billion at September 30, 2012, June 30, 2012, March 31, 2012, December 31, 2011, September 30, 2011, March 31, 2011 and December 31, 2010, respectively. There were no loans held-for-sale at June 30, 2011. No allowance for loan losses was recorded for these loans. These amounts are excluded when calculating delinquency rates and the allowance for loan losses to period-end loans. |
| (f) | Excluded student loans insured by U.S. government agencies under the FFELP of $910 million, $931 million, $1.0 billion, $989 million, $995 million, $968 million, $1.0 billion and $1.1 billion at September 30, 2012, June 30, 2012, March 31, 2012, December 31, 2011, September 30, 2011, June 30, 2011, March 31, 2011 and December 31, 2010, respectively, that are 30 or more days past due. These amounts are excluded as reimbursement of insured amounts is proceeding normally. |
| (g) | Nonperforming assets excluded student loans insured by U.S. government agencies under the FFELP of $536 million, $547 million, $586 million, $551 million, $567 million, $558 million, $615 million and $625 million at September 30, 2012, June 30, 2012, March 31, 2012, December 31, 2011, September 30, 2011, June 30, 2011, March 31, 2011 and December 31, 2010, respectively, that are 90 or more days past due. These amounts are excluded as reimbursement of insured amounts is proceeding normally. |
Page 13
| JPMORGAN CHASE & CO. |
| |
| CORPORATE & INVESTMENT BANK | ||
| FINANCIAL HIGHLIGHTS | ||
| (in millions, except ratio data) |
| QUARTERLY TRENDS | FULL YEAR | |||||||||||||||||||||||||||||||||||||
| 3Q12 | 2Q12 | 1Q12 | 4Q11 | 3Q11 | 2Q11 | 1Q11 | 2011 | 2010 | ||||||||||||||||||||||||||||||
| INCOME STATEMENT |
||||||||||||||||||||||||||||||||||||||
| REVENUE |
||||||||||||||||||||||||||||||||||||||
| Investment banking fees |
$ | 1,429 | $ | 1,245 | $ | 1,375 | $ | 1,119 | $ | 1,039 | $ | 1,922 | $ | 1,779 | $ | 5,859 | $ | 6,186 | ||||||||||||||||||||
| Principal transactions (a) |
2,263 | 3,070 | 3,211 | 371 | 2,260 | 2,314 | 3,402 | 8,347 | 8,474 | |||||||||||||||||||||||||||||
| Lending- and deposit-related fees |
486 | 488 | 475 | 529 | 520 | 532 | 517 | 2,098 | 2,075 | |||||||||||||||||||||||||||||
| Asset management, administration and commissions |
1,104 | 1,207 | 1,219 | 1,148 | 1,219 | 1,274 | 1,314 | 4,955 | 5,110 | |||||||||||||||||||||||||||||
| All other income |
290 | 251 | 208 | 159 | 371 | 406 | 328 | 1,264 | 1,044 | |||||||||||||||||||||||||||||
|
|
|
|
|
|
|
|
|
|
|
|
|
|
|
|
|
|
|
|||||||||||||||||||||
| Noninterest revenue |
5,572 | 6,261 | 6,488 | 3,326 | 5,409 | 6,448 | 7,340 | 22,523 | 22,889 | |||||||||||||||||||||||||||||
| Net interest income |
2,788 | 2,725 | 2,850 | 2,994 | 2,877 | 2,830 | 2,760 | 11,461 | 10,588 | |||||||||||||||||||||||||||||
|
|
|
|
|
|
|
|
|
|
|
|
|
|
|
|
|
|
|
|||||||||||||||||||||
| TOTAL NET REVENUE (b) |
8,360 | 8,986 | 9,338 | 6,320 | 8,286 | 9,278 | 10,100 | 33,984 | 33,477 | |||||||||||||||||||||||||||||
| Provision for credit losses |
(60) | 29 | (3) | 291 | 34 | (185) | (425) | (285) | (1,247) | |||||||||||||||||||||||||||||
| NONINTEREST EXPENSE |
||||||||||||||||||||||||||||||||||||||
| Compensation expense |
2,755 | 2,718 | 3,623 | 1,832 | 2,555 | 3,271 | 3,996 | 11,654 | 12,418 | |||||||||||||||||||||||||||||
| Noncompensation expense |
2,595 | 2,575 | 2,588 | 2,700 | 2,714 | 2,514 | 2,397 | 10,325 | 10,451 | |||||||||||||||||||||||||||||
|
|
|
|
|
|
|
|
|
|
|
|
|
|
|
|
|
|
|
|||||||||||||||||||||
| TOTAL NONINTEREST EXPENSE |
5,350 | 5,293 | 6,211 | 4,532 | 5,269 | 5,785 | 6,393 | 21,979 | 22,869 | |||||||||||||||||||||||||||||
|
|
|
|
|
|
|
|
|
|
|
|
|
|
|
|
|
|
|
|||||||||||||||||||||
| Income before income tax expense |
3,070 | 3,664 | 3,130 | 1,497 | 2,983 | 3,678 | 4,132 | 12,290 | 11,855 | |||||||||||||||||||||||||||||
| Income tax expense |
1,078 | 1,288 | 1,097 | 521 | 1,042 | 1,288 | 1,446 | 4,297 | 4,137 | |||||||||||||||||||||||||||||
|
|
|
|
|
|
|
|
|
|
|
|
|
|
|
|
|
|
|
|||||||||||||||||||||
| NET INCOME |
$ | 1,992 | $ | 2,376 | $ | 2,033 | $ | 976 | $ | 1,941 | $ | 2,390 | $ | 2,686 | $ | 7,993 | $ | 7,718 | ||||||||||||||||||||
|
|
|
|
|
|
|
|
|
|
|
|
|
|
|
|
|
|
|
|||||||||||||||||||||
| FINANCIAL RATIOS |
||||||||||||||||||||||||||||||||||||||
| ROE (c) |
17 | % | 20 | % | 17 | % | 8 | % | 16 | % | 20 | % | 23 | % | 17 | % | 17 | % | ||||||||||||||||||||
| Overhead ratio |
64 | 59 | 67 | 72 | 64 | 62 | 63 | 65 | 68 | |||||||||||||||||||||||||||||
| Compensation expense as a percent of total net revenue (d) |
33 | 30 | 39 | 29 | 31 | 35 | 40 | 34 | 37 | |||||||||||||||||||||||||||||
| REVENUE BY BUSINESS |
||||||||||||||||||||||||||||||||||||||
| Advisory |
$ | 389 | $ | 356 | $ | 281 | $ | 397 | $ | 365 | $ | 601 | $ | 429 | $ | 1,792 | $ | 1,469 | ||||||||||||||||||||
| Equity underwriting |
235 | 250 | 276 | 169 | 178 | 455 | 379 | 1,181 | 1,589 | |||||||||||||||||||||||||||||
| Debt underwriting |
805 | 639 | 818 | 553 | 496 | 866 | 971 | 2,886 | 3,128 | |||||||||||||||||||||||||||||
|
|
|
|
|
|
|
|
|
|
|
|
|
|
|
|
|
|
|
|||||||||||||||||||||
| Total investment banking fees |
1,429 | 1,245 | 1,375 | 1,119 | 1,039 | 1,922 | 1,779 | 5,859 | 6,186 | |||||||||||||||||||||||||||||
| Treasury Services |
1,064 | 1,074 | 1,052 | 1,051 | 969 | 930 | 891 | 3,841 | 3,698 | |||||||||||||||||||||||||||||
| Lending |
357 | 370 | 222 | 279 | 295 | 241 | 239 | 1,054 | 811 | |||||||||||||||||||||||||||||
|
|
|
|
|
|
|
|
|
|
|
|
|
|
|
|
|
|
|
|||||||||||||||||||||
| Total Banking |
2,850 | 2,689 | 2,649 | 2,449 | 2,303 | 3,093 | 2,909 | 10,754 | 10,695 | |||||||||||||||||||||||||||||
| Fixed Income Markets |
3,726 | 3,493 | 5,016 | 2,626 | 2,799 | 4,216 | 5,143 | 14,784 | 14,738 | |||||||||||||||||||||||||||||
| Equity Markets |
1,044 | 1,043 | 1,424 | 806 | 1,047 | 1,145 | 1,478 | 4,476 | 4,582 | |||||||||||||||||||||||||||||
| Securities Services |
965 | 1,078 | 962 | 971 | 939 | 1,002 | 949 | 3,861 | 3,683 | |||||||||||||||||||||||||||||
| Credit Adjustments & Other (a)(e) |
(225) | 683 | (713) | (532) | 1,198 | (178) | (379) | 109 | (221) | |||||||||||||||||||||||||||||
|
|
|
|
|
|
|
|
|
|
|
|
|
|
|
|
|
|
|
|||||||||||||||||||||
| Total Markets & Investor Services |
5,510 | 6,297 | 6,689 | 3,871 | 5,983 | 6,185 | 7,191 | 23,230 | 22,782 | |||||||||||||||||||||||||||||
|
|
|
|
|
|
|
|
|
|
|
|
|
|
|
|
|
|
|
|||||||||||||||||||||
| TOTAL NET REVENUE |
$ | 8,360 | $ | 8,986 | $ | 9,338 | $ | 6,320 | $ | 8,286 | $ | 9,278 | $ | 10,100 | $ | 33,984 | $ | 33,477 | ||||||||||||||||||||
|
|
|
|
|
|
|
|
|
|
|
|
|
|
|
|
|
|
|
|||||||||||||||||||||
|
|
||||||||||||||||||||||||||||||||||||||
| (a) | Included debit valuation adjustments (“DVA”) related to derivatives and structured liabilities measured at fair value. DVA gains/(losses) were ($211) million, $755 million, ($907) million, ($567) million, $1.9 billion, $165 million and ($46) million for the three months ended September 30, 2012, June 30, 2012, March 31, 2012, December 31, 2011, September 30, 2011, June 30, 2011 and March 31, 2011, respectively, and $1.4 billion and $509 million for full year 2011 and 2010, respectively. |
| (b) | Included tax-equivalent adjustments, predominantly due to income tax credits related to affordable housing and alternative energy investments, as well as tax-exempt income from municipal bond investments of $492 million, $494 million, $509 million, $510 million, $440 million, $493 million and $438 million for the three months ended September 30, 2012, June 30, 2012, March 31, 2012, December 31, 2011, September 30, 2011, June 30, 2011 and March 31, 2011, respectively, and $1.9 billion and $1.7 billion for full year 2011 and 2010, respectively. |
| (c) | Return on equity excluding DVA, a non-GAAP financial measure, was 18%, 16%, 22%, 11%, 7%, 20% and 23% for the three months ended September 30, 2012, June 30, 2012, March 31, 2012, December 31, 2011, September 30, 2011, June 30, 2011 and March 31, 2011, respectively, and 15% and 16% for full year 2011 and 2010, respectively. For additional information on this measure, see non-GAAP financial measures on page 23. |
| (d) | Compensation expense as a percentage of total net revenue excluding DVA, a non-GAAP financial measure, was 32%, 33%, 35%, 27%, 40%, 36% and 39% for the three months ended September 30, 2012, June 30, 2012, March 31, 2012, December 31, 2011, September 30, 2011, June 30, 2011 and March 31, 2011, respectively, and 36% and 38% for full year 2011 and 2010, respectively. In addition, compensation expense as a percent of total net revenue for full year 2010, excluding both DVA and the payroll tax expense related to the U.K. Bank Payroll Tax on certain compensation awarded from December 9, 2009 to April 5, 2010 to relevant banking employees, which is a non-GAAP financial measure, was 36%. For additional information on this measure, see non-GAAP financial measures on page 23. |
| (e) | Primarily includes net credit portfolio credit valuation adjustments (“CVA”) and its associated hedging activities; DVA related to both structured notes and derivatives; and nonperforming derivative receivable results effective in the first quarter of 2012 and thereafter. The results of the synthetic credit portfolio that was transferred from the Chief Investment Office effective July 2, 2012, which are reported in Fixed Income Markets, are not included. |
Page 14
| JPMORGAN CHASE & CO. |
| |
| CORPORATE & INVESTMENT BANK | ||
| FINANCIAL HIGHLIGHTS, CONTINUED | ||
| (in millions, except ratio and headcount data) |
| QUARTERLY TRENDS | FULL YEAR | |||||||||||||||||||||||||||||||||||
| 3Q12 | 2Q12 | 1Q12 | 4Q11 | 3Q11 | 2Q11 | 1Q11 | 2011 | 2010 | ||||||||||||||||||||||||||||
| SELECTED BALANCE SHEET DATA (period-end) |
||||||||||||||||||||||||||||||||||||
| Assets |
$ | 904,090 | $ | 897,413 | $ | 879,691 | $ | 845,095 | $ | 887,097 | $ | 865,580 | $ | 904,066 | $ | 845,095 | $ | 870,631 | ||||||||||||||||||
| Loans: |
||||||||||||||||||||||||||||||||||||
| Loans retained (a) |
107,903 | 114,620 | 108,287 | 111,099 | 94,449 | 90,040 | 83,630 | 111,099 | 80,208 | |||||||||||||||||||||||||||
| Loans held-for-sale and loans at fair value |
3,899 | 2,375 | 5,550 | 3,016 | 2,414 | 3,567 | 5,172 | 3,016 | 3,851 | |||||||||||||||||||||||||||
|
|
|
|
|
|
|
|
|
|
|
|
|
|
|
|
|
|
|
|||||||||||||||||||
| Total loans |
111,802 | 116,995 | 113,837 | 114,115 | 96,863 | 93,607 | 88,802 | 114,115 | 84,059 | |||||||||||||||||||||||||||
| Equity |
47,500 | 47,500 | 47,500 | 47,000 | 47,000 | 47,000 | 47,000 | 47,000 | 46,500 | |||||||||||||||||||||||||||
| SELECTED BALANCE SHEET DATA (average) |
||||||||||||||||||||||||||||||||||||
| Assets |
$ | 841,678 | $ | 859,026 | $ | 854,128 | $ | 854,330 | $ | 863,808 | $ | 894,043 | $ | 863,701 | $ | 868,930 | $ | 774,295 | ||||||||||||||||||
| Trading assets - debt and equity instruments |
296,811 | 305,972 | 315,176 | 314,776 | 331,756 | 376,368 | 370,833 | 348,234 | 309,383 | |||||||||||||||||||||||||||
| Trading assets - derivative receivables |
74,812 | 74,960 | 76,220 | 76,782 | 79,044 | 69,346 | 67,462 | 73,200 | 70,286 | |||||||||||||||||||||||||||
| Loans: |
||||||||||||||||||||||||||||||||||||
| Loans retained (a) |
111,263 | 112,952 | 107,148 | 101,885 | 92,466 | 87,557 | 82,557 | 91,173 | 77,620 | |||||||||||||||||||||||||||
| Loans held-for-sale and loans at fair value |
2,809 | 3,256 | 2,867 | 2,184 | 2,533 | 4,256 | 3,938 | 3,221 | 3,268 | |||||||||||||||||||||||||||
|
|
|
|
|
|
|
|
|
|
|
|
|
|
|
|
|
|
|
|||||||||||||||||||
| Total loans |
114,072 | 116,208 | 110,015 | 104,069 | 94,999 | 91,813 | 86,495 | 94,394 | 80,888 | |||||||||||||||||||||||||||
| Equity |
47,500 | 47,500 | 47,500 | 47,000 | 47,000 | 47,000 | 47,000 | 47,000 | 46,500 | |||||||||||||||||||||||||||
| Headcount |
52,479 | 53,725 | 53,214 | 53,557 | 54,502 | 55,676 | 54,275 | 53,557 | 55,142 | |||||||||||||||||||||||||||
| CREDIT DATA AND QUALITY STATISTICS |
||||||||||||||||||||||||||||||||||||
| Net charge-offs/(recoveries) |
$ | (22) | $ | (10) | $ | (35) | $ | 199 | $ | (168) | $ | 7 | $ | 123 | $ | 161 | $ | 736 | ||||||||||||||||||
| Nonperforming assets: |
||||||||||||||||||||||||||||||||||||
| Nonaccrual loans: |
||||||||||||||||||||||||||||||||||||
| Nonaccrual loans retained (a)(b) |
588 | 661 | 700 | 1,039 | 1,277 | 1,497 | 2,399 | 1,039 | 3,171 | |||||||||||||||||||||||||||
| Nonaccrual loans held-for-sale and loans at fair value |
213 | 158 | 182 | 166 | 150 | 193 | 259 | 166 | 460 | |||||||||||||||||||||||||||
|
|
|
|
|
|
|
|
|
|
|
|
|
|
|
|
|
|
|
|||||||||||||||||||
| Total nonaccrual loans |
801 | 819 | 882 | 1,205 | 1,427 | 1,690 | 2,658 | 1,205 | 3,631 | |||||||||||||||||||||||||||
| Derivative receivables (c) |
282 | 451 | 317 | 293 | 281 | 213 | 180 | 293 | 159 | |||||||||||||||||||||||||||
| Assets acquired in loan satisfactions |
77 | 68 | 79 | 79 | 77 | 83 | 73 | 79 | 117 | |||||||||||||||||||||||||||
|
|
|
|
|
|
|
|
|
|
|
|
|
|
|
|
|
|
|
|||||||||||||||||||
| Total nonperforming assets |
1,160 | 1,338 | 1,278 | 1,577 | 1,785 | 1,986 | 2,911 | 1,577 | 3,907 | |||||||||||||||||||||||||||
| Allowance for credit losses: |
||||||||||||||||||||||||||||||||||||
| Allowance for loan losses |
1,459 | 1,498 | 1,455 | 1,501 | 1,386 | 1,252 | 1,399 | 1,501 | 1,928 | |||||||||||||||||||||||||||
| Allowance for lending-related commitments |
544 | 542 | 544 | 467 | 490 | 424 | 472 | 467 | 498 | |||||||||||||||||||||||||||
|
|
|
|
|
|
|
|
|
|
|
|
|
|
|
|
|
|
|
|||||||||||||||||||
| Total allowance for credit losses |
2,003 | 2,040 | 1,999 | 1,968 | 1,876 | 1,676 | 1,871 | 1,968 | 2,426 | |||||||||||||||||||||||||||
| Net charge-off/(recovery) rate (a) |
(0.08) | % | (0.04) | % | (0.13) | % | 0.77 | % | (0.72) | % | 0.03 | % | 0.60 | % | 0.18 | % | 0.95 | % | ||||||||||||||||||
| Allowance for loan losses to period-end loans retained (a) |
1.35 | 1.31 | 1.34 | 1.35 | 1.47 | 1.39 | 1.67 | 1.35 | 2.40 | |||||||||||||||||||||||||||
| Allowance for loan losses to period-end loans retained, excluding trade finance and conduits (d) |
2.92 | 2.75 | 2.93 | 3.06 | 3.08 | 2.82 | 3.47 | 3.06 | 4.90 | |||||||||||||||||||||||||||
| Allowance for loan losses to nonaccrual loans retained (a)(b) |
248 | 227 | 208 | 144 | 109 | 84 | 58 | 144 | 61 | |||||||||||||||||||||||||||
| Nonaccrual loans to total period-end loans |
0.72 | 0.70 | 0.77 | 1.06 | 1.47 | 1.81 | 2.99 | 1.06 | 4.32 | |||||||||||||||||||||||||||
|
|
||||||||||||||||||||||||||||||||||||
| (a) | Loans retained included credit portfolio loans, trade finance loans, other held-for-investment loans and overdrafts. |
| (b) | Allowance for loan losses of $178 million, $202 million, $226 million, $263 million, $320 million, $377 million, $567 million and $1.1 billion were held against these nonaccrual loans at September 30, 2012, June 30, 2012, March 31, 2012, December 31, 2011, September 30, 2011, June 30, 2011, March 31, 2011 and December 2010, respectively. |
| (c) | Prior to the first quarter of 2012, reported amounts had only included defaulted derivatives; effective in the first quarter of 2012, reported amounts in all periods included both defaulted derivatives as well as derivatives that have been risk rated as nonperforming. |
| (d) | Management uses allowance for loan losses to period-end loans retained, excluding trade finance and conduits, a non-GAAP financial measure, as a more relevant metric to reflect the allowance coverage of the retained lending portfolio. |
Page 15
| JPMORGAN CHASE & CO. |
| |
| CORPORATE & INVESTMENT BANK | ||
| FINANCIAL HIGHLIGHTS, CONTINUED | ||
| (in millions, except rankings data and where otherwise noted) |
| QUARTERLY TRENDS | FULL YEAR | |||||||||||||||||||||||||||||||||||
| 3Q12 | 2Q12 | 1Q12 | 4Q11 | 3Q11 | 2Q11 | 1Q11 | 2011 | 2010 | ||||||||||||||||||||||||||||
| BUSINESS METRICS |
||||||||||||||||||||||||||||||||||||
| Assets under custody (“AUC”) by asset class (period-end) (in billions): |
||||||||||||||||||||||||||||||||||||
| Fixed Income |
$ | 11,545 | $ | 11,302 | $ | 11,332 | $ | 10,926 | $ | 10,871 | $ | 10,686 | $ | 10,437 | $ | 10,926 | $ | 10,364 | ||||||||||||||||||
| Equity |
5,328 | 5,025 | 5,365 | 4,878 | 4,401 | 5,267 | 5,238 | 4,878 | 4,850 | |||||||||||||||||||||||||||
| Other (a) |
1,346 | 1,338 | 1,171 | 1,066 | 978 | 992 | 944 | 1,066 | 906 | |||||||||||||||||||||||||||
|
|
|
|
|
|
|
|
|
|
|
|
|
|
|
|
|
|
|
|||||||||||||||||||
| Total AUC |
$ | 18,219 | $ | 17,665 | $ | 17,868 | $ | 16,870 | $ | 16,250 | $ | 16,945 | $ | 16,619 | $ | 16,870 | $ | 16,120 | ||||||||||||||||||
| Customer deposits and other third party liabilities (average) (b) |
351,383 | 348,102 | 356,964 | 364,196 | 341,107 | 302,858 | 265,720 | 318,802 | 248,451 | |||||||||||||||||||||||||||
| Trade finance loans (period-end) |
35,142 | 35,291 | 35,692 | 36,696 | 30,104 | 27,473 | 25,499 | 36,696 | 21,156 | |||||||||||||||||||||||||||
| NINE MONTHS ENDED SEPTEMBER 30, 2012 |
FULL YEAR 2011 | FULL YEAR 2010 | ||||||||||||||||||||||||||||||||||
| MARKET SHARES AND RANKINGS (c) | Market Share |
Rankings | Market Share |
Rankings | Market Share |
Rankings | ||||||||||||||||||||||||||||||
| Global investment banking fees (d) |
7.7 | % | #1 | 8.1 | % | #1 | 7.6 | % | #1 | |||||||||||||||||||||||||||
| Debt, equity and equity-related |
||||||||||||||||||||||||||||||||||||
| Global |
7.2 | 1 | 6.7 | 1 | 7.2 | 1 | ||||||||||||||||||||||||||||||
| U.S. |
11.2 | 1 | 11.1 | 1 | 11.1 | 1 | ||||||||||||||||||||||||||||||
| Syndicated loans |
||||||||||||||||||||||||||||||||||||
| Global |
9.8 | 1 | 10.8 | 1 | 8.5 | 2 | ||||||||||||||||||||||||||||||
| U.S. |
18.0 | 1 | 21.2 | 1 | 19.1 | 2 | ||||||||||||||||||||||||||||||
| Long-term debt (e) |
||||||||||||||||||||||||||||||||||||
| Global |
7.1 | 1 | 6.7 | 1 | 7.2 | 2 | ||||||||||||||||||||||||||||||
| U.S. |
11.3 | 1 | 11.2 | 1 | 10.9 | 2 | ||||||||||||||||||||||||||||||
| Equity and equity-related |
||||||||||||||||||||||||||||||||||||
| Global (f) |
7.8 | 4 | 6.8 | 3 | 7.3 | 3 | ||||||||||||||||||||||||||||||
| U.S. |
10.5 | 4 | 12.5 | 1 | 13.1 | 2 | ||||||||||||||||||||||||||||||
| Announced M&A (g) |
||||||||||||||||||||||||||||||||||||
| Global |
19.8 | 2 | 18.3 | 2 | 15.9 | 4 | ||||||||||||||||||||||||||||||
| U.S. |
21.0 | 2 | 26.7 | 2 | 21.9 | 3 | ||||||||||||||||||||||||||||||
|
|
||||||||||||||||||||||||||||||||||||
| (a) | Consists of mutual funds, unit investment trusts, currencies, annuities, insurance contracts, options and nonsecurities contracts. |
| (b) | Customer deposits and other third party liabilities pertain to the Treasury Services and Securities Services businesses, and include deposits, as well as deposits that are swept to on-balance sheet liabilities (e.g., commercial paper, federal funds purchased and securities loaned or sold under repurchase agreements) as part of customer cash management programs. |
| (c) | Source: Dealogic. Global Investment Banking fees reflects the ranking of fees and market share. Remainder of rankings reflects transaction volume and market share. Global announced M&A is based on transaction value at announcement; because of joint M&A assignments, M&A market share of all participants will add up to more than 100%. All other transaction volume-based rankings are based on proceeds, with full credit to each book manager/equal if joint. |
| (d) | Global investment banking fees rankings exclude money market, short-term debt and shelf deals. |
| (e) | Long-term debt rankings include investment-grade, high-yield, supranationals, sovereigns, agencies, covered bonds, asset-backed securities and mortgage-backed securities; and exclude money market, short-term debt, and U.S. municipal securities. |
| (f) | Global equity and equity-related ranking includes rights offerings and Chinese A-Shares. |
| (g) | Announced M&A reflects the removal of any withdrawn transactions. U.S. announced M&A represents any U.S. involvement ranking. |
Page 16
| JPMORGAN CHASE & CO. |
| |
| CORPORATE & INVESTMENT BANK | ||
| FINANCIAL HIGHLIGHTS, CONTINUED | ||
| (in millions, except where otherwise noted) |
| QUARTERLY TRENDS | FULL YEAR | |||||||||||||||||||||||||||||||||||
| INTERNATIONAL METRICS | 3Q12 | 2Q12 | 1Q12 | 4Q11 | 3Q11 | 2Q11 | 1Q11 | 2011 | 2010 | |||||||||||||||||||||||||||
| Total net revenue (a) |
||||||||||||||||||||||||||||||||||||
| Europe/Middle East/Africa |
$ | 2,443 | $ | 2,885 | $ | 3,050 | $ | 2,037 | $ | 2,656 | $ | 3,180 | $ | 3,229 | $ | 11,102 | $ | 9,740 | ||||||||||||||||||
| Asia/Pacific |
1,031 | 1,020 | 1,110 | 842 | 1,273 | 1,064 | 1,410 | 4,589 | 4,775 | |||||||||||||||||||||||||||
| Latin America/Caribbean |
392 | 375 | 420 | 351 | 234 | 421 | 403 | 1,409 | 1,154 | |||||||||||||||||||||||||||
|
|
|
|
|
|
|
|
|
|
|
|
|
|
|
|
|
|
|
|||||||||||||||||||
| Total international net revenue |
3,866 | 4,280 | 4,580 | 3,230 | 4,163 | 4,665 | 5,042 | 17,100 | 15,669 | |||||||||||||||||||||||||||
| North America |
4,494 | 4,706 | 4,758 | 3,090 | 4,123 | 4,613 | 5,058 | 16,884 | 17,808 | |||||||||||||||||||||||||||
|
|
|
|
|
|
|
|
|
|
|
|
|
|
|
|
|
|
|
|||||||||||||||||||
| Total net revenue |
$ | 8,360 | $ | 8,986 | $ | 9,338 | $ | 6,320 | $ | 8,286 | $ | 9,278 | $ | 10,100 | $ | 33,984 | $ | 33,477 | ||||||||||||||||||
|
|
|
|
|
|
|
|
|
|
|
|
|
|
|
|
|
|
|
|||||||||||||||||||
| Loans (period-end) (a) |
||||||||||||||||||||||||||||||||||||
| Europe/Middle East/Africa |
$ | 27,866 | $ | 33,041 | $ | 29,337 | $ | 29,484 | $ | 26,156 | $ | 25,077 | $ | 22,832 | $ | 29,484 | $ | 21,072 | ||||||||||||||||||
| Asia/Pacific |
27,215 | 27,058 | 26,637 | 27,803 | 24,307 | 22,549 | 20,621 | 27,803 | 18,251 | |||||||||||||||||||||||||||
| Latin America/Caribbean |
9,730 | 9,982 | 9,936 | 9,692 | 8,552 | 7,420 | 6,337 | 9,692 | 5,928 | |||||||||||||||||||||||||||
|
|
|
|
|
|
|
|
|
|
|
|
|
|
|
|
|
|
|
|||||||||||||||||||
| Total international loans |
64,811 | 70,081 | 65,910 | 66,979 | 59,015 | 55,046 | 49,790 | 66,979 | 45,251 | |||||||||||||||||||||||||||
| North America |
43,092 | 44,539 | 42,377 | 44,120 | 35,434 | 34,994 | 33,840 | 44,120 | 34,957 | |||||||||||||||||||||||||||
|
|
|
|
|
|
|
|
|
|
|
|
|
|
|
|
|
|
|
|||||||||||||||||||
| Total loans |
$ | 107,903 | $ | 114,620 | $ | 108,287 | $ | 111,099 | $ | 94,449 | $ | 90,040 | $ | 83,630 | $ | 111,099 | $ | 80,208 | ||||||||||||||||||
|
|
|
|
|
|
|
|
|
|
|
|
|
|
|
|
|
|
|
|||||||||||||||||||
| Customer deposits and other third party liabilities (average) (a)(b) |
||||||||||||||||||||||||||||||||||||
| Europe/Middle East/Africa |
$ | 125,720 | $ | 127,173 | $ | 127,794 | $ | 130,862 | $ | 129,608 | $ | 125,911 | $ | 108,997 | $ | 123,920 | $ | 102,014 | ||||||||||||||||||
| Asia/Pacific |
50,862 | 50,331 | 50,197 | 49,407 | 42,987 | 42,472 | 39,123 | 43,524 | 32,862 | |||||||||||||||||||||||||||
| Latin America/Caribbean |
10,141 | 10,453 | 11,852 | 11,563 | 12,722 | 13,506 | 12,720 | 12,625 | 11,558 | |||||||||||||||||||||||||||
|
|
|
|
|
|
|
|
|
|
|
|
|
|
|
|
|
|
|
|||||||||||||||||||
| Total international |
186,723 | 187,957 | 189,843 | 191,832 | 185,317 | 181,889 | 160,840 | 180,069 | 146,434 | |||||||||||||||||||||||||||
| North America |
164,660 | 160,145 | 167,121 | 172,364 | 155,790 | 120,969 | 104,880 | 138,733 | 102,017 | |||||||||||||||||||||||||||
|
|
|
|
|
|
|
|
|
|
|
|
|
|
|
|
|
|
|
|||||||||||||||||||
| Total customer deposits and other third party liabilities |
$ | 351,383 | $ | 348,102 | $ | 356,964 | $ | 364,196 | $ | 341,107 | $ | 302,858 | $ | 265,720 | $ | 318,802 | $ | 248,451 | ||||||||||||||||||
|
|
|
|
|
|
|
|
|
|
|
|
|
|
|
|
|
|
|
|||||||||||||||||||
| AUC (period-end) (in billions) (a) |
||||||||||||||||||||||||||||||||||||
| North America |
$ | 10,206 | $ | 10,048 | $ | 9,998 | $ | 9,735 | $ | 9,611 | $ | 9,976 | $ | 9,901 | $ | 9,735 | $ | 9,836 | ||||||||||||||||||
| All other regions |
8,013 | 7,617 | 7,870 | 7,135 | 6,639 | 6,969 | 6,718 | 7,135 | 6,284 | |||||||||||||||||||||||||||
|
|
|
|
|
|
|
|
|
|
|
|
|
|
|
|
|
|
|
|||||||||||||||||||
| Total AUC |
$ | 18,219 | $ | 17,665 | $ | 17,868 | $ | 16,870 | $ | 16,250 | $ | 16,945 | $ | 16,619 | $ | 16,870 | $ | 16,120 | ||||||||||||||||||
|
|
|
|
|
|
|
|
|
|
|
|
|
|
|
|
|
|
|
|||||||||||||||||||
|
|
||||||||||||||||||||||||||||||||||||
| (a) | Total net revenue is based primarily on the domicile of the client or location of the trading desk, as applicable. Loans outstanding (excluding loans held for sale and loans carried at fair value), customer deposits and AUC are based predominantly on the domicile of the client. |
| (b) | Customer deposits and other third party liabilities pertain to the Treasury Services and Securities Services businesses, and include deposits, as well as deposits that are swept to on-balance sheet liabilities (e.g., commercial paper, federal funds purchased and securities loaned or sold under repurchase agreements) as part of customer cash management programs. |
Page 17
| JPMORGAN CHASE & CO. CORPORATE/PRIVATE EQUITY FINANCIAL HIGHLIGHTS (in millions, except headcount data) |
|
| QUARTERLY TRENDS | FULL YEAR | |||||||||||||||||||||||||||||||||||||
| 3Q12 |
2Q12 |
1Q12 | 4Q11 | 3Q11 | 2Q11 | 1Q11 | 2011 | 2010 | ||||||||||||||||||||||||||||||
| INCOME STATEMENT |
||||||||||||||||||||||||||||||||||||||
| REVENUE |
||||||||||||||||||||||||||||||||||||||
| Principal transactions (a) |
$ | (304) | $ | (3,576) | (e) | $ | (547) | $ | 324 | $ | (933) | $ | 745 | $ | 1,298 | $ | 1,434 | $ | 2,208 | |||||||||||||||||||
| Securities gains |
459 | 1,013 | 449 | 54 | 607 | 837 | 102 | 1,600 | 2,898 | |||||||||||||||||||||||||||||
| All other income |
1,044 | (d) | 153 | 1,111 | (f) | 75 | 184 | 258 | 78 | 595 | 245 | |||||||||||||||||||||||||||
|
|
|
|
|
|
|
|
|
|
|
|
|
|
|
|
|
|
|
|||||||||||||||||||||
| Noninterest revenue |
1,199 | (2,410) | 1,013 | 453 | (142) | 1,840 | 1,478 | 3,629 | 5,351 | |||||||||||||||||||||||||||||
| Net interest income |
(625) | (205) | 16 | 245 | 8 | 219 | 34 | 506 | 2,063 | |||||||||||||||||||||||||||||
|
|
|
|
|
|
|
|
|
|
|
|
|
|
|
|
|
|
|
|||||||||||||||||||||
| TOTAL NET REVENUE (b) |
574 | (2,615) | 1,029 | 698 | (134) | 2,059 | 1,512 | 4,135 | 7,414 | |||||||||||||||||||||||||||||
| Provision for credit losses |
(11) | (11) | (9) | (10) | (7) | (9) | (10) | (36) | 14 | |||||||||||||||||||||||||||||
| NONINTEREST EXPENSE |
||||||||||||||||||||||||||||||||||||||
| Compensation expense |
555 | 623 | 795 | 573 | 527 | 590 | 634 | 2,324 | 2,276 | |||||||||||||||||||||||||||||
| Noncompensation expense (c) |
1,550 | 1,264 | 3,284 | 1,601 | 1,946 | 2,040 | 1,106 | 6,693 | 8,641 | |||||||||||||||||||||||||||||
|
|
|
|
|
|
|
|
|
|
|
|
|
|
|
|
|
|
|
|||||||||||||||||||||
| Subtotal |
2,105 | 1,887 | 4,079 | 2,174 | 2,473 | 2,630 | 1,740 | 9,017 | 10,917 | |||||||||||||||||||||||||||||
| Net expense allocated to other businesses |
(1,370) | (1,338) | (1,310) | (1,260) | (1,257) | (1,212) | (1,180) | (4,909) | (4,607) | |||||||||||||||||||||||||||||
|
|
|
|
|
|
|
|
|
|
|
|
|
|
|
|
|
|
|
|||||||||||||||||||||
| TOTAL NONINTEREST EXPENSE |
735 | 549 | 2,769 | 914 | 1,216 | 1,418 | 560 | 4,108 | 6,310 | |||||||||||||||||||||||||||||
|
|
|
|
|
|
|
|
|
|
|
|
|
|
|
|
|
|
|
|||||||||||||||||||||
| Income/(loss) before income tax expense/(benefit) |
(150) | (3,153) | (1,731) | (206) | (1,343) | 650 | 962 | 63 | 1,090 | |||||||||||||||||||||||||||||
| Income tax expense/(benefit) |
(367) | (1,378) | (709) | (439) | (697) | 138 | 239 | (759) | (190) | |||||||||||||||||||||||||||||
|
|
|
|
|
|
|
|
|
|
|
|
|
|
|
|
|
|
|
|||||||||||||||||||||
| NET INCOME/(LOSS) |
$ | 217 | $ | (1,775) | $ | (1,022) | $ | 233 | $ | (646) | $ | 512 | $ | 723 | $ | 822 | $ | 1,280 | ||||||||||||||||||||
|
|
|
|
|
|
|
|
|
|
|
|
|
|
|
|
|
|
|
|||||||||||||||||||||
| MEMO: |
||||||||||||||||||||||||||||||||||||||
| REVENUE |
||||||||||||||||||||||||||||||||||||||
| Private Equity |
$ | (135) | $ | 410 | $ | 254 | $ | (113) | $ | (546) | $ | 796 | $ | 699 | $ | 836 | $ | 1,239 | ||||||||||||||||||||
| Treasury and Chief Investment Office (“CIO”) |
713 | (3,434) | (233) | 845 | 102 | 1,426 | 823 | 3,196 | 6,642 | |||||||||||||||||||||||||||||
| Other Corporate |
(4) | 409 | 1,008 | (34) | 310 | (163) | (10) | 103 | (467) | |||||||||||||||||||||||||||||
|
|
|
|
|
|
|
|
|
|
|
|
|
|
|
|
|
|
|
|||||||||||||||||||||
| TOTAL NET REVENUE |
$ | 574 | $ | (2,615) | $ | 1,029 | $ | 698 | $ | (134) | $ | 2,059 | $ | 1,512 | $ | 4,135 | $ | 7,414 | ||||||||||||||||||||
|
|
|
|
|
|
|
|
|
|
|
|
|
|
|
|
|
|
|
|||||||||||||||||||||
| NET INCOME/(LOSS) |
||||||||||||||||||||||||||||||||||||||
| Private Equity |
$ | (89) | $ | 197 | $ | 134 | $ | (89) | $ | (347) | $ | 444 | $ | 383 | $ | 391 | $ | 588 | ||||||||||||||||||||
| Treasury and CIO |
369 | (2,078) | (227) | 417 | (94) | 670 | 356 | 1,349 | 3,576 | |||||||||||||||||||||||||||||
| Other Corporate |
(63) | 106 | (929) | (95) | (205) | (602) | (16) | (918) | (2,884) | |||||||||||||||||||||||||||||
|
|
|
|
|
|
|
|
|
|
|
|
|
|
|
|
|
|
|
|||||||||||||||||||||
| TOTAL NET INCOME/(LOSS) |
$ | 217 | $ | (1,775) | $ | (1,022) | $ | 233 | $ | (646) | $ | 512 | $ | 723 | $ | 822 | $ | 1,280 | ||||||||||||||||||||
|
|
|
|
|
|
|
|
|
|
|
|
|
|
|
|
|
|
|
|||||||||||||||||||||
| TOTAL ASSETS (period-end) |
$ | 685,338 | $ | 667,133 | $ | 713,263 | $ | 693,108 | $ | 693,556 | $ | 672,606 | $ | 591,309 | $ | 693,108 | $ | 526,556 | ||||||||||||||||||||
| Headcount |
22,517 | 22,156 | 21,529 | 21,334 | 21,110 | 20,760 | 20,291 | 21,334 | 19,419 | |||||||||||||||||||||||||||||
|
|
||||||||||||||||||||||||||||||||||||||
| (a) | During the third quarter, CIO effectively closed out the index credit derivative positions that were retained following the transfer of the synthetic credit portfolio to the CIB on July 2, 2012. Principal transactions revenue included losses in CIO for the three months ended September 30, 2012 of $449 million on this portfolio. Also included losses in CIO of $4.4 billion and $1.4 billion on the synthetic credit portfolio for the three months ended June 30, 2012 and March 31, 2012, respectively, and $6.2 billion for the nine months ended September 30, 2012. Results of the portfolio that was transferred to CIB are not included herein. |
| (b) | Total net revenue included tax-equivalent adjustments, predominantly due to tax-exempt income from municipal bond investments of $109 million, $118 million, $99 million, $92 million, $73 million, $69 million and $64 million for the three months ended September 30, 2012, June 30, 2012, March 31, 2012, December 31, 2011, September 30, 2011, June 30, 2011 and March 31 2011, respectively, and $298 million and $226 million for full year 2011 and 2010, respectively. |
| (c) | Includes litigation expense of $0.7 billion, $0.3 billion, $2.5 billion, $0.5 billion, $1.0 billion, $1.3 billion and $0.4 billion for the three months ended September 30. 2012, June 30, 2012, March 31, 2012, December 31, 2011, September 30, 2011 and June 30, 2011 and March 31, 2011, respectively, and $3.2 billion and $5.7 billion for full year 2011 and 2010, respectively. |
| (d) | Included an extinguishment gain of $888 million related to the redemption of trust preferred capital debt securities for the three months ended September 30, 2012; the gain related to adjustments applied to the cost basis of these securities during the period they were in a qualifying hedge accounting relationship. |
| (e) | Included a gain of $545 million, reflecting the expected recovery on a Bear Stearns-related subordinated loan. |
| (f) | Includes a $1.1 billion benefit from the Washington Mutual bankruptcy settlement. |
Page 18
| JPMORGAN CHASE & CO. CREDIT-RELATED INFORMATION (in millions, except ratio data) |
|
| Sep 30, 2012 |
Jun 30, 2012 |
Mar 31, 2012 |
Dec 31, 2011 |
Sep 30, 2011 |
Jun 30, 2011 |
Mar 31, 2011 |
Dec 31, 2010 |
|||||||||||||||||||||||||||
| NONPERFORMING ASSETS AND RATIOS |
||||||||||||||||||||||||||||||||||
| Wholesale loans |
||||||||||||||||||||||||||||||||||
| Loans retained |
$ | 1,663 | $ | 1,804 | $ | 1,941 | $ | 2,398 | $ | 3,011 | $ | 3,362 | $ | 4,578 | $ | 5,510 | ||||||||||||||||||
| Loans held-for-sale and loans at fair value |
246 | 194 | 214 | 183 | 176 | 214 | 289 | 496 | ||||||||||||||||||||||||||
|
|
|
|
|
|
|
|
|
|
|
|
|
|
|
|
|
|||||||||||||||||||
| Total wholesale loans |
1,909 | 1,998 | 2,155 | 2,581 | 3,187 | 3,576 | 4,867 | 6,006 | ||||||||||||||||||||||||||
|
|
|
|
|
|
|
|
|
|
|
|
|
|
|
|
|
|||||||||||||||||||
| Consumer, excluding credit card loans |
||||||||||||||||||||||||||||||||||
| Home equity (a)(b) |
3,254 | 2,615 | 2,766 | 1,287 | 1,290 | 1,308 | 1,263 | 1,263 | ||||||||||||||||||||||||||
| Prime mortgage, including option ARMs (a) |
3,570 | 3,139 | 3,258 | 3,462 | 3,656 | 4,024 | 4,166 | 4,320 | ||||||||||||||||||||||||||
| Subprime mortgage (a) |
1,868 | 1,544 | 1,569 | 1,781 | 1,932 | 2,058 | 2,106 | 2,210 | ||||||||||||||||||||||||||
| Auto (a) |
172 | 101 | 102 | 118 | 114 | 111 | 120 | 141 | ||||||||||||||||||||||||||
| Business banking |
521 | 587 | 649 | 694 | 756 | 770 | 810 | 832 | ||||||||||||||||||||||||||
| Student and other |
75 | 83 | 105 | 69 | 68 | 79 | 107 | 67 | ||||||||||||||||||||||||||
|
|
|
|
|
|
|
|
|
|
|
|
|
|
|
|
|
|||||||||||||||||||
| Total consumer, excluding credit card loans |
9,460 | 8,069 | 8,449 | 7,411 | 7,816 | 8,350 | 8,572 | 8,833 | ||||||||||||||||||||||||||
| Total credit card loans |
1 | 1 | 1 | 1 | 2 | 2 | 2 | 2 | ||||||||||||||||||||||||||
|
|
|
|
|
|
|
|
|
|
|
|
|
|
|
|
|
|||||||||||||||||||
| Total consumer nonaccrual loans (c) |
9,461 | 8,070 | 8,450 | 7,412 | 7,818 | 8,352 | 8,574 | 8,835 | ||||||||||||||||||||||||||
|
|
|
|
|
|
|
|
|
|
|
|
|
|
|
|
|
|||||||||||||||||||
| Total nonaccrual loans |
11,370 | 10,068 | 10,605 | 9,993 | 11,005 | 11,928 | 13,441 | 14,841 | ||||||||||||||||||||||||||
|
|
|
|
|
|
|
|
|
|
|
|
|
|
|
|
|
|||||||||||||||||||
| Derivative receivables (d) |
282 | 451 | 317 | 297 | 285 | 217 | 184 | 159 | ||||||||||||||||||||||||||
| Assets acquired in loan satisfactions |
829 | 878 | 1,031 | 1,025 | 1,178 | 1,290 | 1,524 | 1,682 | ||||||||||||||||||||||||||
|
|
|
|
|
|
|
|
|
|
|
|
|
|
|
|
|
|||||||||||||||||||
| Total nonperforming assets (e) |
12,481 | 11,397 | 11,953 | 11,315 | 12,468 | 13,435 | 15,149 | 16,682 | ||||||||||||||||||||||||||
| Wholesale lending-related commitments (f) |
586 | 565 | 756 | 865 | 705 | 793 | 895 | 1,005 | ||||||||||||||||||||||||||
|
|
|
|
|
|
|
|
|
|
|
|
|
|
|
|
|
|||||||||||||||||||
| Total nonperforming exposure (e) |
$ | 13,067 | $ | 11,962 | $ | 12,709 | $ | 12,180 | $ | 13,173 | $ | 14,228 | $ | 16,044 | $ | 17,687 | ||||||||||||||||||
|
|
|
|
|
|
|
|
|
|
|
|
|
|
|
|
|
|||||||||||||||||||
| Total nonaccrual loans to total loans |
1.57 | % | 1.38 | % | 1.47 | % | 1.38 | % | 1.58 | % | 1.73 | % | 1.96 | % | 2.14 | % | ||||||||||||||||||
| Total wholesale nonaccrual loans to total wholesale loans |
0.63 | 0.66 | 0.74 | 0.91 | 1.23 | 1.44 | 2.06 | 2.64 | ||||||||||||||||||||||||||
| Total consumer, excluding credit card nonaccrual loans to total consumer, excluding credit card loans |
3.21 | 2.69 | 2.77 | 2.40 | 2.52 | 2.65 | 2.67 | 2.70 | ||||||||||||||||||||||||||
| NONPERFORMING ASSETS BY LOB |
||||||||||||||||||||||||||||||||||
| Consumer & Community Banking (a)(b)(c) |
$ | 10,096 | $ | 8,766 | $ | 9,250 | $ | 8,189 | $ | 8,676 | $ | 9,266 | $ | 9,757 | $ | 10,123 | ||||||||||||||||||
| Corporate & Investment Bank (d) |
1,160 | 1,338 | 1,278 | 1,577 | 1,785 | 1,986 | 2,911 | 3,907 | ||||||||||||||||||||||||||
| Commercial Banking |
908 | 953 | 1,064 | 1,138 | 1,611 | 1,831 | 2,134 | 2,197 | ||||||||||||||||||||||||||
| Asset Management (d) |
242 | 271 | 286 | 336 | 322 | 264 | 267 | 382 | ||||||||||||||||||||||||||
| Corporate/Private Equity (g) |
75 | 69 | 75 | 75 | 74 | 88 | 80 | 73 | ||||||||||||||||||||||||||
|
|
|
|
|
|
|
|
|
|
|
|
|
|
|
|
|
|||||||||||||||||||
| TOTAL |
$ | 12,481 | $ | 11,397 | $ | 11,953 | $ | 11,315 | $ | 12,468 | $ | 13,435 | $ | 15,149 | $ | 16,682 | ||||||||||||||||||
|
|
|
|
|
|
|
|
|
|
|
|
|
|
|
|
|
|||||||||||||||||||
|
|
||||||||||||||||||||||||||||||||||
| (a) | Nonperforming assets at September 30, 2012 included $1.7 billion of Chapter 7 loans, based upon regulatory guidance, consisting of $820 million of home equity loans, $481 million of prime mortgage, including option ARM loans, $356 million of subprime mortgage loans, and $65 million of auto loans. |
| (b) | Included $1.3 billion, $1.5 billion and $1.6 billion of performing junior liens that are subordinate to senior liens that are 90 days or more past due at September 30, 2012, June 30, 2012 and March 31, 2012, respectively. Beginning March 31, 2012, such junior liens are reported as nonaccrual loans based upon regulatory guidance issued in the first quarter of 2012. Of these totals, $1.2 billion, $1.3 billion and $1.4 billion were current at September 30, 2012, June 30, 2012 and March 31, 2012, respectively. |
| (c) | Excludes PCI loans. Because the Firm is recognizing interest income on each pool of PCI loans, they are all considered to be performing. |
| (d) | Prior to the first quarter of 2012, reported amounts had only included defaulted derivatives; effective in the first quarter of 2012, reported amounts in all periods presented include both defaulted derivatives as well as derivatives that have been risk rated as nonperforming. |
| (e) | At September 30, 2012, June 30, 2012, March 31, 2012, December 31, 2011, September 30, 2011, June 30, 2011, March 31, 2011 and December 31, 2010, nonperforming assets excluded: (1) mortgage loans insured by U.S. government agencies of $11.0 billion, $11.9 billion, $11.8 billion, $11.5 billion, $9.5 billion, $9.1 billion, $8.8 billion and $9.4 billion, respectively, that are 90 or more days past due; (2) real estate owned insured by U.S. government agencies of $1.5 billion, $1.3 billion, $1.2 billion, $954 million, $2.4 billion, $2.4 billion, $2.3 billion and $1.9 billion, respectively; and (3) student loans insured by U.S. government agencies under the FFELP of $536 million, $547 million, $586 million, $551 million, $567 million, $558 million, $615 million and $625 million, respectively, that are 90 or more days past due. These amounts were excluded from nonaccrual loans as reimbursement of insured amounts is proceeding normally. In addition, the Firm’s policy is generally to exempt credit card loans from being placed on nonaccrual status as permitted by regulatory guidance issued by the Federal Financial Institutions Examination Council (“FFIEC”). Credit card loans are charged off by the end of the month in which the account becomes 180 days past due or within 60 days from receiving notification about a specified event (e.g., bankruptcy of the borrower), whichever is earlier. |
| (f) | Represent commitments that are risk rated as nonaccrual. |
| (g) | Predominantly relates to retained prime mortgage loans. |
Page 19
| JPMORGAN CHASE & CO. |
| |
| CREDIT-RELATED INFORMATION, CONTINUED | ||
| (in millions) |
| QUARTERLY TRENDS | FULL YEAR | |||||||||||||||||||||||||||||||||||||
| 3Q12 | 2Q12 | 1Q12 | 4Q11 | 3Q11 | 2Q11 | 1Q11 | 2011 | 2010 | ||||||||||||||||||||||||||||||
| SUMMARY OF CHANGES IN THE ALLOWANCES |
||||||||||||||||||||||||||||||||||||||
| ALLOWANCE FOR LOAN LOSSES |
||||||||||||||||||||||||||||||||||||||
| Beginning balance |
$ | 23,791 | $ | 25,871 | $ | 27,609 | $ | 28,350 | $ | 28,520 | $ | 29,750 | $ | 32,266 | $ | 32,266 | $ | 31,602 | ||||||||||||||||||||
| Cumulative effect of change in accounting principles |
- | - | - | - | - | - | - | - | 7,494 | |||||||||||||||||||||||||||||
| Net charge-offs |
2,770 | 2,278 | 2,387 | 2,907 | 2,507 | 3,103 | 3,720 | 12,237 | 23,673 | |||||||||||||||||||||||||||||
| Provision for loan losses |
1,801 | 200 | 646 | 2,193 | 2,351 | 1,872 | 1,196 | 7,612 | 16,822 | |||||||||||||||||||||||||||||
| Other |
2 | (2) | 3 | (27) | (14) | 1 | 8 | (32) | 21 | |||||||||||||||||||||||||||||
|
|
|
|
|
|
|
|
|
|
|
|
|
|
|
|
|
|
|
|||||||||||||||||||||
| Ending balance |
$ | 22,824 | $ | 23,791 | $ | 25,871 | $ | 27,609 | $ | 28,350 | $ | 28,520 | $ | 29,750 | $ | 27,609 | $ | 32,266 | ||||||||||||||||||||
|
|
|
|
|
|
|
|
|
|
|
|
|
|
|
|
|
|
|
|||||||||||||||||||||
| ALLOWANCE FOR LENDING-RELATED COMMITMENTS |
||||||||||||||||||||||||||||||||||||||
| Beginning balance |
$ | 764 | $ | 750 | $ | 673 | $ | 686 | $ | 626 | $ | 688 | $ | 717 | $ | 717 | $ | 939 | ||||||||||||||||||||
| Cumulative effect of change in accounting principles |
- | - | - | - | - | - | - | - | (18) | |||||||||||||||||||||||||||||
| Provision for lending-related commitments |
(12) | 14 | 80 | (9) | 60 | (62) | (27) | (38) | (183) | |||||||||||||||||||||||||||||
| Other |
- | - | (3) | (4) | - | - | (2) | (6) | (21) | |||||||||||||||||||||||||||||
|
|
|
|
|
|
|
|
|
|
|
|
|
|
|
|
|
|
|
|||||||||||||||||||||
| Ending balance |
$ | 752 | $ | 764 | $ | 750 | $ | 673 | $ | 686 | $ | 626 | $ | 688 | $ | 673 | $ | 717 | ||||||||||||||||||||
|
|
|
|
|
|
|
|
|
|
|
|
|
|
|
|
|
|
|
|||||||||||||||||||||
| ALLOWANCE FOR LOAN LOSSES BY LOB |
||||||||||||||||||||||||||||||||||||||
| Consumer & Community Banking |
$ | 18,454 | $ | 19,405 | $ | 21,508 | $ | 23,256 | $ | 24,016 | $ | 24,400 | $ | 25,494 | $ | 23,256 | $ | 27,487 | ||||||||||||||||||||
| Corporate & Investment Bank |
1,459 | 1,498 | 1,455 | 1,501 | 1,386 | 1,252 | 1,399 | 1,501 | 1,928 | |||||||||||||||||||||||||||||
| Commercial Banking |
2,653 | 2,638 | 2,662 | 2,603 | 2,671 | 2,614 | 2,577 | 2,603 | 2,552 | |||||||||||||||||||||||||||||
| Asset Management |
229 | 220 | 209 | 209 | 240 | 222 | 257 | 209 | 267 | |||||||||||||||||||||||||||||
| Corporate/Private Equity |
29 | 30 | 37 | 40 | 37 | 32 | 23 | 40 | 32 | |||||||||||||||||||||||||||||
|
|
|
|
|
|
|
|
|
|
|
|
|
|
|
|
|
|
|
|||||||||||||||||||||
| Total |
$ | 22,824 | $ | 23,791 | $ | 25,871 | $ | 27,609 | $ | 28,350 | $ | 28,520 | $ | 29,750 | $ | 27,609 | $ | 32,266 | ||||||||||||||||||||
|
|
|
|
|
|
|
|
|
|
|
|
|
|
|
|
|
|
|
|||||||||||||||||||||
Page 20
| JPMORGAN CHASE & CO. |
| |
| CREDIT-RELATED INFORMATION, CONTINUED | ||
| (in millions, except ratio data) |
| Sep 30, 2012 |
Jun 30, 2012 |
Mar 31, 2012 |
Dec 31, 2011 |
Sep 30, 2011 |
Jun 30, 2011 |
Mar 31, 2011 |
Dec 31, 2010 |
|||||||||||||||||||||||||
| ALLOWANCE COMPONENTS AND RATIOS |
||||||||||||||||||||||||||||||||
| ALLOWANCE FOR LOAN LOSSES |
||||||||||||||||||||||||||||||||
| Wholesale |
||||||||||||||||||||||||||||||||
| Asset-specific |
$ | 388 | $ | 407 | $ | 448 | $ | 516 | $ | 670 | $ | 749 | $ | 1,030 | $ | 1,574 | ||||||||||||||||
| Formula-based |
3,945 | 3,942 | 3,875 | 3,800 | 3,632 | 3,342 | 3,204 | 3,187 | ||||||||||||||||||||||||
|
|
|
|
|
|
|
|
|
|
|
|
|
|
|
|
|
|||||||||||||||||
| Total wholesale |
4,333 | 4,349 | 4,323 | 4,316 | 4,302 | 4,091 | 4,234 | 4,761 | ||||||||||||||||||||||||
|
|
|
|
|
|
|
|
|
|
|
|
|
|
|
|
|
|||||||||||||||||
| Consumer, excluding credit card |
||||||||||||||||||||||||||||||||
| Asset-specific |
918 | 1,004 | 760 | 828 | 1,016 | 1,049 | 1,067 | 1,075 | ||||||||||||||||||||||||
| Formula-based |
6,359 | 7,228 | 8,826 | 9,755 | 10,563 | 10,397 | 10,467 | 10,455 | ||||||||||||||||||||||||
| PCI |
5,711 | 5,711 | 5,711 | 5,711 | 4,941 | 4,941 | 4,941 | 4,941 | ||||||||||||||||||||||||
|
|
|
|
|
|
|
|
|
|
|
|
|
|
|
|
|
|||||||||||||||||
| Total consumer, excluding credit card |
12,988 | 13,943 | 15,297 | 16,294 | 16,520 | 16,387 | 16,475 | 16,471 | ||||||||||||||||||||||||
|
|
|
|
|
|
|
|
|
|
|
|
|
|
|
|
|
|||||||||||||||||
| Credit card |
||||||||||||||||||||||||||||||||
| Asset-specific |
1,909 | 1,977 | 2,402 | 2,727 | 3,052 | 3,451 | 3,819 | 4,069 | ||||||||||||||||||||||||
| Formula-based |
3,594 | 3,522 | 3,849 | 4,272 | 4,476 | 4,591 | 5,222 | 6,965 | ||||||||||||||||||||||||
|
|
|
|
|
|
|
|
|
|
|
|
|
|
|
|
|
|||||||||||||||||
| Total credit card |
5,503 | 5,499 | 6,251 | 6,999 | 7,528 | 8,042 | 9,041 | 11,034 | ||||||||||||||||||||||||
|
|
|
|
|
|
|
|
|
|
|
|
|
|
|
|
|
|||||||||||||||||
| Total consumer |
18,491 | 19,442 | 21,548 | 23,293 | 24,048 | 24,429 | 25,516 | 27,505 | ||||||||||||||||||||||||
|
|
|
|
|
|
|
|
|
|
|
|
|
|
|
|
|
|||||||||||||||||
| Total allowance for loan losses |
22,824 | 23,791 | 25,871 | 27,609 | 28,350 | 28,520 | 29,750 | 32,266 | ||||||||||||||||||||||||
| Allowance for lending-related commitments |
752 | 764 | 750 | 673 | 686 | 626 | 688 | 717 | ||||||||||||||||||||||||
|
|
|
|
|
|
|
|
|
|
|
|
|
|
|
|
|
|||||||||||||||||
| Total allowance for credit losses |
$ | 23,576 | $ | 24,555 | $ | 26,621 | $ | 28,282 | $ | 29,036 | $ | 29,146 | $ | 30,438 | $ | 32,983 | ||||||||||||||||
|
|
|
|
|
|
|
|
|
|
|
|
|
|
|
|
|
|||||||||||||||||
| CREDIT RATIOS |
||||||||||||||||||||||||||||||||
| Wholesale allowance to total wholesale retained loans |
1.46 | % | 1.46 | % | 1.52 | % | 1.55 | % | 1.68 | % | 1.68 | % | 1.84 | % | 2.14 | % | ||||||||||||||||
| Wholesale allowance to total wholesale retained loans, excluding trade finance and conduits (a) |
1.80 | 1.81 | 1.90 | 1.97 | 2.07 | 2.04 | 2.26 | 2.60 | ||||||||||||||||||||||||
| Consumer, excluding credit card allowance, to total consumer, excluding credit card retained loans |
4.40 | 4.65 | 5.02 | 5.28 | 5.33 | 5.20 | 5.13 | 5.03 | ||||||||||||||||||||||||
| Credit card allowance to total credit card retained loans |
4.42 | 4.41 | 5.02 | 5.30 | 5.93 | 6.41 | 7.24 | 8.14 | ||||||||||||||||||||||||
| Total allowance to total retained loans |
3.18 | 3.29 | 3.63 | 3.84 | 4.09 | 4.16 | 4.40 | 4.71 | ||||||||||||||||||||||||
| Wholesale allowance to wholesale retained nonaccrual loans |
261 | 241 | 223 | 180 | 143 | 122 | 92 | 86 | ||||||||||||||||||||||||
| Consumer, excluding credit card allowance, to consumer, excluding credit card retained nonaccrual loans (b)(c)(d) |
137 | 173 | 181 | 220 | 211 | 196 | 192 | 186 | ||||||||||||||||||||||||
| Allowance, excluding credit card allowance, to retained nonaccrual loans, excluding credit card nonaccrual loans (b)(c)(d) |
156 | 185 | 189 | 210 | 192 | 175 | 157 | 148 | ||||||||||||||||||||||||
| Total allowance to total retained nonaccrual loans (c)(d) |
205 | 241 | 249 | 281 | 262 | 243 | 226 | 225 | ||||||||||||||||||||||||
| CREDIT RATIOS, excluding PCI loans |
||||||||||||||||||||||||||||||||
| Consumer, excluding credit card allowance, to total consumer, excluding credit card retained loans |
3.11 | 3.47 | 3.98 | 4.36 | 4.77 | 4.65 | 4.61 | 4.53 | ||||||||||||||||||||||||
| Total allowance to total retained loans |
2.61 | 2.74 | 3.11 | 3.35 | 3.74 | 3.83 | 4.10 | 4.46 | ||||||||||||||||||||||||
| Consumer, excluding credit card allowance, to consumer, excluding credit card retained nonaccrual loans (b)(c)(d) |
77 | 102 | 113 | 143 | 148 | 137 | 135 | 131 | ||||||||||||||||||||||||
| Allowance, excluding credit card allowance, to retained nonaccrual loans, excluding credit card nonaccrual loans (b)(c)(d) |
104 | 127 | 134 | 152 | 147 | 133 | 120 | 114 | ||||||||||||||||||||||||
| Total allowance to total retained nonaccrual loans (c)(d) |
154 | 183 | 194 | 223 | 216 | 201 | 189 | 190 | ||||||||||||||||||||||||
|
|
||||||||||||||||||||||||||||||||
| (a) | Management believes allowance for loan losses to period-end loans retained, excluding CIB’s trade finance and Firm-administered conduits, a non-GAAP financial measure, is a more relevant metric to reflect the allowance coverage of the retained lending portfolio. |
| (b) | The Firm’s policy is generally to exempt credit card loans from being placed on nonaccrual status as permitted by regulatory guidance. Under guidance issued by the FFIEC, credit card loans are charged off by the end of the month in which the account becomes 180 days past due or within 60 days from receiving notification about a specified event (e.g., bankruptcy of the borrower), whichever is earlier. |
| (c) | Nonaccrual loans included $1.7 billion of Chapter 7 loans, based upon regulatory guidance, at September 30, 2012. For further information, see Consumer Credit Portfolio on pages 84-86 of JPMorgan Chase’s third quarter 2012 Form 10-Q. |
| (d) | Nonaccrual loans included $1.3 billion, $1.5 billion and $1.6 billion of performing junior liens that are subordinate to senior liens that were 90 days or more past due at September 30, 2012, June 30, 2012 and March 31, 2012, respectively. Of these totals, $1.2 billion, $1.3 billion and $1.4 billion were current at the respective period ends. Beginning March 31, 2012, such junior liens were reported as nonaccrual loans based upon regulatory guidance issued in the first quarter of 2012. Excluding the incremental nonaccrual loans resulting from the guidance noted, the total allowance to total retained nonaccrual loans ratio at September 30, 2012, June 30, 2012 and March 31, 2012, would have been 282%, 283% and 293%, respectively, and the total allowance to total retained nonaccrual loans excluding PCI loans would have been 211%, 215% and 228%, respectively. |
Page 21
| JPMORGAN CHASE & CO. |
| |
| CREDIT-RELATED INFORMATION, CONTINUED | ||
| (in millions) |
| QUARTERLY TRENDS | FULL YEAR | |||||||||||||||||||||||||||||||||||
| 3Q12 | 2Q12 | 1Q12 | 4Q11 | 3Q11 | 2Q11 | 1Q11 | 2011 | 2010 | ||||||||||||||||||||||||||||
| PROVISION FOR CREDIT LOSSES BY LINE OF BUSINESS |
||||||||||||||||||||||||||||||||||||
| Provision for loan losses |
||||||||||||||||||||||||||||||||||||
| Consumer & Community Banking |
$ | 1,862 | $ | 179 | $ | 642 | $ | 1,838 | $ | 2,291 | $ | 1,938 | $ | 1,552 | $ | 7,619 | $ | 17,495 | ||||||||||||||||||
| Corporate & Investment Bank |
(62) | 31 | (81) | 314 | (32) | (137) | (402) | (257) | (1,215) | |||||||||||||||||||||||||||
| Commercial Banking |
(4) | (31) | 72 | 29 | 73 | 73 | 51 | 226 | 437 | |||||||||||||||||||||||||||
| Asset Management |
15 | 33 | 21 | 23 | 26 | 7 | 5 | 61 | 91 | |||||||||||||||||||||||||||
| Corporate/Private Equity |
(10) | (12) | (8) | (11) | (7) | (9) | (10) | (37) | 14 | |||||||||||||||||||||||||||
|
|
|
|
|
|
|
|
|
|
|
|
|
|
|
|
|
|
|
|||||||||||||||||||
| Total provision for loan losses |
$ | 1,801 | $ | 200 | $ | 646 | $ | 2,193 | $ | 2,351 | $ | 1,872 | $ | 1,196 | $ | 7,612 | $ | 16,822 | ||||||||||||||||||
|
|
|
|
|
|
|
|
|
|
|
|
|
|
|
|
|
|
|
|||||||||||||||||||
| Provision for lending-related commitments |
||||||||||||||||||||||||||||||||||||
| Consumer & Community Banking |
$ | - | $ | - | $ | - | $ | 1 | $ | - | $ | - | $ | - | $ | 1 | $ | (6) | ||||||||||||||||||
| Corporate & Investment Bank |
2 | (2) | 78 | (23) | 66 | (48) | (23) | (28) | (32) | |||||||||||||||||||||||||||
| Commercial Banking |
(12) | 14 | 5 | 11 | (6) | (19) | (4) | (18) | (140) | |||||||||||||||||||||||||||
| Asset Management |
(1) | 1 | (2) | 1 | - | 5 | - | 6 | (5) | |||||||||||||||||||||||||||
| Corporate/Private Equity |
(1) | 1 | (1) | 1 | - | - | - | 1 | - | |||||||||||||||||||||||||||
|
|
|
|
|
|
|
|
|
|
|
|
|
|
|
|
|
|
|
|||||||||||||||||||
| Total provision for lending-related commitments |
$ | (12) | $ | 14 | $ | 80 | $ | (9) | $ | 60 | $ | (62) | $ | (27) | $ | (38) | $ | (183) | ||||||||||||||||||
|
|
|
|
|
|
|
|
|
|
|
|
|
|
|
|
|
|
|
|||||||||||||||||||
| Provision for credit losses |
||||||||||||||||||||||||||||||||||||
| Consumer & Community Banking |
$ | 1,862 | $ | 179 | $ | 642 | $ | 1,839 | $ | 2,291 | $ | 1,938 | $ | 1,552 | $ | 7,620 | $ | 17,489 | ||||||||||||||||||
| Corporate & Investment Bank |
(60) | 29 | (3) | 291 | 34 | (185) | (425) | (285) | (1,247) | |||||||||||||||||||||||||||
| Commercial Banking |
(16) | (17) | 77 | 40 | 67 | 54 | 47 | 208 | 297 | |||||||||||||||||||||||||||
| Asset Management |
14 | 34 | 19 | 24 | 26 | 12 | 5 | 67 | 86 | |||||||||||||||||||||||||||
| Corporate/Private Equity |
(11) | (11) | (9) | (10) | (7) | (9) | (10) | (36) | 14 | |||||||||||||||||||||||||||
|
|
|
|
|
|
|
|
|
|
|
|
|
|
|
|
|
|
|
|||||||||||||||||||
| Total provision for credit losses |
$ | 1,789 | $ | 214 | $ | 726 | $ | 2,184 | $ | 2,411 | $ | 1,810 | $ | 1,169 | $ | 7,574 | $ | 16,639 | ||||||||||||||||||
|
|
|
|
|
|
|
|
|
|
|
|
|
|
|
|
|
|
|
|||||||||||||||||||
|
|
||||||||||||||||||||||||||||||||||||
| PROVISION FOR CREDIT LOSSES BY PORTFOLIO SEGMENT |
||||||||||||||||||||||||||||||||||||
| Provision for loan losses |
||||||||||||||||||||||||||||||||||||
| Wholesale |
$ | (52) | $ | 30 | $ | 8 | $ | 364 | $ | 67 | $ | (55) | $ | (359) | $ | 17 | $ | (673) | ||||||||||||||||||
| Consumer, excluding credit card |
737 | (425) | 2 | 939 | 1,285 | 1,117 | 1,329 | 4,670 | 9,458 | |||||||||||||||||||||||||||
| Credit card |
1,116 | 595 | 636 | 890 | 999 | 810 | 226 | 2,925 | 8,037 | |||||||||||||||||||||||||||
|
|
|
|
|
|
|
|
|
|
|
|
|
|
|
|
|
|
|
|||||||||||||||||||
| Total consumer |
1,853 | 170 | 638 | 1,829 | 2,284 | 1,927 | 1,555 | 7,595 | 17,495 | |||||||||||||||||||||||||||
|
|
|
|
|
|
|
|
|
|
|
|
|
|
|
|
|
|
|
|||||||||||||||||||
| Total provision for loan losses |
$ | 1,801 | $ | 200 | $ | 646 | $ | 2,193 | $ | 2,351 | $ | 1,872 | $ | 1,196 | $ | 7,612 | $ | 16,822 | ||||||||||||||||||
|
|
|
|
|
|
|
|
|
|
|
|
|
|
|
|
|
|
|
|||||||||||||||||||
| Provision for lending-related commitments |
||||||||||||||||||||||||||||||||||||
| Wholesale |
$ | (11) | $ | 13 | $ | 81 | $ | (11) | $ | 60 | $ | (62) | $ | (27) | $ | (40) | $ | (177) | ||||||||||||||||||
| Consumer, excluding credit card |
(1) | 1 | (1) | 2 | - | - | - | 2 | (6) | |||||||||||||||||||||||||||
| Credit card |
- | - | - | - | - | - | - | - | - | |||||||||||||||||||||||||||
|
|
|
|
|
|
|
|
|
|
|
|
|
|
|
|
|
|
|
|||||||||||||||||||
| Total consumer |
(1) | 1 | (1) | 2 | - | - | - | 2 | (6) | |||||||||||||||||||||||||||
|
|
|
|
|
|
|
|
|
|
|
|
|
|
|
|
|
|
|
|||||||||||||||||||
| Total provision for lending-related commitments |
$ | (12) | $ | 14 | $ | 80 | $ | (9) | $ | 60 | $ | (62) | $ | (27) | $ | (38) | $ | (183) | ||||||||||||||||||
|
|
|
|
|
|
|
|
|
|
|
|
|
|
|
|
|
|
|
|||||||||||||||||||
| Provision for credit losses |
||||||||||||||||||||||||||||||||||||
| Wholesale |
$ | (63) | $ | 43 | $ | 89 | $ | 353 | $ | 127 | $ | (117) | $ | (386) | $ | (23) | $ | (850) | ||||||||||||||||||
| Consumer, excluding credit card |
736 | (424) | 1 | 941 | 1,285 | 1,117 | 1,329 | 4,672 | 9,452 | |||||||||||||||||||||||||||
| Credit card |
1,116 | 595 | 636 | 890 | 999 | 810 | 226 | 2,925 | 8,037 | |||||||||||||||||||||||||||
|
|
|
|
|
|
|
|
|
|
|
|
|
|
|
|
|
|
|
|||||||||||||||||||
| Total consumer |
1,852 | 171 | 637 | 1,831 | 2,284 | 1,927 | 1,555 | 7,597 | 17,489 | |||||||||||||||||||||||||||
|
|
|
|
|
|
|
|
|
|
|
|
|
|
|
|
|
|
|
|||||||||||||||||||
| Total provision for credit losses |
$ | 1,789 | $ | 214 | $ | 726 | $ | 2,184 | $ | 2,411 | $ | 1,810 | $ | 1,169 | $ | 7,574 | $ | 16,639 | ||||||||||||||||||
|
|
|
|
|
|
|
|
|
|
|
|
|
|
|
|
|
|
|
|||||||||||||||||||
Page 22
| JPMORGAN CHASE & CO. |
| |
| NON-GAAP FINANCIAL MEASURES |
Page 23
| JPMORGAN CHASE & CO. GLOSSARY OF TERMS |
|
| Page 24 |
| JPMORGAN CHASE & CO. GLOSSARY OF TERMS |
|
| Page 25 |
| JPMORGAN CHASE & CO. GLOSSARY OF TERMS |
|
Page 26