Attached files
| file | filename |
|---|---|
| 8-K - FORM 8-K - Travelport LTD | d448444d8k.htm |
 1
Full Year and Q3 2012 highlights and
business update
Gordon Wilson, President and CEO
Travelport
Exhibit 99.1 |
 2
Travelport is executing its strategic plan
•
Financial Performance is in line with management expectations and is trending
positively: –
–
Gross
Margin
-
four
consecutive
quarters
of
growth
–
Continued
strong
cash
flow
generation
–
YTD
September
cash
flows
from
operations
improved
by
+56%
from
$86m to $134m
–
In compliance with all financial covenants as of September 30, 2012
•
Strategic
plan
is
being
executed
in
content,
product,
technology
and
adjacency
business
growth:
–
Signed significant new technology and hosting agreement with Japan’s leading
GDS, expanded co-operation with China’s leading GDS
–
Acquired and integrated Southern Africa franchise and expanded into new African
regions –
–
Gaining real traction in BtoB travel payments through eNett
–
Increased
deployment
of
new
Point-of-Sale
technology
–
desktop
and
mobile
–
Enhanced on-going technology investment program with new IBM hardware and
software agreement –
Signed and converted high profile travel agencies across all regions
(1)
Excluding the effects of the loss of the United MSA and foreign exchange.
(1)
RevPas - six consecutive quarters of growth Demonstrated
significant growth in Hotel, Merchandising and Rail content |
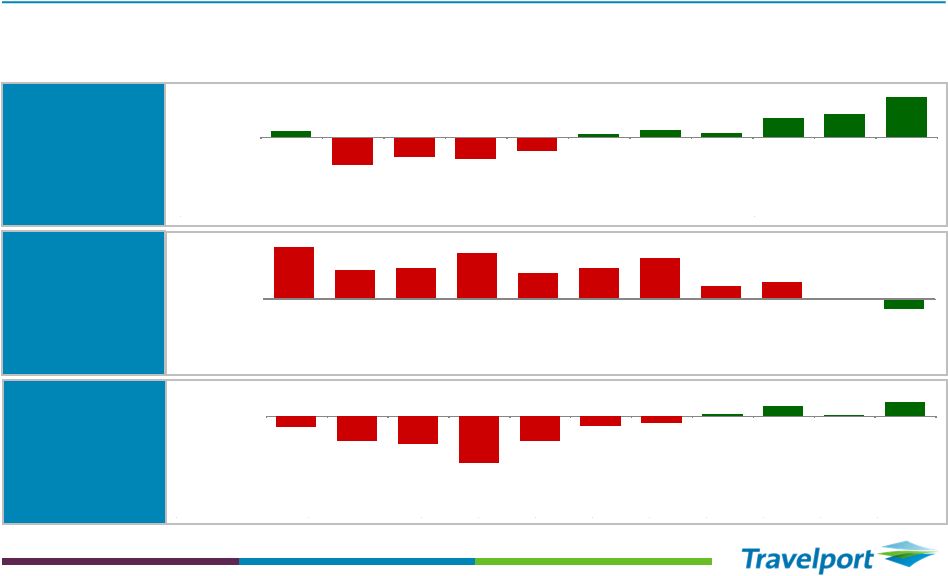 3
Key performance metrics
Note:
RevPas is calculated as transaction processing revenue divided by the number of available
segments. (1)
Year on Year movement excludes the impact of the loss of the United MSA.
(2)
Gross Margin is defined as Total Revenue less Commissions.
Q1 2010
Q2 2010
Q3 2010
Q4 2010
Q1 2011
Q2 2011
Q3 2011
Q4 2011
Q1 2012
Q2 2012
Q3 2012
RevPas
$5.06
$5.23
$5.10
$5.18
$5.01
$5.24
$5.13
$5.19
$5.08
$5.34
$5.30
Year on Year
$0.03
$(0.12)
$(0.08)
$(0.09)
$(0.06)
$0.01
$0.03
$0.02
$0.08
$0.10
$0.17
1%
(2)%
(2)%
(2)%
(1)%
0%
1%
0%
2%
2%
3%
Q1 2010
Q2 2010
Q3 2010
Q4 2010
Q1 2011
Q2 2011
Q3 2011
Q4 2011
Q1 2012
Q2 2012
Q3 2012
COR Per Segment
$2.37
$2.46
$2.45
$2.52
$2.48
$2.60
$2.64
$2.58
$2.56
$2.63
$2.63
Year on Year
$0.21
$0.13
$0.14
$0.20
$0.12
$0.14
$0.19
$0.06
$0.08
$0.00
(1)
$(0.05)
(1)
10%
6%
6%
9%
5%
6%
8%
2%
3%
0%
(1)
(2)%
(1)
RevPas
Year on Year
Growth (Decline)
(2)%
(6)%
(7)%
(11)%
(6)%
(2)%
(2)%
0%
2%
0%
(1)
3%
(1)
Q1 2010
Q2 2010
Q3 2010
Q4 2010
Q1 2011
Q2 2011
Q3 2011
Q4 2011
Q1 2012
Q2 2012
Q3 2012
Gross Margin
$309
$297
$275
$255
$291
$291
$271
$256
$297
$275
$262
Year on Year
$(8)
$(18)
$(20)
$(32)
$(18)
$(7)
$(4)
$1
$7
$1
(1)
$9
(1)
)
Gross Margin ear on Year Growth (Decline)
Gross Margin
(2)
Year on Year
Growth (Decline)
COR Rate
Year on Year
Growth (Decline)
•
2012 revenue per average segment (“RevPas”) growth trajectory follows 2011
priority investment program •
Continued cost of revenue (“COR”) reduction follows product innovation and
increasing customer adoption •
Consecutive quarterly Gross Margin improvement since end 2010; Seventh
consecutive quarter of Gross Margin improvement |
 4
Full year and Q3 highlights
Q3 2012
Better/(Worse)
than
prior year
Proforma
(1)
Better/(Worse)
than prior year
Net revenue
489
(20)
4
Adj. EBITDA
106
(12)
–
Cash flow from
continuing operations
6
18
N/A
Sep YTD 2012
Better/(Worse)
than
prior year
Proforma
(1)
Better/(Worse)
than prior year
Net revenue
1,545
(25)
20
Adj. EBITDA
366
(35)
(7)
Cash flow from
continuing operations
134
48
N/A
Note:
Adjusted EBITDA is defined as EBITDA adjusted to exclude the impact of purchase accounting, impairment
of goodwill and intangibles assets, expenses incurred to acquire and integrate Travelport’s portfolio of
businesses, costs associated with Travelport’s restructuring efforts, non-cash
equity-based compensation, and other adjustments made to exclude expenses management views as outside the normal course of
operations.
(1)
Proforma
variance
is
stated
excluding
the
effects
of
the
loss
of
the
United
MSA
and
foreign
exchange.
•
Global Industry
–
Modest growth in global travel trends with Q3 air
segment volumes +1% YoY amid continued
macroeconomic uncertainty
–
YTD volumes +2% YoY
•
Travelport
–
Q3
volume
(2)%
and
Q3
Net
Revenue
+1%
YoY
(1)
YTD
volume
flat
and
YTD
Net
Revenue
+1%
YoY
(1)
–
Driven largely by geographic footprint
–
Q3 RevPas +3% YoY
–
Driven by growth in hotel distribution,
advertising, travel agency product sales and
merchandising
–
Adjusted EBITDA +$5m in Q3 excluding the impact
of the loss of the United MSA |
 5
Continued strategic execution
•
Enhanced Travel Content
–
Hotel
–
Content more than tripled
–
340k unique hotel properties
–
~900k room offers
–
Air
–
29 air agreements signed YTD
–
New agreements include:
–
Merchandizing milestones include:
–
Car
–
Launched
Travelport
Drive
Me™
in
APAC
–
Signed new content agreement with Italian car
park provider, ParkinGo
–
Rail
–
New uAPI agreement with thetrainline.com
–
Partnership agreement with Rail Europe
–
Innovative content agreement with NTV (Italy)
Americas: Aeromexico, Air Canada
Europe: easyJet, Lufthansa, TAP Portugal
MEA: South African Airways, Gulf Air, PIA
APAC: Air China, China Southern, Qantas
Air Canada, Delta Airlines, easyJet, KLM |
 6
Continued strategic execution (cont'd)
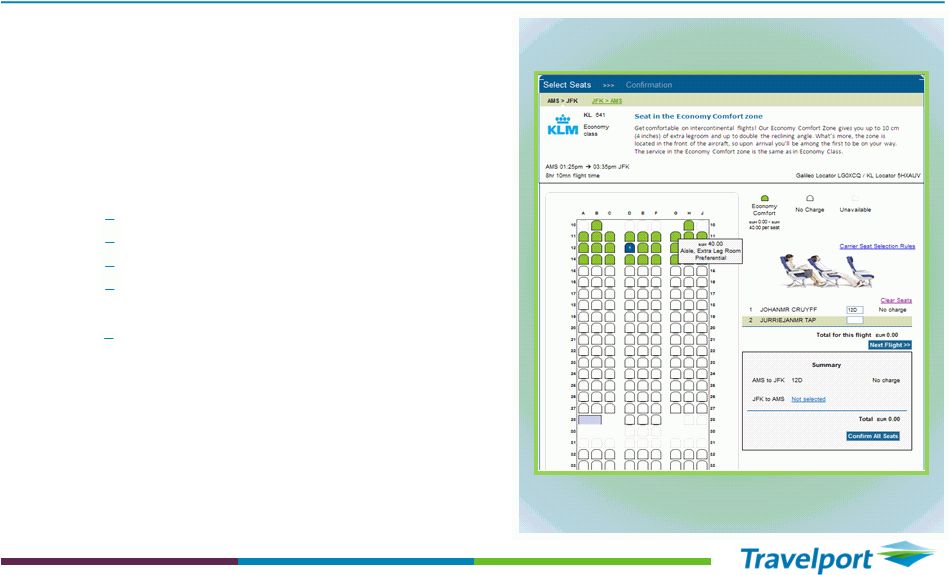
Differentiated Product Momentum
–
Increased adoption of new point of sale technology
–
70% agency and TMC customers targeted to be on
upgraded PoS platforms by end of 2012
–
New innovative mobile technology launched globally
include:
–
Travelport Mobile Agent™, Travelport ViewTrip
Mobile™, GalileoTerminal™
–
Launched
Travelport
Universal
API™
in
MEA
–
Launched first Russian language corporate booking
tool, TripGate
–
Development work with Japan’s AXESS GDS on track
for end of 2013 implementation
–
eNett joint venture continues to progress rapidly:
–
Long-term strategic partnership agreed with
Mastercard
–
2012 TTV on track to exceed $1bn
–
Software-as-a-Service products sold to TUIfly.com,
Copa (Panama), AviancaTaca (Colombia), GOL and
Azul (Brazil) as well as TravelSky (China)
Investing in Key Adjacencies |
 7
Continued strategic execution (cont'd)
•
Targeted Geographical Growth
–
Increasing momentum of high profile customer
migrations to Travelport, including, in Q3:
–
ebookers (France), Statesman Travel (UK), TIX.nl
(Netherlands) and Delgado Travel (US)
–
Multiple customer renewals in all regions
–
Successful expansion in growth regions, most
recently:
–
New Africa distributor in Tanzania
–
New East African hub operation in Kenya
–
2nd Travelport Russian operation in St. Petersburg
•
Technology Investment
–
Executed new hardware and software
agreement with IBM to further
advance platform delivery –
Technology co-operation agreement with HRG
–
No service interruptions or performance issues
•
Multiple Technology and Travel industry accolades:
–
Gold
“Stevie”
-
American
Business
Award
for
“Information Technology Team of the Year”
–
“Best GDS”
in APAC
–
“Favorite GDS”
in Canada |
 8
Geography / customer segments
RevPas
$5.01
$5.24
$5.13
$5.19
$5.08
$5.34
$5.30
Q1
Q2
Q3
Q4
Region
(2)
2012
2011
Better /
(Worse)
Proforma
(1)
Better / (Worse)
Americas
41
45
(6.2%)
(0.8%)
Europe
21
21
0.7%
0.7%
APAC
13
14
(9.2%)
(9.2%)
MEA
10
9
0.9%
0.9%
Global
85
89
(4.4%)
(1.7%)
Travelport GDS Q3 Segments
(In millions)
(1)
Proforma variance is stated excluding the effect of the loss of the United MSA.
(2)
Brazil is combined with Europe and not Americas.
•
Q3 softening in air volume growth in US (33% of global
GDS volume) and Western Europe (27% of global
GDS volume)
•
BRICS region, however, still showing growth in Q3
YoY, except India and Brazil:
–
Russia 39%
–
China 23%
–
South Africa 9%
–
India impacted by demise of Kingfisher Airlines
•
Low Cost Carriers (LCCs) continue segment growth:
–
7% of Travelport GDS YTD air segments
–
Travelport developing improved LCC connectivity
as a source of further growth
•
Q3 RevPas $5.30 or +3% YoY reflecting:
–
New Travelport products and services
–
Growth in hotels and advertising sales |
 9
Q3 2012 financial results
Philip Emery, CFO
Travelport |
 10
Financial highlights
•
Excluding the impact of foreign exchange and loss of the United MSA, Q3 Net Revenue
and Sep YTD Net Revenue are both +1% higher compared to prior year. On an
actual basis, Q3 Net Revenue is (4)% lower and Sep YTD Net Revenue is (2)%
lower compared to prior year. •
Excluding the impact of foreign exchange and loss of the United MSA, Q3 Adjusted
EBITDA is flat compared to prior year
and
Sep
YTD
Adjusted
EBITDA
is
(2)%
lower
compared
to
prior
year,
which
is
in
line
with
management
expectations. On an actual basis, Q3 Adjusted EBITDA is (10)% lower and Sep YTD
Adjusted EBITDA is (9)% lower than prior year.
•
Q3 and Sep YTD Adjusted EBITDA include $16 million and $44 million of amortization
charges for upfront payments to travel agencies, respectively. Working
capital includes $158 million of upfront payments and prepaid commissions as
of September 30, 2012. •
Sep YTD Interest expense of $215 million is $8 million lower in 2012 due to a lower
net debt balance and favorable impact of interest rate hedges, offset by a
higher underlying interest rate. •
Cash flows from operations in Q3 of $6 million is $18 million higher compared to
prior year primarily as a result of a decrease in cash interest payments and
fluctuations in our collections and payments cycles. •
Q3 unlevered free cash flow of $57 million is $8 million higher than prior year and
represents 54% of Adjusted EBITDA.
For
Sep
YTD,
unlevered
free
cash
flow
of
$262
million
is
$(3)
million
lower
than
prior
year
and
represents
72% of Adjusted EBITDA. |
 Net
revenue Net Revenue
Q3 2012
Better/(Worse)
than prior year
Sep YTD 2012
Better/(Worse)
than prior year
Transaction Processing
451
(5)
1,414
3
Airline IT Solutions
38
(15)
131
(28)
Net Revenue
489
(20)
1,545
(25)
509
485
489
(24)
4
(0)
Q3 2011
Net Revenue
United MSA
and FX
Q3 2011
Proforma
Net Revenue
Transaction
Processing
Airline IT
Solutions
Q3 2012
Net Revenue
1,570
1,525
1,545
(45)
23
(3)
Sep YTD
2011
Net Revenue
United MSA
and FX
Sep YTD
2011
Proforma
Net Revenue
Transaction
Processing
Airline IT
Solutions
Sep YTD
2012
Net Revenue
Net Revenue Bridge Sep YTD 2012
Net Revenue Bridge Q3 2012
11 |
 12
Summary income statements
(1)
Proforma
variance
is
stated
excluding
the
effects
of
the
loss
of
the
United
MSA
and
foreign
exchange.
Net Revenue
Q3 2012
Better /
(Worse)
than prior
year
Proforma
(1)
Better/
(Worse) than
prior year
Sep YTD
2012
Better/
(Worse)
than prior
year
Proforma
(1)
Better/
(Worse) than
prior year
Net revenue
489
(20)
4
1,545
(25)
20
Adjusted EBITDA
106
(12)
–
366
(35)
(7)
Operating income
27
(24)
(12)
155
(41)
(13)
Interest expense, net
(71)
3
3
(215)
8
8
Gain on early extinguishment of debt
5
5
5
6
6
6
Loss from continuing operations before
income taxes and equity in investment in
Orbitz Worldwide
(39)
(16)
(4)
(54)
(27)
1 |
 13
Summary of cash flows
Q3 2012
Better/(Worse)
than prior year
Sep YTD 2012
Better/(Worse)
than prior year
Adjusted EBITDA
106
(12)
366
(35)
Less:
Cash interest payments
(86)
3
(202)
38
Tax payments
(5)
(1)
(9)
4
Changes in operating working capital
12
30
44
53
FASA liability payments
–
3
(7)
5
Defined benefit pension plan funding
(10)
1
(15)
(2)
Other adjusting items
(11)
(6)
(43)
(15)
Net cash provided by operating
activities of continuing operations
6
18
134
48
Add cash interest payments
86
(3)
202
(38)
Less capital expenditures
(29)
(8)
(61)
(11)
Less repayments of capital leases
(6)
1
(13)
(2)
Unlevered free cash flow
57
8
262
(3)
Cash flow conversion
54%
72% |