Attached files
| file | filename |
|---|---|
| 8-K - FORM 8-K - GOLUB CAPITAL BDC, Inc. | v783308-1_8k.htm |
Golub Capital BDC, Inc. Investor Presentation Quarter Ended September 30, 2012
1 Disclaimer Some of the statements in this presentation constitute forward - looking statements, which relate to future events or our future performance or financial condition. The forward - looking statements contained in this presentation involve risks and uncertainties, including statements a s to: our future operating results; our business prospects and the prospects of our portfolio companies; the effect of investments that we expect to mak e; our contractual arrangements and relationships with third parties; actual and potential conflicts of interest with GC Advisors LLC ("GC Advis ors "), our investment adviser, and other affiliates of Golub Capital Incorporated and Golub Capital LLC (collectively, "Golub Capital"); the dependence of o ur future success on the general economy and its effect on the industries in which we invest; the ability of our portfolio companies to achieve their obj ectives; the use of borrowed money to finance a portion of our investments; the adequacy of our financing sources and working capital; the timing of cash flo ws, if any, from the operations of our portfolio companies; the ability of GC Advisors to locate suitable investments for us and to monitor and ad min ister our investments; the ability of GC Advisors or its affiliates to attract and retain highly talented professionals; our ability to qualify and main tai n our qualification as a regulated investment company and as a business development company; the impact on our business of the Dodd - Frank Wall Street Reform and Consumer Protection Act and the rules and regulations issued thereunder; and the effect of changes to tax legislation and our tax posi tio n . Such forward - looking statements may include statements preceded by, followed by or that otherwise include the words “may,” “might,” “will,” “intend,” “should,” “could,” “can,” “would,” “expect,” “believe,” “estimate,” “anticipate,” “predict,” “potential,” “plan” or similar words. We have based the forward - looking statements included in this presentation on information available to us on the date of this prese ntation, and we assume no obligation to update any such forward - looking statements. Actual results could differ materially from those implied or expres sed in our forward - looking statements for any reason, and future results could differ materially from historical performance. Although we undertake no o bli gation to revise or update any forward - looking statements, whether as a result of new information, future events or otherwise, you are advised to consult a ny additional disclosures that we may make directly to you or through reports that we have filed or in the future may file with the Securities and Exch ang e Commission (“SEC”), including annual reports on Form 10 - K, quarterly reports on Form 10 - Q and current reports on Form 8 - K. This presentation contains statistics and other data that have been obtained from or compiled from information made available by t hir d - party service providers. We have not independently verified such statistics or data.
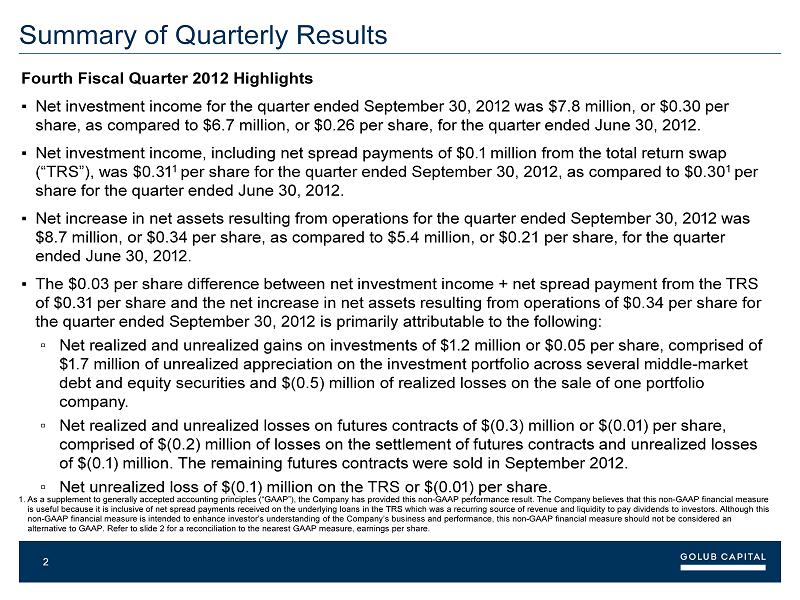
2 Summary of Quarterly Results Fourth Fiscal Quarter 2012 Highlights ▪ Net investment income for the quarter ended September 30, 2 01 2 was $7.8 million, or $0.30 per share, as compared to $6.7 million, or $0.26 per share, for the quarter ended June 30, 2 01 2. ▪ Net investment income, including net spread payments of $0 .1 million from the total return swap (“TRS”), was $0. 3 1 1 per share for the quarter ended September 30, 2 01 2, as compared to $0.30 1 per share for the quarter ended June 30, 2 01 2. ▪ Net increase in net assets resulting from operations for the quarter ended September 30, 2 01 2 was $8.7 million, or $0.34 per share, as compared to $5.4 million, or $0.21 per share, for the quarter ended June 30, 2 01 2. ▪ The $0.03 per share difference between net investment income + net spread payment from the TRS of $ 0. 31 per share and the net increase in net assets resulting from operations of $ 0.34 per share for the quarter ended September 30, 2 01 2 is primarily attributable to the following: ▫ Net realized and unrealized gains on investments of $1 .2 million or $0.05 per share, comprised of $1 .7 million of unrealized appreciation on the investment portfolio across several middle - market debt and equity securities and $(0.5) million of realized losses on the sale of one portfolio company. ▫ Net realized and unrealized losses on futures contracts of $(0.3) million or $(0. 01 ) per share, comprised of $(0.2) million of losses on the settlement of futures contracts and unrealized losses of $(0 .1 ) million. The remaining futures contracts were sold in September 2 01 2. ▫ Net unrealized loss of $(0 .1 ) million on the TRS or $(0. 01 ) per share. 1. As a supplement to generally accepted accounting principles (“GAAP”), the Company has provided this non - GAAP performance result. The Company believes that this non - GAAP financial measure is useful because it is inclusive of net spread payments received on the underlying loans in the TRS which was a recurring so urc e of revenue and liquidity to pay dividends to investors. Although this non - GAAP financial measure is intended to enhance investor’s understanding of the Company’s business and performance, this non - G AAP financial measure should not be considered an alternative to GAAP. Refer to slide 2 for a reconciliation to the nearest GAAP measure, earnings per share.
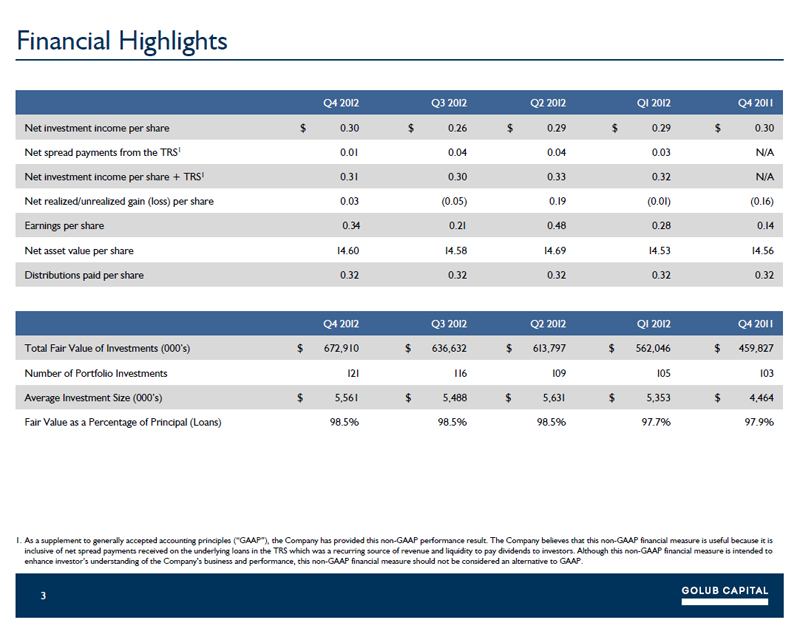
3 Financial Highlights Q4 2 01 2 Q3 2 01 2 Q2 2 01 2 Q1 2 01 2 Q4 2 01 1 Net investment income per share $ 0.30 $ 0.26 $ 0.29 $ 0.29 $ 0.30 Net spread payments from the TRS 1 0.01 0.04 0.04 0.03 N/A Net investment income per share + TRS 1 0.31 0.30 0.33 0.32 N/A Net realized /unrealized gain (loss) per share 0.03 (0.05) 0 .1 9 (0. 01 ) (0 .1 6) Earnings per share 0. 34 0. 2 1 0.48 0.28 0 .1 4 Net asset value per share 1 4.60 1 4.58 1 4.69 1 4.53 1 4.56 Distributions paid per share 0.32 0.32 0.32 0.32 0.32 Q4 2 01 2 Q3 2 01 2 Q2 2 01 2 Q1 2 01 2 Q4 2 01 1 Total Fair Value of Investments (000’s) $ 672,910 $ 636,632 $ 61 3,797 $ 562,046 $ 459,827 Number of Portfolio Investments 121 11 6 1 09 1 05 1 03 Average Investment Size (000’s) $ 5,561 $ 5,488 $ 5,6 3 1 $ 5,353 $ 4,464 Fair Value as a Percentage of Principal (Loans) 98.5% 98.5% 98.5% 97.7% 97.9% 1. As a supplement to generally accepted accounting principles (“GAAP”), the Company has provided this non - GAAP performance result. The Company believes that this non - GAAP financial measure is useful because it is inclusive of net spread payments received on the underlying loans in the TRS which was a recurring so urc e of revenue and liquidity to pay dividends to investors. Although this non - GAAP financial measure is intended to enhance investor’s understanding of the Company’s business and performance, this non - G AAP financial measure should not be considered an alternative to GAAP.
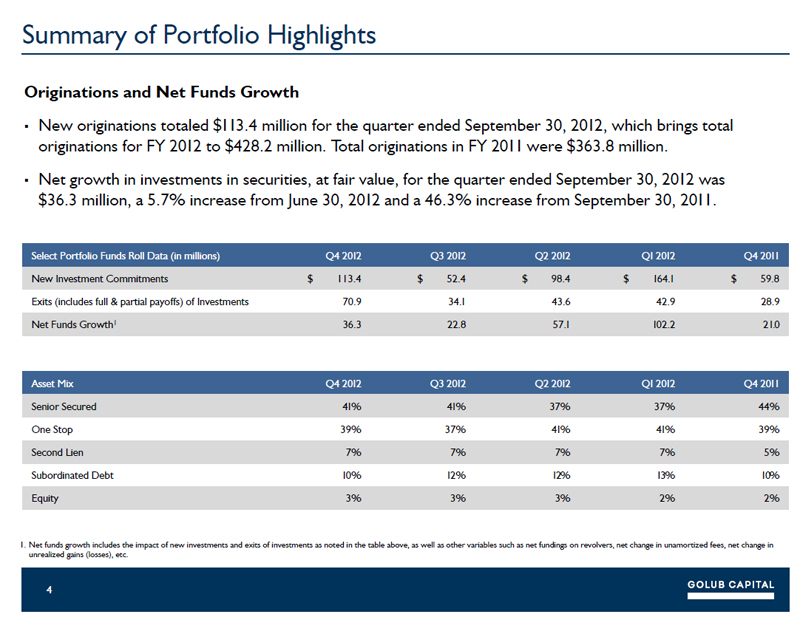
4 Summary of Portfolio Highlights Originations and Net Funds Growth ▪ New originations totaled $11 3.4 million for the quarter ended September 30, 2 01 2, which brings total originations for FY 2 01 2 to $428.2 million. Total originations in FY 2 011 were $363.8 million. ▪ Net growth in investments in securities, at fair value, for the quarter ended September 30, 2 01 2 was $36.3 million, a 5.7% increase from June 30, 2 01 2 and a 46.3% increase from September 30, 2 01 1 . Select Portfolio Funds Roll Data (in millions) Q4 2 01 2 Q3 2 01 2 Q2 2 01 2 Q1 2 01 2 Q4 2 01 1 New Investment Commitments $ 113.4 $ 52.4 $ 98.4 $ 1 64 . 1 $ 59.8 Exits (includes full & partial payoffs) of Investments 70.9 34 . 1 43.6 42.9 28.9 Net Funds Growth 1 36.3 22.8 57 . 1 1 02.2 2 1. 0 Asset Mix Q4 2 01 2 Q3 2 01 2 Q2 2 01 2 Q1 2 01 2 Q4 2 01 1 Senior Secured 41 % 41 % 37% 37% 44% One Stop 39% 37% 41 % 41 % 39% Second Lien 7% 7% 7% 7% 5% Subordinated Debt 1 0 % 1 2% 12 % 13 % 10 % Equity 3% 3% 3% 2% 2% 1. Net funds growth includes the impact of new investments and exits of investments as noted in the table above, as well as othe r v ariables such as net fundings on revolvers, net change in unamortized fees, net change in unrealized gains (losses), etc.
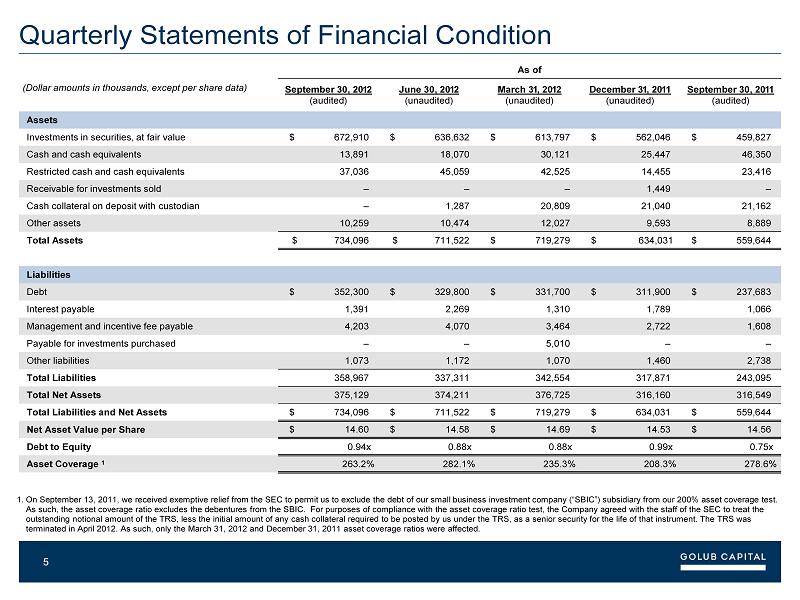
5 Quarterly Statements of Financial Condition As of (Dollar amounts in thousands , except per share data) September 30, 2 01 2 (audited ) June 30, 2 01 2 (unaudited ) March 31 , 2 01 2 (unaudited ) December 31 , 2 01 1 (unaudited ) September 30 , 2 01 1 (audited ) Assets Investments in securities, at fair value $ 672,910 $ 636,632 $ 613,797 $ 562,046 $ 459,827 Cash and cash equivalents 13,891 18,070 30,121 25,447 46,350 Restricted cash and cash equivalents 37,036 45,059 42,525 14,455 23,416 Receivable for investments sold – – – 1,449 – Cash collateral on deposit with custodian – 1,287 20,809 21,040 21,162 Other assets 10,259 10,474 12,027 9,593 8,889 Total Assets $ 734,096 $ 711,522 $ 719,279 $ 634,031 $ 559,644 Liabilities Debt $ 352,300 $ 329,800 $ 331,700 $ 311,900 $ 237,683 Interest payable 1,391 2,269 1,310 1,789 1,066 Management and incentive fee payable 4,203 4,070 3,464 2,722 1,608 Payable for investments purchased – – 5,010 – – Other liabilities 1,073 1,172 1,070 1,460 2,738 Total Liabilities 358,967 337,311 342,554 317,871 243,095 Total Net Assets 375,129 374,211 376,725 316,160 316,549 Total Liabilities and Net Assets $ 734,096 $ 711,522 $ 719,279 $ 634,031 $ 559,644 Net Asset Value per Share $ 14.60 $ 14.58 $ 14.69 $ 14.53 $ 14.56 Debt to Equity 0.94x 0.88x 0.88x 0.99x 0.75x Asset Coverage 1 263.2% 282.1% 235.3% 208.3% 278.6% 1. On September 13, 2011, we received exemptive relief from the SEC to permit us to exclude the debt of our small business inves tme nt company (“SBIC”) subsidiary from our 200% asset coverage test. As such, the asset coverage ratio excludes the debentures from the SBIC. For purposes of compliance with the asset coverage ratio test, the Company agreed with the staff of the SEC to treat the outstanding notional amount of the TRS, less the initial amount of any cash collateral required to be posted by us under the TRS , as a senior security for the life of that instrument. The TRS was terminated in April 2012. As such, only the March 31, 2012 and December 31, 2011 asset coverage ratios were affected.
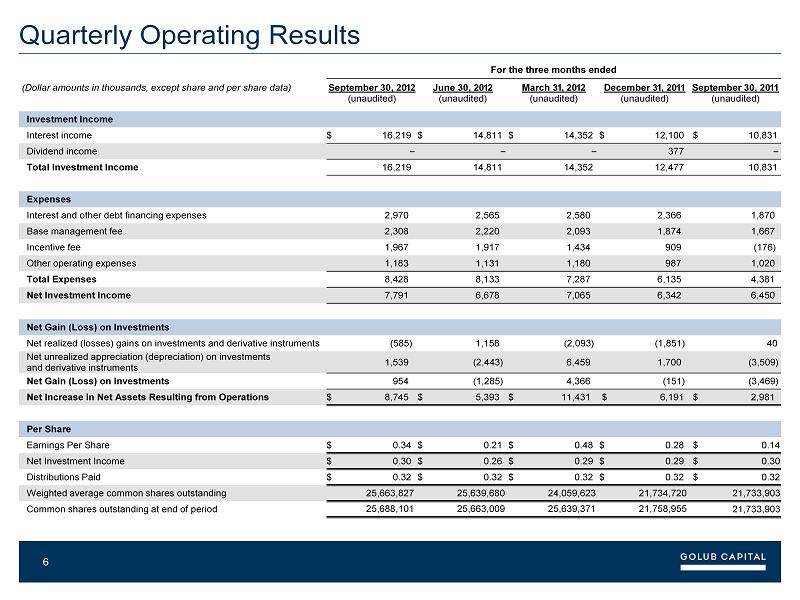
6 Quarterly Operating Results For the three months ended (Dollar amounts in thousands, except share and per share data) September 30 , 2 01 2 (unaudited) June 30 , 2 01 2 (unaudited) March 31 , 2 01 2 (unaudited) December 31 , 2 01 1 (unaudited) September 3 0 , 2 01 1 (unaudited) Investment Income Interest income $ 16,219 $ 14,811 $ 14,352 $ 12,100 $ 10,831 Dividend income – – – 377 – Total Investment Income 16,219 14,811 14,352 12,477 10,831 Expenses Interest and other debt financing expenses 2,970 2,565 2,580 2,366 1,870 Base management fee 2,308 2,220 2,093 1,874 1,667 Incentive fee 1,967 1,917 1,434 909 (176) Other operating expenses 1,183 1,131 1,180 987 1,020 Total Expenses 8,428 8,133 7,287 6,135 4,381 Net Investment Income 7,791 6,678 7,065 6,342 6,450 Net Gain (Loss) on Investments Net realized (losses) gains on investments and derivative instruments (585) 1,158 (2,093) (1,851) 40 Net unrealized appreciation (depreciation) on investments and derivative instruments 1,539 (2,443) 6,459 1,700 (3,509) Net Gain (Loss) on Investments 954 (1,285) 4,366 (151) (3,469) Net Increase in Net Assets Resulting from Operations $ 8,745 $ 5,393 $ 11,431 $ 6,191 $ 2,981 Per Share Earnings P er Share $ 0.34 $ 0.21 $ 0.48 $ 0.28 $ 0.14 Net Investment Income $ 0.30 $ 0.26 $ 0.29 $ 0.29 $ 0.30 Distributions Paid $ 0.32 $ 0.32 $ 0.32 $ 0.32 $ 0.32 Weighted average common shares outstanding 25,663,827 25,639,680 24,059,623 21,734,720 21,733,903 Common shares outstanding at end of period 25,688,101 25,663,009 25,639,371 21,758,955 21,733,903
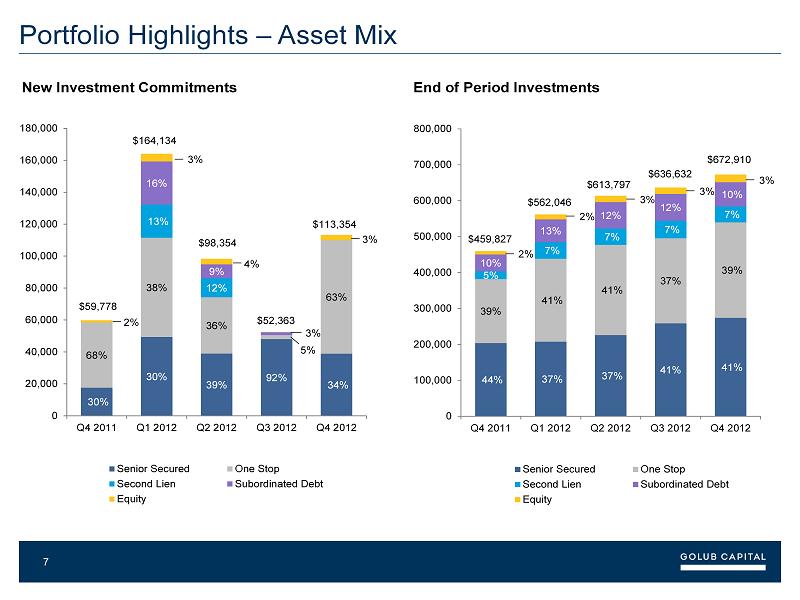
7 Portfolio Highlights – Asset Mix New Investment Commitments End of Period Investments 30% 30% 39% 92% 34% 68% 38% 36% 63% 13% 12% 16% 9% 0 20,000 40,000 60,000 80,000 100,000 120,000 140,000 160,000 180,000 Q4 2011 Q1 2012 Q2 2012 Q3 2012 Q4 2012 Senior Secured One Stop Second Lien Subordinated Debt Equity 44% 37% 37% 41% 41% 39% 41% 41% 37% 39% 5% 7% 7% 7% 7% 10% 13% 12% 12% 10% 0 100,000 200,000 300,000 400,000 500,000 600,000 700,000 800,000 Q4 2011 Q1 2012 Q2 2012 Q3 2012 Q4 2012 Senior Secured One Stop Second Lien Subordinated Debt Equity 2 % 6% 3 % 2% $459,827 2 % $59,778 $562,046 $164,134 4 % $98,354 3 % $613,797 $52,363 5 % 3% $636,632 3 % 3 % $113,354 $672,910 3 %
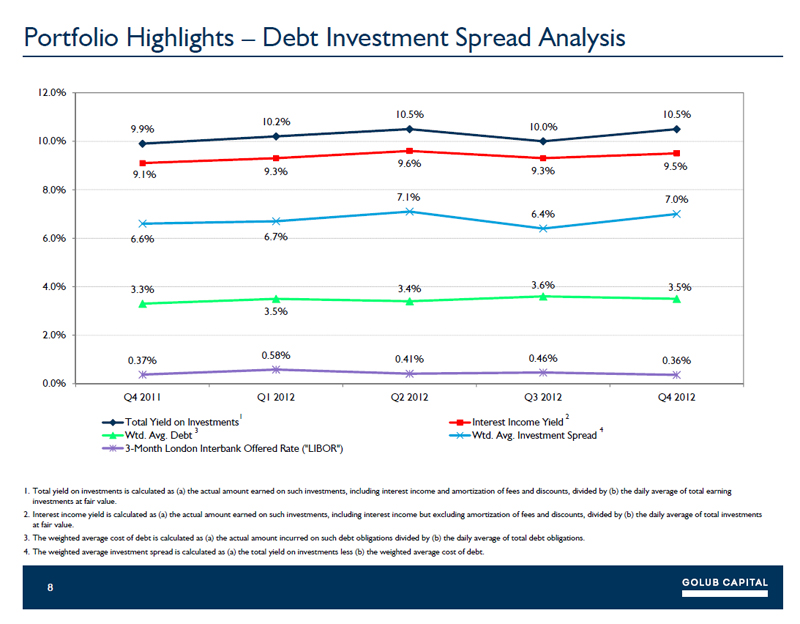
8 Portfolio Highlights – Debt Investment Spread Analysis 1. Total yield on investments is calculated as (a) the actual amount earned on such investments, including interest income and a mor tization of fees and discounts, divided by (b) the daily average of total earning investments at fair value. 2. Interest income yield is calculated as (a) the actual amount earned on such investments, including interest income but exclud ing amortization of fees and discounts, divided by (b) the daily average of total investments at fair value. 3. The weighted average cost of debt is calculated as (a) the actual amount incurred on such debt obligations divided by (b) the da ily average of total debt obligations. 4. The weighted average investment spread is calculated as (a) the total yield on investments less (b) the weighted average cost of debt. 9.9% 10.2% 10.5% 10.0% 10.5% 9.1% 9.3% 9.6% 9.3% 9.5% 3.3% 3.5% 3.4% 3.6% 3.5% 6.6% 6.7% 7.1% 6.4% 7.0% 0.37% 0.58% 0.41% 0.46% 0.36% 0.0% 2.0% 4.0% 6.0% 8.0% 10.0% 12.0% Q4 2011 Q1 2012 Q2 2012 Q3 2012 Q4 2012 Total Yield on Investments Interest Income Yield Wtd. Avg. Debt Wtd. Avg. Investment Spread 3-Month London Interbank Offered Rate ("LIBOR") 1 2 3 4
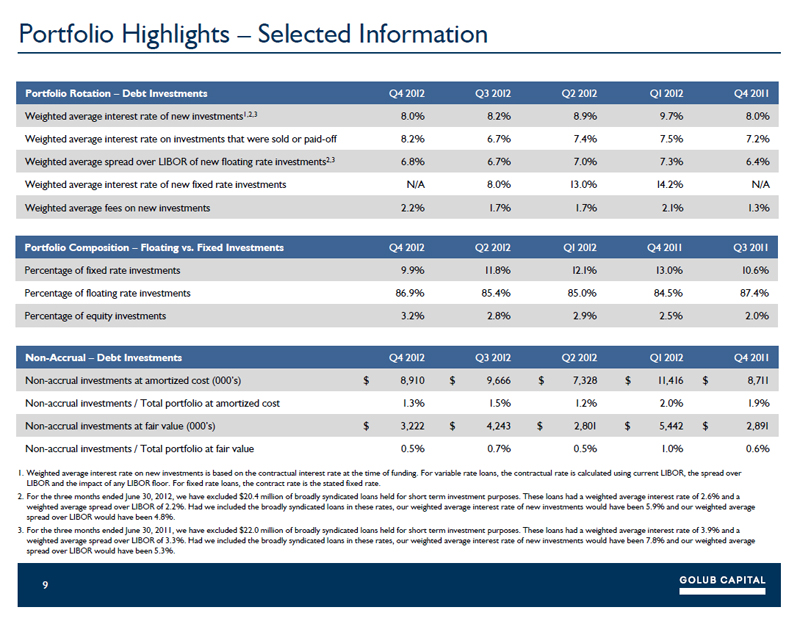
9 Portfolio Highlights – Selected Information Portfolio Rotation – Debt Investments Q4 2 01 2 Q3 2 01 2 Q2 2 01 2 Q1 2 01 2 Q4 2 01 1 Weighted average interest rate of new investments 1,2,3 8.0% 8.2% 8.9% 9.7% 8.0% Weighted average interest rate on investments that were sold or paid - off 8.2% 6.7% 7.4% 7.5% 7.2% Weighted average spread over LIBOR of new floating rate investments 2,3 6.8% 6.7% 7.0% 7.3% 6.4% Weighted average interest rate of new fixed rate investments N/A 8.0% 1 3.0% 1 4.2% N/A Weighted average fees on new investments 2.2% 1 .7% 1 .7% 2 .1 % 1 .3% Portfolio Composition – Floating vs. Fixed Investments Q4 2 01 2 Q2 2 01 2 Q1 2 01 2 Q4 2 01 1 Q3 2 01 1 Percentage of fixed rate investments 9.9% 11 .8% 1 2 .1 % 1 3.0% 1 0.6% Percentage of floating rate investments 86.9% 85.4% 85.0% 84.5% 87.4% Percentage of equity investments 3.2% 2.8% 2.9% 2.5% 2.0% Non - Accrual – Debt Investments Q4 2 01 2 Q3 2 01 2 Q2 2 01 2 Q1 2 01 2 Q4 2 01 1 Non - accrual investments at amortized cost (000’s) $ 8,910 $ 9,666 $ 7,328 $ 11 ,4 1 6 $ 8, 71 1 Non - accrual investments / Total portfolio at amortized cost 1 .3% 1 .5% 1 .2% 2.0% 1 .9% Non - accrual investments at fair value (000’s) $ 3,222 $ 4,243 $ 2,8 0 1 $ 5,442 $ 2,8 9 1 Non - accrual investments / Total portfolio at fair value 0.5% 0.7% 0.5% 1 .0% 0.6% 1. Weighted average interest rate on new investments is based on the contractual interest rate at the time of funding. For varia ble rate loans, the contractual rate is calculated using current LIBOR, the spread over LIBOR and the impact of any LIBOR floor. For fixed rate loans, the contract rate is the stated fixed rate. 2. For the three months ended June 30, 2012, we have excluded $20.4 million of broadly syndicated loans held for short term inve stm ent purposes. These loans had a weighted average interest rate of 2.6% and a weighted average spread over LIBOR of 2.2%. Had we included the broadly syndicated loans in these rates, o ur weighted average interest rate of new investments would have been 5.9% and our weighted average spread over LIBOR would have been 4.8%. 3. For the three months ended June 30, 2011, we have excluded $22.0 million of broadly syndicated loans held for short term inve stm ent purposes. These loans had a weighted average interest rate of 3.9% and a weighted average spread over LIBOR of 3.3%. Had we included the broadly syndicated loans in these rates, o ur weighted average interest rate of new investments would have been 7.8% and our weighted average spread over LIBOR would have been 5.3%.
10 Credit Quality Credit Quality – Investment Portfolio ▪ Fundamental credit quality remains strong with non - earning assets as a percentage of total investments at fair value improving from 0.7% at June 30, 2 01 2 to 0.5% at September 30, 2 01 2. ▪ Performance ratings on the investment portfolio have remained stable for the past several quarters and over 90.0% of the investments in our portfolio had a risk rating of 4 or higher as of September 30, 2 01 2. ▪ The average fair value of investments as a percentage of par value remained stable at 98.5% for the period ended September 30, 2 01 2.
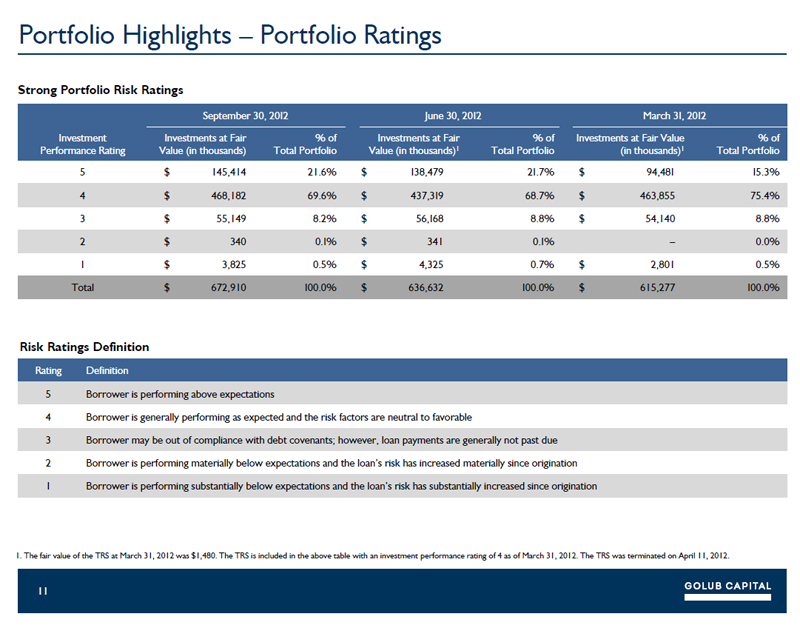
11 Portfolio Highlights – Portfolio Ratings Risk Ratings Definition Rating Definition 5 Borrower is performing above expectations 4 Borrower is generally performing as expected and the risk factors are neutral to favorable 3 Borrower may be out of compliance with debt covenants; however, loan payments are generally not past due 2 Borrower is performing materially below expectations and the loan’s risk has increased materially since origination 1 Borrower is p erforming substantially below expectations and the loan’s risk has substantially increased since origination Strong Portfolio Risk Ratings 1. The fair value of the TRS at March 31, 2012 was $1,480. The TRS is included in the above table with an investment performa nce rating of 4 as of March 31, 2012. The TRS was terminated on April 11, 2012. September 30 , 2 01 2 June 30 , 2 01 2 March 31 , 2 01 2 Investment Performance Rating Investments at Fair Value (in thousands) % of Total Portfolio Investments at Fair Value (in thousands) 1 % of Total Portfolio Investments at Fair Value (in thousands) 1 % of Total Portfolio 5 $ 145,414 21.6% $ 1 38,479 21 .7% $ 94,4 8 1 1 5.3% 4 $ 468,182 69.6% $ 437, 31 9 68.7% $ 463,855 75.4% 3 $ 55,149 8.2% $ 56 ,1 68 8.8% $ 54,140 8.8% 2 $ 340 0 .1 % $ 341 0 .1 % – 0.0% 1 $ 3,825 0.5% $ 4,325 0.7% $ 2,801 0.5% Total $ 672,910 1 00.0% $ 636,632 1 00.0% $ 615,277 1 00.0%

12 Common Stock and Distribution Information Common Stock Data Distribution Data Date Declared Record Date Payment Date Amount Per Share Total Amount (in thousands) February 8, 2 01 1 March 1 8, 2 01 1 March 30, 2 01 1 $0.32 $5,676 May 3, 2 01 1 June 1 7, 2 01 1 June 29, 2 01 1 $0.32 $6,947 August 4, 2 01 1 September 1 9, 2 01 1 September 28, 2 01 1 $0.32 $6,955 December 7, 2 01 1 December 1 9, 2 01 1 December 29, 2 01 1 $0.32 $6,955 February 2, 2 01 2 March 1 6, 2 01 2 March 29, 2 01 2 $0.32 $8,083 May 1 , 2 01 2 June 1 5, 2 01 2 June 29, 2 01 2 $0.32 $8,205 August 2, 2 01 2 September 1 3, 2 01 2 September 27, 2 01 2 $0.32 $8,212 November 27, 2012 December 14, 2012 December 28, 2012 $0.32 $8,220 Fiscal Year Ended September 30, 2 01 1 High Low End of Period First Quarter $1 7.95 $1 5.44 $1 7 .1 2 Second Quarter $1 7.60 $1 5.78 $1 5.78 Third Quarter $1 6.30 $1 4.40 $1 4.93 Fourth Quarter $1 5. 8 1 $1 4.00 $1 4.85 Fiscal Year Ended September 30, 2 01 2 First Quarter $1 6.00 $1 4 .1 6 $1 5.50 Second Quarter $1 5.95 $1 4.57 $1 5.27 Third Quarter $1 5.18 $1 4.25 $1 5.09 Fourth Quarter $1 6 .00 $15 .05 $1 5.90
13 Liquidity and Investment Capacity Cash and Cash Equivalents ▪ Unrestricted cash totaled $1 3.9 million as of September 30, 2 01 2. ▪ Restricted cash totaled $37.0 million as of September 30, 2 01 2. Restricted cash was held in our securitization vehicle, SBIC subsidiary and our revolving credit facility and is available for new investments that qualify for acquisition by these entities. Senior Secured Revolving Credit Facility ▪ As of September 30, 2 01 2, subject to leverage and borrowing base restrictions, we had approximately $20.2 million available for additional borrowings on our revolving credit facility. ▪ The revolving credit facility was amended effective October 21 , 2 01 2 to extend the reinvestment period through October 21 , 2 01 3 and extend the maturity date from October 21 , 2 01 5 to October 20 , 2 01 7. SBIC Financing ▪ As of September 30, 2 01 2, we had $26.5 million in approved and available debentures through our wholly - owned subsidiary, GC SBIC IV, L.P. The commitment may be drawn upon subject to customary Small Business Association (“SBA”) approval procedures. After this commitment is fully drawn, GC SBIC IV, L.P. will have $1 50 million in debentures outstanding.

14 Liquidity and Investment Capacity Public Offering ▪ On October 16, 2012, we priced a public offering of 2,600,000 shares of our common stock at a public offering price of $15.58 per share, raising approximately $40.5 million in gross proceeds. Wells Fargo Securities, LLC and UBS Securities LLC acted as joint book - running managers for the offering. On October 19, 2012, the transaction closed, the shares were issued, and proceeds, net of offering costs but before expenses, of $39.4 million were received. ▪ On November 14, 2012, we sold an additional 294,120 shares pursuant to the underwriters’ partial exercise of the over - allotment option and we received net proceeds, before expenses, of $4.4 million. ▪ A trust organized by Golub Capital for the purpose of awarding incentive compensation purchased an aggregate of $3.0 million of shares in our October 2012 offering at the public offering price.