Attached files
| file | filename |
|---|---|
| 8-K - ROSETTA RESOURCES INC 8-K 11-27-2012 - NBL Texas, LLC | form8k.htm |
Exhibit 99.1

REDEFINED
BUILDING VALUE IN UNCONVENTIONAL RESOURCES
Investor Presentation
NOVEMBER 2012
Forward-Looking Statements and Terminology Used
2

Forward-Looking Statements and Terminology Used (cont.)
3
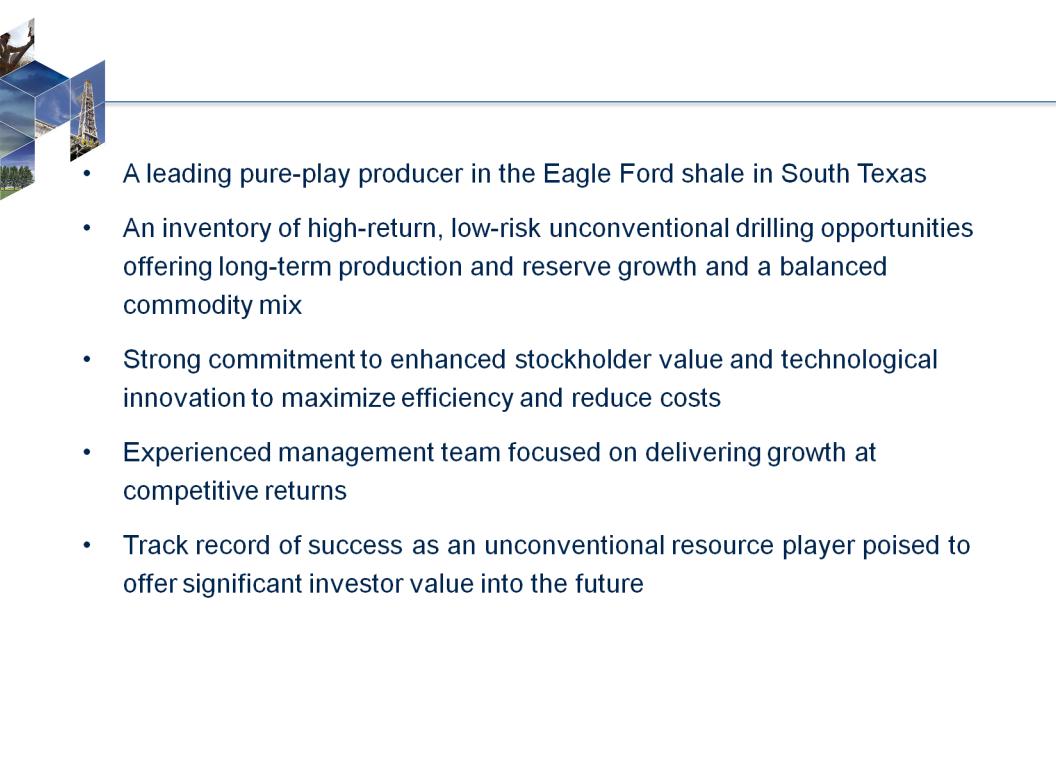
Company Profile
4

• Leverage high-graded asset base
• Strengthen position as a leading pure Eagle Ford shale player
• Develop and convert inventory of over 500 MMBoe with 15 years of drilling opportunities
• Expand production base with about 11% of inventory developed
• Successfully execute business plan
• Grow total production and liquids volumes
• Lower overall cost structure and improve margins
• Capture firm transportation and processing capacity
• Test future growth opportunities
• Evaluate previously untested Eagle Ford acreage
• Continue testing optimal Eagle Ford well spacing
• Pursue new growth targets through blend of acquisitions and new ventures
• Financial strength and flexibility
• Low leverage
• Sizable liquidity
• Active hedging program
Company Strategy
5

6

% Liquids: 14 19 24 29 33 46 51 49 52 59 60 64 62
% Oil: 5 7 10 12 15 18 19 22 22 24 30
8
Nov 7, 2012
Guidance
39 - 44

9
Includes capitalized interest and other corporate costs
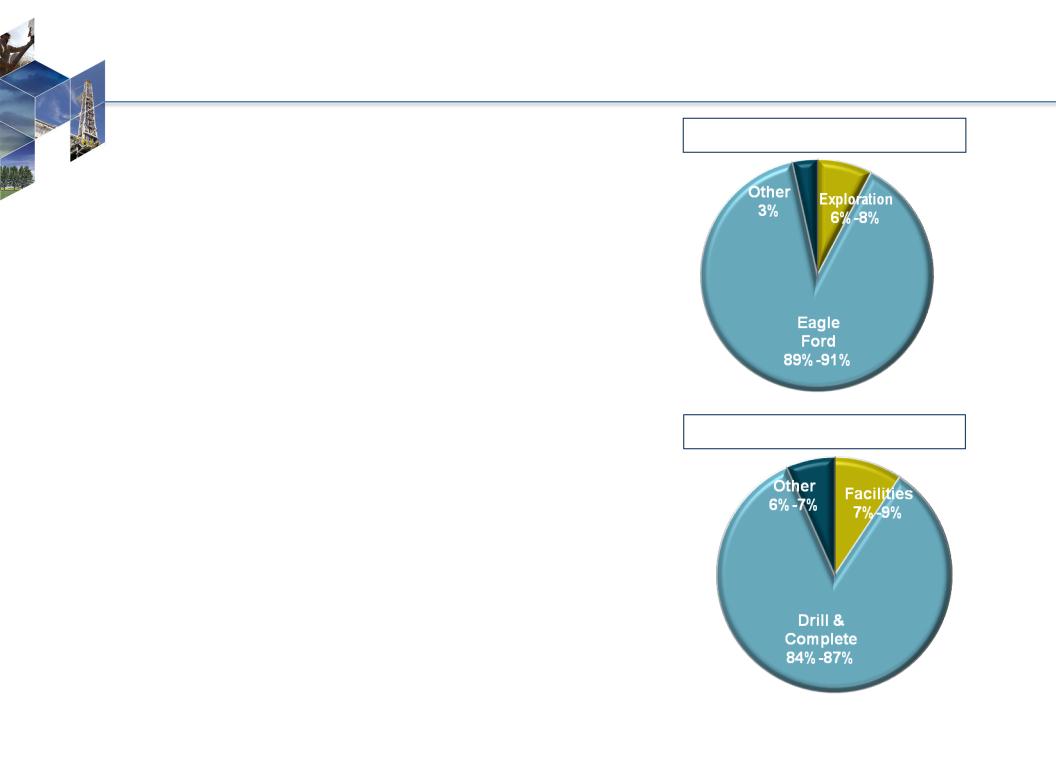
By Region
By Region
By Category
By Category
2012E Capital: $660-$680 Million
10
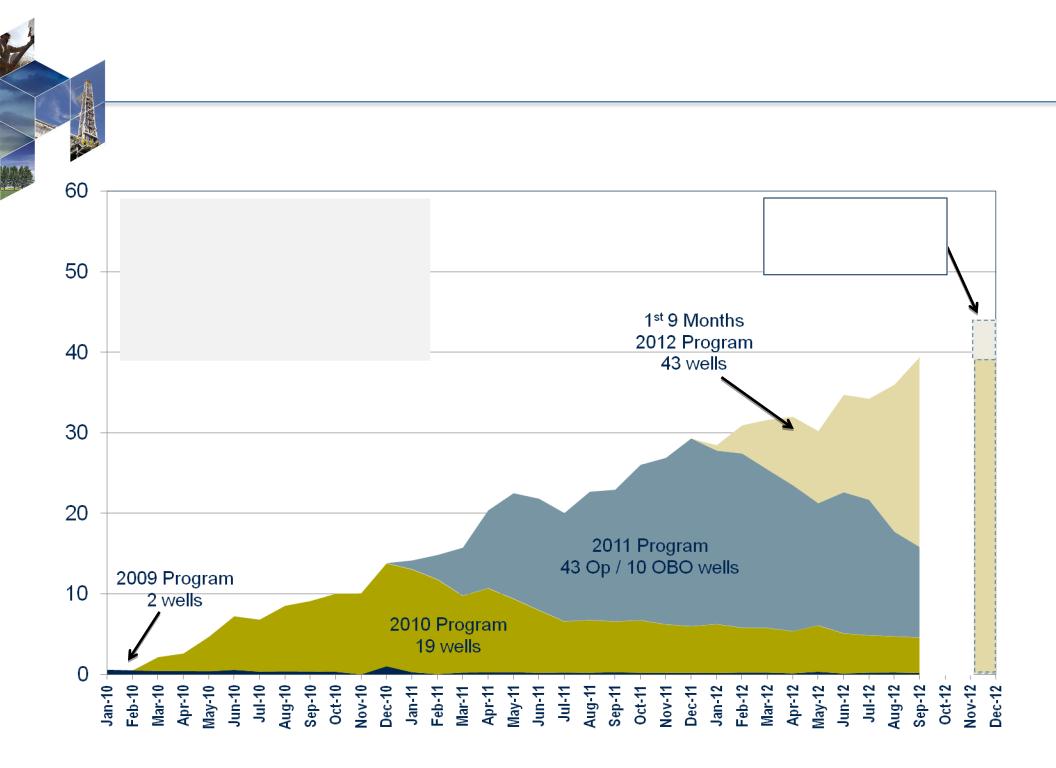
• Run four- to five-rig program in Eagle Ford area
• Approximately 60 completions for year
• 43 Eagle Ford completions thru September
• Estimate 15 to 20 Eagle Ford completions in 4Q
• Liquids-rich development
• Additional focus on Karnes Trough area and Briscoe
Ranch
Ranch
• Capital range dependent on timing of--
• Drilling two exploratory wells outside Eagle Ford
• Several land acquisitions
• Facilities construction for 2013 Eagle Ford expansion
• WI share of drilling 12 outside-operated Eagle Ford
wells in 4Q (Rosetta WI share approximately 7%)
wells in 4Q (Rosetta WI share approximately 7%)
• Fund base capital program from internally-
generated cash flow supplemented by borrowings
under current credit facility and divestitures
generated cash flow supplemented by borrowings
under current credit facility and divestitures
Eagle Ford Growth Profile
11
Eagle Ford production averaged
36.5 MBoe/d during 3Q 2012
36.5 MBoe/d during 3Q 2012
• 60.3% total liquids
• 29.8% oil / 30.5% NGLs
MBoe/d
Exit Rate Guidance
(As of 11/7/2012)
39 - 44 MBoe/d

Top 20 Eagle Ford Operators
% of Eagle Ford Shale Production
Gross Boe/d per Well
12
Top 20 Eagle Ford Operators include APC, BHP, CHK, COP, CRK, CRZO, EP, EOG, GeoSouthern, Lewis, MRO, MUR, PVA, PXD, PXP, ROSE, SFY, SM, TLM, XOM.
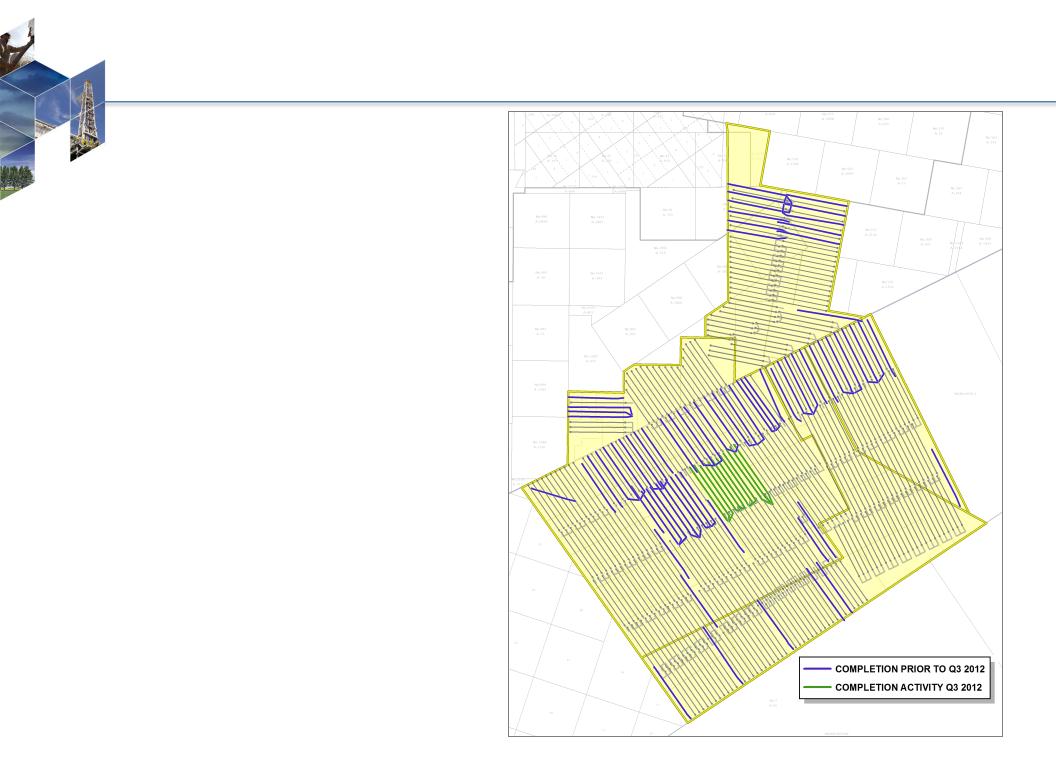
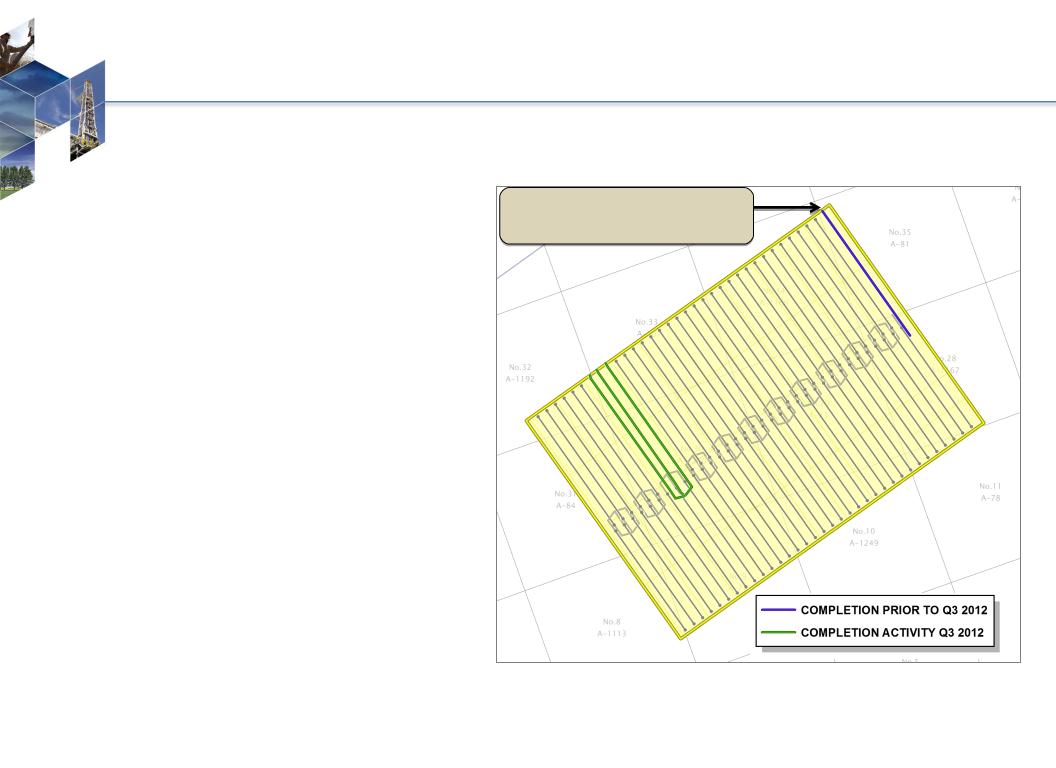
Gates Ranch
13
Summary
• 26,500 net acres in Webb County
• 84 completions as of 9/30/2012
• 1Q & 2Q 2012: 16 completions
• 3Q 2012: 12 completions
• 344 well locations remaining under current
55-acre spacing assumptions
55-acre spacing assumptions
Average Well Characteristics
• Well Costs: $7.5 - $8.0 million
• Spacing: 475 feet apart or 55 acres
• Composite EUR: 1.67 MMBoe
• F&D Costs: $4.65/Boe
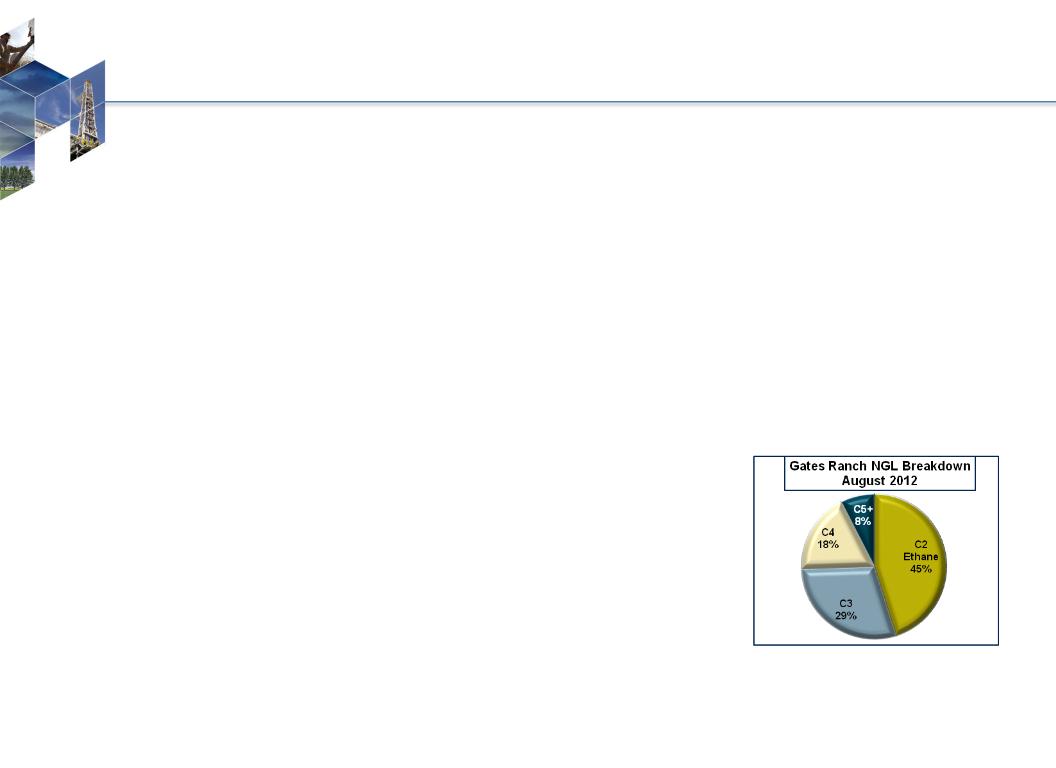
• Condensate Yield = 64 Bbls/MMcf
• NGL Yield = 100 Bbls/MMcf
• Shrinkage = 20%
• Mix: Oil 23%, NGLs 32%
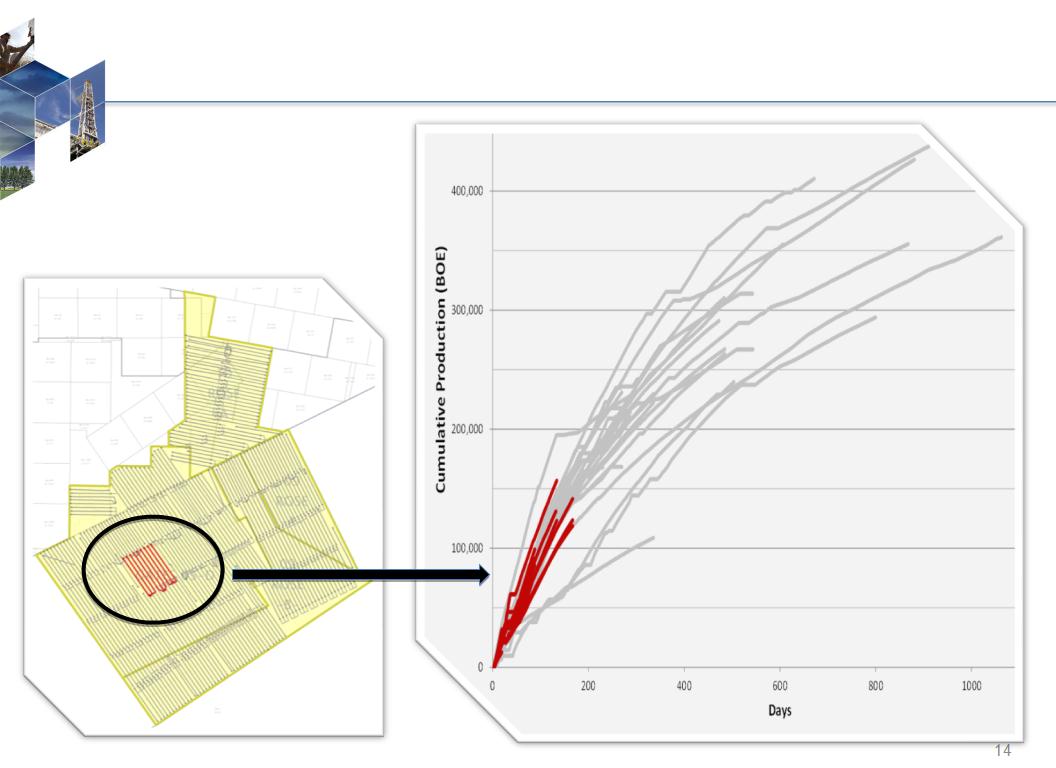
Well Performance on 55 acres
Wells spaced at 55 acres compared to similar offsetting wells spaced at 100 acres
Wells spaced at 55 acres compared to similar offsetting wells spaced at 100 acres
These 9 wells are our largest
continuous group of producing wells
that are spaced on 55 acres
continuous group of producing wells
that are spaced on 55 acres
These 9 wells are performing in line
with comparable offsetting wells
that were drilled and completed
early in the development of the area
and spaced on 100 acres …
with comparable offsetting wells
that were drilled and completed
early in the development of the area
and spaced on 100 acres …

Composite Type Curve - 1.7 MMBoe
(23% Oil / 32% NGLs)
South Type Curve - 1.9 MMBoe
North Type Curve - 1.4 MMBoe
Gates Ranch Well Performance - North and South Areas
15
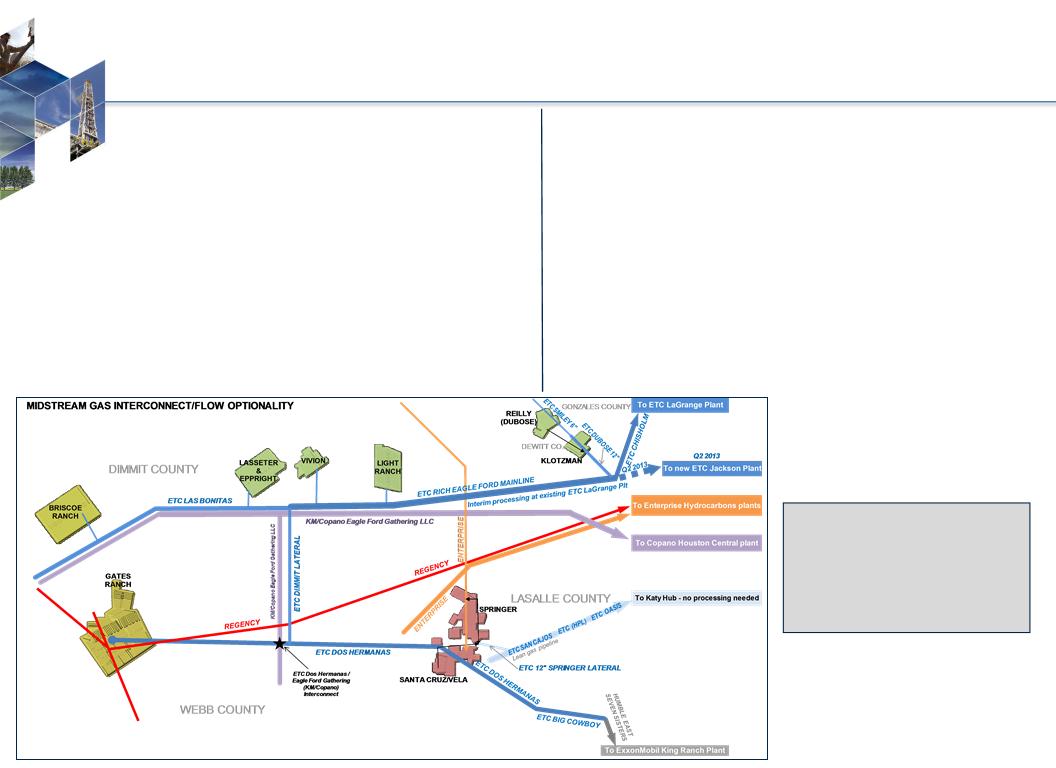
Eagle Ford Multiple Takeaway Options
16
Gas Transportation Capacity
Firm gross wellhead gas takeaway
• 195 MMcf/d today
• 245 MMcf/d in April 2013
Four processing options - Gathering (Plant)
• Regency (Enterprise Plants)
• Energy Transfer “ETC” Dos Hermanas (King Ranch)
• Eagle Ford Gathering (Copano Houston Central)
• ETC Rich Eagle Ford Mainline (LaGrange/Jackson)
Net 3-stream takeaway increases with higher
contribution of oil-weighted volumes
contribution of oil-weighted volumes
Oil Transportation Capacity
Gates Ranch, Briscoe Ranch and Central Dimmit Co.
• Plains Crude Gathering - Firm gathering capacity of
25,000 Bbls/d to Gardendale hub with up to 60,000 Bbls
storage; started operation in April 2012
25,000 Bbls/d to Gardendale hub with up to 60,000 Bbls
storage; started operation in April 2012
• Access to truck and rail loading and pipeline
connections
connections
Karnes Trough
• Rosetta-owned oil truck-loading facility began operation
in late July 2012
in late July 2012
• Trucking readily available
Pricing assumptions included in Appendix
Well-positioned to move
new production to
market with access to
multiple midstream
service providers
new production to
market with access to
multiple midstream
service providers

17
|
Area
|
Window
|
Net
Acreage |
|
Gates Ranch
|
Liquids
|
26,500
|
|
Non-Gates Ranch
|
Liquids
|
23,500
|
|
Encinal Area
|
Dry Gas
|
15,000
|
|
TOTAL
|
|
65,000
|
18
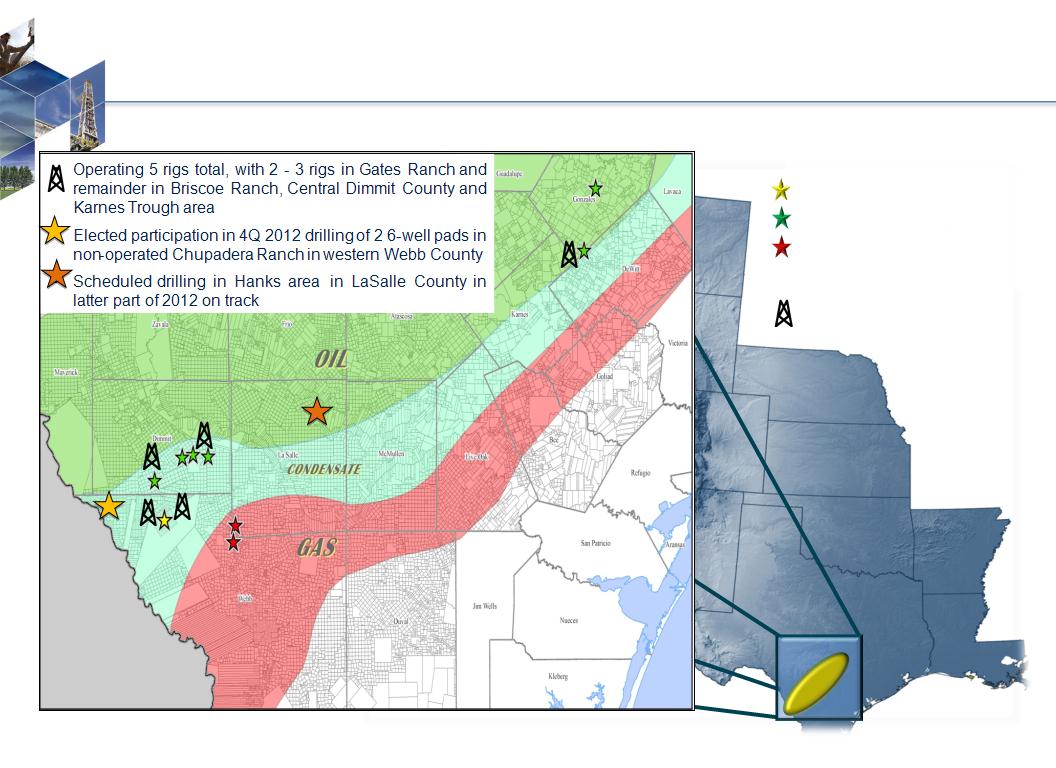
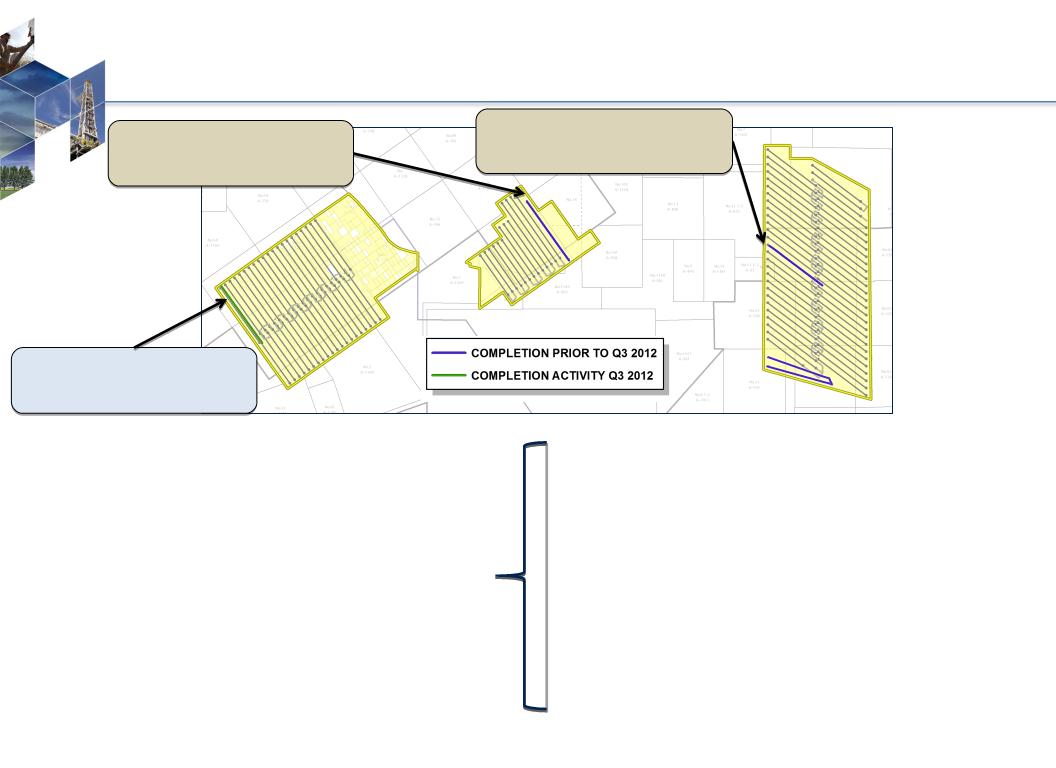
Eagle Ford Shale Activity
Current Drilling Activity Area
19
Briscoe Ranch
Summary
• 3,545 net acres in southern Dimmit
County
County
• 4 completions as of 9/30/2012
• 3Q 2012: 3 completions
• 64 well locations remaining
Average Well Characteristics
• Well Costs: $7.5 - $8.0 million
• Spacing: 425 feet apart or 50 acres
• Condensate Yield: 76 Bbls/MMcf
• NGL Yield: 121 Bbls/MMcf
• Shrinkage: 23%
Future Activity
• Planned full development activity will last
well into 2016
well into 2016
*Seven-day stabilized rate
Discovery Well Initial Rate* - 10/2011
1,990 Boe/d, 68% Liquids
(850 Bo/d, 490 B/d NGLs, 3,900 Mcf/d)
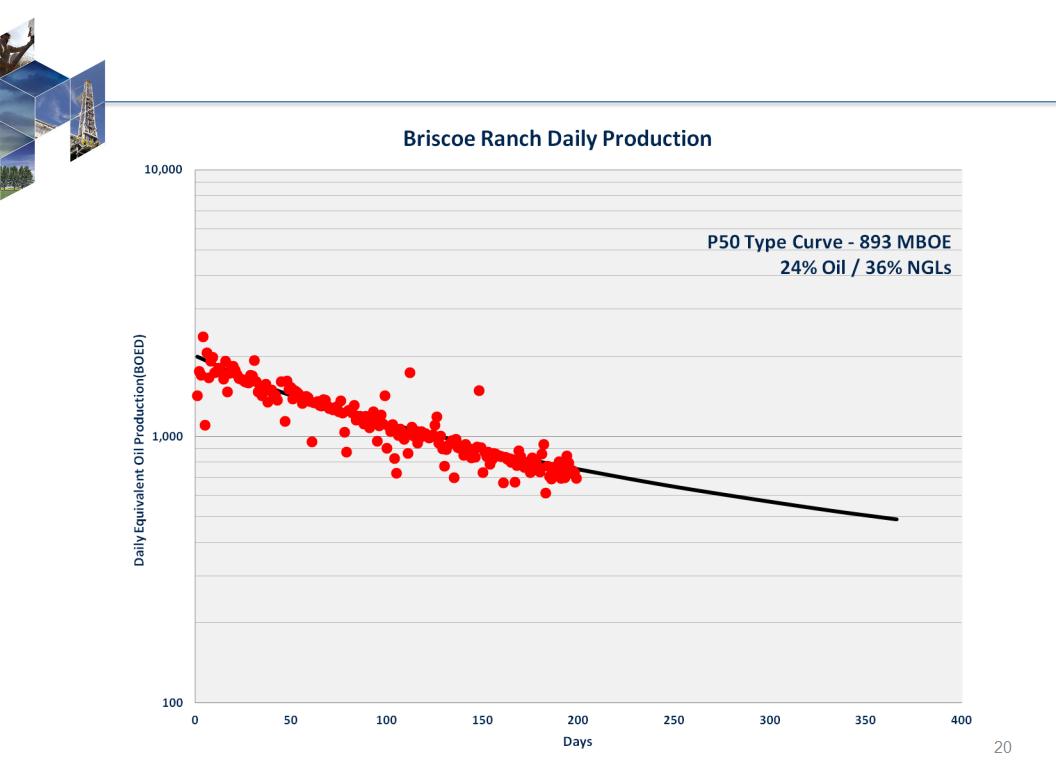
Briscoe Ranch Type Curve
21
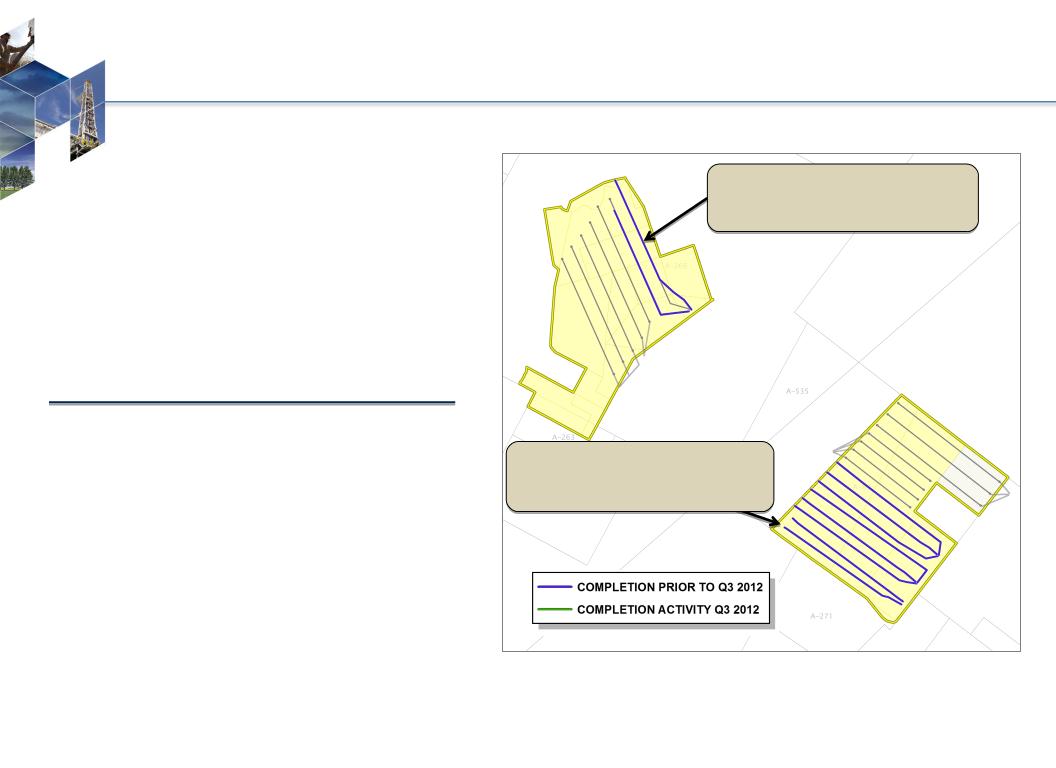
Karnes Trough Area
SUMMARY
• 1,900 net acres; located in oil window
• 10 total completions as of 9/30/2012
• 1Q 2012: 2 completions
• 2Q 2012: 7 completions
• 12 well locations remaining
• Well Costs: $8.5 - $9.0 million
• Activity planned through 2013
Klotzman (Dewitt County)
• 8 total completions as of 9/30/2012
• 1Q 2012: 1 completions
• 2Q 2012: 6 completions
• Rosetta-owned oil truck terminal started
operation in late July
operation in late July
Reilly (Gonzales County)
• 2 completions as of 9/30/2012
• 1Q 2012: 1 completion
• 2Q 2012: 1 completion
*Seven-day stabilized rate
Klotzman 1H
Discovery Well Initial Rate* - 11/2011
3,033 Boe/d, 81% Oil
(2,450 Bo/d, 250 B/d NGLs, 2,000 Mcf/d)
Adele Dubose 1H
Delineation Well Initial Rate* - 2/2012
1,463 Boe/d, 76% Oil
(1,109 Bo/d, 153 B/d NGLs, 1,200 Mcf/d)
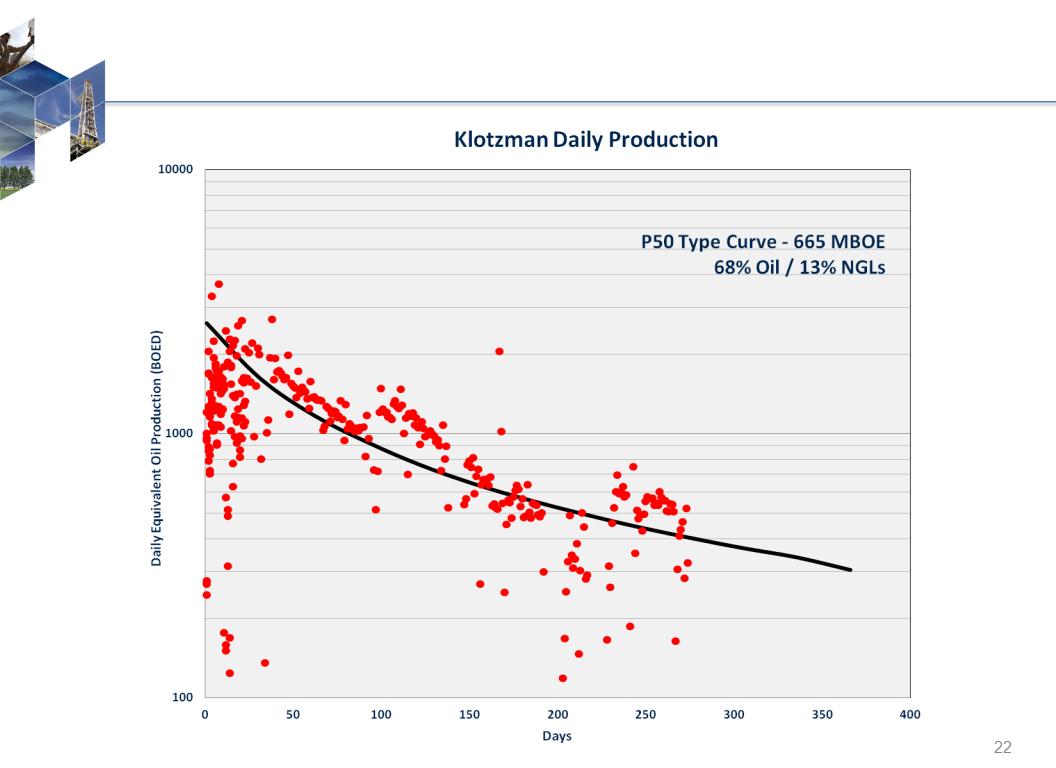
Klotzman Type Curve
23
Central Dimmit County Area
Summary
• 8,100 net acres in Dimmit County
• 5 completions as of 9/30/2012
• 2Q 2012: 2 completions
• 3Q 2012: 1 completion
• 122 well locations remaining
• Well Costs: $7.5 - $8.0 million
Light Ranch
• 3 total completions as of 9/30/2012
• 2Q 2012: 2 completions
Vivion
• 1 completion as of 9/30/2012
Lasseter & Eppright
• 1 completion as of 9/30/2012
• 3Q 2012: 1 completion (discovery)
*Seven-day stabilized rate
Light Ranch 1H
Discovery Well Initial Rate* - 10/2010
987 Boe/d, 78% Liquids
(510 Bo/d, 260 B/d NGLs, 1,300 Mcf/d)
Vivion 1H
Discovery Well Initial Rate* - 9/2011
680 Boe/d, 89% Liquids
(506 Bo/d, 102 B/d NGLs, 436 Mcf/d)
Lasseter & Eppright 1
Discovery Well Initial Rate* - 9/2012
1,228 Boe/d, 76% Liquids
(667 Bo/d, 262 B/d NGLs, 1,792 Mcf/d)
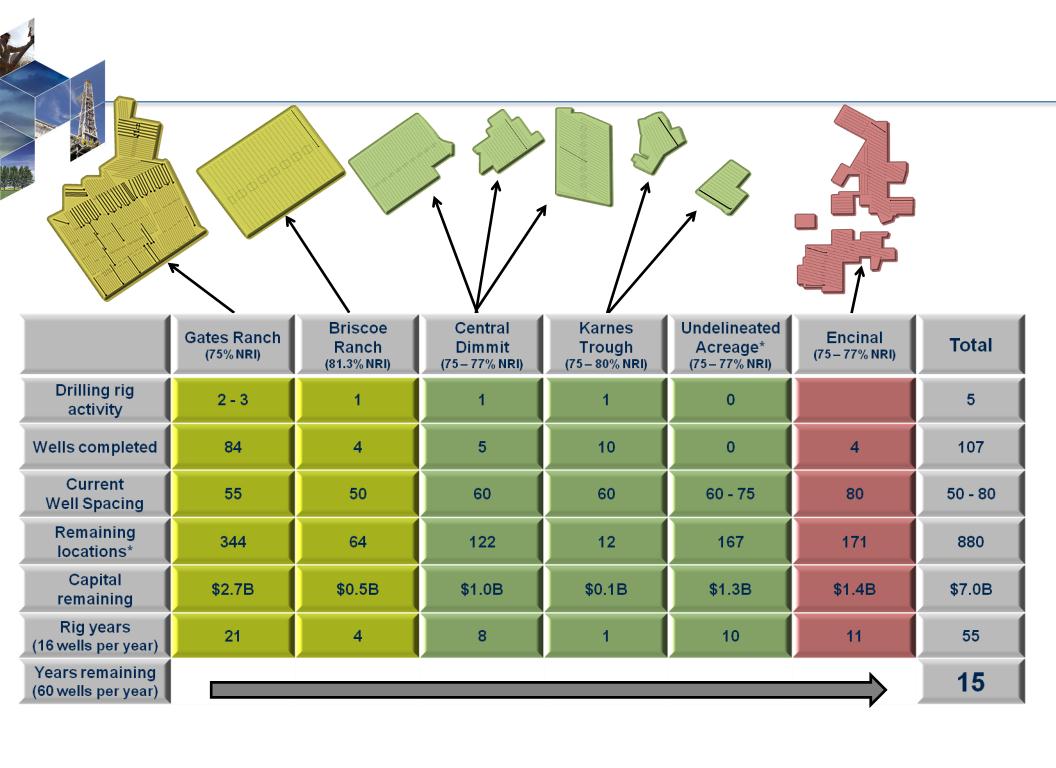
Eagle Ford Inventory
+/- 880 net wells remaining as of 9/30/2012
+/- 880 net wells remaining as of 9/30/2012
* Denotes roughly 10,000 net acres in the liquids window of the play in Webb (~3,000), LaSalle (~3,500), and Gonzales (~3,000) counties.
24
25
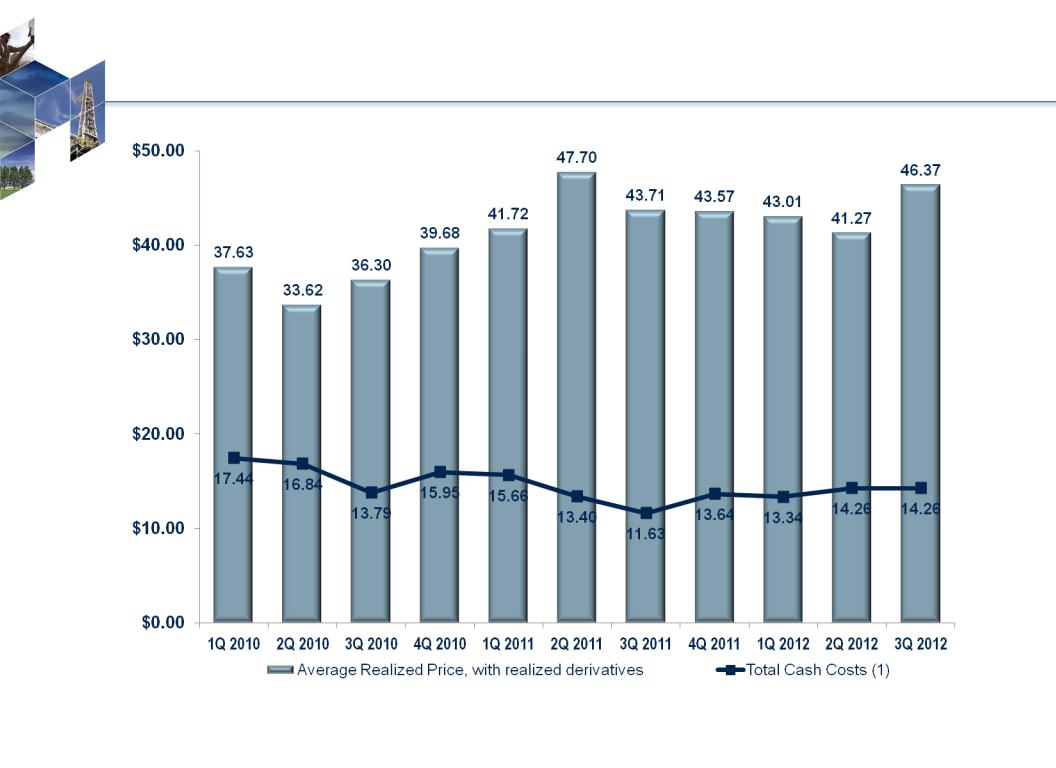
Margin Expansion
26
1. Total cash costs (a non-GAAP measure) is calculated as the sum of all average costs per Boe, excluding DD&A and stock-based compensation. Management believes this
presentation may be helpful to investors as it represents average cash costs incurred by our oil, NGL and natural gas producing activities. This measure is not intended to
replace GAAP statistics but rather to provide additional information that may be helpful in evaluating trends and performance.
presentation may be helpful to investors as it represents average cash costs incurred by our oil, NGL and natural gas producing activities. This measure is not intended to
replace GAAP statistics but rather to provide additional information that may be helpful in evaluating trends and performance.
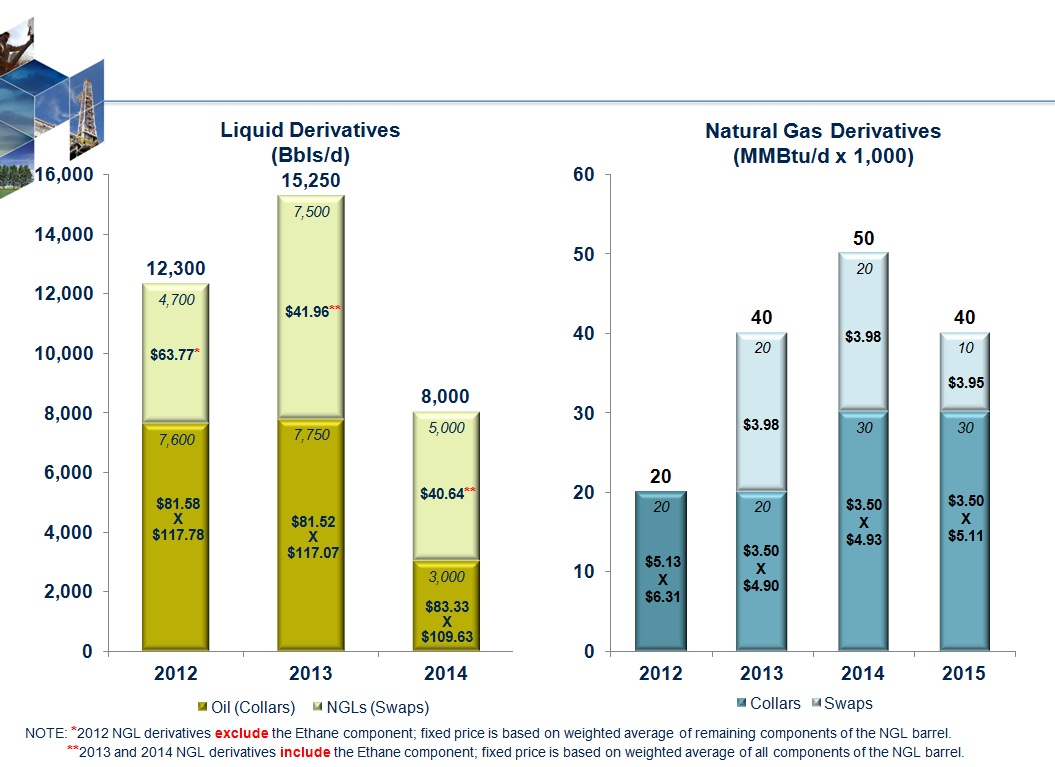
Commodity Derivatives Position - November 7, 2012
27
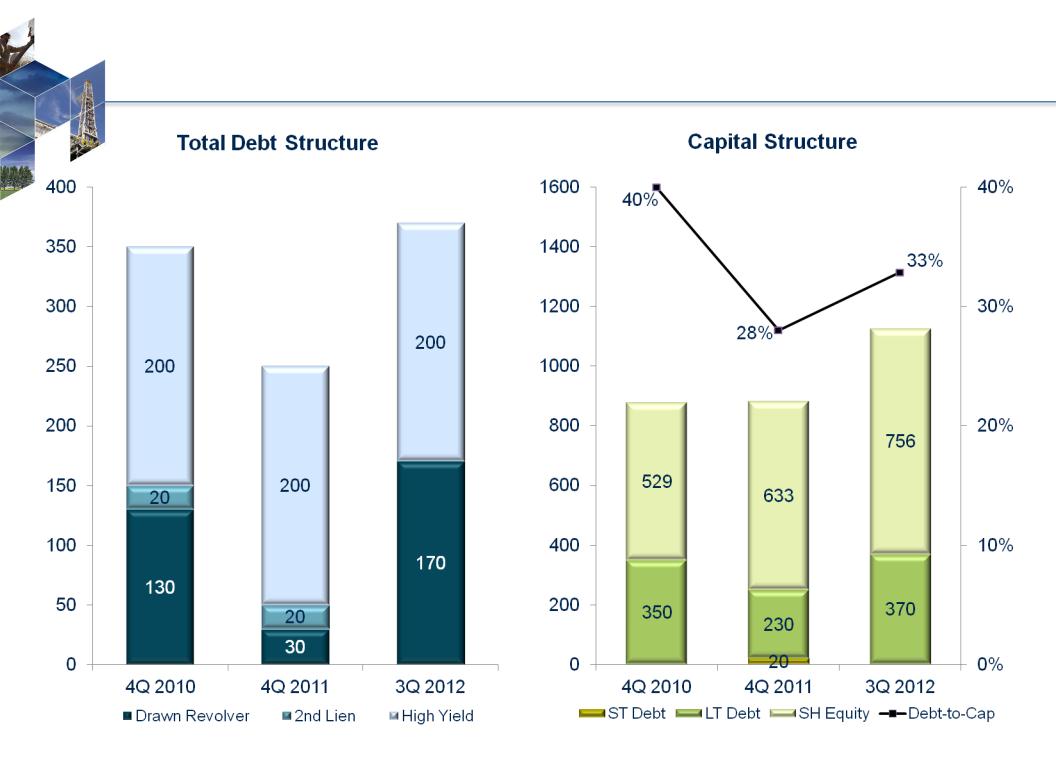
Debt and Capital Structure
350
250
883
879
28
370
1,126
Note: As of November 7, 2012, total debt is $370 million.
($MM)
($MM)
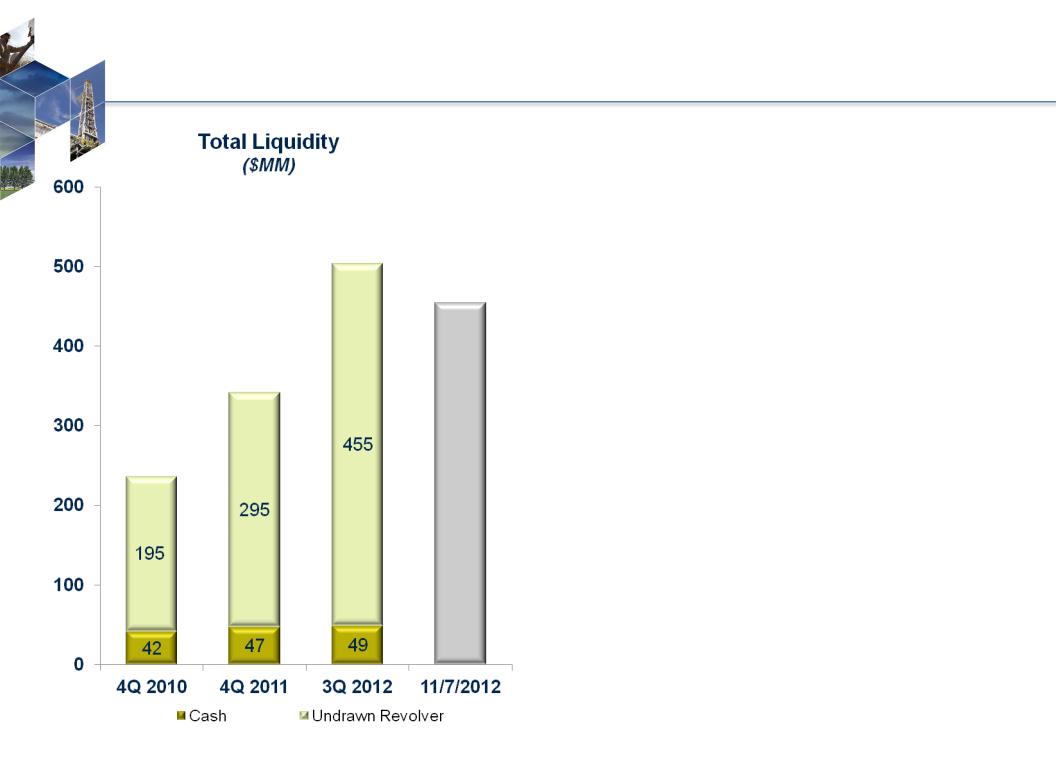
Adequate liquidity available to fund 2012
$660 - $680 million capital program
$660 - $680 million capital program
• Borrowing base raised in April, 2012
based on performance
based on performance
• $455 million of $625 million borrowing
base available as of November 7th
base available as of November 7th
• Lobo and Olmos divestiture ($90 million,
net proceeds collected as of September
30th)
net proceeds collected as of September
30th)
Liquidity
29
342
237
504
475
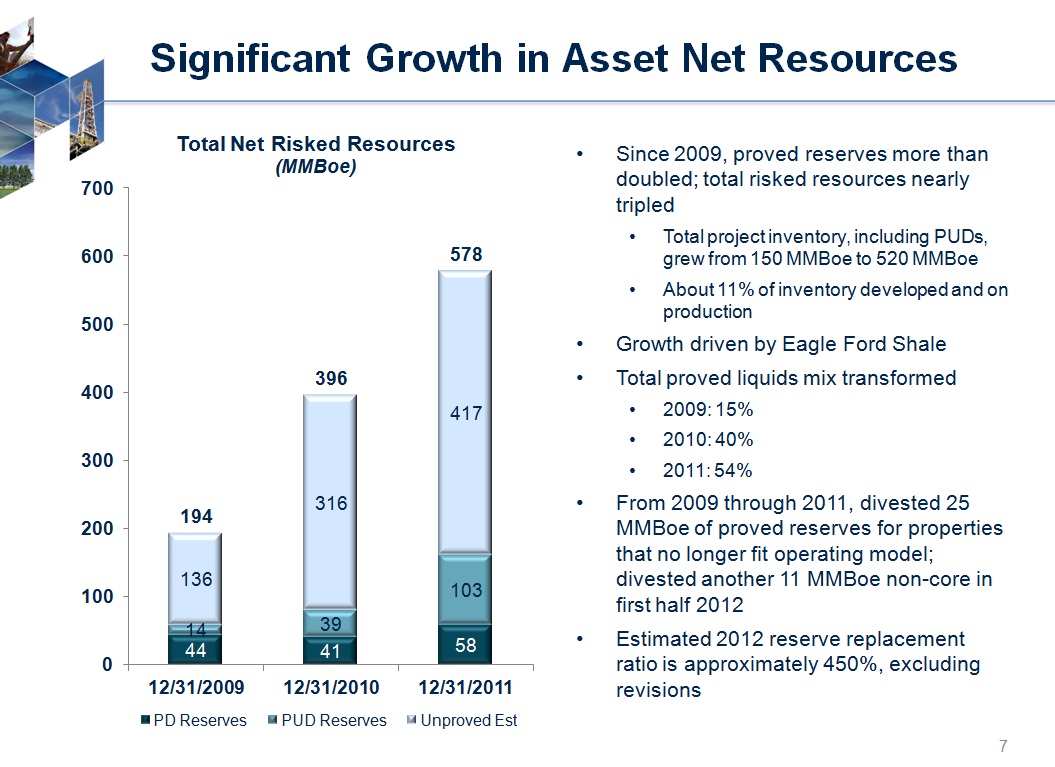
Asset Base High-Graded
• Focused on liquids-rich targets in Eagle Ford with significant project inventory
• Completed divestiture program; redeployed proceeds
Executing Business Plan
• Doubled proved reserves since 12/31/2010
• Increased Gates Ranch recoveries
• Sufficient firm take-away capacity
• Projected strong 2012 growth and exit rates
Testing Growth Opportunities
• Increased Gates Ranch well density
• Three discoveries in other Eagle Ford areas
• Pursue new growth targets through blend of acquisitions and new ventures
Financial Strength and Flexibility
• Debt-to-capitalization ratio at 33%
• Approximately $475 million in liquidity as of early November 2012
Summary
30

APPENDIX
31
|
|
|
2012 4th Quarter
|
|||
|
|
|
|
|||
|
$/BOE
|
|
|
|
|
|
|
Direct Lease Operating Expense
|
|
$ 2.40
|
-
|
$ 2.50
|
|
|
Insurance
|
|
0.05
|
-
|
0.06
|
|
|
Ad Valorem Tax
|
|
0.33
|
-
|
0.35
|
|
|
Treating and Transportation
|
|
4.00
|
-
|
4.10
|
|
|
Production Taxes
|
|
1.52
|
-
|
1.60
|
|
|
DD&A
|
|
11.50
|
-
|
12.05
|
|
|
G&A, excluding Stock-Based Compensation
|
|
3.35
|
-
|
3.50
|
|
|
Interest Expense
|
|
1.55
|
-
|
1.65
|
|
32
Fourth Quarter Expense Guidance
As of November 7, 2012
As of November 7, 2012
• Volumes and Product Mix
• Exit Rate 39 - 44 MBoe/d; 62 % total liquids
• 3Q 2012: 37.1 MBoe/d with 36.5 MBoe/d from Eagle Ford (Oil 30%, NGLs 30%)
• Averaged 41 MBoe/d in October 2012
• Treating & Transportation fees impacted by mix changes
• Crude Oil Pricing
• Should approximate WTI
• NGL pricing (Mount Belvieu Benchmark)
• Firm fractionation capacity
• Adjust for fractionation fees approximately $3 to $4 per barrel
• Adjust for reported 2012 derivative activity, excluding ethane
• Pricing estimates based on % of WTI not as correlative
4th Qtr Guidance - Framing For Quarterly Models
33
|
|
1st 9
Months 2012 |
2011
|
2010
|
|
Daily rate (MBoe/d)
|
34.8
|
27.6
|
22.9
|
|
Oil% / NGLs%
|
25% / 32%
|
18% / 26%
|
9% / 13%
|
|
|
$/Boe
|
$/Boe
|
$/Boe
|
|
Average realized price (without realized derivatives)
|
$41.89
|
$42.45
|
$32.98
|
|
Average realized price (with realized derivatives)
|
$43.66
|
$44.18
|
$36.85
|
|
Direct lease operating expense
|
$2.39
|
$2.72
|
$4.52
|
|
Workovers / Insurance / Ad valorem tax
|
0.70
|
0.75
|
1.58
|
|
Lease operating expense
|
$3.09
|
$3.47
|
$6.10
|
|
Treating and transportation
|
3.92
|
2.22
|
0.83
|
|
Production taxes
|
1.21
|
1.20
|
0.71
|
|
General and administrative costs¹
|
3.82
|
4.59
|
5.04
|
|
Interest expense
|
1.92
|
2.11
|
3.23
|
|
Total cash costs2
|
$13.96
|
$13.59
|
$15.91
|
|
Cash Margin2 (without realized derivatives)
|
$27.93
|
$28.86
|
$17.07
|
|
Cash Margin2 (with realized derivatives)
|
$29.70
|
$30.59
|
$20.94
|
Margin Improvement
34
1. Excludes stock-based compensation expense
2. Total cash costs (a non-GAAP measure) is calculated as the sum of all average costs per Boe, excluding DD&A and stock-based compensation. Cash Margin (a non-GAAP measure) is
calculated as the difference between average realized equivalent price and total cash costs. Management believes this presentation may be helpful to investors as it represents average
cash costs incurred by our oil, NGL and natural gas producing activities as compared to average realized price based on revenue generated. These measures are not intended to replace
GAAP statistics but rather to provide additional information that may be helpful in evaluating trends and performance.

REDEFINED
BUILDING VALUE IN UNCONVENTIONAL RESOURCES