Attached files
| file | filename |
|---|---|
| 8-K - ROCK-TENN COMPANY 8-K - Rock-Tenn CO | a50490454.htm |
Exhibit 99.1
RockTenn 2012 Citi Basic Materials Symposium November 28, 2012
Cautionary Statement Regarding Forward-Looking Information Statements in this presentation that do not relate strictly to historical facts are forward-looking statements within the meaning of the Private Securities Litigation Reform Act of 1995, including the slide entitled “Key Financial Statistics– FY13 Outlook” that gives guidance for future periods in 2013. Forward-looking statements are based on our current expectations, beliefs, plans or forecasts and use words in this presentation such as will, estimate, trending, or refer to future time periods. You should not place undue reliance on any forward-looking statements as such statements involve risks, uncertainties, assumptions and other factors that could cause actual results to differ materially, including the following: our belief that the Corrugated industry fundamentals are improving, our ability to integrate Smurfit-Stone or to achieve benefits from the Smurfit-Stone Acquisition, including, without limitation, synergies, performance improvements and successful implementation of capital projects; estimated FY13 cash flow generation; expected levels of depreciation and amortization, corporate expenses, interest expense, income tax rates, federal NOLs, Black Liquor and AMT tax credits, pension expense and contributions, capital expenditures, commodity costs, maintenance outages, containerboard inventory builds; the level of demand for our products; economic downtime; our ability to successfully identify and make performance improvements; anticipated returns on our capital investments; possible increases in energy, raw materials, shipping and capital equipment costs; any reduction in the supply of raw materials; fluctuations in selling prices and volumes; intense competition; the potential loss of certain customers; adverse changes in general market and industry conditions and other risks, uncertainties and factors discussed in Item 1A "Risk Factors" and under the caption "Business — Forward-Looking Information" in our 2012 Annual Report on Form 10-for the fiscal year ended September 30, and by similar disclosures in any of our subsequent SEC filings. The information contained herein speaks as of the date hereof and we do not have or undertake any obligation to update such information as future events unfold. Page 2
Disclaimer and Use of Non-GAAP Financial Measures and Reconciliations We may from time to time be in possession of certain information regarding RockTenn that applicable law would not require us to disclose to the public in the ordinary course of business, but would require us to disclose if we were engaged in the purchase or sale of our securities. This presentation shall not be considered to be part of any solicitation of an offer to buy or sell RockTenn securities. This presentation also may not include all of the information regarding RockTenn that you may need to make an investment decision regarding RockTenn securities. Any such investment decision should be made on the basis of the overall mix of information regarding RockTenn that is publicly available as of the date of such decision. We have included financial measures that are not prepared in accordance with accounting principles generally accepted in the United States ("GAAP"). The non-GAAP financial measures presented are not intended to be a substitute for GAAP financial measures, and any analysis of non-GAAP financial measures should be used only in conjunction with results presented in accordance with GAAP and the reconciliations of non-GAAP financial measures to GAAP financial measures included in the Appendix to this presentation. Page 3
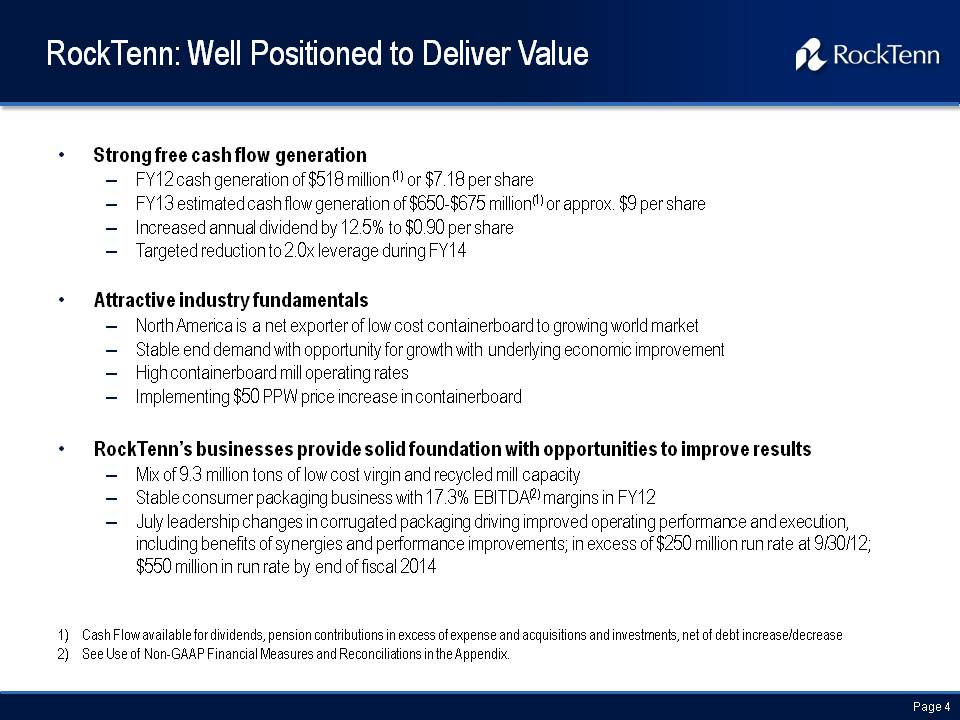
RockTenn: Well Positioned to Deliver Value Strong free cash flow generation FY12 cash generation of $518 million (1) or $7.18 per share FY13 estimated cash flow generation of $650-$675 million(1) or approx. $9 per share Increased annual dividend by 12.5% to $0.90 per share Targeted reduction to 2.0x leverage during FY14 Attractive industry fundamentals North America is a net exporter of low cost containerboard to growing world market Stable end demand with opportunity for growth with underlying economic improvement High containerboard mill operating rates Implementing $50 PPW price increase in containerboard RockTenn’s businesses provide solid foundation with opportunities to improve results Mix of 9.3 million tons of low cost virgin and recycled mill capacity Stable consumer packaging business with 17.3% EBITDA(2) margins in FY12 July leadership changes in corrugated packaging driving improved operating performance and execution, including benefits of synergies and performance improvements; in excess of $250 million run rate at 9/30/12; $550 million in run rate by end of fiscal 2014 1) Cash Flow available for dividends, pension contributions in excess of expense and acquisitions and investments, net of debt increase/decrease 2) See Use of Non-GAAP Financial Measures and Reconciliations in the Appendix. Page 4
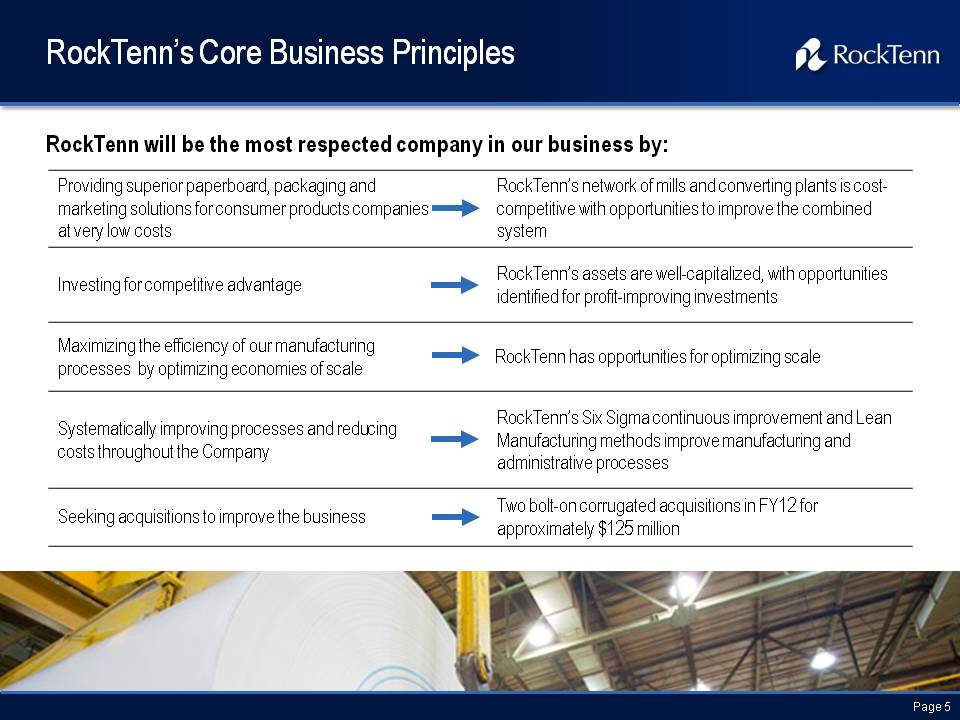
RockTenn’s Core Business Principles RockTenn will be the most respected company in our business by: Providing superior paperboard, packaging and marketing solutions for consumer products companies at very low costs RockTenn’s network of mills and converting plants is cost-competitive with opportunities to improve the combined system Investing for competitive advantage RockTenn’s assets are well-capitalized, with opportunities identified for profit-improving investments Maximizing the efficiency of our manufacturing processes by optimizing economies of scale RockTenn has opportunities for optimizing scale Systematically improving processes and reducing costs throughout the Company RockTenn’s Six Sigma continuous improvement and Lean Manufacturing methods improve manufacturing and administrative processes Seeking acquisitions to improve the business Two bolt-on corrugated acquisitions in FY12 for approximately $125 million Page 5
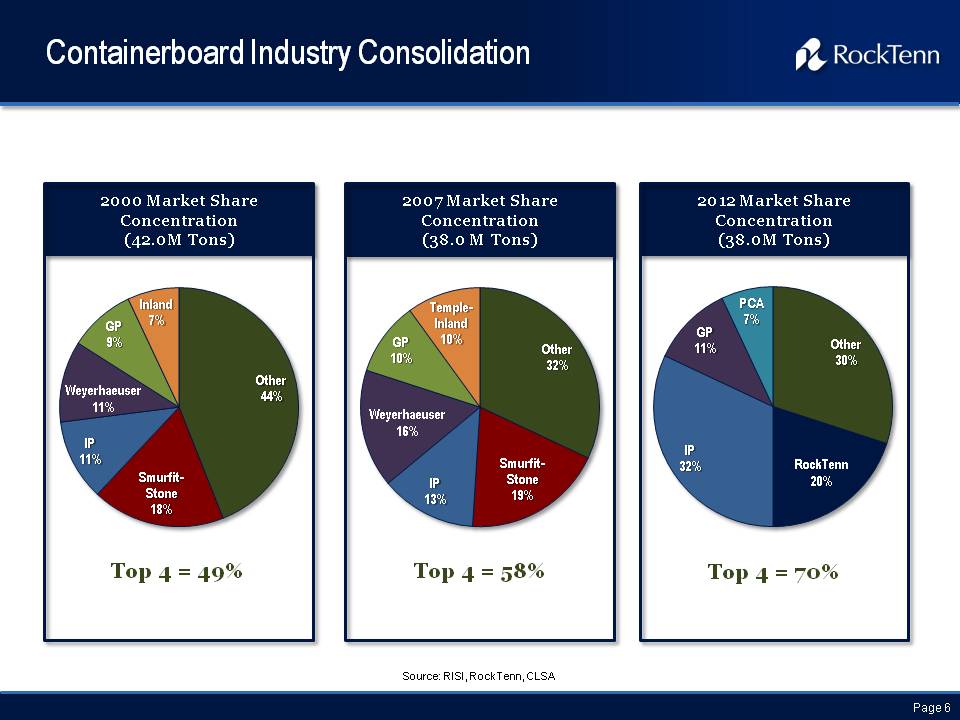
Containerboard Industry Consolidation 2000 Market Share Concentration (42.0M Tons) Other 44% Smurfit-Stone 18% Weyerhaeuser 11% IP 11% GP 9% Inland 7% 2007 Market Share Concentration (38.0M Tons) Other 32% Smurfit-Stone 19% Weyerhaeuser 16% IP 13% GP 10% Temple-Inland 10% 2012 Market Share Concentration (38.0 M Tons) IP 32% Other 30% RockTenn 20% GP 11% PCA 7% Top 4 = 49% Top 4 = 58% Top 4 = 70% Source: RISI, RockTenn, CLSA Page 6
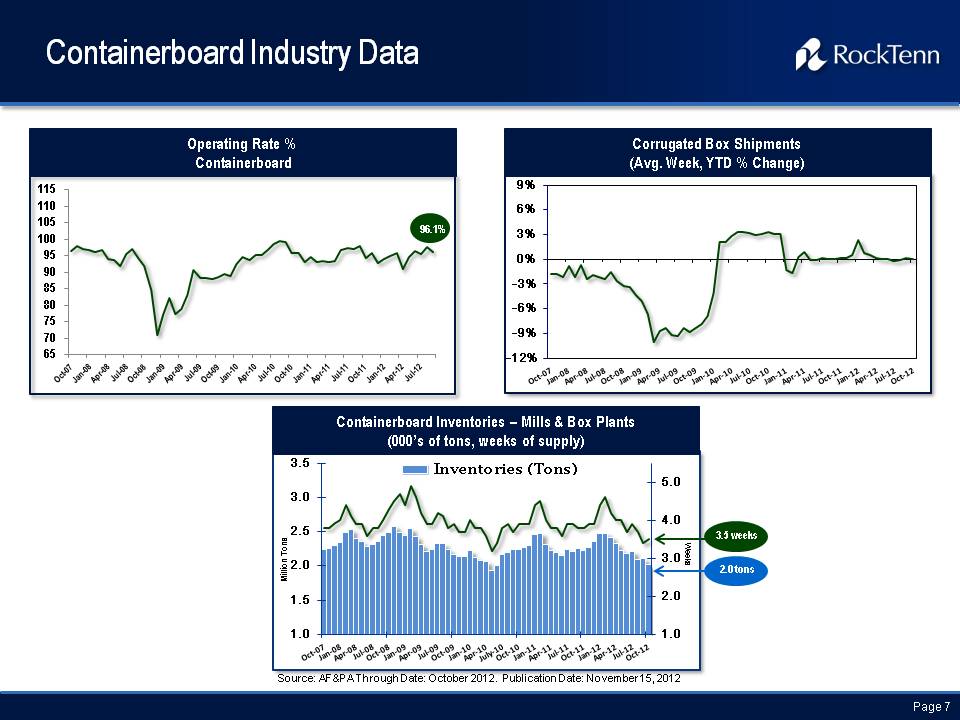
Containerboard Industry Data Operating Rate % Containerboard 96.1% Corrugated Box Shipments (Avg. Week, YTD % Change) Containerboard Inventories – Mills & Box Plants (000’s of tons, weeks of supply) Inventories (Tons) 3.5 weeks 2.0 tons Source: AF&PA Through Date: October 2012. Publication Date: November 15, 2012 Page 7
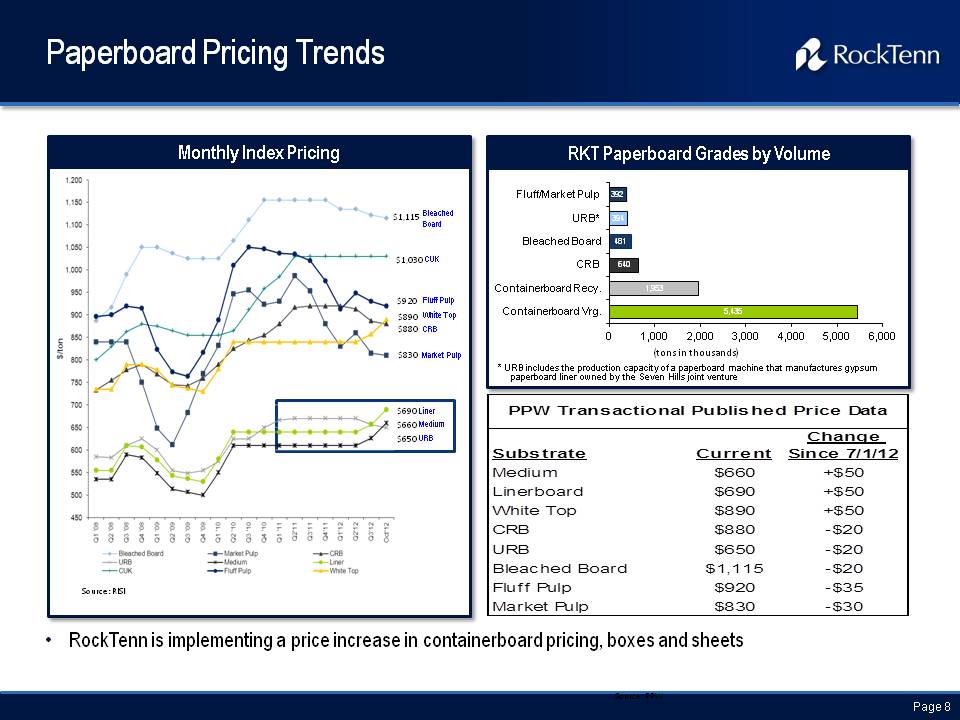
Paperboard Pricing Trends Monthly Index Pricing $1,115 Bleached Board $1,030 CUK $920 Fluff Pulp $890 White Top $880 CRB $830 Market Pulp $690 Liner $660 Medium $650 URB Source: RISI RKT Paperboard Grades by Volume Fluff/Market Pulp 392 URB* 394 Bleached Board 481 CRB 640 Containerboard Recy. 1,953 Containerboard Vrg. 5,435 (tons in thousands) * URB includes the production capacity of a paperboard machine that manufactures gypsum paperboard liner owned by the Seven Hills joint venture PPW Transactional Published Price Data Substrate Current Change Since 7/1/12 Medium $660 +$50 Linerboard $690 +$50 White Top $890 +$50 CRB $880 -$20 URB $650 -$20 Bleached Board $1,115 -$20 Fluff Pulp $920 -$35 Market Pulp $830 -$30 RockTenn is implementing a price increase in containerboard pricing, boxes and sheets Page 8
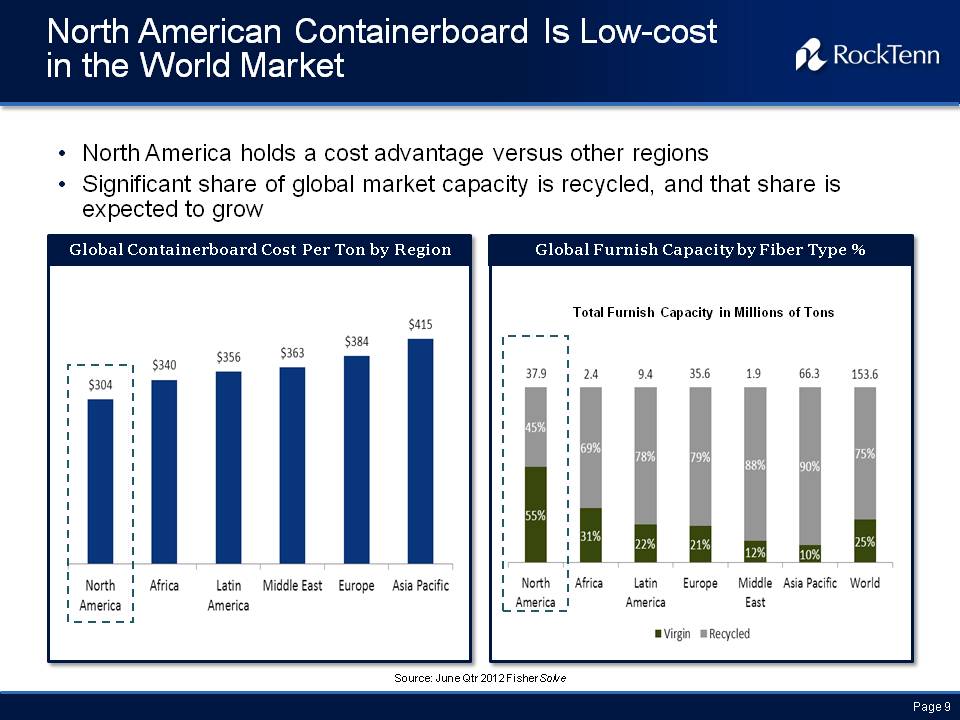
North American Containerboard Is Low-cost in the World Market North America holds a cost advantage versus other regions Significant share of global market capacity is recycled, and that share is expected to grow Global Containerboard Cost Per Ton by Region $304 North America $340 Africa $356 Latin America $363 Middle East $384 Europe $415 Asia Pacific Global Furnish Capacity by Fiber Type % Total Furnish Capacity in Millions of Tons 37.9 45% 55% North America 2.4 69% 31% Africa 9.4 78% 22% Latin America 35.6 79% 21% Europe 1.9 88% 12% Middle East 66.3 90% 10% Asia Pacific 153.6 75% 25% World Virgin Recycled Source: June Qtr 2012 FisherSolve Page 9
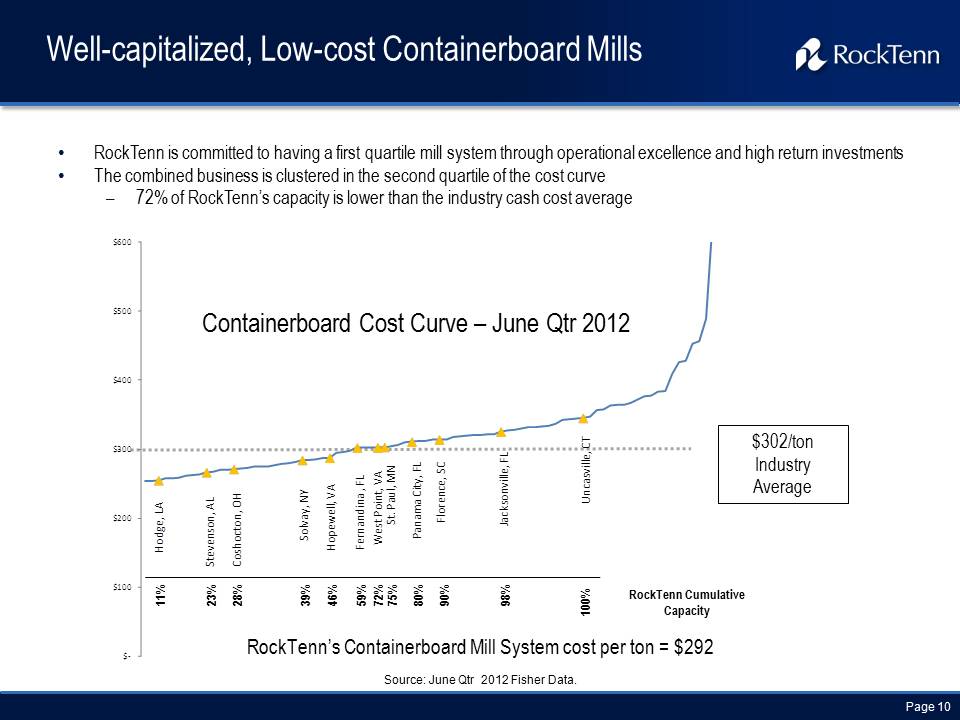
Well-capitalized, Low-cost Containerboard Mills Other Placeholder: RockTenn is committed to having a first quartile mill system through operational excellence and high return investmentsThe combined business is clustered in the second quartile of the cost curve72% of RockTenn’s capacity is lower than the industry cash cost average Source: June Qtr 2012 Fisher Data. RockTenn’s Containerboard Mill System cost per ton = $292 (Gp:) Containerboard Cost Curve – June Qtr 2012 (Gp:) $302/ton Industry Average (Gp:) RockTenn Cumulative Capacity (Gp:) 28% (Gp:) 23% (Gp:) 39% (Gp:) 100% (Gp:) 11% (Gp:) 75% (Gp:) 72% (Gp:) 59% (Gp:) 46% (Gp:) 98% (Gp:) 90% (Gp:) 80%
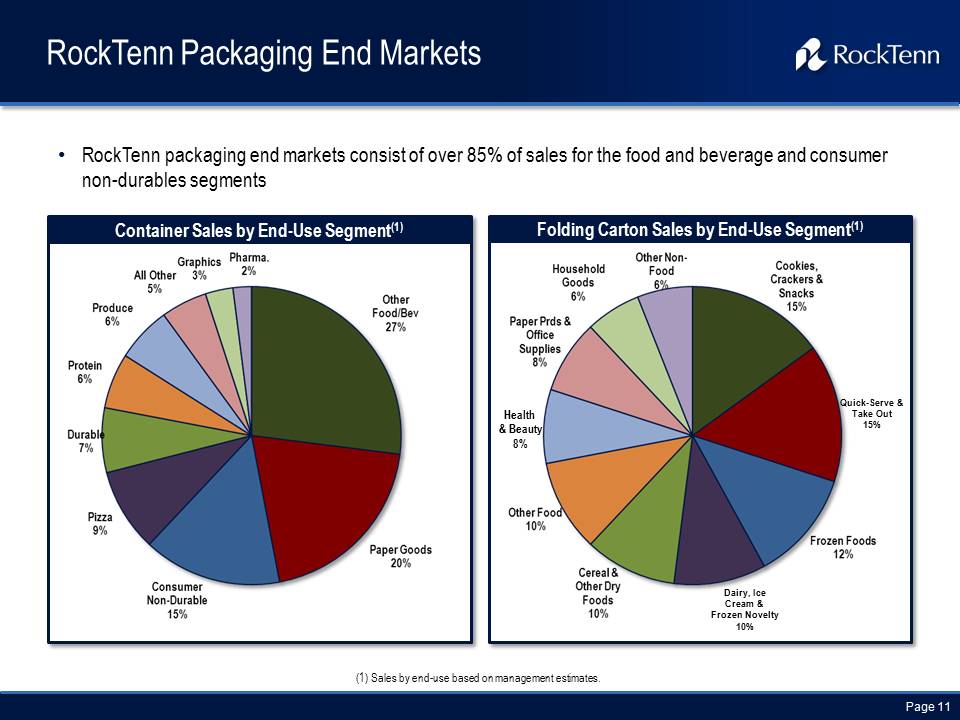
RockTenn Packaging End Markets RockTenn packaging end markets consist of over 85% of sales for the food and beverage and consumer non-durables segments Container Sales by End-Use Segment(1) Folding Carton Sales by End-Use Segment(1) (1) Sales by end-use based on management estimates. Other Placeholder: Page 11 Dairy, Ice Cream & Frozen Novelty 10% Quick-Serve & Take Out 15% Health & Beauty 8%
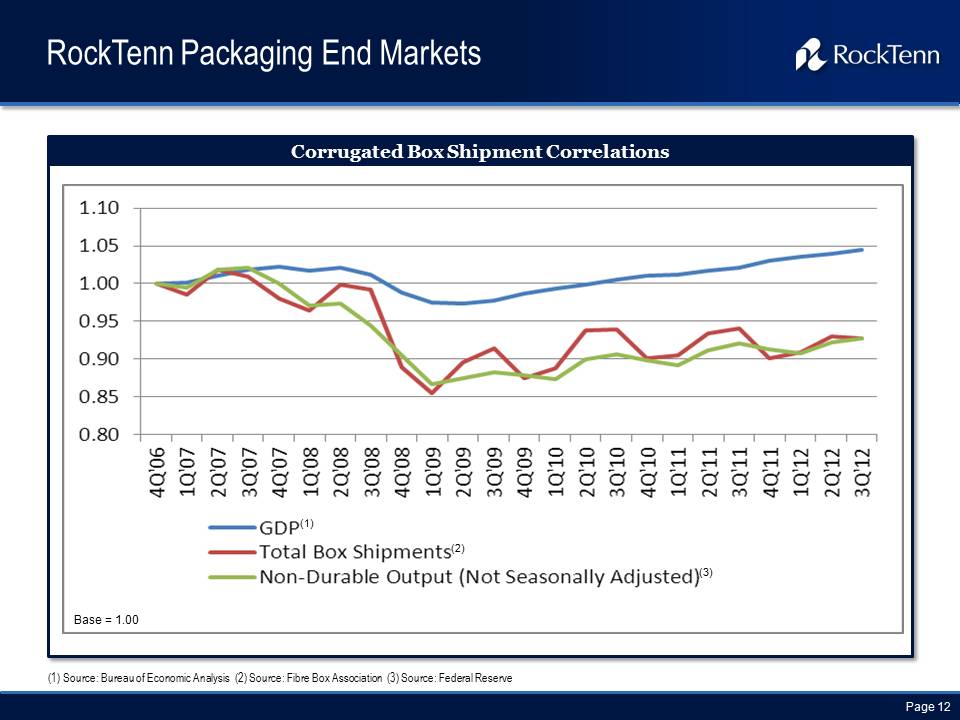
RockTenn Packaging End Markets Corrugated Box Shipment Correlations (1) (2) (3) Base = 1.00 Other Placeholder: Page 12 (1) Source: Bureau of Economic Analysis (2) Source: Fibre Box Association (3) Source: Federal Reserve
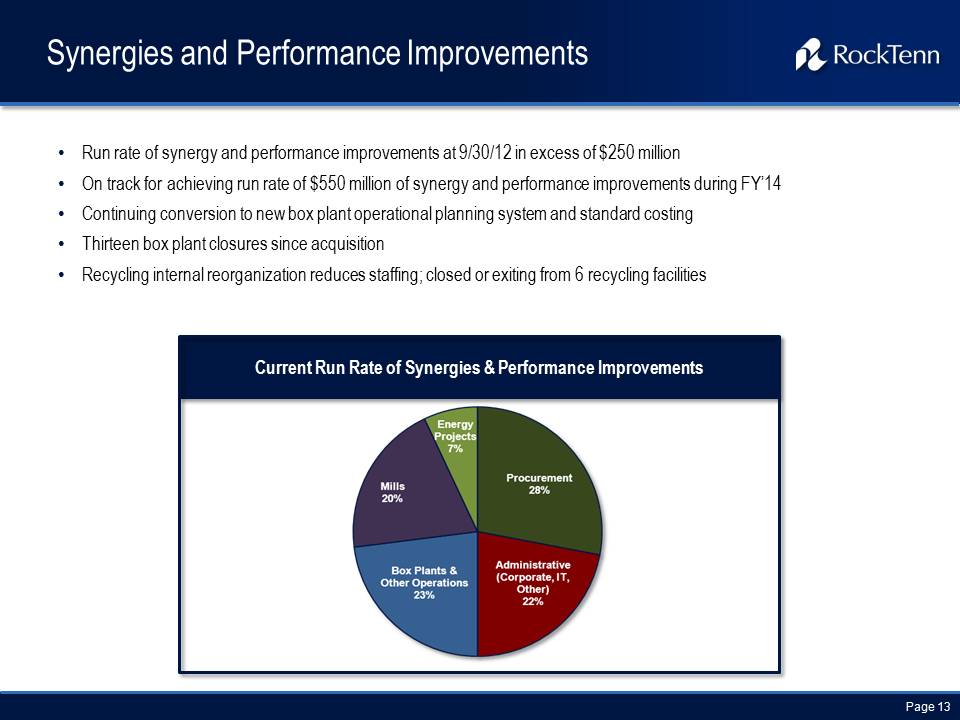
Synergies and Performance Improvements Other Placeholder: Run rate of synergy and performance improvements at 9/30/12 in excess of $250 million On track for achieving run rate of $550 million of synergy and performance improvements during FY’14 Continuing conversion to new box plant operational planning system and standard costing Thirteen box plant closures since acquisition Recycling internal reorganization reduces staffing; closed or exiting from 6 recycling facilities Other Placeholder: Page 13 Current Run Rate of Synergies & Performance Improvements
Summary Other Placeholder: Strong cash flow, with a FY13 target of approximately $9 per share(1)Stable end markets, primarily food, consumer staples and consumer non-durablesGood industry structure Strong export position due to low cost, North American virgin manufacturing capacityCorrugated packaging management changes leading to improving performanceMultiple opportunities to increase earnings and cash flowCash Flow available for dividends, pension contributions in excess of expense and acquisitions and investments, net of debt increase/decrease
Appendix
Use of Non-GAAP Financial Measures and Reconciliations Other Placeholder: Below, we define the non-GAAP financial measures, provide a reconciliation of each non-GAAP financial measure to the most directly comparable financial measure calculated in accordance with GAAP, and discuss the reasons that we believe this information is useful to management and may be useful to investors. These measures may differ from similarly captioned measures of other companies in our industry.Non-GAAP MeasuresOur definition of Segment EBITDA may differ from other similarly titled measures at other companies. Segment EBITDA (as defined) is not defined in accordance with GAAP and should not be viewed as alternatives to GAAP measures of operating results or liquidity. RockTenn management believes that Segment Income is the most directly comparable GAAP measure to Segment EBITDA.
Non-GAAP Measures: Segment EBITDA Other Placeholder: Segment EBITDA is generally defined as Segment Income plus: segment depreciation and amortization expenses; certain cash and non-cash charges relating to plant and other facility closures; other cash and non-cash restructuring charges; and, certain other charges. Management uses Segment EBITDA as a measure of our Segment’s core operating performance.
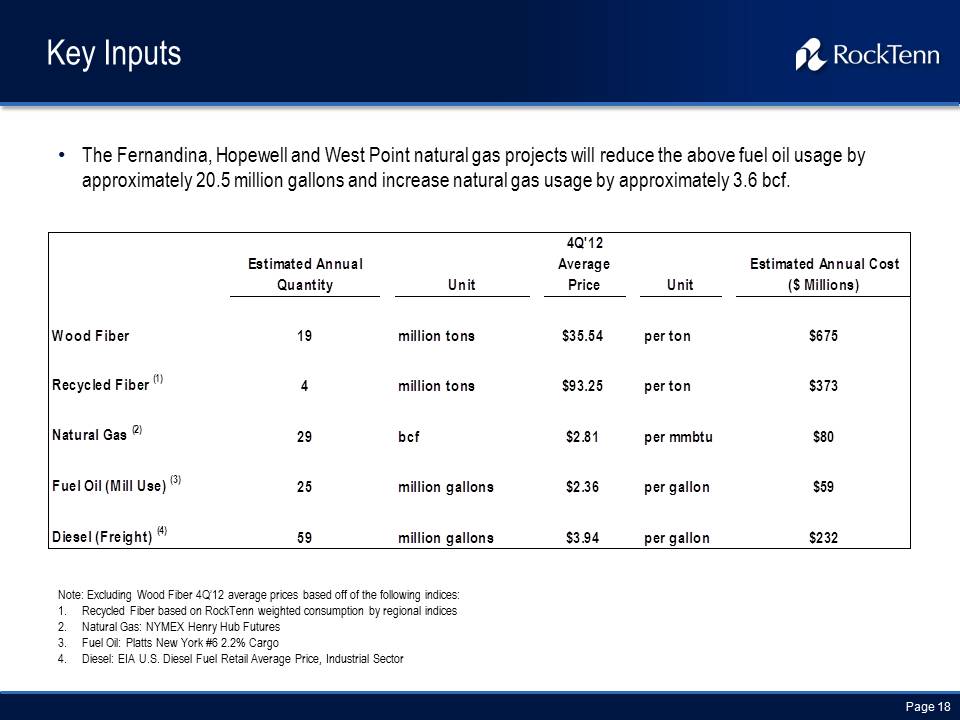
Key Inputs Other Placeholder: The Fernandina, Hopewell and West Point natural gas projects will reduce the above fuel oil usage by approximately 20.5 million gallons and increase natural gas usage by approximately 3.6 bcf. Note: Excluding Wood Fiber 4Q’12 average prices based off of the following indices:Recycled Fiber based on RockTenn weighted consumption by regional indicesNatural Gas: NYMEX Henry Hub FuturesFuel Oil: Platts New York #6 2.2% CargoDiesel: EIA U.S. Diesel Fuel Retail Average Price, Industrial Sector
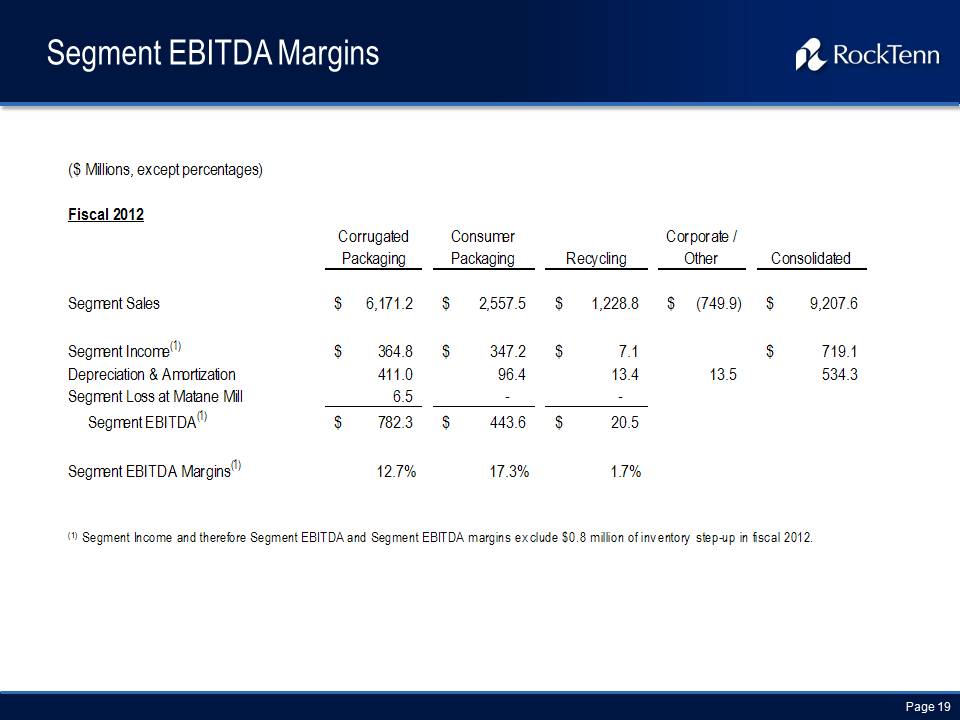
($ Millions, except percentages) Fiscal 2012 Corrugated Packaging Consumer Packaging Recycling Corporate / Other Consolidated Segment Sales $ 6,171.2 $ 2,557.5 $ 1,228.8 $ (749.9) $ 9,207.6 Segment Income(1) $ 364.8 $ 347.2 $ 7.1 $ 719.1 Depreciation & Amortization 411.0 96.4 13.4 13.5 534.3 Segment Loss at Matane Mill 6.5 - - Segment EBITDA(1) $ 782.3 $ 443.6 $ 20.5 Segment EBITDA Margins(1) 12.7% 17.3% 1.7% (1) Segment Income and therefore Segment EBITDA and Segment EBITDA margins exclude $0.8 million of inventory step-up in fiscal 2012.
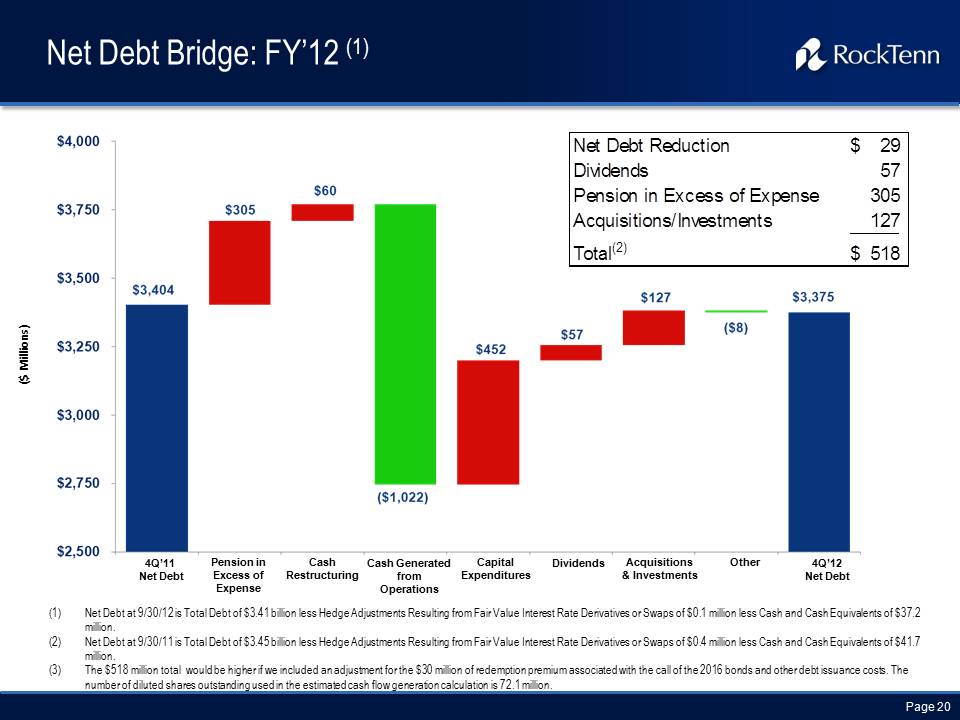
Net Debt Bridge: FY’12 (1) Net Debt at 9/30/12 is Total Debt of $3.41 billion less Hedge Adjustments Resulting from Fair Value Interest Rate Derivatives or Swaps of $0.1 million less Cash and Cash Equivalents of $37.2 million.Net Debt at 9/30/11 is Total Debt of $3.45 billion less Hedge Adjustments Resulting from Fair Value Interest Rate Derivatives or Swaps of $0.4 million less Cash and Cash Equivalents of $41.7 million.The $518 million total would be higher if we included an adjustment for the $30 million of redemption premium associated with the call of the 2016 bonds and other debt issuance costs. The number of diluted shares outstanding used in the estimated cash flow generation calculation is 72.1 million. ($ Millions) 4Q’11 Net Debt Pension in Excess of Expense Cash Restructuring Cash Generated from Operations Capital Expenditures Dividends Acquisitions & Investments Other 4Q’12 Net Debt
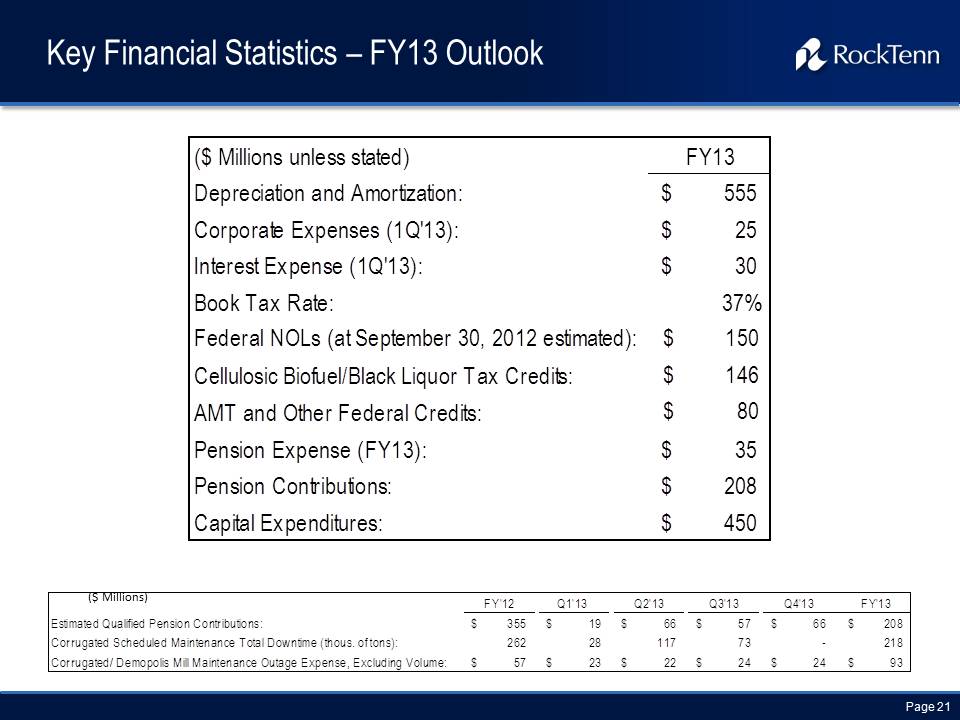
($ Millions unless stated) FY13 Depreciation and Amortization: $ 555 Corporate Expenses (1Q'13): $ 25 Interest Expense (1Q'13): $ 30 Book Tax Rate: 37% Federal NOLs (at September 30, 2012 estimated): $ 150 Cellulosic Biofuel/Black Liquor Tax Credits: $ 146 AMT and Other Federal Credits: $ 80 Pension Expense (FY13): $ 35 Pension Contributions: $ 208 Capital Expenditures: $ 450 FY'12 Q1'13 Q2'13 Q3'13 Q4'13 FY'13 Estimated Qualified Pension Contributions: $ 355 $ 19 $ 66 $ 57 $ 66 $ 208 Corrugated Scheduled Maintenance Total Downtime (thous. of tons): 262 28 117 73 - 218 Corrugated/ Demopolis Mill Maintenance Outage Expense, Excluding Volume: $ 57 $ 23 $ 22 $ 24 $ 24 $ 93