Attached files
| file | filename |
|---|---|
| EX-31.1 - EXHIBIT 31.1 - Rock Energy Resources, Inc. | v329145_ex31-1.htm |
| EX-32.1 - EXHIBIT 32.1 - Rock Energy Resources, Inc. | v329145_ex32-1.htm |
| EX-32.2 - EXHIBIT 32.2 - Rock Energy Resources, Inc. | v329145_ex32-2.htm |
| EX-31.2 - EXHIBIT 31.2 - Rock Energy Resources, Inc. | v329145_ex31-2.htm |
UNITED STATES
SECURITIES AND EXCHANGE COMMISSION
Washington, D.C. 20549
FORM 10-Q
| x | QUARTERLY REPORT PURSUANT TO SECTION 13 OR 15(d) OF THE SECURITIES EXCHANGE ACT OF 1934 |
For the quarterly period ended September 30, 2012
Or
| ¨ | TRANSITION REPORT PURSUANT TO SECTION 13 OR 15(d) OF THE SECURITIES EXCHANGE ACT OF 1934 |
Commission file # 0-23022
ROCK ENERGY RESOURCES, INC.
(Exact name of registrant as specified in its charter)
| Delaware | 11-2740461 | |
| (State or other jurisdiction of incorporation or organization) | (I.R.S. Employer Identification No.) | |
| 10350 Richmond Avenue, Suite 800 | ||
| Houston, TX | 77042 | |
| (Address of principal executive offices) | (Zip Code) |
Registrant’s telephone number, including area code: (832) 301-5968
Securities registered pursuant to Section 12(b) of the Act: None.
Securities registered pursuant to Section 12(g) of the Act: Common Stock, par value $0.0001 per share
Indicate by check mark whether the registrant (1) has filed all reports required to be filed by Section 13 or 15(d) of the Securities Exchange Act of 1934 during the preceding 12 months (or for such shorter period that the registrant was required to file such reports), and (2) has been subject to such filing requirements for the past 90 days. Yes x No ¨
Indicate by check mark whether the registrant has submitted electronically and posted on its corporate Web site, if any, every Interactive Data File required to be submitted and posted pursuant to Rule 405 of Regulation S-T (§232.405 of this chapter) during the preceding 12 months (or for such shorter period that the registrant was required to submit and post such files). Yes ¨ No x
Indicate by check mark whether the registrant is a large accelerated filer, an accelerated filer, a non-accelerated filer, or a smaller reporting company. See the definitions of “large accelerated filer,” “accelerated filer” and “smaller reporting company” in Rule 12b-2 of the Exchange Act.
| Large accelerated filer ¨ | Accelerated filer ¨ |
| Non-accelerated filer ¨ | Smaller reporting company x |
Indicate by check mark whether the registrant is a shell company (as defined in Rule 12b-2 of the Act). Yes ¨ No x
As of November 19, 2012, the registrant had 196,203,932 shares of its Common Stock outstanding.
Explanatory Note
Due to Hurricane Sandy and its aftermath, Company management and its advisors were unable to communicate due to telecommunication and power outages endured on the East Coast and we are relying upon the Order, issued by the Securities and Exchange Commission in Release No. 68224 on November 14, 2012, for the relief from the filing deadline applicable to the Form 10-Q for the quarter ended September 30, 2012.
Forward-Looking Information
We make forward-looking statements throughout this report and the documents included or incorporated by reference in this prospectus. Whenever you read a statement that is not simply a statement of historical fact (such as statements including words like “believe,” “expect,” “anticipate,” “intend,” “plan,” “seek,” “estimate,” “could,” “potentially” or similar expressions), you must remember that these are forward-looking statements, and that our expectations may not be correct, even though we believe they are reasonable. The forward-looking information contained in this prospectus or in the documents included or incorporated by reference in this prospectus is generally located in the material set forth under the headings “Risk Factors,” “Business,” and “Management’s Discussion and Analysis of Financial Condition and Results of Operations” but may be found in other locations as well. These forward-looking statements generally relate to our plans and objectives for future operations and are based upon our management’s reasonable estimates of future results or trends. These statements are not guarantees of future performance and are subject to risks, uncertainties and other factors, some of which are beyond our control and difficult to predict and could cause actual results to differ materially from those expressed or forecasted in the forward-looking statements. In evaluating forward-looking statements, you should carefully consider the risks and uncertainties described in “Risk Factors” and elsewhere in this document and such risk factors include, among others, the following:
| · | our success in development, exploitation and exploration activities; | |
| · | our ability to make planned capital expenditures; | |
| · | declines in our production of oil and gas; | |
| · | prices for oil and gas; | |
| · | our ability to raise capital; | |
| · | political and economic conditions in oil producing countries, especially those in the Middle East; | |
| · | price and availability of alternative fuels; | |
| · | our acquisition and divestiture activities; | |
| · | weather conditions and events; | |
| · | the proximity, capacity, cost and availability of pipelines and other transportation facilities; and | |
| · | other factors discussed elsewhere in this prospectus and the documents incorporated by reference in this prospectus. |
All forward-looking statements attributable to us or persons acting on our behalf are expressly qualified in their entirety by the cautionary statements and risk factors contained in this document. Forward-looking statements contained in this document reflect our view only as of the date of this document. We undertake no obligation, other than as required by law, to update or revise any forward-looking statements, whether as a result of new information, future events or otherwise.
References to “Rock” “we,” “us,” “our” and similar references or like terms refer to Rock Energy Resources, Inc. and references to “Rock Energy” or “REP” refer to Rock Energy Partners, L.P. and its subsidiaries.
| 2 |
Part I — Financial Information
ROCK ENERGY RESOURCES, INC.
CONSOLIDATED BALANCE SHEETS
(Unaudited)
| September 30, 2012 | December 31, 2011 | |||||||
| ASSETS | (Restated) | |||||||
| Current Assets | ||||||||
| Cash | $ | 10,691 | $ | 905,011 | ||||
| Prepaid expenses | 46,500 | — | ||||||
| Total Current Assets | 57,191 | 905,011 | ||||||
| Mineral properties | 3,113,300 | 2,802,541 | ||||||
| Mining and milling equipment | 1,079,938 | — | ||||||
| Furniture, fixtures and equipment | 6,174 | — | ||||||
| Deferred financing cost | - | 75,000 | ||||||
| Prepaid mining cost | 87,885 | 270,589 | ||||||
| Investment in Santa Maria Pacific Holdings, at cost | 1,263,792 | 1,263,792 | ||||||
| TOTAL ASSETS | $ | 5,608,280 | $ | 5,316,933 | ||||
| LIABILITIES AND STOCKHOLDERS’ DEFICIT | ||||||||
| Current Liabilities | ||||||||
| Accounts payable and accrued liabilities | $ | 802,018 | $ | 1,044,297 | ||||
| Accounts payable and accrued liabilities to related parties | 225,000 | 698,000 | ||||||
| Accrued interest | 182,486 | 15,256 | ||||||
| Put option liability | — | 1,598,773 | ||||||
| Derivative warrant instruments | 466,054 | — | ||||||
| Convertible notes payable | 121,000 | — | ||||||
| Notes payable | 2,364,500 | 2,077,500 | ||||||
| Notes payable, related parties | 32,500 | 1,062,000 | ||||||
| Total Current Liabilities | 4,193,558 | 6,495,826 | ||||||
| Notes payable, net of discount of $— and $2,447,917, respectively | 8,702,854 | 52,083 | ||||||
| Put option liability, noncurrent | — | 1,598,773 | ||||||
| Total liabilities | 12,896,412 | 8,146,682 | ||||||
| Stockholders’ Deficit | ||||||||
| Series A Convertible Non-Redeemable Preferred Stock, $0.0001 par value, 10,000,000 shares authorized, no shares outstanding, $1,000 per share liquidation preference | — | — | ||||||
| Common Stock: 500,000,000 shares of $0.0001 par value authorized; 196,203,932 and 180,782,543 shares issued and outstanding as of September 30, 2012 and December 31, 2011, respectively | 19,620 | 18,078 | ||||||
| Additional paid in capital | 15,675,778 | 12,116,884 | ||||||
| Accumulated deficit | (22,983,530 | ) | (14,964,711 | ) | ||||
| Total stockholders’ deficit | (7,288,132 | ) | (2,829,749 | ) | ||||
| TOTAL LIABILITIES AND STOCKHOLDERS’ DEFICIT | $ | 5,608,280 | $ | 5,316,933 | ||||
The accompanying notes are an integral part of these unaudited consolidated financial statements.
| 3 |
ROCK ENERGY RESOURCES, INC.
CONOLSIDATED STATEMENTS OF OPERATIONS
(Unaudited)
| Nine months ended September 30, | Three months ended September 30, | |||||||||||||||
| 2012 | 2011 | 2012 | 2011 | |||||||||||||
| REVENUE – | ||||||||||||||||
| Gold sales | $ | 4,581 | $ | — | $ | - | $ | — | ||||||||
| Gold sales to related party | 4,980 | — | 4,980 | — | ||||||||||||
| Total revenue | 9,561 | — | 4,980 | — | ||||||||||||
| OPERATING EXPENSES: | ||||||||||||||||
| Direct operating costs | 243,155 | — | 92,826 | — | ||||||||||||
| Indirect operating costs | 470,080 | — | 149,844 | — | ||||||||||||
| Exploration and development | 114,126 | — | 49,209 | — | ||||||||||||
| General and administrative | 2,073,676 | 729,493 | 467,973 | 375,000 | ||||||||||||
| Total operating expenses | 2,901,037 | 729,493 | 759,852 | 375,000 | ||||||||||||
| LOSS FROM OPERATIONS | (2,891,476 | ) | (729,493 | ) | (754,872 | ) | (375,000 | ) | ||||||||
| OTHER EXPENSES: | ||||||||||||||||
| Interest expense | (783,482 | ) | — | (292,486 | ) | — | ||||||||||
| Interest expense related to amortization of discounts and deferred financing costs and interest paid in stock | (1,522,068 | ) | — | (561,788 | ) | — | ||||||||||
| Unrealized gain on fair value of derivative warrant instruments | 247,140 | — | 137,196 | — | ||||||||||||
| Loss on debt extinguishment | (3,068,933 | ) | — | (1,810,833 | ) | — | ||||||||||
| Net other income (expense) | (5,127,343 | ) | — | (2,527,911 | ) | — | ||||||||||
| Net Loss | $ | (8,018,819 | ) | $ | (729,493 | ) | $ | (3,282,783 | ) | $ | (375,000 | ) | ||||
| Basic and diluted net loss per common share | $ | (0.04 | ) | $ | (0.01 | ) | $ | (0.02 | ) | $ | (0.00 | ) | ||||
| Basic and diluted weighted average shares outstanding | 194,722,683 | 129,224,900 | 195,914,747 | 136,683,691 | ||||||||||||
The accompanying notes are an integral part of these unaudited consolidated financial statements
| 4 |
ROCK ENERGY RESOURCES, INC.
CONSOLIDATED STATEMENTS OF CASH FLOW
(Unaudited)
| Nine months ended September 30, | ||||||||
| 2012 | 2011 | |||||||
| CASH FLOWS FROM OPERATING ACTIVITIES | ||||||||
| Net loss | $ | (8,018,819 | ) | $ | (729,493 | ) | ||
| Adjustments to reconcile net loss to net cash used in operating activities | ||||||||
| Unrealized gain on fair value of derivative warrant instruments | (247,140 | ) | — | |||||
| Loss on debt extinguishment | 3,068,933 | — | ||||||
| Common stock issued for services and interest expense | 14,800 | 247,500 | ||||||
| Stock based compensation | 1,177,329 | 90,032 | ||||||
| Accretion of put option liability | 383,705 | — | ||||||
| Amortization of debt discount and deferred financing costs | 1,042,438 | — | ||||||
| Changes in operating assets and liabilities: | ||||||||
| Prepaid expenses | 85,204 | — | ||||||
| Accounts payable and accrued liabilities | (242,280 | ) | — | |||||
| Accrued liabilities - related party | (45,500 | ) | 382,500 | |||||
| Accrued interest payable | 167,230 | — | ||||||
| Net cash used in operating activities | (2,614,100 | ) | (9,461 | ) | ||||
| CASH FLOWS FROM INVESTING ACTIVITIES | ||||||||
| Investment in mineral properties | (310,759 | ) | — | |||||
| Investment in mining and milling equipment | (1,079,938 | ) | — | |||||
| Purchases of furniture, fixtures and equipment | (6,174 | ) | — | |||||
| Net cash used by investing activities | (1,396,871 | ) | — | |||||
| CASH FLOWS FROM FINANCING ACTIVITIES | ||||||||
| Repayments of related party debt | (84,000 | ) | — | |||||
| Borrowing of related party debt | 54,401 | — | ||||||
| Proceeds from sales of units | 510,500 | — | ||||||
| Proceeds from issuance of convertible note payable | 121,000 | — | ||||||
| Borrowings of third party debt | 2,514,750 | — | ||||||
| Net cash provided by financing activities | 3,116,651 | — | ||||||
| Net change in cash | (894,320 | ) | (9,461 | ) | ||||
| Cash and cash equivalents at beginning of period | 905,011 | 9,461 | ||||||
| Cash and cash equivalents at end of period | $ | 10,691 | $ | — | ||||
| SUPPLEMENTAL DISCLOSURES OF CASH FLOW INFORMATION | ||||||||
| Cash paid for interest: | $ | 699,177 | $ | — | ||||
| Cash paid for income taxes: | $ | — | $ | — | ||||
| NON-CASH INVESTING AND FINANCING ACTIVITIES | ||||||||
| Stock option exercise paid with accrued salary | 400,000 | — | ||||||
| Stock warrants issued for deferred financing costs | 37,500 | — | ||||||
| Debt discount from common stock issued with debt | 50,000 | — | ||||||
| Reclassification of related party debt to third party | 822,000 | — | ||||||
| Derivative warrants issued as financing costs | 713,194 | — | ||||||
| Debt converted to common stock | 620,000 | — | ||||||
| Liabilities forgiven by related party | 205,401 | — | ||||||
The accompanying notes are an integral part of these unaudited consolidated financial statements
| 5 |
ROCK ENERGY RESOURCES, INC
NOTES TO UNAUDITED CONSOLIDATED FINANCIAL STATEMENTS
September 30, 2012
NOTE 1 – ORGANIZATION AND SUMMARY OF SIGNIFICANT ACCOUNTING POLICIES
Rock Energy Resources, Inc. (the “Company”, “we”, “our”, “Rock”) was formed on April 16, 2004 as a Delaware limited partnership and was engaged in the acquisition, exploration, and development of onshore properties in the United States for the production of crude oil, condensates and natural gas. The Company’s properties were located in Texas and California.
We became severely constrained in our cash and in 2009 were forced to discontinue our working interest oil and gas operations. We traded our California properties in exchange for a small stock interest in a private oil and gas company which has operated these interests since that time. Until December 2011, we had no operations.
During the second half of 2011, we shifted our focus from oil and natural gas operations to the evaluation of possible minerals acquisitions. Towards that end, we began due diligence on a joint venture opportunity with Colorado-based Red Arrow Gold Corporation (“RAGC”). RAGC had spent the past eight years refurbishing the Red Arrow Mine located in Mancos, Colorado.
Consequent to these efforts on December 14, 2011, a $25 million financing was closed into the then privately held American Patriot Gold, Inc. (“APG”). On December 20, 2011, APG was merged into our Company as a wholly owned subsidiary. Under the agreement previously reached between APG and RAGC, APG earned a 49% interest in the Red Arrow Mine and all related equipment, facilities, leases, surface rights, and mining claim. We are in ongoing discussions with RAGC to acquire the balance of their interest in the Red Arrow Mine. There can be no assurances we will be successful in such efforts. As of December 31, 2011, we were in the exploration stage as defined by ASC 915. During the second quarter of 2012, we began our principal operations and therefore exited from the exploration stage.
Principles of consolidation – The consolidated financial statements include the results of Rock Energy Resources, Inc., its wholly owned subsidiaries and its proportionately consolidated interest in the Red Arrow Mine (see below). All significant intercompany accounts have been eliminated in consolidation.
Revenue Recognition - The Company recognizes revenue when persuasive evidence of an arrangement exists, goods have been delivered and title has transferred, the sales price is fixed or determinable, and collectability is reasonably assured. Revenue is generated through the sale of mineral ore and is recognized upon acceptance of ore delivery from the smelter.
Use of estimates – The preparation of financial statements in conformity with accounting principles generally accepted in the United States requires management to make estimates and assumptions that affect the reported amounts of assets, liabilities, revenues and expenses, and the disclosures of contingent assets and liabilities. Actual results could differ from the estimates.
Interim Financial Statements – The accompanying unaudited interim financial statements include all adjustments, which in the opinion of management are necessary in order to make the accompanying financial statements not misleading, and are of a normal recurring nature. However, the accompanying unaudited financial statements do not include all of the information and footnotes necessary for a complete presentation of financial position, results of operations, cash flows and stockholders’ equity in conformity with generally accepted accounting principles. Except as disclosed herein, there has been no material change in the information disclosed in the notes to the financial statements included in our annual financial statements for the period ended December 31, 2011 included in Form 10-K. Operating results for the period ended September 30, 2012 are not necessarily indicative of the results that can be expected for the fiscal year ending December 31, 2012.
Cash and cash equivalents – Highly liquid investments with original maturities of less than three months are considered cash equivalents and are stated at cost which approximates market value.
Red Arrow Mine – The Red Arrow Mine is operated by RAGC. We advance funds to RAGC which are used to acquire fixed assets or for operating costs of the mine and certain corporate general and administrative expenses. In accordance with our agreement with RAGC, we are currently paying 100% of the expenses and fixed asset costs of the Red Arrow Mine. As a result, we will receive 100% of future revenue until payout of our total invested expenses inclusive of stock based compensation, when we will have been repaid for the additional (51%) costs incurred above our 49% share. We account for our share of these expenditures and fixed assets in our consolidated financial statements in accordance with ASC 910-10-45-14 Proportionate Consolidation. Advances to RAGC which remain unused at the end of the period are included in prepaid mining costs and included in noncurrent assets since we do not expect to realize these assets in the short term.
| 6 |
Warrant Derivative Instruments – The Company accounts for warrant derivative instruments under the provisions of FASB ASC Topic No. 815 – 40, Derivatives and Hedging - Contracts in Entity’s Own Stock This FASB ASC Topic’s requirements can affect the accounting for warrants and many convertible instruments with provisions that protect holders from a decline in the stock price (or “down-round” provisions). For example, warrants with such provisions cannot be recorded in equity. Downward provisions reduce the exercise price of a warrant or convertible instrument if a company either issues equity shares for a price that is lower than the exercise price of those instruments or issues new warrants or convertible instruments that have a lower exercise price. The Company evaluated whether warrants issued during various private placement offerings contained provisions that protect holders from declines in the Company’s stock price or otherwise could result in modification of the exercise price and/or shares to be issued under the respective warrant or preferred stock agreements based on a variable that is not an input to the fair value of a “fixed-for-fixed” option as defined under FASB ASC Topic No. 815 – 40.
In accordance with FASB ASC Topic No. 815 – 40, the Company recognized the warrants that contain these down round provisions as liabilities at their respective fair values on each reporting date. FASB ASC Topic No. 815 – 40 also requires that such instruments be measured at fair value at each reporting period.
Recently issued accounting pronouncements – We do not expect the adoption of recently issued accounting pronouncements to have a significant impact on our results of operations, financial position or cash flow.
NOTE 2 – RELATED PARTY TRANSACTIONS
During the nine months ended September 30, 2012, Rocky Emery, our Chairman and CEO, exercised options to purchase 2,500,000 shares of common stock with an exercise price of $0.16 per share. In accordance with the terms of the options Mr. Emery elected to offset accrued liabilities for unpaid salary in the amount of $400,000 rather than paying the exercise price of $400,000.
On August 21, 2012, Rocky Emery, our Chairman and CEO, forgave the following amounts which were owed to him on that date:
| Accrued unpaid salary | $ | 27,500 | ||
| Notes payable | 177,901 | |||
| Total | $ | 205,401 |
This amount was recorded as an increase in additional paid in capital.
During the nine months ended September 30, 2012, we issued 3,000,000 shares of common stock to Mr. Craig Liukko, a member of our board of directors and our COO, in accordance with the terms of his employment agreement. The shares were valued at $1,800 based on the market value on the date of grant.
During the nine months ended September 30, 2012, we reclassified $822,000 of debt that was previously classified as related party debt to third party debt as a result of the resignation of the director to whom the debt was owed.
During the nine months ended September 30, 2012, we borrowed $54,401 from two officers and repaid $84,000. The advances did not bear interest, were unsecured and due on demand.
During the nine months ended September 30, 2012, we sold gold with a fair market value of $4,980 to Rocky Emery, our Chairman and CEO, for cash proceeds of $4,980.
| 7 |
NOTE 3 – NOTES PAYABLE
During the nine months ended September 30, 2012, we borrowed an additional $2,429,750 under our $25 million lending facility with Maximilian Investors LLC of New York (“Maximilian”).
During the nine months ended September 30, 2012, we granted warrants to purchase 750,000 shares of common stock to a broker associated with our $25 million lending facility. The warrants have an exercise price of $0.50 per share and a term of five years. The warrants were valued at $37,500 using the Black-Scholes option pricing model with the following assumptions: stock price on the measurement date of $0.05; option term of five years; expected volatility of 492%; and a discount rate of 1.31%. The value of the options is included in deferred financing costs and will be amortized over the life of the loan.
On August 28, 2012, we amended our financing agreement with Maximilian. The modifications were as follows:
| · | The maturity date was extended to September 1, 2014. |
| · | Maximilian’s net profit’s bonus was increased from 3% to 5%. |
| · | The put option which had been granted to Maximilian at the origination of the lending facility was cancelled and the maximum amount which would have been payable under the put option, $3,773,104, was added to the principal balance of the note. |
The Company evaluated the application of ASC 470-50-40/55, Debtor’s Accounting for a Modification or Exchange of Debt Instrument as it applies to the credit facility and concluded that the revised terms constituted a debt extinguishment rather than a debt modification because the present value of the cash flows under the terms of the new instrument was more than 10% different from the present value of the remaining cash flows under the terms of the credit facility. As a result, the Company recorded a loss on the debt extinguishment in the amount of $1,810,833. The loss includes the write off of remaining unamortized discount on note payable in the amount of $1,510,417, the write off of deferred financing costs of $108,563 and the difference between the discounted value of the put option liability on the books on the date of the modification and the full undiscounted value which was added to the note in the amount of $191,853.
During the nine months ended September 30, 2012, holders of current notes payable in the amount of $620,000 agreed to take 6,480,000 shares of common stock to pay off the loans. The common stock was valued at $1,878,100 based on the market value on the date of issuance. As a result of this transaction, we recognized a loss on debt extinguishment in the amount of $1,258,100.
On July 18, 2012, the Company borrowed $50,000 from a third party under a short term note. The note bears interest at 6% per year and matures 45 days from the date of issuance. It also requires the issuance of 250,000 shares of common stock as added compensation on or before the maturity date. As of September 30, 2012, the shares had not been issued. The Company recognized a discount of $50,000 on the note based on the fair market value of the shares required to be issued. This discount was immediately amortized to interest expense.
During the nine months ended September 30, 2012, the Company borrowed $55,000 from a third party. The note is non-interest bearing and payable on demand.
NOTE 4 – CONVERTIBLE NOTES PAYABLE
On June 29, 2012, the Company borrowed $78,500 under a Convertible Promissory Note. The note bears interest at 8% per year. It is payable along with accrued interest on April 3, 2013. The note is convertible beginning six months after the issuance date at 58% of the Market Price. The Market Price is the average of the lowest three trading prices during the ten day period prior to the conversion.
On August 21, 2012, the Company borrowed $42,500 under a Convertible Promissory Note. The note bears interest at 8% per year. It is payable along with accrued interest on May 23, 2013. The note is convertible beginning six months after the issuance date at 58% of the Market Price. The Market Price is the average of the lowest three trading prices during the ten day period prior to the conversion.
| 8 |
NOTE 5 – COMMON STOCK AND STOCK OPTIONS
During the nine months ended September 30, 2012, the Company issued 2,000,000 shares of common stock with a fair value of $13,000 for interest expense on a note previously issued during 2011.
On March 16, 2012, pursuant to the 2009 Stock Grant and Option Plan, the Company granted options to purchase 3,425,000 shares of common stock to three employees and officers of the Company and three contractors of the Company. The options are exercisable at $0.16 per share for a term of five years from the date of grant. One third of the options vest on the grant date and on each of the next two anniversary dates of the grant date. The options were valued at $1,883,747 using the Black-Scholes option pricing model with the following assumptions: stock price on the measurement date of $0.55; option term of 3.5 years; expected volatility of 461%; and a discount rate of 0.57%. During the nine months ended September 30, 2012, the Company recognized $1,177,329 of expense related to these option grants, leaving $706,407 of expense to be recognized over 0.91 years.
During the nine months ended September 30, 2012, the Company sold 888,889 Units in a private placement (the “2012 Unit Offering”) and received cash proceeds of $400,000 ($0.45 per Unit). Each Unit consists of one share of common stock and two warrants (the “Private Placement Warrants”) to purchase common stock at $0.50 per share for a term of five years. As a result of the Unit offering, the Company issued 888,889 shares of common stock and 1,777,778 warrants to purchase common stock.
During the nine months ended September 30, 2012, the Company sold 552,500 Units in a private placement (the “2012 Second Unit Offering”) and received cash proceeds of $110,500 ($0.20 per Second Unit). Each Second Unit consists of one share of common stock and one warrants (the “Second Private Placement Warrants”) to purchase common stock at $0.05 per share for a term of five years. As a result of the Unit offering, the Company issued 552,500 shares of common stock and 552,500 warrants to purchase common stock.
The Private Placement Warrants and Second Private Placement Warrants are subject to price protection. In the event that the Company issues common stock or debt or equity instruments convertible into common stock for a period beginning upon closing and ending nine months after registration of the common stock issued in the private placement becomes effective, the Company shall adjust the warrant exercise price in order to create equality with any other transaction terms. The Private Placement Warrants are immediately exercisable.
The Company determined that warrants to purchase a total of 2,330,278 shares of common stock issued during the nine months ended September 30, 2012, contained provisions that protect holders from declines in the Company’s stock price or otherwise could result in modification of the exercise price and/or shares to be issued under the respective warrant based on a variable that is not an input to the fair value of a “fixed-for-fixed” option as defined under FASB ASC Topic No. 815 – 40 - 15. As a result, these warrants were not indexed to the Company’s own stock. On the issuance date of the Units, the fair value of these warrants was determined to be $713,194, which was recorded as a derivative warrant instruments liability.
NOTE 6 – PUT OPTION LIABILITY
In connection with the lending facility we entered into during 2011, we issued 18,865,520 shares of common stock to the lender and gave them a put option which would allow them to sell back their shares to the Company for $0.20 per share. The option is exercisable for 9,432,760 shares during each of the years ending December 31, 2012 and 2013. The put option was recorded as a liability at its present value of $3,197,546 as of December 31, 2011. It was expected to be accreted up to its full value of $3,773,104 by the expiration of each put option. This amount represents the maximum potential cash outlay by the Company if it had to repurchase all of the shares. During the nine months ended September 30, 2012, the Company recorded accretion of $383,705.
On August 2, 2012, we modified our debt with Maximilian. As a result of the modification, the put option which had been granted to Maximilian at the origination of the lending facility was cancelled and the maximum amount which would have been payable under the put option, $3,773,104, was added to the principal balance of the note. As a result, the put option liability is $0 as of September 30, 2012.
| 9 |
NOTE 7 – DERIVATIVE WARRANT INSTRUMENTS (LIABILITIES)
In the 2012 Unit Offering and the 2012 Second Unit Offering, the Company incurred liabilities for the estimated fair value of derivative warrant instruments in the form of warrants. The estimated fair value of the derivative warrant instruments was calculated using the Black-Scholes option pricing model as of the issuance date of the Private Placement Warrants and the Second Private Placement Warrants. Such estimates were revalued at each balance sheet date, with changes in value recorded as unrealized gains or losses in non-operating income (expense) in the Company’s statements of operations.
During the nine months ended September 30, 2012, the fair value of the warrant derivative liabilities decreased by $247,140. Such changes were recorded as unrealized gains on fair value of derivative warrant instruments in the accompanying consolidated statements of operations.
Activity for derivative warrant instruments liability during the nine months ended September 30, 2012 was as follows:
| Decrease in | ||||||||||||||||
| Activity | Fair Value of | |||||||||||||||
| December 31, | during the | Derivative | September 30, | |||||||||||||
| 2011 | year | Liability | 2012 | |||||||||||||
| Derivative warrant instruments | $ | — | $ | 713,194 | $ | (247,140 | ) | $ | 466,054 | |||||||
The fair value of the derivative warrant instruments is estimated using the Black-Scholes option pricing model with the following assumptions as of the date of issuance and September 30, 2012:
| Issuance | September 30, | |||||||
| Date | 2012 | |||||||
| Common stock issuable upon exercise of warrants | 2,330,278 | 2,330,278 | ||||||
| Estimated market value of common stock on measurement date | $ | 0.16to$0.36 | (1) | $ | 0.20 | (1) | ||
| Exercise price | $ | 0.05-0.50 | $ | 0.05-0.50 | ||||
| Risk free interest rate (2) | 0.63%to0.84 | % | 0.62 | % | ||||
| Warrant lives in years | 5 | 5 | ||||||
| Expected volatility (3) | 453 -472 | % | 442 | % | ||||
| Expected dividend yields (4) | None | None | ||||||
| (1) | The estimated market value of the stock was measured by management based on the reported public market prices. | |
| (2) | The risk-free interest rate was determined by management using the U.S. Treasury zero-coupon yield over the contractual term of the warrant on date of grant. | |
| (3) | The volatility factor was estimated by management using the historical volatilities of the Company’s common stock since it began trading in February 2008. | |
| (4) | Management determined the dividend yield to be 0% based upon its expectation that there will not be earnings available to pay dividends in the near term. |
NOTE 8 – FAIR VALUE MEASUREMENTS
As defined in FASB ASC Topic No. 820 – 10, “Fair Value Measurement and Disclosures”, fair value is the price that would be received upon the sale of an asset or paid to transfer a liability in an orderly transaction between market participants at the measurement date. FASB ASC Topic No. 820 – 10 requires disclosure that establishes a framework for measuring fair value and expands disclosure about fair value measurements. The statement requires fair value measurements be classified and disclosed in one of the following categories:
| Level 1: | Unadjusted quoted prices in active markets that are accessible at the measurement date for identical, unrestricted assets or liabilities. The Company considers active markets as those in which transactions for the assets or liabilities occur in sufficient frequency and volume to provide pricing information on an ongoing basis. |
| 10 |
| Level 2: | Quoted prices in markets that are not active, or inputs which are observable, either directly or indirectly, for substantially the full term of the asset or liability. Substantially all of these inputs are observable in the marketplace throughout the term of the derivative instruments, can be derived from observable data, or supported by observable levels at which transactions are executed in the marketplace. | |
| Level 3: | Measured based on prices or valuation models that require inputs that are both significant to the fair value measurement and less observable from objective sources (i.e. supported by little or no market activity). The Company’s valuation models are primarily industry standard models. Level 3 instruments include derivative warrant instruments. The Company does not have sufficient corroborating evidence to support classifying these assets and liabilities as Level 1 or Level 2. |
As required by FASB ASC Topic No. 820 – 10, financial assets and liabilities are classified based on the lowest level of input that is significant to the fair value measurement. The Company’s assessment of the significance of a particular input to the fair value measurement requires judgment, and may affect the valuation of the fair value of assets and liabilities and their placement within the fair value hierarchy levels. The estimated fair value of the derivative warrant instruments was calculated using the Black-Scholes option pricing model (see Note 7).
Fair Value on a Recurring Basis
The following table sets forth, by level within the fair value hierarchy, the Company’s financial assets and liabilities that were accounted for at fair value on a recurring basis as of September 30, 2012:
| Fair Value Measurements at September 30, 2012 | ||||||||||||||||
| Quoted Prices | ||||||||||||||||
| In Active | Significant | Total | ||||||||||||||
| Markets for | Other | Significant | Carrying | |||||||||||||
| Identical | Observable | Unobservable | Value as of | |||||||||||||
| Assets | Inputs | Inputs | September 30, | |||||||||||||
| Description | (Level 1) | (Level 2) | (Level 3) | 2012 | ||||||||||||
| Derivative warrant instruments | $ | — | $ | — | $ | 466,054 | $ | 466,054 | ||||||||
| Total | $ | — | $ | — | $ | 466,054 | $ | 466,054 | ||||||||
The following table sets forth a reconciliation of changes in the fair value of financial assets and liabilities classified as level 3 in the fair value hierarchy:
| Significant Unobservable Inputs (Level 3) | ||||
| Nine months Ended September 30, 2012 | ||||
| Beginning balance | $ | — | ||
| Total gains | 247,140 | |||
| Settlements | — | |||
| Additions | (713,194 | ) | ||
| Transfers | — | |||
| Ending balance | $ | (466,054 | ) | |
| Change in unrealized gains included in earnings relating to derivatives still outstanding as of September 30, 2012 | $ | 247,140 | ||
| 11 |
NOTE 9 – RESTATEMENT
In accordance with SAB Topic 4:B, the Company has reclassified $35,486,805 of its accumulated deficit as of December 31, 2007 (the date that the Company converted from a limited liability company to a C Corporation) to additional paid-in capital. This reclassification has been reflected in the consolidated balance sheet as of December 31, 2011.
NOTE 10 – SUBSEQUENT EVENTS
On October 20, 2012, the Private Placement Warrants and the Second Private Placement Warrants (collectively, the “Warrants”) were modified to remove the price protection and reset the exercise price at $0.16 per share. Following the modification, the Warrants are indexed to the Company’s own stock and are no longer required to be accounted for as derivative liabilities. The Warrants were revalued as of October 20, 2012 and were reclassified into equity.
| 12 |
Item 2. Management’s Discussion and Analysis or Plan of Operations
The following discussion and analysis of our plan of operation should be read in conjunction with the financial statements and the related notes. This discussion contains forward-looking statements based upon current expectations that involve risks and uncertainties, such as our plans, objectives, expectations and intentions. Our actual results and the timing of certain events could differ materially from those anticipated in these forward-looking statements.
Rock Energy Resources, Inc. (“the Company”) was formed on April 16, 2004 as a Delaware limited partnership and was engaged in the acquisition, exploration, and development of onshore properties in the United States for the production of crude oil, condensates and natural gas. The Company’s properties were located in Texas and California. The produced condensate and natural gas was sold to petroleum marketers.
On January 2, 2008, we entered into a share exchange agreement (“REP Asset Purchase”) with Hanover Gold, Inc. and exchanged all of our outstanding limited and general partnership units for 54,374,849 of the outstanding common stock of Hanover Gold, Inc. Rock Energy Resources, Inc. was the accounting acquirer in this transaction. We also issued 3,746,517 shares to two consultants who assisted us in the transaction and paid a cash consulting fee of $625,000. Prior to the transaction, Hanover Gold, Inc. had 4,378,634 common shares outstanding, all of which were kept by the original shareholders. All common stock information contained herein reflects a one share for eight shares reverse stock split effective February 19, 2008. On the same date, we changed our name from Hanover Gold Company, Inc., to Rock Energy Resources, Inc.
During the second half of 2011, we shifted our focus from oil and natural gas operations to the evaluation of possible minerals acquisitions. Towards that end, we began due diligence on a joint venture opportunity with Colorado-based Red Arrow Gold Corporation (“RAGC”). RAGC had spent the past eight years refurbishing the Red Arrow Mine located in Mancos, Colorado.. After investing approximately $8 million in mine refurbishment over six years, RAGC was seeking outside funding for up to $25 million to finance the full development of the Red Arrow mine.
Consequent to these efforts on December 14, 2011, a $25 million financing (“the Facility”) was closed into the then privately held American Patriot Gold, LLC (“APG”). On December 20, 2011, APG was merged into our Company as a wholly owned subsidiary. The Facility and its terms are discussed more fully in Item 8 of this Form 10-K. Under the agreement previously reached between APG and RAGC, APG earned a 49% interest in the Red Arrow Mine and all related equipment, facilities, leases, surface rights, and mining claim. Although mineral exploration operations commenced in March of this year, milling operations in May of this year and sales revenues in May of this year, under SEC Guide 7 we will continue to be classified as an exploration company until we complete a Guide 7 compliant reserve report. The Red Arrow Mine, its history and current operations profile is discussed in Mining Properties – Red Arrow Mine below. All the related assets we acquired within our 49% interest are discussed in Mining Properties – Red Arrow Mine below.
In furtherance of our strategy to focus on our exploration operations at the Red Arrow mine and related claims in particular, on February 2, 2012 we entered into a Letter of Intent to acquire the remaining 51% interest in the assets of RAGC. Under the terms of the LOI, a closing was anticipated to occur prior to the end of May, 2012. That letter expired and a new LOI has been sent to RAGC for their consideration. Both parties remain fully committed to a combination of the two companies and negotiations are ongoing.
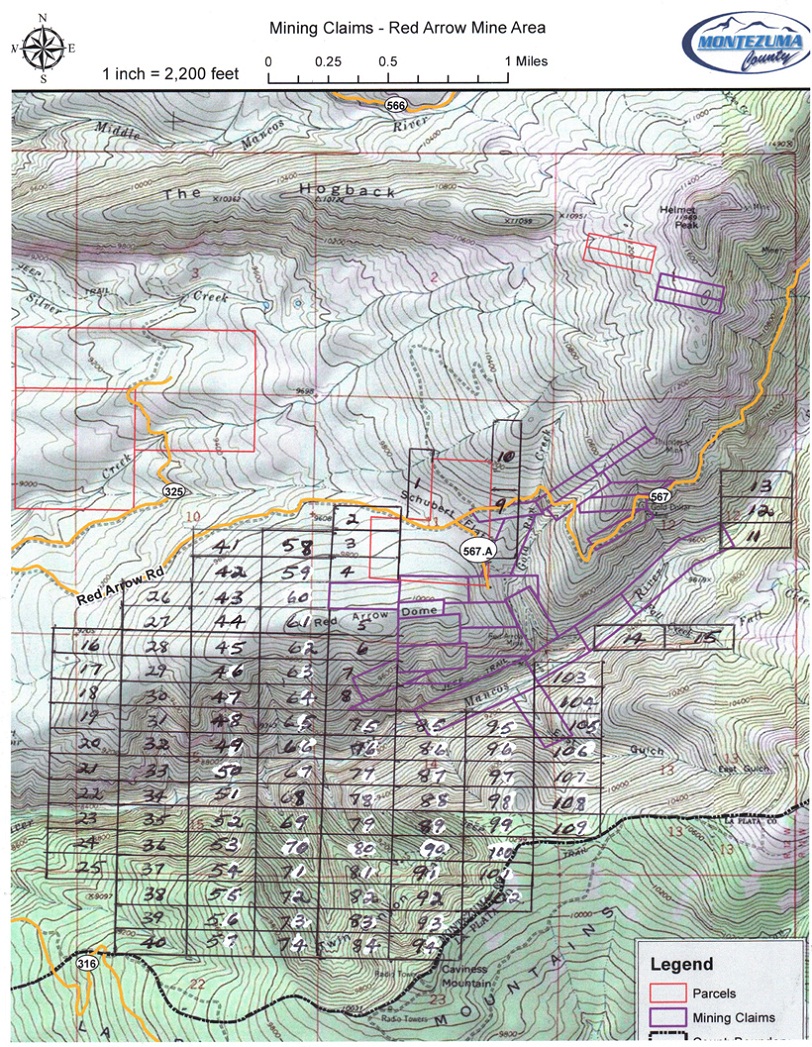
We are also focused on the exploration of the mineral potential located on the existing RAGC claims and leases. Towards that end, during the first nine months of 2012, we increased our leases and patented claims from 390 acres at the end of 2011, to in excess of 2,000 acres currently. All claims have been paid for and are on file at the Bureau of Land Management. A map of those claims is shown below:
| 13 |
| 14 |
In February, 2012 we began the initial phase of our coring program. During the month, an aerial magnetometer survey covering more than 14 miles was completed and evaluation of those results was also completed. Interpretations showed a deep intrusive with sulphide mineralization. We then added the additional claims over the next several months because of the size and the potential of the area indicated by the survey.
In late May we began our initial core drilling with 6 initial cores. The first 5 cores were part of a fan drilling that assisted us in indicating direction and giving our team valuable geologic information for our future development. In fact from this drilling the company has begun initial work on a new drift developed to the west.
It was decided that the sixth core would be drilled down to 3500 feet and into the Hermosa Formation which is a well-known host for sulphide mineralization. Due to unstable hole conditions we were forced to stop this verticle hole at 2706 feet. The company encountered sulphide mineralization through-out from the surface down through the Red-Beds which was a positive surprise. Subsequent assay work done by our third-party Canadian lab showed gold, silver, and the platinum metals group.
The Company believes it may have identified a deep sulphide intrusive deposit based on the aerial magnetometer survey. Assays from surface soil samples taken that showed gold (0.82 ounces per ton) and platinum (.06 ounces per ton). We have assayed results at our current depth of development at around 500 feet with results for gold between .23 and 26 ounces per ton and initial assay work on the deep core at around 1700 feet that had gold and platinum along with sulphide mineralization through-out the total core of 2706 feet. During the same period the company also worked hard at developing is exploration program at the mine and the current stope. We constructed a portal cover for the transition from the mine to the trucks to be taken to our milling location. We currently have in excess of 1,300 pounds of mineral material in the chutes and we are adding mined ore at a current rate of 60 tons per week. We anticipate that at the current the rate of mine excavating at around 4 feet per day we should continue exploring this stope for at least the next several months. As indicated above based upon our core work we have begun a new drift to the west and exploration of this drift will commence shortly.
The chart which follows profiles our exploration and milling operations over the first nine months of 2012.
| April 2012 | 10 tons | |||
| May 2012 | 65 tons | |||
| June 2012 | 232 tons | |||
| July 2012 | 319 tons | |||
| August 2012 | 204 tons | |||
| September 2012 | 180 tons |
During the second quarter the company began exploring the refining and sales process of our extracted minerals. In May 20 pounds concentrates were sent to a lab in Golden Colorado for assay and processing. We were able to process and sell 3.5 ounces of .999 gold from this initial sample, which confirmed that the Red Arrow Mine contains a salable product. It was also discovered that process was unable to deal with the Platinum that was also part of this initial 20 pound test. At this point we began looking at multiple processes to refine and sell both our gold and platinum. It was determined that there was added equipment needed that could deal with both and not eradicate either the gold or the platinum. This equipment is now in place.
We plan on continuing the milling and refining with this new equipment in Arizona which is in close proximity to our buyers location. Our sales through the first two weeks of November are shown in the chart below. We plan on adding a second shift of miners at the beginning of the first quarter and a third shift at the beginning of the third quarter. In addition we are working on further efficiencies at our mill, with the objective of increasing our milling rates to 50 tons per day from the current level of 8-10 tons per day.
| May 2012 | $ | 3,600 | ||
| June 2012 | 981 | |||
| August 2012 | 4,980 | |||
| October 2012 | 14,527 | |||
| November 2012 | 41,170 |
| 15 |
Anticipated cash flows from our exploration and milling operations together with drawdowns under our Facility and potentially added equity should fully finance our expansion plans. We are in the process of expanding our work force from their current 40 hour per week schedule per miner to three full 24/7 shifts in the coming months.
While we fully develop our valuable Red Arrow assets, we are continuing to seek avenues for the monetization of our remaining oil and gas holding, a 3.5% membership interest in Santa Maria pacific Holdings, LLC (“SMPH”). In June, 2009 we elected to exchange our working interests in our California oil properties into privately held SMPH. We consider that asset to be a potential source of cash to further supplement our financial resources in pursuit of our core business in the mining sector. At this time we have not concluded a definitive plan to monetize this interest.
Mining Properties – Red Arrow Mine
Historical Background
The Red Arrow Mine has historically produced commercial grade gold and silver ore. According to “Geological Survey Professional Paper No. 219” (1949), Page 161, entitled, “Production of Red Arrow Mine”, a total of 621 tons were produced from 1933-1937, which yielded 4,114.5 oz. Au (gold) and 6,928 oz. Ag (silver). The average grade of ore based on these figures yielded 6.62 oz. gold per ton and 11.15 oz. silver per ton. Limited production continued after the reporting period to 1942, with an overall average ore grade from 10,146 tons reported as 1.09 oz. gold per ton and 1.6 oz. silver per ton. (US Geological “Professional Paper 219” provides more detailed information).
Location and Access
Although we are exploring, milling and selling some quantities of gold, under SEC Guide 7 we will continue to be classified as an exploration stage company until such time as we complete an SEC Guide 7 compliant reserve report.
Our executive offices are based in Houston, Texas. Our mining operations are carried out at the Red Arrow Mine, located in Montezuma County, Colorado, approximately 9 miles northeast of the town of Mancos, Colorado. The current Red Arrow Mine property consists of in excess of 2.800 acres of mining claims and fee lands. Approximately $8 million was invested to purchase the properties and equipment and upgrade the entire infrastructure of the mine prior to the December 2011 acquisition by American Patriot Gold, Inc. We currently hold a 49% ownership position in the mineral assets including all mining and milling equipment.
Snow removal equipment enables year round access to the Mine via public roadways. Offsite pilot scale milling operations commenced in February 2012. Our milling facility became fully operational in the mid-second quarter, with power supplied by a Tier 4 diesel generator.
Current Geological and Assay Data
After purchase of the Red Arrow and Outwest properties in 1988, historical maps and assay data completed by former owners were evaluated and cross checked by sampling. Extensive sampling of the Gold Run and Old Mill Levels has given direction for primary ore production. In the current area of ore production, approximately 200 ft. in length along the strike of the vein, the ore has averaged over 1 oz. gold per ton. In the last area of production, a raise from the Gold Run Level to the Old Mill Level ranged from 6 inches to 5 ft. in width (30 in. width average).
During the second quarter, favorable results were obtained in the footwall and hanging wall of the vein structure. The potential values in these structures increase with the presence of silicified and brecciated sandstone. Our initial coring work has indicated the potential presence of further mineral deposits in the deeper portion of our properties. Subsequent work completed by David Gonzalez our third party geoscientist consultant that has reinforced the potential of our Red Arrow Mine assets. A copy of this work is on our website: www.americanpatriotgold.com.
Permits and bonding were in place for a core drilling program that began during the second quarter. The first portion of this program focused on delineation of the current Red Arrow vein and other potential veins accessible from the existing runs. Six core holes totaling in excess of 3,500 feet were drilled in this fan-drilling stage. Owing to the results of this initial program, additional fan drilling may continue as capital permits. As presently envisioned, the second phase of our program may focus on delineating an intrusive sulphide deposit that may have depth potential of over 5,000 ft. below the surface according to the late PhD Geologist John Awald. In addition to his research at the Red Arrow Mine, he conducted an intense investigation of the La Plata Mining District which led to his purchase of a major mining property in close proximity. Core drilling of that property was very positive. Our recently completed aero-magnetic survey offered additional confirmation of potential mineralization at depth. We currently estimate the cost of core drilling to 7-10,000 feet will cost between $700,000-$1,000,000 per well. At least ten such wells may eventually be required to confirm any mineralization in this deep sulfide intrusive.
| 16 |
Other Claims
In addition to lode (underground) potential, the Company owns approximately two miles of placer mining rights in the East Mancos drainage. According to a 2007 GIS Report, the East Mancos River contained the highest gold and arsenic concentrations from 41 stream sediment samples taken in the La Plata Mining District. The East Mancos River is on Colorado’s endangered river list due to high concentrations of copper. Copper, gold, silver and arsenic have been historically closely associated in the District.
Further testing and exploration of other areas at the Red Arrow Mine are anticipated and may add substantially to the Company’s exploration plans.
Other Assets at the Red Arrow Mine
In January 2011, RAGC commissioned Richard Eaman, a Professional Extractive Metallurgist, to perform a third party review of the assets associated with the Red Arrow Mine, as well as the ore bodies themselves. As regards to the property, equipment and other assets at the Red Arrow Mine, Mr. Eaman reported the following valuations:
| Red Arrow Development (Underground, Roads & Structures) | $ | 2,500,000 | ||
| Permits and Permit Amendments | $ | 136,550 | ||
| Equipment | $ | 714,944 |
See Independent Report and Analysis of the Red Arrow Mine, dated January, 2012, by Richard A. Eaman and Hazen Research, filed as Exhibit 10.1 to the Company’s Current Report on Form 8-K filed with the U.S. Securities and Exchange Commission on January 9, 2012. This report includes a resume on Mr. Eaman’s background.
Since the date of that report, and as of September 30, 2012, RAGC has invested in excess of $4 million in its exploration and milling operations. .
Our Growth Strategies:
Our business model focuses on building shareholder value contemporaneously on two fronts: growth in operating cash flows and validation and growth in resources.
Growth in Operating Cash Flows- With our larger scale mill now on-line, we anticipate quarter over quarter growth in revenues beginning in the fourth quarter of 2012 through at least 2013. Revenue growth is forecast to come from:
| · | Development of at least two new stopes at the Red Arrow Mine; |
| · | Continued extension of the current drifts; |
| · | A shift from the current 40 hour shifts by the miners to a three shift 24/7 schedule; and |
| · | Added miners to develop additional stopes. |
Validation of Current Claims- We believe our rising cash flows and access to our existing credit facility should allow us to maintain an ongoing program of coring prospective horizons, both at the shallow existing mining horizons, as well as deeper potential to as deep as 10,000 feet. We have started with new surface samples being taken to assist in the development of future drilling locations. Dependent on results of that program we may meaningfully increase our coring budget for 2013, as cash flow and capital permit.
| 17 |
Intellectual Capital- To support our efforts during the first quarter of 2012, we announced that we had assembled a highly competent team of advisors to work with us at each step of our process. The common threads running through this group are:
| · | focused on specifics fields—geophysics, geology, engineering and metallurgy; | |
| · | well credentialed in their area of expertise; | |
| · | substantial years of experience; | |
| · | strong knowledge base of the La Plata mining area where the Red Arrow mine is located. |
Resumes on these individuals are available on our website: www.american patriotgold.com.
We are also continuing to add to our strength at the Board of Directors level. In addition to our corporate executives--Messrs Emery, Harrington and Liukko, we were pleased to announce on May 8 that Mr. Joel Gold had joined our Board. With over 40 years of experience and senior positions in investment banking at firms including Drexel Burnham, Bear Stearns and several others, Mr. Gold’s deep understanding of the challenges of rapidly growing companies is an important asset for us. We will continue to add complimentary strengths to our Board of Directors as the year 2012 progresses.
Plan of Operations
The company is working towards expansion of mining operations from one stope to up to three stopes in the coming quarters. This will facilitate an increase in our miners shifts from the present one shift to a 24/7 three shift schedule by the mid second quarter.
We are also exploring various optimization alternatives for our milling operations, that together with our increase in exploration activity may result in a rise in milling rates from the current 8-10 tons per day to potentially 50 tons per day by mid 2013. This will entail additional capital which will be sourced from internal cash flow, drawdowns on our Facility and possibly added equity..
We currently have in excess of 1,300 pounds of mineral material in the chutes and we are adding additional mineral extracted material at a current rate of 60 tons per week on a 40 hour work week per miner. We are exploring alternatives for processing our mineralized material at other facilities to increase cash flow in the coming months.
As indicated above based upon our core work we have begun a new drift to the west. This would also be additive to the above mining number of 60 tons per week.
As noted earlier, the company feels it has identified a deep sulphide intrusive deposit based on the aerial magnetometer survey. . We are currently engaging in more surface sample work that will assist in our future drilling locations to maximize our potential from each core. Dependent on cash flows and available capital, we anticipate that over the next 18 months we will invest approximately $3,000,000 on this program.
We continue to work with the Board of RAGC on terms to acquire the remaining 51%. We also anticipate acquiring some remaining notes from RAGC note holders. The company feels that this needs to come from sources other than the Maximilian $25,000,000 facility. These could include revenues and or the sale of additional equity or the use of our own securities.
At this time, it is the company’s opinion that the most prudent use of the Maximilian facility is expenditures that would increase or enhance immediate productivity. This provides a disciplined model for only borrowing money for the purpose of enhancing revenue. We are committed to becoming debt free over the coming year. Any additional cash needs will come from either revenues and or the sale of additional equity. We believe this model fits within the current Global Macro-Environment. As part of the management of our cost of capital the company has also begun the process re-financing the current facility with less expensive capital. We are also discussing a reduction in the current interest rate with our current capital provider.
| 18 |
Results of Operations
For the Nine months Ended September 30, 2012 Compared to the Nine months Ended September 30, 2011
Revenue
We recognized revenue from gold sales in the amount of $9,561 during the nine months ended September 30, 2012. This was the first revenue to be recognized from our operation of the Red Arrow Gold Mine.
Direct Operating Costs
Direct Operating Costs were $243,155 for the nine months ended September 30, 2012. Direct Operating Costs includes mining and milling salaries and the costs of mining and milling gold. We began to incur these costs at the beginning of 2012 as a result of our operation of the Red Arrow Gold Mine.
Indirect Operating Costs
Indirect Operating Costs were $470,080 for the nine months ended September 30, 2012. Indirect Operating Costs include our share of the cost of operating the Red Arrow Gold Mine. We began to incur these costs at the beginning of 2012 as a result of our operation of the Red Arrow Gold Mine.
Exploration and Development
We incurred exploration and development costs of $114,126 during the nine months ended September 30, 2012. These costs were predominately associated with our aeromagnetic survey and our initial coring program. .
General and Administrative Expense
General and administrative expense increased to $2,073,686 for the nine months ended September 30, 2012 versus $729,493 in the same period of 2011. General and administrative expense for the nine months ended September 30, 2012 includes stock based compensation of $1,177,338. General and administrative expense for the nine months ended September 30, 2011 includes stock based compensation of $90,032 and accrued unpaid officer salaries of $255,000. Excluding the non-cash amounts described above, cash general and administrative expense would have been $896,348 and $384,461 for the nine months ended September 30, 2012 and 2011, respectively. The increase in cash general and administrative expense reflected increased activity post the December 20, 2011 acquisition of interests in the Red Arrow mine. The Company was essentially dormant during the early part of 2011.
Interest Expense
Interest expense for stated interest in accordance with note agreements was $783,782 during the nine months ended September 30, 2012. In addition, we recognized interest expense related to interest expense paid by the issuance of common stock, amortization of deferred financing costs and discounts on notes payable in the amount of $1,522,068 for the nine months ended September 30, 2012. There was no interest expense during the same period of 2011. Interest expense increased as a result of the borrowing under the $25 million lending facility.
Unrealized Gain on Fair Value of Derivative Warrant Instruments
During the nine months ended September 30, 2012, we recognized a gain of $247,140 as a result of the reduction in the fair value of warrant instruments which are classified as liabilities rather than equity as a result of price protection provisions in the warrant agreement. These warrants had not been issued in 2011; therefore, no such gain or loss was recognized during the comparable period of 2011.
Loss on Conversion of Debt to Equity
| 19 |
During the nine months ended September 30, 2012, we recognized a loss of $1,258,100 as a result of issuing 6,480,000 shares of common stock valued at $1,878,100 on the date of issuance in order to extinguish notes payable in the amount of $620,000.
Net Loss
We generated a net loss of $8,018,819 during the nine months ended September 30, 2012 as compared to a loss of $729,493 in the same period of 2011. The increase in the net loss is primarily the result of the loss on conversion of debt to equity, the increase in interest expense and the increase in general and administrative expenses.
For the Three months Ended September 30, 2012 Compared to the Three months Ended September 30, 2011
Revenue
We recognized revenue from gold sales in the amount of $4,980 during the three months ended September 30, 2012. We first recognized revenue from gold sales during the second quarter of 2012.
Direct Operating Costs
Direct Operating Costs were $92,826 for the three months ended September 30, 2012. Direct Operating Costs includes mining and milling salaries and the costs of mining and milling gold.
Indirect Operating Costs
Indirect Operating Costs were $149,844 for the three months ended September 30, 2012. Indirect Operating Costs include our share of the cost of operating the Red Arrow Gold Mine.
Exploration and Development
We incurred exploration and development costs of $49,209 during the three months ended September 30, 2012.
General and Administrative Expense
General and administrative expense increased to $467,973 during the nine months ended September 30, 2012 versus $375,000 during the same period of 2011. The increase in general and administrative expense reflected increased activity post the December 20, 2011 acquisition of interests in the Red Arrow mine. The Company was essentially dormant during the early part of 2011.
Interest Expense
Interest expense for stated interest in accordance with note agreements was $561,788 during the three months ended September 30, 2012. In addition, we recognized interest expense related to interest expense paid by the issuance of common stock, amortization of deferred financing costs and discounts on notes payable in the amount of $292,485 for the three months ended September 30, 2012. There was no interest expense during the same period of 2011. Interest expense increased as a result of the borrowing under the $25 million lending facility.
Unrealized Gain on Fair Value of Derivative Warrant Instruments
During the three months ended September 30, 2012, we recognized a gain of $149,844 as a result of the reduction in the fair value of warrant instruments which are classified as liabilities rather than equity as a result of price protection provisions in the warrant agreement. These warrants had not been issued in 2011; therefore, no such gain or loss was recognized during the comparable period of 2011.
Net Loss
| 20 |
We generated a net loss of $3,282,782 during the three months ended September 30, 2012 as compared to a loss of $375,000 in the same period of 2011. The increase in the net loss is primarily the result of the increase in interest expense and the increase in general and administrative expenses.
Liquidity and Capital Resources
Since the beginning of 2008, we have funded our operations primarily with funds received in the form of short term loans, through the sale of equity securities and with a decreasing amount of revenue received from our discontinued oil and gas operations.
Rock’s sources of capital going forward will primarily be cash from the $25 million lending facility from Maximilian Investors LLC (“Maximilian”); internally generated cash flow from operations and the selective use of equity and/or equity linked securities. Through the period ended September 30, 2012, we had borrowed $8.7 million of the $25 million available. In the coming 18 months, we may require approximately $3.0 million for investment in mining facilities and exploration cost at the Red Arrow Mine. In addition, we may require additional cash to acquire the remaining 51% interest in the Red Arrow Mine.
We expect that cash flows from operating activities will become positive by mid-2013. Our cash flow from operations will depend heavily on the prevailing price of gold and our exploration generated volumes. Future gold price declines would have a material adverse effect on our overall results, and therefore, our liquidity. Falling gold prices could also negatively affect our ability to raise capital on terms favorable to us or at all.
As of September 30, 2012, we had cash on hand in the amount of $10,691. We expect to partially fund our operations for the coming year using cash generated from sales of gold. We expect that this will leave a shortfall, which we plan to fund through additional borrowings under the Maximilian lending facility and potentially sales of common stock.
Item 4. Controls and Procedures.
(a) Evaluation of Disclosure Controls and Procedures.
The Company’s Chief Executive Officer and Chief Financial Officer has evaluated the effectiveness of the Company’s disclosure controls and procedures (as defined in Rules 13a-15(e) and 15d-15(e) under the Exchange Act) as of the fiscal period ended September 30, 2012 covered by this Quarterly Report on Form 10-Q. Based upon such evaluation, the Chief Executive Officer and Chief Financial Officer has concluded that, as of the end of such period, the Company’s disclosure controls and procedures were not effective as required under Rules 13a-15(e) and 15d-15(e) under the Exchange Act.
As of September 30, 2012, management assessed, with the participation of the Chief Executive Officer and Chief Financial Officer, the effectiveness of our internal control over financial reporting based on the criteria set forth in Internal Control – Integrated Framework for effective internal control over financial reporting established in Internal Control—Integrated Framework issued by the Committee of Sponsoring Organizations of the Treadway Commission (“COSO”) and SEC guidance on conducting such assessments. Based on that evaluation, they concluded that, during the period covered by this report, such internal controls and procedures were not effective as more fully described below. Based on management’s assessment over financial reporting, management believes as of September 30, 2012, the Company’s internal control over financial reporting was not effective due to the following deficiencies:
Weakness in Our Control Environment. We did not maintain an effective control environment necessary to promote effective internal control over financial reporting throughout the organization. Because of insufficient resources, we were not able to retain qualified financial and accounting personnel to timely prepare our Company’s accurate and reliable financial statements in accordance with generally accepted accounting principles. Due to this control environment weakness, the Company:
| · | Was unable to effectively maintain its accounting and financial reporting for the years 2011, 2010 and 2009 on a timely and efficient manner, lacking the qualified personnel to prepare and then review financial statements and significantly accounting transactions during these subject periods, and; | |
| · | Was not able to maintain an accounting policy and protocol that permitted timely review and updating of our Company accounting policies and procedures, as well as able to evaluate significant Company transactions during these subject periods. |
| 21 |
Pending remediation of these material weaknesses, there is a reasonable possibility that a material misstatement in our financial statements may not be detected or prevented on a timely basis. We have retained qualified financial and accounting consultants to assist in the preparation of the financial statements contained in this Form 10-Q and other delinquent reports. We anticipate retaining experienced and qualified financial and accounting personnel to supervise our accounting function in the immediate future.
Notwithstanding the above identified deficiencies that constitute our material weakness, based on a number of factors, including the performance of additional procedures performed by management designed to ensure the reliability of our financial reporting, our Chief Executive Officer and Chief Financial Officer believe that the consolidated financial statements included with this periodic report fairly present, in all material respects, our financial position, results of operations, and cash flows as of the dates, and for the periods, presented, in conformity with United States Generally Accepted Accounting Principles.
Changes in Internal Controls over Financial Reporting
Other than as stated above, during the quarter ended September 30, 2012, there have been no changes in the Company’s internal control over financial reporting that have materially affected, or is reasonably likely to materially affect, the Company’s internal control over financial reporting.
Part II. Other Information
Item 1. Legal Proceedings
No director, person nominated to become a director, executive officer, promoter or control person of our company has, during the last ten years: (i) been convicted in or is currently subject to a pending a criminal proceeding (excluding traffic violations and other minor offenses); (ii) been a party to a civil proceeding of a judicial or administrative body of competent jurisdiction and as a result of such proceeding was or is subject to a judgment, decree or final order enjoining future violations of, or prohibiting or mandating activities subject to any federal or state securities or banking or commodities laws including, without limitation, in any way limiting involvement in any business activity, or finding any violation with respect to such law, nor (iii) any bankruptcy petition been filed by or against the business of which such person was an executive officer or a general partner, whether at the time of the bankruptcy or for the two years prior thereto.
Item 2. Unregistered Sales of Equity Securities and Use of Proceeds
During the nine months ended September 30, 2012, the Company sold 552,500 Units in a private placement (the “2012 Second Unit Offering”) and received cash proceeds of $110,500 ($0.20 per Second Unit). Each Second Unit consists of one share of common stock and two warrants (the “Second Private Placement Warrants”) to purchase common stock at $0.50 per share for a term of five years. As a result of the Unit offering, the Company issued 552,500 shares of common stock and 1,105,000 warrants to purchase common stock. These securities were issued pursuant to the exemptions from the registration requirtements of the Securities Act of 1933, as amended (the “Securities Act”), pursuant to Section 4(2) of the Securities Act and Regulation D, promulgated thereunder, respectively, as privately negotiated, isolated, non-recurring transactions not involving any public offer or solicitation. Each purchaser represented that he or she was an accredited investor, that such purchaser’s intention was to acquire the securities for investment only and not with a view toward resale or distribution. We requested our stock transfer agent to affix appropriate legends to the stock certificate issued to each purchaser and the transfer agent affixed the appropriate legends. Each purchaser had a pre-existing relationship with the Company, and was given adequate access to sufficient information about us to make an informed investment decision. None of the securities were sold through an underwriter and accordingly, there were no underwriting discounts or commissions involved.
Item 3. Default Upon Senior Notes
Not applicable.
| 22 |
Item 5. Other Information
None.
Item 6. Exhibits
| Exhibit No. | Description | |
| 3.1 | Articles of Incorporation of the registrant(1) | |
| 3.2 | Bylaws of registrant(1) | |
| 4.1 | 2009 Stock Grant and Option Plan (3) | |
| 4.2 | Independent Report and Analysis of the Red Arrow Mine , dated January, 2012, by Richard A. Eamon and Hazen Research, filed as Exhibit 10.1 to the Company’s Current Report on Form 8-K filed with the U.S. Securities and Exchange Commission on January 9, 2012, and incorporated by reference herein. | |
| 10.1 | Asset Purchase Agreement between Hanover Gold Company, Inc. and Rock Energy Partners L.P(2) | |
| 10.2 | Administrative Services Agreement with 4R Oil and Gas, LLC(2) | |
| 10.3 | Base Working Interest Purchase Agreement with SMP(2) | |
| 10.4 | Option to Purchase Additional Working Interests with SMP(2) | |
| 10.5 | Form of Hanover Stockholder Lock-Up Agreement(2) | |
| 10.6 | Consulting Agreement with Weston Capital Quest Corporation(2) | |
| 10.7 | Consulting Agreement with Source Capital Group(2) | |
| 10.8 | Stock Purchase Agreement (Perm Energy Advisers, Inc) | |
| 10.9 | Registration Rights Agreement (Perm Energy Advisers, Inc) | |
| 10.10 | Voting Agreement (Perm Energy Advisers, Inc) | |
| 10.11 | Warrant Certificate (Perm Energy Advisers, Inc) | |
| 10.12 | Letter of Intent, dated January 31, 2012, by and between Red Arrow Gold Corporation and Registrant, filed as Exhibit 10.1 to the Registrant’s Current Report on Form 8-K filed with the Commission on February 2, 2012, and incorporated by reference herein | |
| 10.13 | Employment Agreement, dated August 15, 2011, by and between Rocky V. Emery and Registrant | |
| 10.14 | Employment Agreement, dated August 15, 2011, by and between Mark G. Harrington and Registrant | |
| 10.15 | Employment Agreement, dated November 15, 2011, by and between Craig Liukko and Registrant | |
| 10.16 | Loan and Security Agreement, dated as of December 14, 2011, by and between HE-MAN LLC, as Borrower, and Maximilian Investors LLC, as Lender, filed as an exhibit to Registrant’s Current Report on Form 8-K filed with the U.S. Securities and Exchange Commission on December 20, 2011, and incorporated by reference herein. | |
| 14.1 | 2008 Code of Ethics for Senior Management | |
| 31.1 | Certification of CEO as Required by Rule 13a-14(a)/15d-14 | |
| 31.2 | Certification of CFO as Required by Rule 13a-14(a)/15d-14 | |
| 32.1 | Certification of CEO as Required by Rule 13a-14(a) and Rule 15d-14(b) (17 CFR 240.15d-14(b)) and Section 1350 of Chapter 63 of Title 18 of the United States Code | |
| 32.2 | Certification of CFO as Required by Rule 13a-14(a) and Rule 15d-14(b) (17 CFR 240.15d-14(b)) and Section 1350 of Chapter 63 of Title 18 of the United States Code | |
| 99.1 | Audit Committee Charter | |
| 99.2 | Compensation Committee Charter | |
| 101 | XBRL Interactive Data Files * |
___________
| (1) | Filed as an exhibit to the Registrant’s registration statement on Form S-1 (Commission File No. 33-38745) and incorporated by reference herein. |
| (2) | Incorporated by reference to the Registrant’s Current Report on Form 8-K filed January 3, 2008 |
| (3) | Filed as an exhibit to the Registrant’s Form S-8 registration statement filed with the U.S. Securities and Exchange Commission on June 9, 2009, and incorporated by reference herein. |
| * | To be submitted by amendment. |
| 23 |
SIGNATURES
In accordance with Section 13 or 15(d) of Exchange Act, the registrant caused this report to be signed on its behalf by the undersigned, on November 21, 2012
| ROCK ENERGY RESOURCES, INC. | ||
| By | /s/ Rocky V. Emery | |
| Rocky V. Emery | ||
| Chief Executive Officer and Director and Chairman of the Board of Directors | ||
| By | /s/ Mark G. Harrington | |
| Mark G. Harrington | ||
| Principal Accounting Officer and Vice Chairman of the Board of Directors | ||
| 24 |