Attached files
| file | filename |
|---|---|
| 8-K - ZALE CORPORATION 8-K - ZALE CORP | a50485177.htm |
| EX-99.1 - EXHIBIT 99.1 - ZALE CORP | a50485177ex99_1.htm |
Exhibit 99.2

Slide: 1 Title: First Quarter Fiscal 2013 Earnings Call November 20, 2012 Other Placeholder: 1
Slide: 2 Title: Forward-Looking Statements and Use of Non-GAAP Financial Measures Body: This presentation contains forward-looking statements, including statements regarding future sales, expected operating performance, expenses, margins, profitability, interest expense, effective tax rate, merchandising and marketing initiatives and industry growth forecasts. Forward-looking statements are not guarantees of future performance and a variety of factors could cause the Company's actual results to differ materially from the results expressed in the forward-looking statements. These factors include, but are not limited to: if the general economy continues to perform poorly, discretionary spending on goods that are, or are perceived to be, “luxuries” may decrease; the concentration of a substantial portion of the Company’s sales in three, relatively brief selling seasons means that the Company’s performance is more susceptible to disruptions; most of the Company’s sales are of products that include diamonds, precious metals and other commodities, and fluctuations in the availability and pricing of commodities could impact the Company’s ability to obtain and produce products at favorable prices; the Company’s sales are dependent upon mall traffic; the Company operates in a highly competitive industry; the financing market remains difficult, and if we are unable to meet the financial commitments in our current financing arrangements it will be difficult to replace or restructure these arrangements; and changes in regulatory requirements may increase the cost or adversely affect the Company’s operations and its ability to provide consumer credit and write credit insurance. For other factors, see the Company's filings with the Securities and Exchange Commission, including its Annual Report on Form 10-K for the fiscal year ended July 31, 2012. The Company disclaims any obligation to update or revise publicly or otherwise any forward-looking statements to reflect subsequent events, new information or future circumstances, except as required by law.This presentation contains certain non-GAAP measures as defined by SEC rules. One of these non-GAAP measures is EBITDA, which is defined as earnings before interest, taxes, depreciation and amortization. A second non-GAAP measure is adjusted EBITDA, which is further adjusted to exclude charges related to store closures. We use these measurements as part of our evaluation of the performance of the Company. In addition, we believe these measures provide useful information to investors. Please refer to the appendix at the back of this presentation for a reconciliation of these non-GAAP measures to the most comparable GAAP financial measures.Other Placeholder: 2
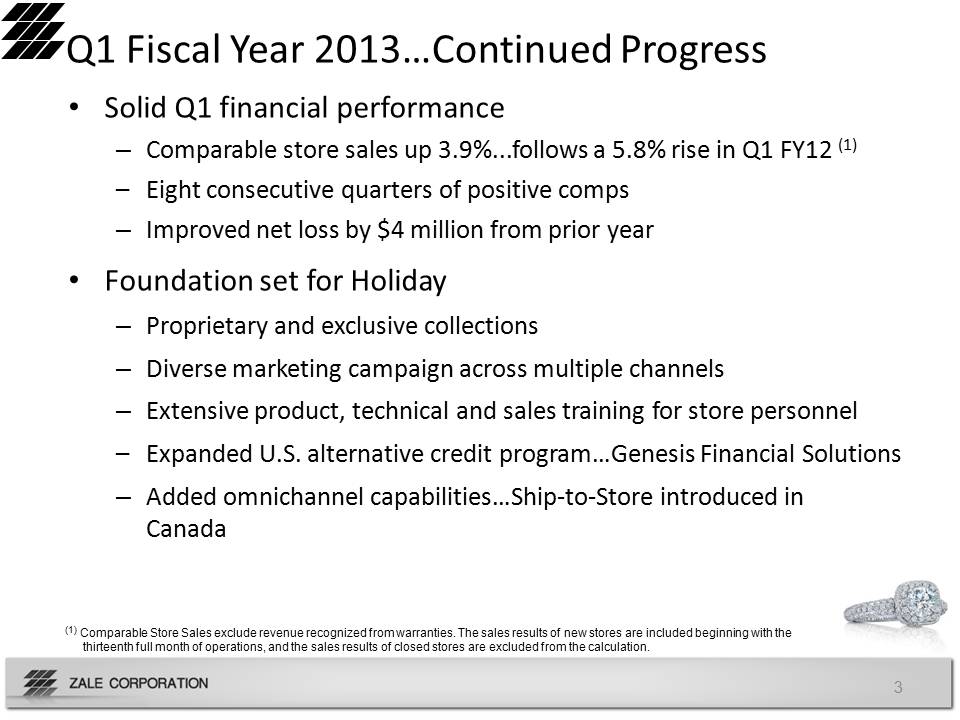
Slide: 3 Title: Q1 Fiscal Year 2013…Continued Progress Body: Solid Q1 financial performanceComparable store sales up 3.9%...follows a 5.8% rise in Q1 FY12 (1)Eight consecutive quarters of positive compsImproved net loss by $4 million from prior yearFoundation set for HolidayProprietary and exclusive collectionsDiverse marketing campaign across multiple channelsExtensive product, technical and sales training for store personnelExpanded U.S. alternative credit program…Genesis Financial SolutionsAdded omnichannel capabilities…Ship-to-Store introduced in CanadaOther Placeholder: 3 (1) Comparable Store Sales exclude revenue recognized from warranties. The sales results of new stores are included beginning with the thirteenth full month of operations, and the sales results of closed stores are excluded from the calculation.
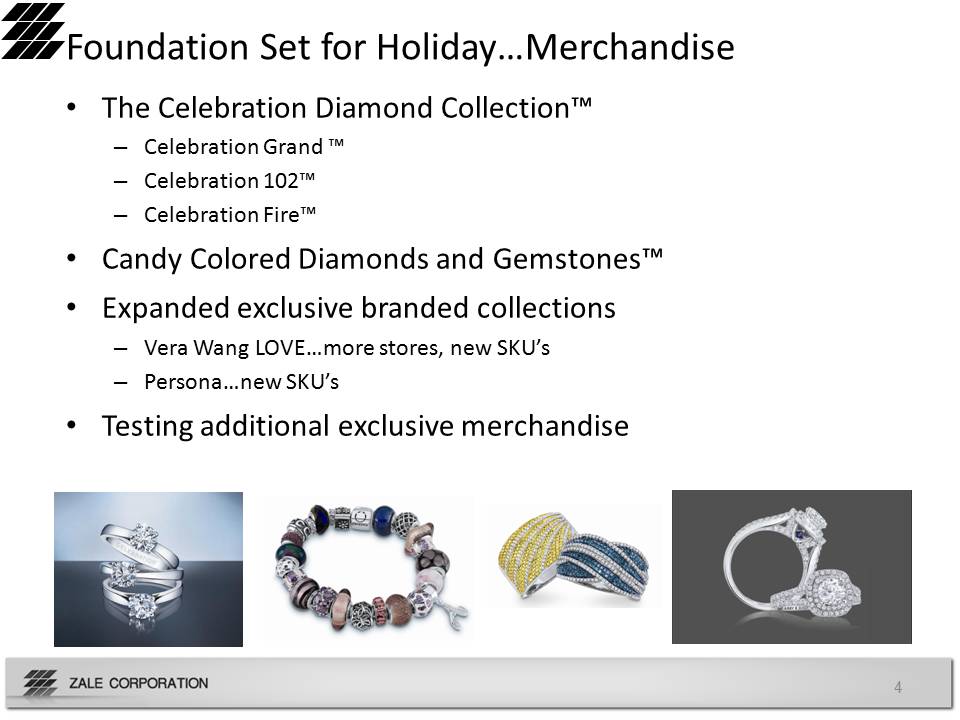
Slide: 4 Title: Foundation Set for Holiday…Merchandise Body: The Celebration Diamond Collection™Celebration Grand ™Celebration 102™Celebration Fire™Candy Colored Diamonds and Gemstones™ Expanded exclusive branded collectionsVera Wang LOVE…more stores, new SKU’sPersona…new SKU’sTesting additional exclusive merchandiseOther Placeholder: 4

Slide: 5 Title: Foundation Set for Holiday…Marketing Body: Other Placeholder: 5 Integrated marketing campaignContinue to build on emotional affinity of The Diamond StoreFocus on exclusive branded collections Increasing use of social media to build brand engagementDedicated Zales branded YouTube channelFacebook, Pinterest and Instagram
Slide: 6 Title: Q1 Fiscal Year 2013 Financial Highlights Body: Revenues increased $6.5 million, or 1.8%, to $357.5 millionComparable store sales up 3.9%Superstorm Sandy negatively impacted comparable store sales by approximately 35 bpsPartially offset by 52 net store closures as compared to prior year periodGross margin at $190 million, or 53.2%, compared to $188 million, or 53.5%, in Q1 FY12SG&A expense of $206 million, or 57.7% of revenues, compared to $200 million, or 56.9% of revenues, in Q1 FY12Operating loss of $23 million, or 6.4% of revenues, compared to operating loss of $22 million, or 6.4% of revenues, in Q1 FY12Interest expense of $6 million compared to $10 million in Q1 FY12Net loss of $28 million, or $0.88 per share, improved from Q1 FY12 loss of $32 million, or $0.99 per shareOther Placeholder: 6
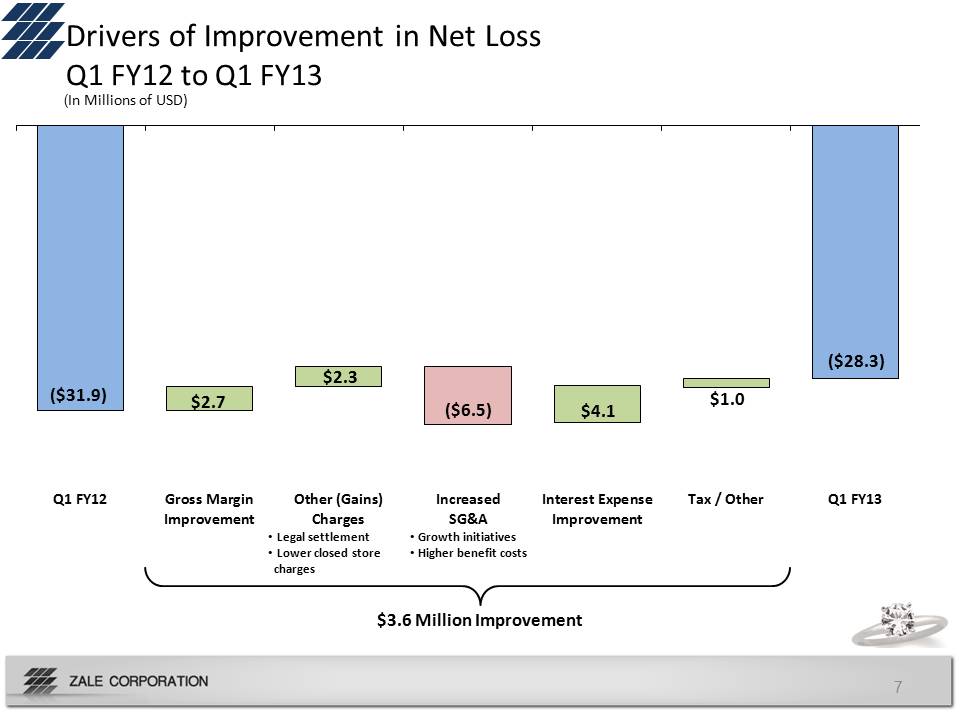
Drivers of Improvement in Net Loss Q1 FY12 to Q1 FY13 $3.6 Million Improvement (In Millions of USD) Q1 FY12 Gross Margin Improvement Other (Gains) Charges Increased SG&A Interest Expense Improvement Tax / Other Q1 FY13 ($31.9) ($28.3) $2.3 $2.7 $1.0 $4.1 ($6.5) • Legal settlement • Lower closed store charges • Growth initiatives • Higher benefit costs
Slide: 8 Title: Q1 Fiscal Year 2013 Comparable Store Sales Detail Body: Total Company up 3.9%, following a 5.8% rise in Q1 FY12Up 3.7% at constant exchange ratesU.S. Fine Jewelry brands up 3.9%, following a 7.0% rise in Q1 FY12Canadian Fine Jewelry brands up 5.5%, following a 7.8% rise in Q1 FY12Up 4.0% at constant exchange ratesPiercing Pagoda up 2.0%, following a 1.6% decline in Q1 FY12Other Placeholder: 8
Slide: 9 Title: Q1 Fiscal Year 2013 Balance Sheet and Liquidity Body: Cash and cash equivalents of $15 million compared to $30 million at October 31, 2011Inventory stood at $908 million compared to $857 million at October 31, 2011Current net revolver availability at $213 million Fixed charge coverage ratio at 1.57, above key threshold of 1.0Other Placeholder: 9
Slide: 10 Title: Superstorm Sandy Impact Body: Q1 revenue negatively impacted by approximately $1 million and comparable store sales negatively impacted by approximately 35 basis pointsNo major damage to any of our storesSales in Northeast Region were soft in the first half of November…trend improving Other Placeholder: 10
Slide: 11 Title: Appendix Other Placeholder: 11
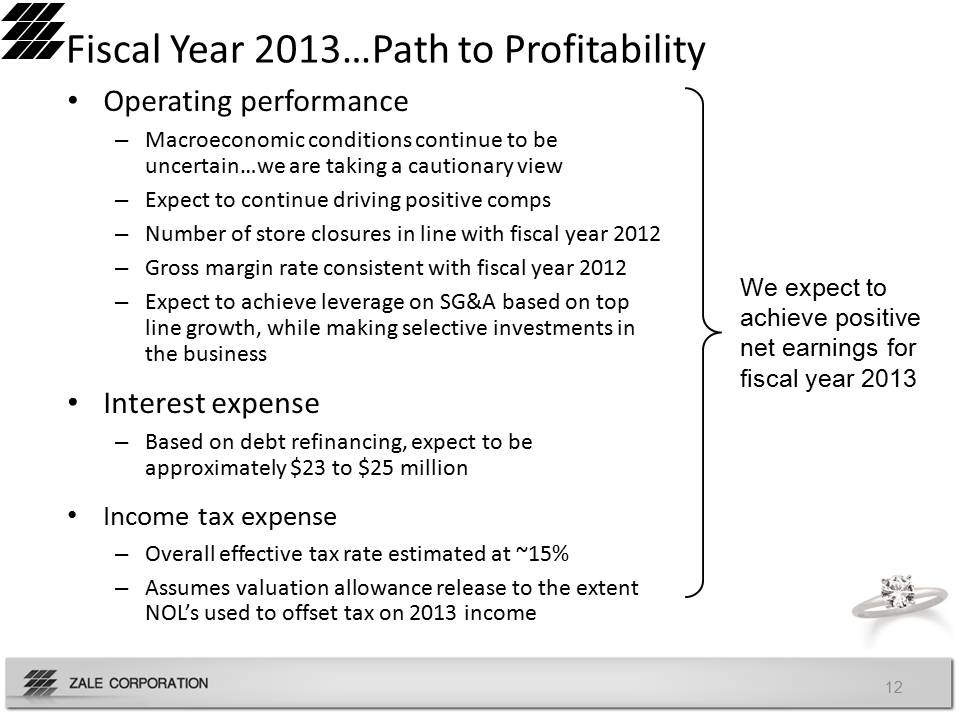
Slide: 12 Title: Fiscal Year 2013…Path to Profitability Body: Operating performanceMacroeconomic conditions continue to be uncertain…we are taking a cautionary viewExpect to continue driving positive compsNumber of store closures in line with fiscal year 2012Gross margin rate consistent with fiscal year 2012Expect to achieve leverage on SG&A based on top line growth, while making selective investments in the businessInterest expenseBased on debt refinancing, expect to be approximately $23 to $25 millionIncome tax expenseOverall effective tax rate estimated at ~15% Assumes valuation allowance release to the extent NOL’s used to offset tax on 2013 incomeOther Placeholder: 12 We expect to achieve positive net earnings for fiscal year 2013
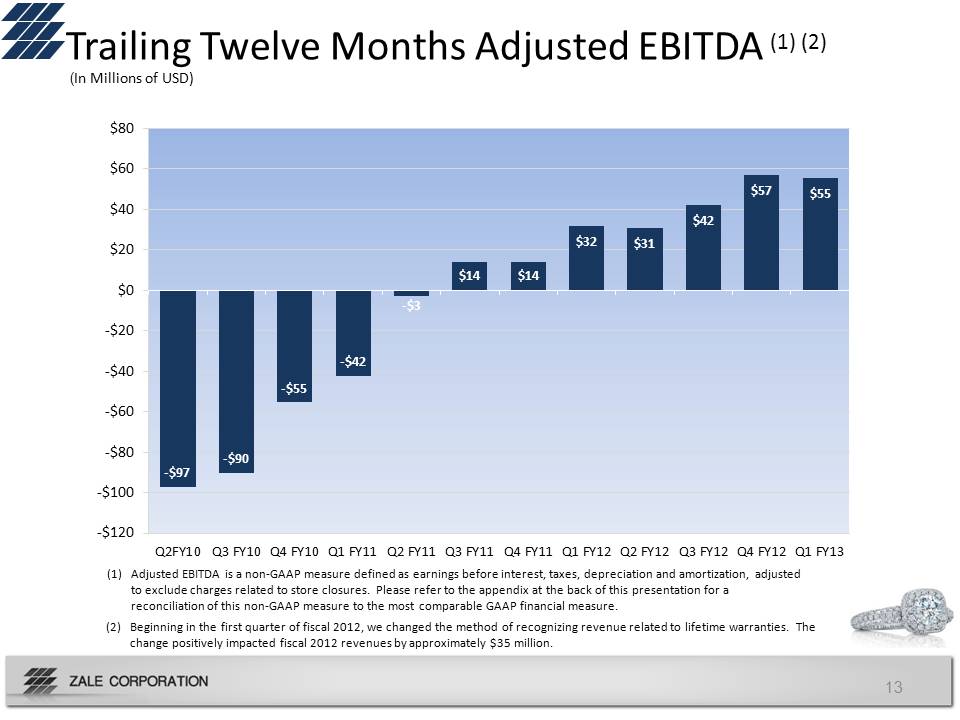
‐$97 ‐$90 ‐$55 ‐$42 ‐$3 $14 $14 $32 $31 $42 $57 $55 ‐$120 ‐$100 ‐$80 ‐$60 ‐$40 ‐$20 $0 $20 $40 $60 $80 Q2FY10 Q3 FY10 Q4 FY10 Q1 FY11 Q2 FY11 Q3 FY11 Q4 FY11 Q1 FY12 Q2 FY12 Q3 FY12 Q4 FY12 Q1 FY13 Trailing Twelve Months Adjusted EBITDA (1) (2) ($ in Millions) (1) Adjusted EBITDA is a non‐GAAP measure defined as earnings before interest, taxes, depreciation and amortization, adjusted to exclude charges related to store closures. Please refer to the appendix at the back of this presentation for a reconciliation of this non‐GAAP measure to the most comparable GAAP financial measure. 13 (2) Beginning in the first quarter of fiscal 2012, we changed the method of recognizing revenue related to lifetime warranties. The change positively impacted fiscal 2012 revenues by approximately $35 million. (In Millions of USD)
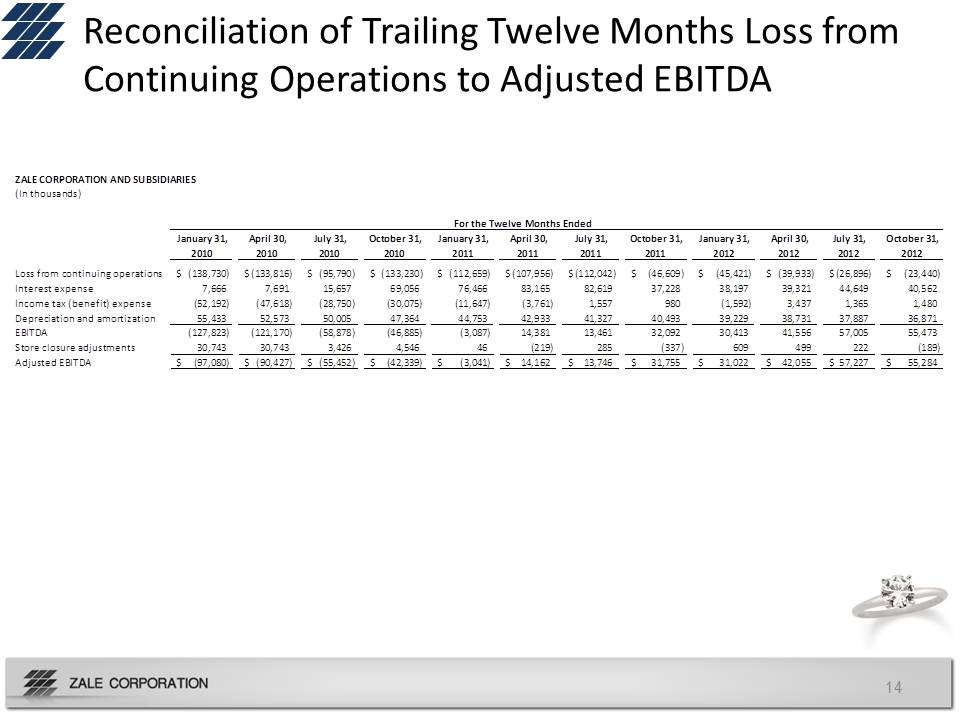
Reconciliation of Trailing Twelve Months Loss from Continuing Operations to Adjusted EBITDA ($ in Millions) 14 ZALE CORPORATION AND SUBSIDIARIES (In thousands) January 31, 2010 April 30, 2010 July 31, 2010 October 31, 2010 January 31, 2011 April 30, 2011 July 31, 2011 October 31, 2011 January 31, 2012 April 30, 2012 July 31, 2012 October 31, 2012 Loss from continuing operations (138,730) $ (133,816) $ (95,790) $ (133,230) $ (112,659) $ (107,956) $ (112,042) $ (46,609) $ (45,421) $ (39,933) $ (26,896) $ (23,440) $ Interest expense 7,666 7,691 15,657 69,056 76,466 83,165 82,619 37,228 38,197 39,321 44,649 40,562 Income tax (benefit) expense (52,192) (47,618) (28,750) (30,075) (11,647) (3,761) 1,557 980 (1,592) 3,437 1,365 1,480 Depreciation and amortization 55,433 52,573 50,005 47,364 44,753 42,933 41,327 40,493 39,229 38,731 37,887 36,871 EBITDA (127,823) (121,170) (58,878) (46,885) (3,087) 14,381 13,461 32,092 30,413 41,556 57,005 55,473 Store closure adjustments 30,743 30,743 3,426 4,546 46 (219) 285 (337) 609 499 222 (189) Adjusted EBITDA (97,080) $ (90,427) $ (55,452) $ (42,339) $ (3,041) $ 14,162 $ 13,746 $ 31,755 $ 31,022 $ 42,055 $ 57,227 $ 55,284 $ For the Twelve Months Ended
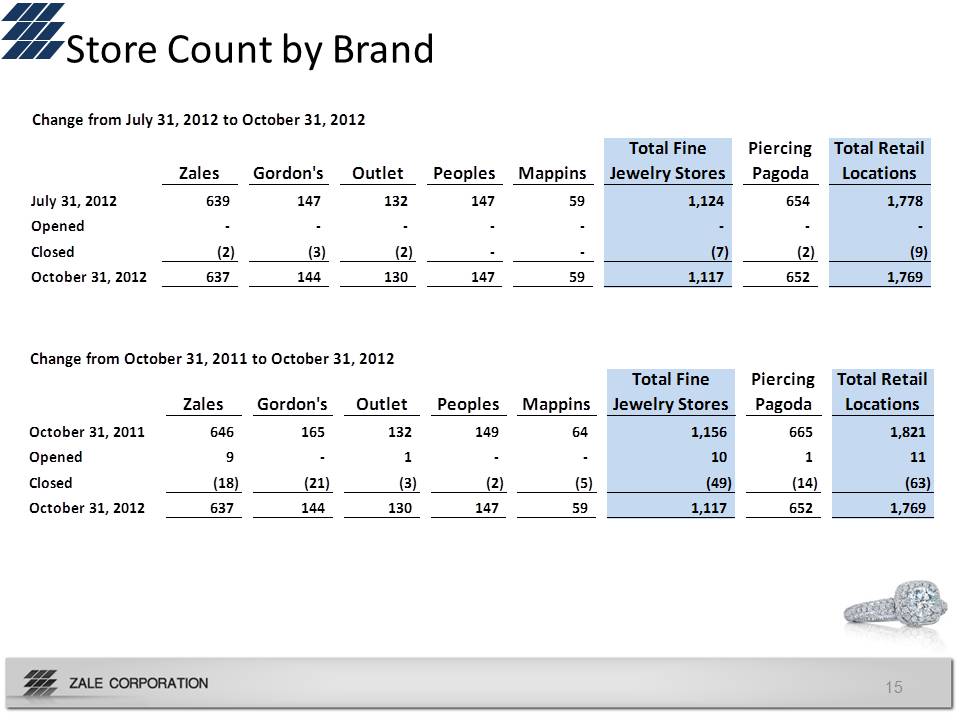
Store Count by Brand Change from July 31, 2012 to October 31, 2012 Zales Gordon's Outlet Peoples Mappins Total Fine Jewelry Stores Piercing Pagoda Total Retail Locations July 31, 2012 639 147 132 147 59 1,124 654 1,778 Opened ‐ ‐ ‐ ‐ ‐ ‐ ‐ ‐ Closed (2) (3) (2) ‐ ‐ (7) (2) (9) October 31, 2012 637 144 130 147 59 1,117 652 1,769 Change from October 31, 2011 to October 31, 2012 Zales Gordon's Outlet Peoples Mappins Total Fine Jewelry Stores Piercing Pagoda Total Retail Locations October 31, 2011 646 165 132 149 64 1,156 665 1,821 Opened 9 ‐ 1 ‐ ‐ 10 1 11 Closed (18) (21) (3) (2) (5) (49) (14) (63) October 31, 2012 637 144 130 147 59 1,117 652 1,769