Attached files
| file | filename |
|---|---|
| 8-K - 8-K - FIRSTCASH, INC | fcfs111420128-k.htm |

First Cash Financial Services Investor Presentation November 14, 2012

Safe Harbor Statement This presentation contains “forward-looking statements,” as defined by the Private Securities Litigation Reform Act of 1995, that can be identified by words such as “believes,” “expects,” “projects,” and similar expressions and involve numerous risks and uncertainties. The Company’s actual results could differ materially from those anticipated in such forward-looking statements as a result of certain factors, including those set forth in the Company’s filings with the Securities and Exchange Commission. 2
2012 Recap Growth in Spite of Headwinds 3
2012 Recap Operating Highlights Despite industry/macro headwinds… Declining scrap gold margins & volumes 10% decline in the value of the Mexican Peso Increased payday regulation and competition First Cash continues to grow revenue & earnings Current 2012 guidance range represents year-over-year EPS growth of 20% - 23% Implied fourth quarter growth of 29% or more Strength from… Pawn lending - Mexico & US Improved retail margins & yields, especially in Mexico Store additions – US & Mexico 4
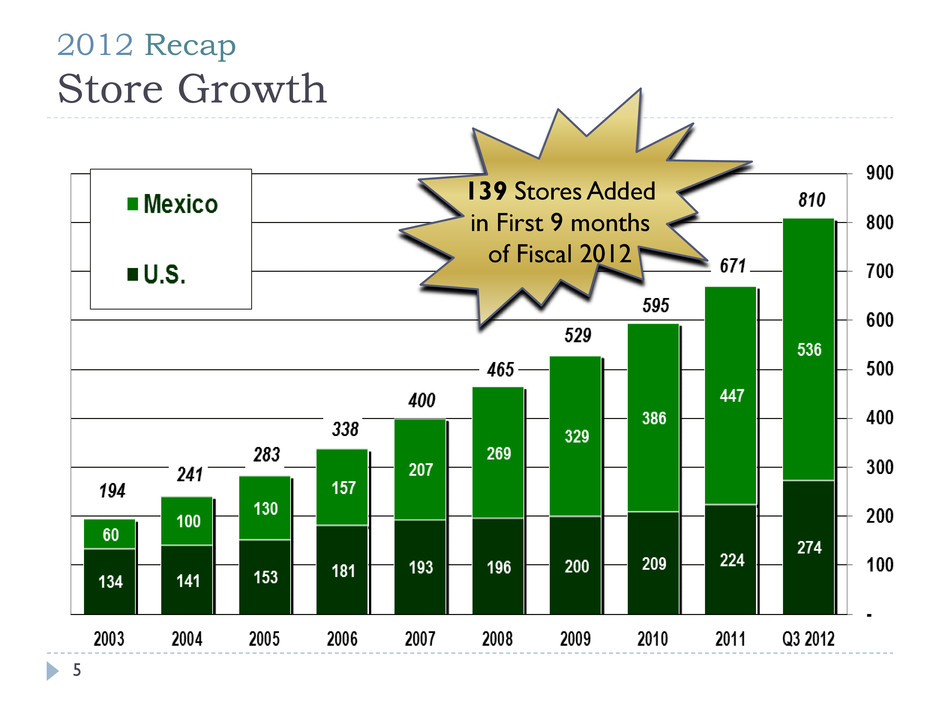
2012 Recap Store Growth 139 Stores Added in First 9 months of Fiscal 2012 5

2012 Recap Revenue Growth Millions 6

2012 Recap EBITDA Growth Millions 7

2012 Recap Pawn Receivable Growth 7% 3% 23% 22% 36% 19% 16% 12% 17% 34% 0% 5% 10% 15% 20% 25% 30% 35% 40% Q3 2011 Q4 2011 Q1 2012 Q2 2012 Q3 2012 Mexico U.S. Q3 2012 Same Store Receivable Growth: Mexico: 17% U.S. 4% 8
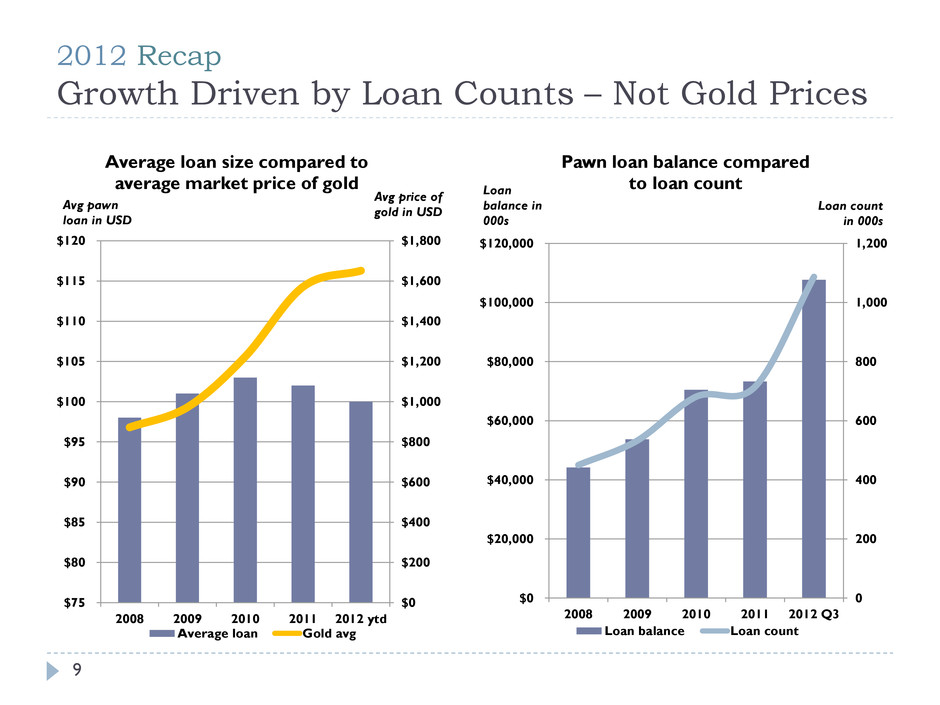
2012 Recap Growth Driven by Loan Counts – Not Gold Prices $0 $200 $400 $600 $800 $1,000 $1,200 $1,400 $1,600 $1,800 $75 $80 $85 $90 $95 $100 $105 $110 $115 $120 2008 2009 2010 2011 2012 ytd Avg price of gold in USD Avg pawn loan in USD Average loan size compared to average market price of gold Average loan Gold avg 0 200 400 600 800 1,000 1,200 $0 $20,000 $40,000 $60,000 $80,000 $100,000 $120,000 2008 2009 2010 2011 2012 Q3 Loan count in 000s Loan balance in 000s Pawn loan balance compared to loan count Loan balance Loan count 9

Market & Competitive Analysis 10

Market & Competitive Analysis Market Differentiation First Cash continues to differentiate itself from other Pawn & Payday Lending peers Growth focused exclusively on core pawn business Limited regulatory exposure to payday lending Less gold exposure than other pawn peers Best store-front growth engine with significant first mover and scale advantages in Mexico 11

Market & Competitive Analysis Gold Exposure Mexico United States Consolidated 12
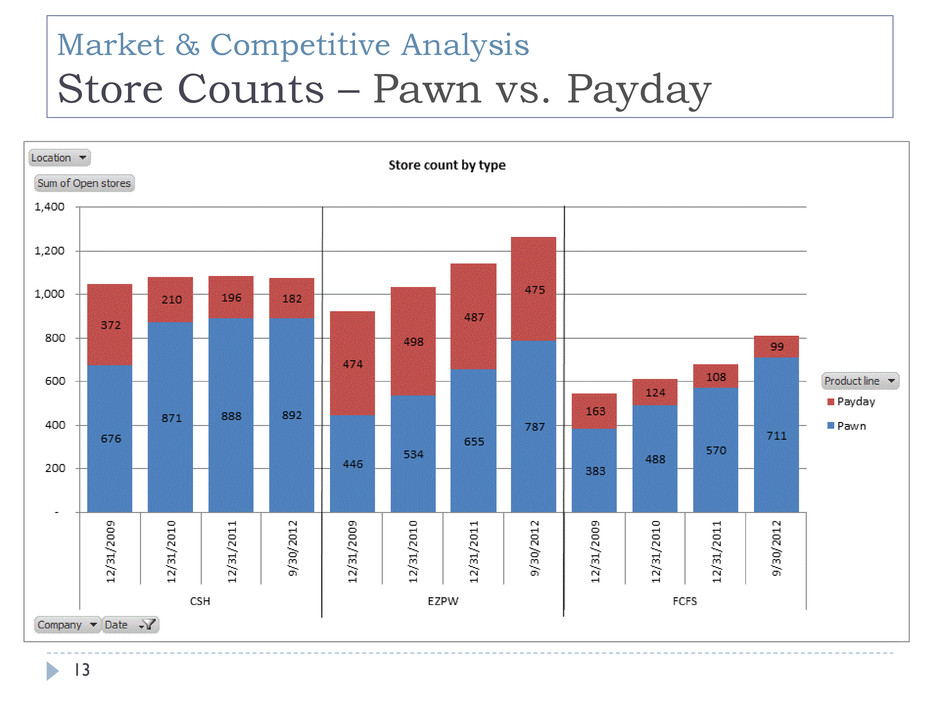
Market & Competitive Analysis Store Counts – Pawn vs. Payday 13

Market & Competitive Analysis Store Counts – By Country 14
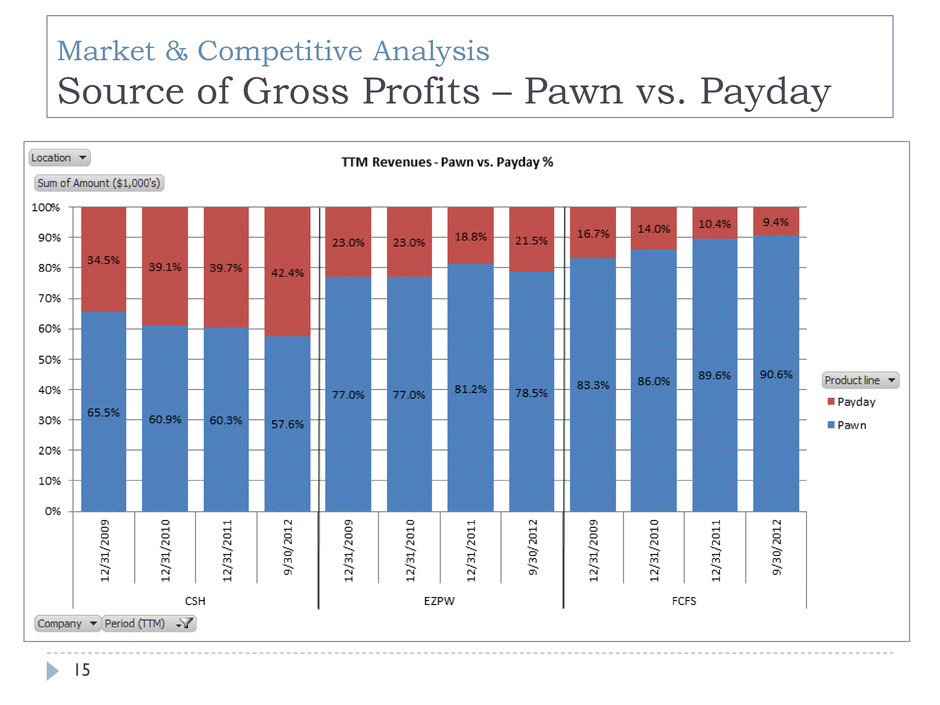
Market & Competitive Analysis Source of Gross Profits – Pawn vs. Payday 15
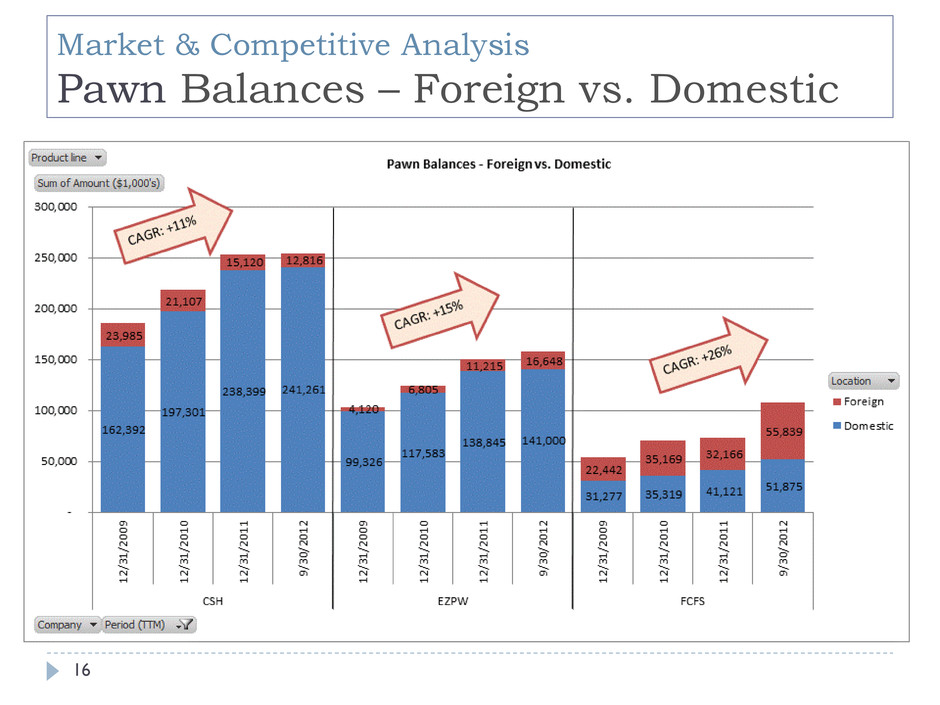
Market & Competitive Analysis Pawn Balances – Foreign vs. Domestic 16

U.S. Pawn Growth 17
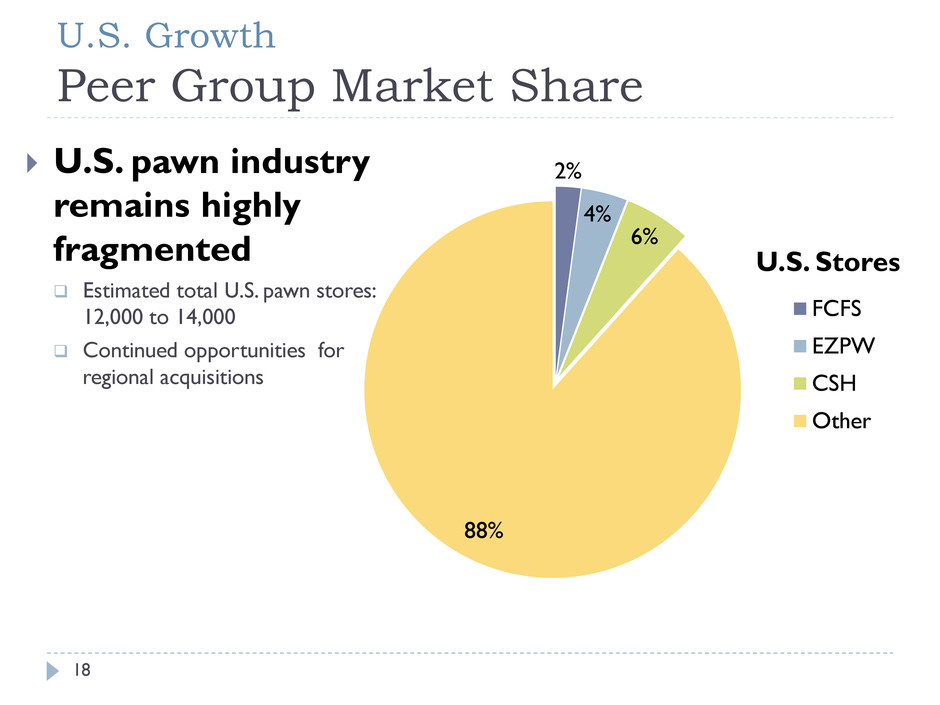
U.S. Growth Peer Group Market Share U.S. pawn industry remains highly fragmented Estimated total U.S. pawn stores: 12,000 to 14,000 Continued opportunities for regional acquisitions 2% 4% 6% 88% U.S. Stores FCFS EZPW CSH Other 18
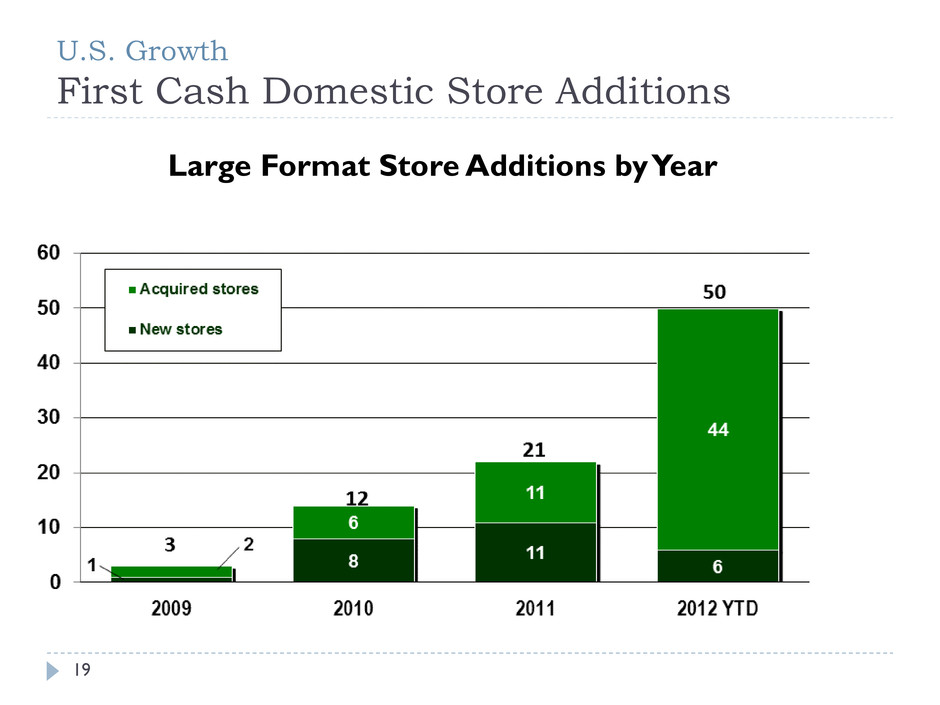
U.S. Growth First Cash Domestic Store Additions Large Format Store Additions by Year 19
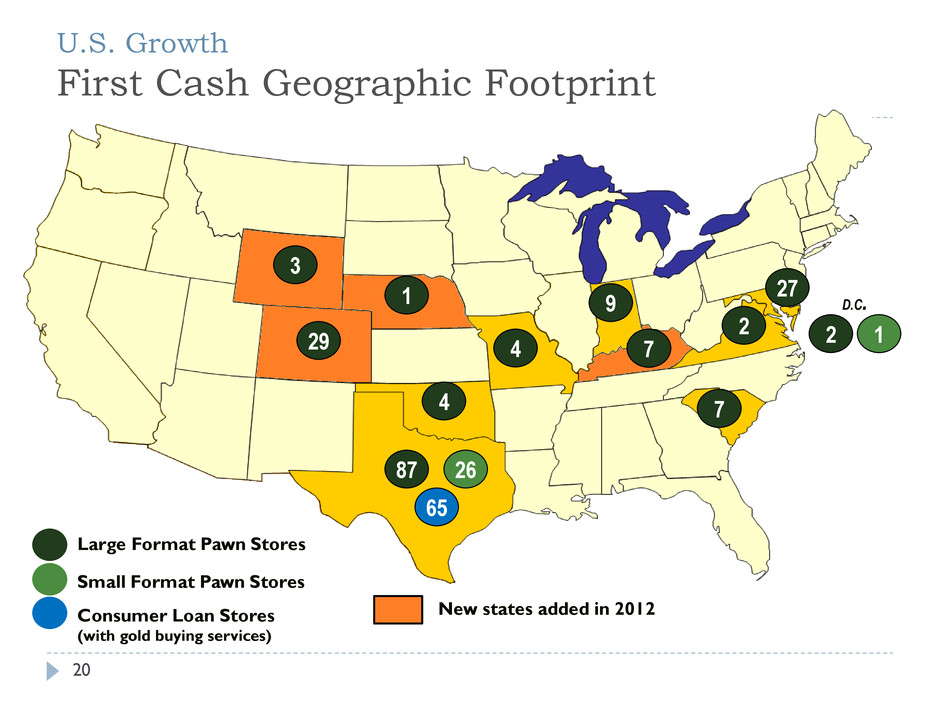
U.S. Growth First Cash Geographic Footprint Large Format Pawn Stores Consumer Loan Stores (with gold buying services) Small Format Pawn Stores 1 65 87 3 4 7 2 D.C. 1 27 9 26 29 7 4 2 New states added in 2012 20
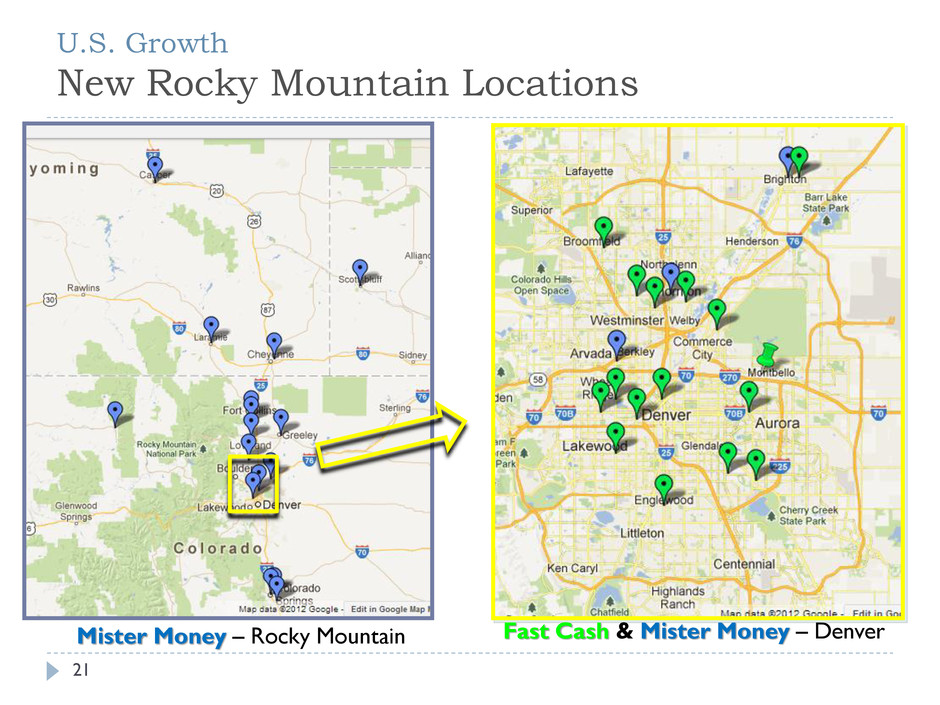
U.S. Growth New Rocky Mountain Locations Mister Money – Rocky Mountain Fast Cash & Mister Money – Denver 21
Mexico Growth 22

Mexico Growth Mexican Economy Continues to Grow Increased competitiveness enables Mexico to attract foreign investment, especially compared to China Lower infrastructure development costs Competitive skilled-labor costs Strategic geographic location Recent election results should keep political environment stable Independent central bank intends to keep peso strong Labor reforms could be incremental benefit Resulting job creation & 70% under-banked population combine for continued growth of the pawn industry in Mexico 23
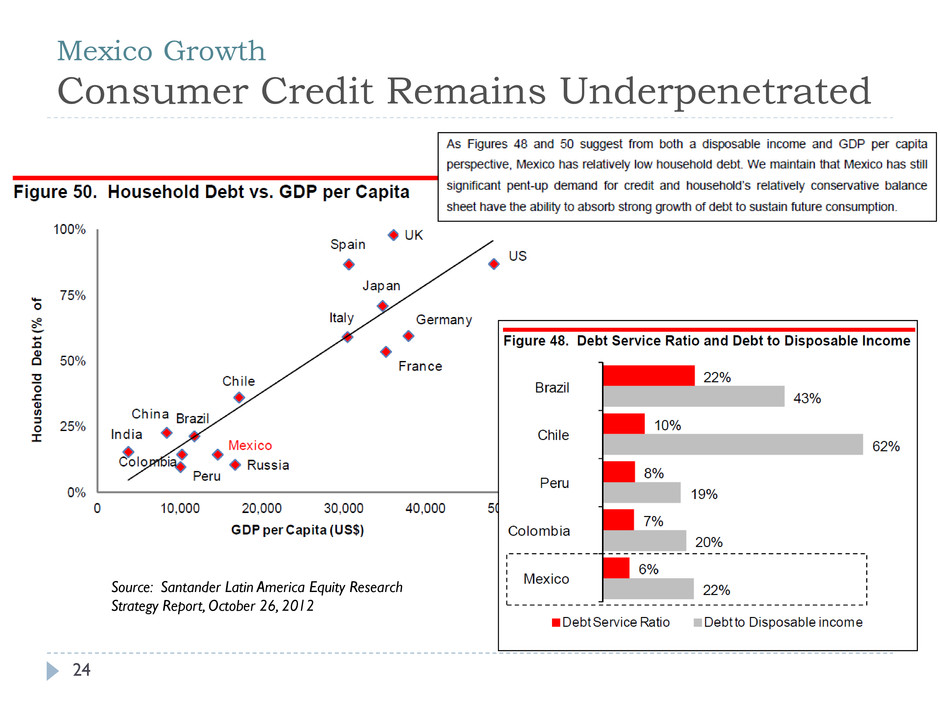
Mexico Growth Consumer Credit Remains Underpenetrated Source: Santander Latin America Equity Research Strategy Report, October 26, 2012 24

Mexico Growth Pawn Industry in Mexico 4,296 979 639 All Stores Approx. 6,000 Jewelry Only Full Service Not for Profit 536 236 47 200 Full Service Stores Approx. 1,000 First Cash EZPW Cash America Other 25
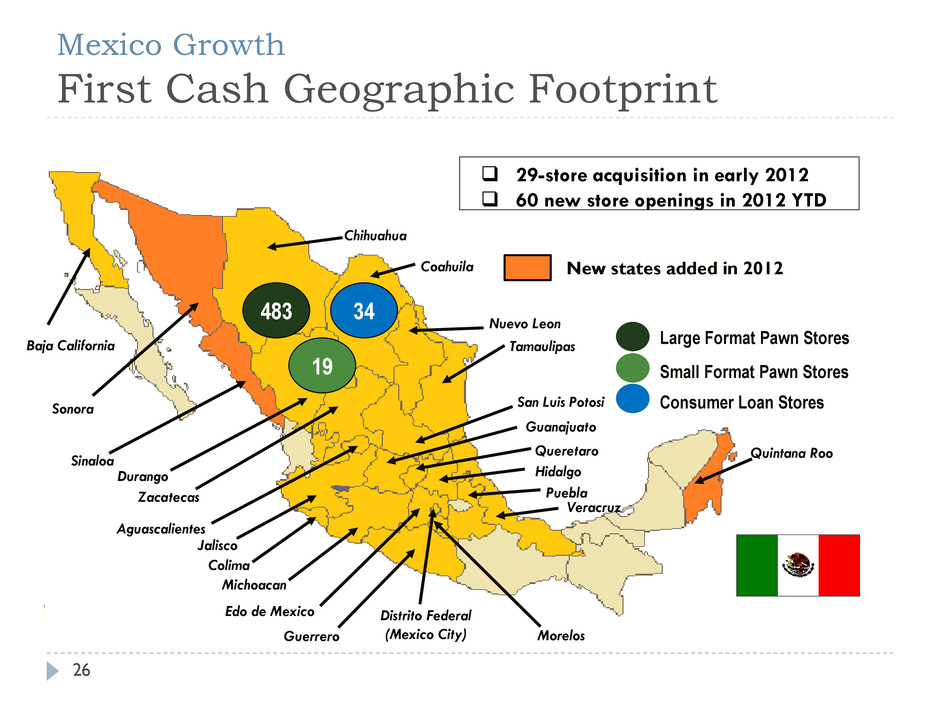
Mexico Growth First Cash Geographic Footprint Chihuahua Queretaro Aguascalientes Puebla Guanajuato Coahuila Tamaulipas Nuevo Leon Sonora Durango Jalisco San Luis Potosi Morelos Guerrero Michoacan Edo de Mexico Hidalgo Distrito Federal (Mexico City) Veracruz Zacatecas Colima Sinaloa 19 483 34 29-store acquisition in early 2012 60 new store openings in 2012 YTD Consumer Loan Stores Small Format Pawn Stores Quintana Roo New states added in 2012 Large Format Pawn Stores Baja California 26
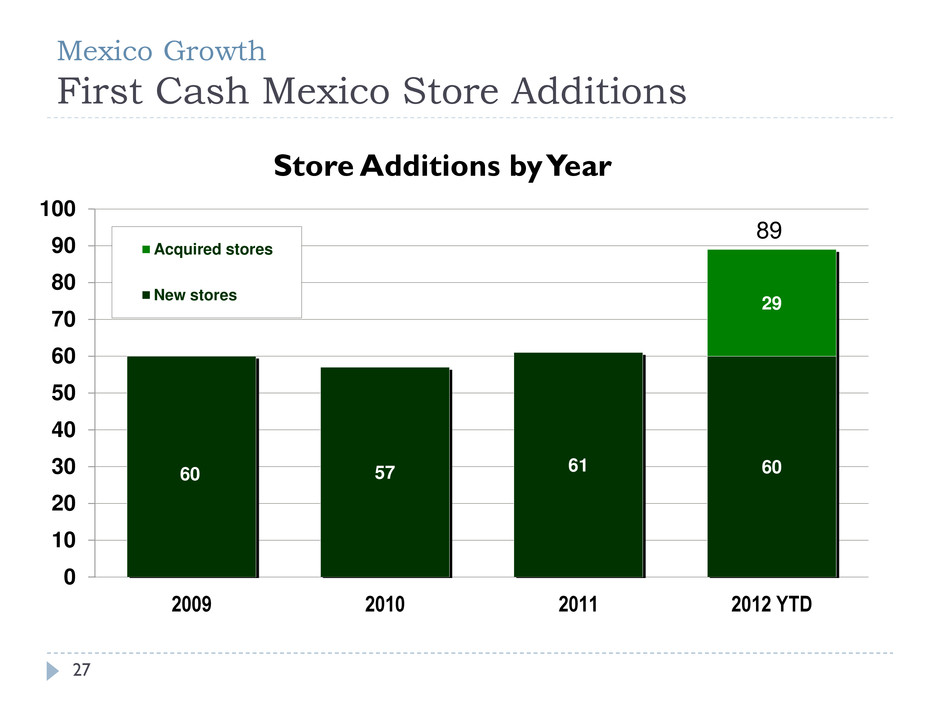
Mexico Growth First Cash Mexico Store Additions Store Additions by Year 60 57 61 60 29 0 10 20 30 40 50 60 70 80 90 100 2009 2010 2011 2012 YTD Acquired stores New stores 89 27

LatAm Investment Opportunity 28
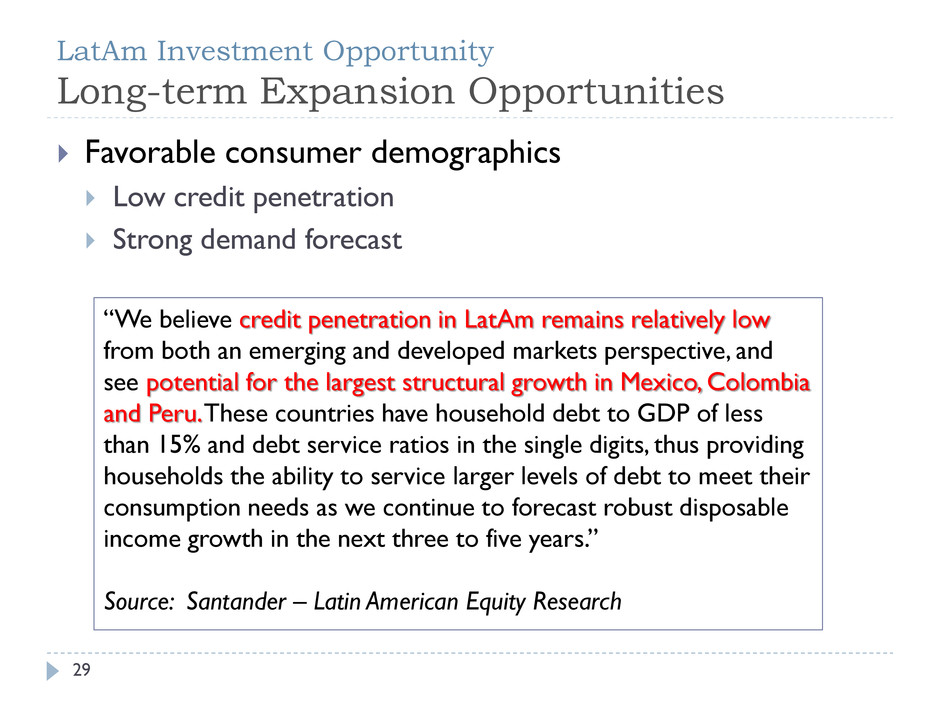
LatAm Investment Opportunity Long-term Expansion Opportunities Favorable consumer demographics Low credit penetration Strong demand forecast “We believe credit penetration in LatAm remains relatively low from both an emerging and developed markets perspective, and see potential for the largest structural growth in Mexico, Colombia and Peru. These countries have household debt to GDP of less than 15% and debt service ratios in the single digits, thus providing households the ability to service larger levels of debt to meet their consumption needs as we continue to forecast robust disposable income growth in the next three to five years.” Source: Santander – Latin American Equity Research 29
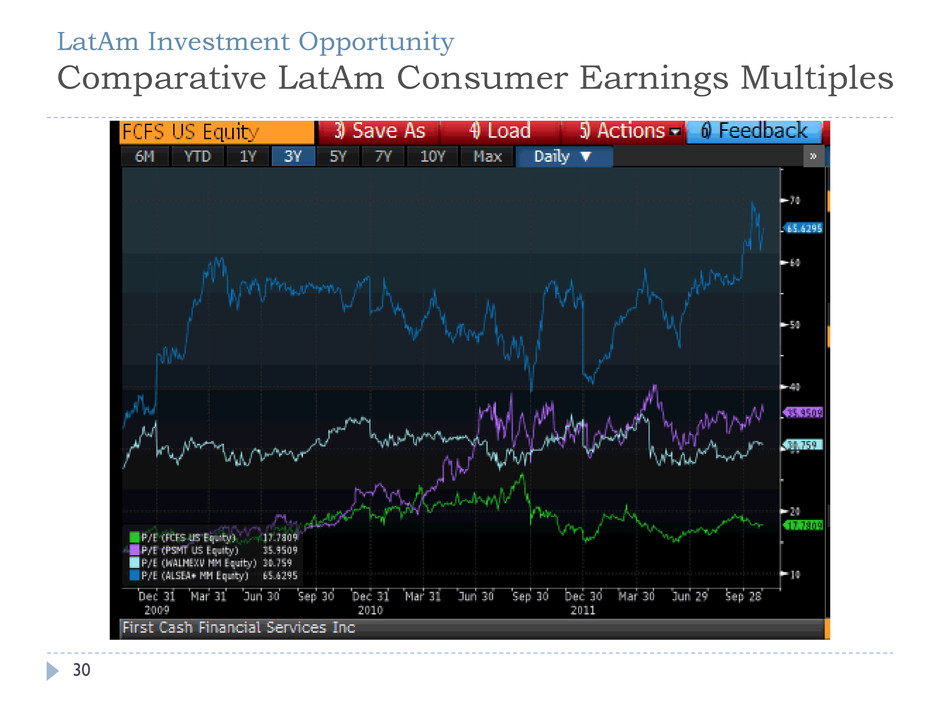
LatAm Investment Opportunity Comparative LatAm Consumer Earnings Multiples 30

LatAm Investment Opportunity Expanding International Investor Base Q2 2010 Shareholder Base U.S. International Q2 2012 Shareholder Base U.S. International • Emerging Market and International funds now represent ~10% of shareholder base – up 300% from Q2 2010 • Notable U.S. based funds with incremental emerging markets interest in FCFS include JP Morgan, Wasatch Advisors and GMO • Significant interest from global investors based in London 31
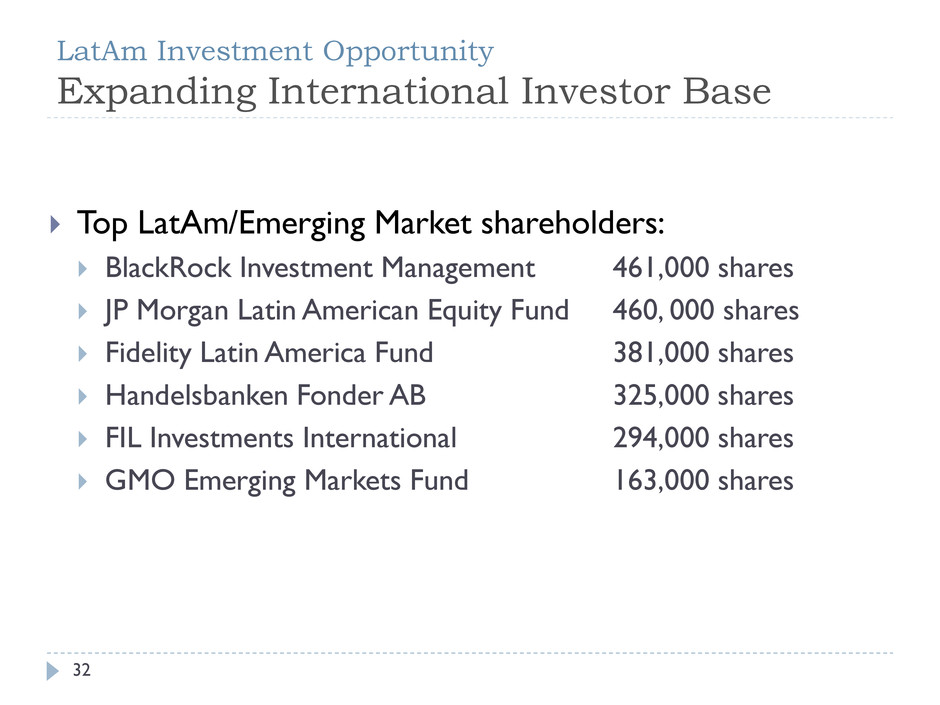
LatAm Investment Opportunity Expanding International Investor Base Top LatAm/Emerging Market shareholders: BlackRock Investment Management 461,000 shares JP Morgan Latin American Equity Fund 460, 000 shares Fidelity Latin America Fund 381,000 shares Handelsbanken Fonder AB 325,000 shares FIL Investments International 294,000 shares GMO Emerging Markets Fund 163,000 shares 32

Looking Ahead Growth Potential Supports Valuation 33
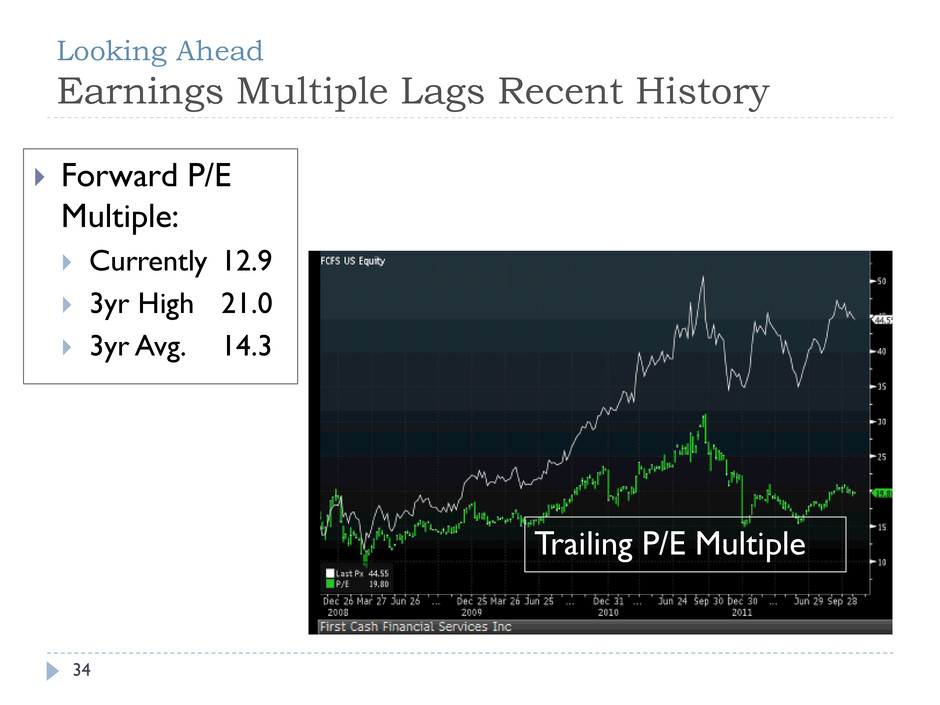
Looking Ahead Earnings Multiple Lags Recent History Forward P/E Multiple: Currently 12.9 3yr High 21.0 3yr Avg. 14.3 Trailing P/E Multiple 34
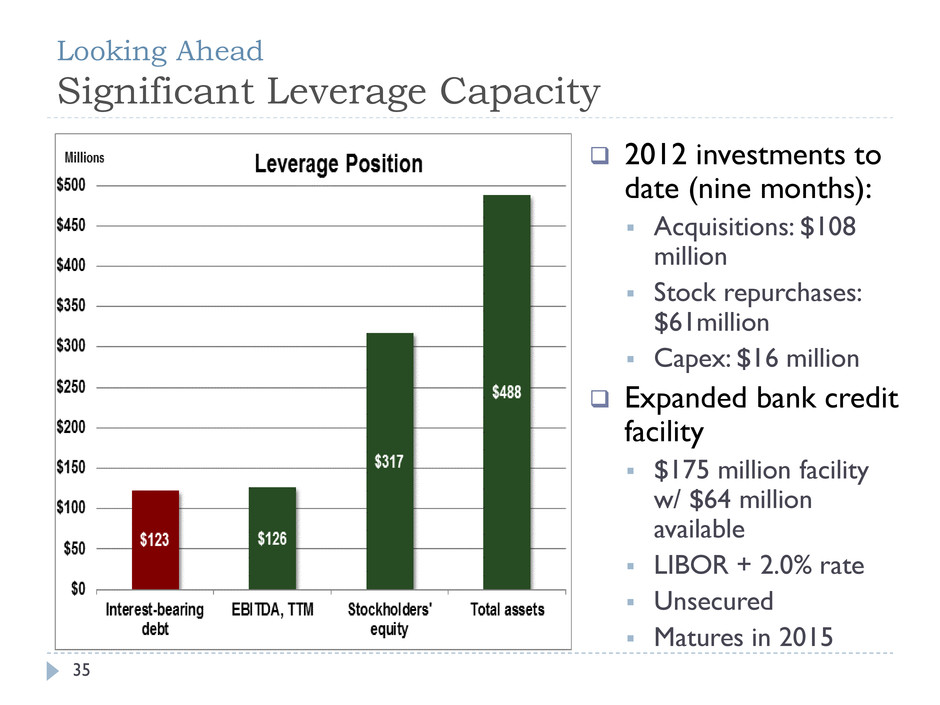
Looking Ahead Significant Leverage Capacity 2012 investments to date (nine months): Acquisitions: $108 million Stock repurchases: $61million Capex: $16 million Expanded bank credit facility $175 million facility w/ $64 million available LIBOR + 2.0% rate Unsecured Matures in 2015 35
Looking Ahead Positioned for Continued Growth Strong balance sheet supports growth and value accretion for shareholders Pawn focused, limited payday regulatory exposure Significant store-based platform supports long-term earnings growth Mexico remains the primary growth driver in the near term Recent U.S. acquisitions add earnings, scale and new markets for additional de novo growth Future expansion opportunities into additional markets in Latin America 36
