Attached files
| file | filename |
|---|---|
| 8-K - 8-K - MAINSOURCE FINANCIAL GROUP | a12-27279_18k.htm |
| EX-99.2 - EX-99.2 - MAINSOURCE FINANCIAL GROUP | a12-27279_1ex99d2.htm |
Exhibit 99.1
|
|
|

|
|
Disclosure Regarding Forward Looking Statements This presentation may include forward-looking statements regarding, among other things, MainSource’s business strategy, financial position and prospects, dividend policy, business results, strategic initiatives, credit quality including reserve levels, capital expenditures, and various other matters. These statements can be identified by the use of forward-looking terminology such as “believes,” “estimates,” “expects,” “intends,” “may,” “will,” “should,” “could” or “anticipates”, or the negative or other variation of these similar words, or by discussions of strategy or risks and uncertainties. These statements are based on current expectations of future events. Actual results could differ materially from those indicated by these statements because the realization of those results is subject to many risks and uncertainties, and because the assumptions underlying these statements could prove inaccurate. Factors that could cause actual results to differ materially from such forward-looking statements include, without limitation, general economic conditions, legislative and regulatory initiatives, changes in the quality of MainSource’s loan portfolios, and other risks set forth in MainSource’s Annual Report on Form 10-K for the fiscal year ending December 31, 2011, on file with the SEC. MainSource does not undertake to update any forward looking statements as a result of new information or future events or developments. |
|
|
Indiana-based, community-focused financial services company Operates 77 branch locations Key statistics: $2.8 billion in assets $250 million market capitalization 106% price / tangible book value 8% Insider ownership 40% Institutional ownership Four primary business lines: Commercial Banking – Businesses with annual revenues < $100M Consumer Banking – Branches, Alternative Channels and Small Business Mortgage Banking Wealth Management – Trust and brokerage Franchise Overview Note: Pricing statistics as of 11/2/12. |
|
|
Historical Highlights 1905 – Original Bank Founded, Union Trust 1983 – Holding Company formed, Indiana United Bancorp 1991 – Begins trading on NASDAQ 1998 – Merged with PTC Bancorp 1998-2009 Acquired 31 branches, acquired 7 whole banks entering IL/OH/KY 2002 – Changed name to MainSource 2005 – Secondary offering, 1,739,140 at $17.50 2008 – Archie Brown named CEO 2009 – Received TARP 2009 – Goodwill Impairment Charges 2011 – Cost Cutting Initiative 2012–TARP Auction |
|
|
Name Title Banking Experience Years with MSFG Archie Brown Chairman & CEO 28 4 Jamie Anderson EVP - Chief Financial Officer 12 12 Daryl Tressler EVP - Chief Banking Officer 38 38 Bill Goodwin EVP - Chief Credit Officer 18 3 Chris Harrison SVP – Retail Banking 22 6 David Dippold SVP - Commercial Banking 26 5 Greg Meyers SVP – Mortgage Banking 33 2 Dan Anderson SVP - Wealth Management 22 18 High Quality People |
|
|
Local leadership and involvement Drive growth in core checking accounts and checking related services Target mass market consumers and “owner-managed” businesses in our geographical footprint Target C&I, Agricultural related, Consumer, Owner-occupied CRE and select areas of income producing CRE (i.e. stabilized multi-family) Expand core services to existing households Increase market share in existing and adjacent footprints Focus on execution Core Strategy |
|
|
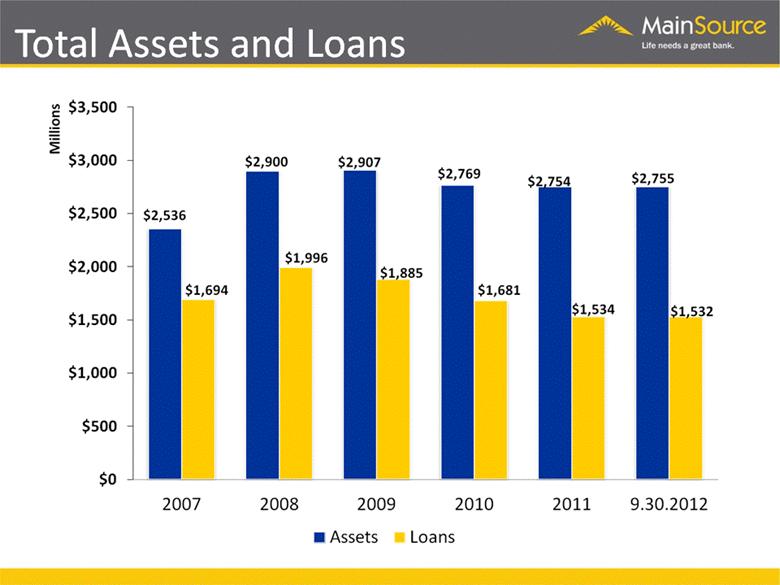
Total Assets and Loans |
|
|
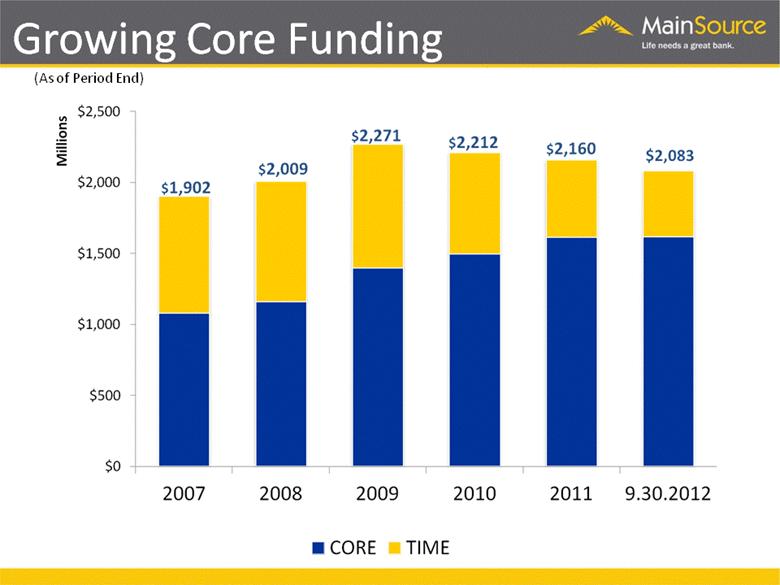
Growing Core Funding (As of Period End) |
|
|
Investment Portfolio (As of 9.30.12) (Dollars in Millions) Value % of Total MBS’s (Agency) $236 26% Municipal $324 36% CMO’s (Agency) $333 37% Other $9 1% TOTAL $902 100% As of September 30, 2012 Net unrealized gain of $43 million or 4.8% of Book Value Average duration was 4.0 years |
|
|
Loan Portfolio Total Loans $1,532 September 30, 2012 ($ in Millions) CRE: Retail = $110 1-4 Family = $97 Office/Medical = $73 Industrial/Warehouse = $58 Multi-Family = $37 Construction & Development = $30 Other = $132 |
|
|
Key asset quality ratios as of September 30, 2012: Nonperforming Assets / Total Assets = 2.19% Nonperforming Loans / Loans = 3.31% Allowance for Loan Losses / Nonperforming Loans = 69.5% Allowance for Loan Losses / Loans = 2.30% Nonperforming loans are defined as nonaccrual loans + 90+PD + TDRs. NPAs are defined as nonperforming loans + OREO. Asset Quality |
|
|
Risk Trends Millions (End of Period) Non-Performing Loans are defined as non-accrual loans + 90+PD + TDRs |
|
|
Adversely Classified Assets Millions Adversely Classified Assets defined as Substandard Loans + NPA’s * Defined as classifieds as a percentage of tier 1 Capital + LLR |
|
|
New Non-Accrual Loans |
|
|
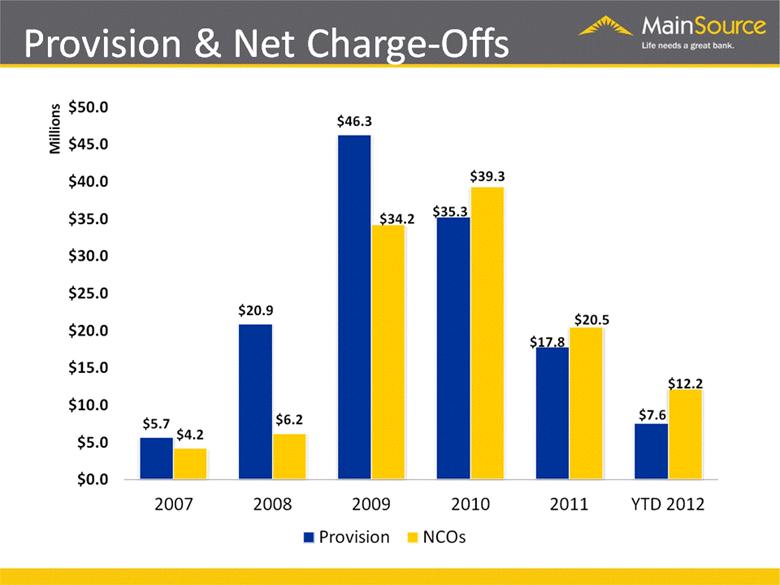
Provision & Net Charge-Offs |
|
|
Credit approval is centralized and includes committees for larger loans Cash flow orientation with emphasis on primary and secondary sources of repayment. Personal guarantees are required on virtually all business loans Lend in geographical footprint Credit Process |
|
|
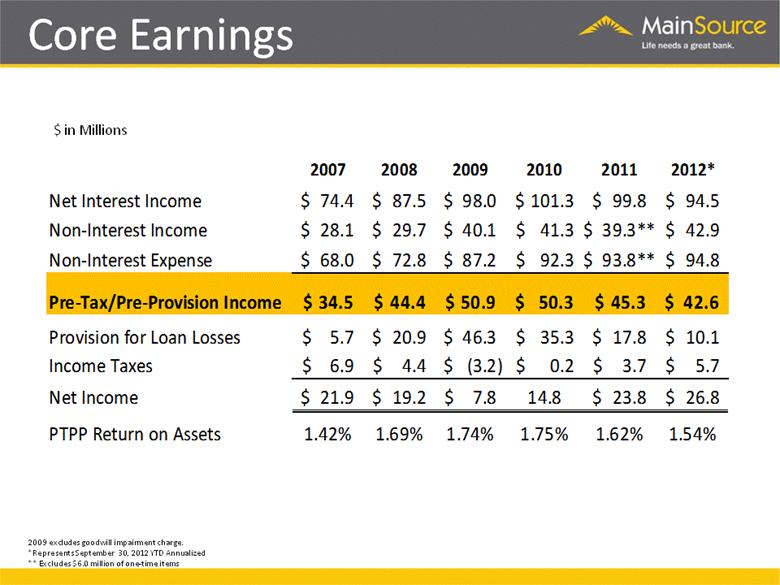
Consistently Profitable Millions * Represents September 30, 2012 YTD Annualized ** Excludes Goodwill Impairment Charges |
|
|
$ in Millions 2009 excludes goodwill impairment charge. *Represents September 30, 2012 YTD Annualized ** Excludes $6.0 million of one-time items Core Earnings 2007 2008 2009 2010 2011 2012* Net Interest Income 74.4 $ 87.5 $ 98.0 $ 101.3 $ 99.8 $ 94.5 $ Non-Interest Income 28.1 $ 29.7 $ 40.1 $ 41.3 $ $ 39.3** 42.9 $ Non-Interest Expense 68.0 $ 72.8 $ 87.2 $ 92.3 $ $ 93.8** 94.8 $ Pre-Tax/Pre-Provision Income 34.5 $ 44.4 $ 50.9 $ 50.3 $ 45.3 $ 42.6 $ Provision for Loan Losses 5.7 $ 20.9 $ 46.3 $ 35.3 $ 17.8 $ 10.1 $ Income Taxes 6.9 $ 4.4 $ (3.2) $ 0.2 $ 3.7 $ 5.7 $ Net Income 21.9 $ 19.2 $ 7.8 $ 14.8 23.8 $ 26.8 $ PTPP Return on Assets 1.42% 1.69% 1.74% 1.75% 1.62% 1.54% |
|
|
Net Interest Margin |
|
|
Growing TCE (End of Period) |
|
|
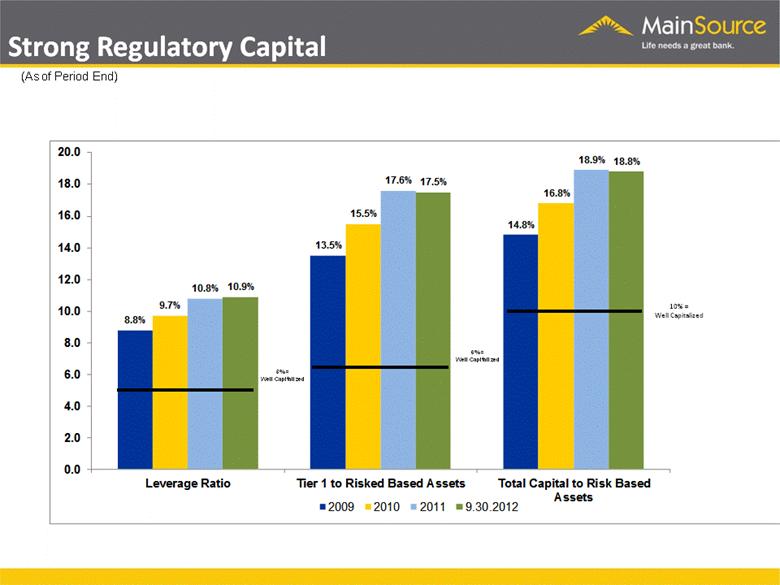
5% = Well Capitalized 6% = Well Capitalized 10% = Well Capitalized Strong Regulatory Capital (As of Period End) 8.8% 13.5% 14.8% 9.7% 15.5% 16.8% 10.8% 17.6% 18.9% 10.9% 17.5% 18.8% 0.0 2.0 4.0 6.0 8.0 10.0 12.0 14.0 16.0 18.0 20.0 Leverage Ratio Tier 1 to Risked Based Assets Total Capital to Risk Based Assets 2009 2010 2011 9.30.2012 |
|
|
Net Income of $7.0 Million Highest Operating Income in Company’s History Earnings per Share of $0.32 ROA of 1.02% Increase in Common Dividend from $.01 to $.03 Stable Operating Expense Closed 6 Small Branches 3rd Quarter 2012 Highlights |
|
|
Improve credit quality metrics Finalize plan for TARP repurchase Continue to aggressively grow checking household base Continue reduction of small/low growth branches Continue expansion into higher growth markets Expand commercial loan balances 2012 Strategic Priorities |
|
|
New Checking Accounts Opened Strategic Priorities 9,448 13,676 0 2,000 4,000 6,000 8,000 10,000 12,000 14,000 16,000 18,000 20,000 2008 2009 2010 2011 YTD 2012 15,648 19,301 15,625 21,381 2012 Annualized |

|
|
Total Checking Accounts Strategic Priorities 90,188 96,937 80,000 85,000 90,000 95,000 100,000 105,000 110,000 115,000 120,000 2008 2009 2010 2011 2012 Projected 99,706 105,852 113,790 |
|
|
Opportunistic Hiring Proven Teams Best in Market Locations Existing or Adjacent Markets Creating Better Opportunities for Loan Growth Strategic Expansion |
|
|
Entered market with an LPO in 4Q 2009 First branch opened in 2Q 2010 Second branch opened in 2Q 2012 As of September 30, 2012 $86mm in Deposits $35mm in Loans #1 mortgage producer in the market Columbus, Indiana |
|
|
De Novo opened in 3Q 2012 Hired commercial team from key competitors Purchased market leading retail brokerage business Adjacent to Columbus, IN market Seymour, Indiana |
|
|
Hired seasoned commercial banking team Highly visible location in downtown area opened October 2012 Focus on commercial banking, small business, private banking and wealth management Purchased small retail brokerage firm in October 2012 Indianapolis Expansion |

|
|
Announced branch purchase on August 28th, 2012 Closing in 4Q 2012 $35mm in Deposits and Loans Creates entry point for Eastern Louisville loan presence Shelbyville, KY/East Louisville |
|
|
New Jobs |

|
|
New Jobs |

|
|
Proven and experienced management team High quality deposit franchise Positive asset quality trends Focus on shareholder value Improving local economies Attractive valuation Investment Highlights |
|
|
for increased shareholder return Improving Credit Profile NPAs / Assets of 2.19% Classified Asset Ratio of 29% Pricing data as of 11/2/12. Investment Thesis Price to Tangible Book Value = 106% Tangible Common Equity Ratio = 8.8% Price to 2013 estimated EPS = 9.9x Excess and Growing Capital provides opportunity |
|
|
[LOGO] |