Attached files
| file | filename |
|---|---|
| 8-K - FORM 8-K - HOLOGIC INC | d440854d8k.htm |
| EX-99.2 - TRANSCRIPT OF CONFERENCE CALL - HOLOGIC INC | d440854dex992.htm |
 Non-GAAP Financial Measures Supplement
September 29, 2012
Exhibit 99.3 |
 Hologic has presented the following non-GAAP financial measures in this
supplement: adjusted revenues; adjusted gross margins; adjusted
operating
expenses;
adjusted
operating
income;
adjusted
interest
expense;
adjusted
pre-tax
income;
adjusted
net
income;
adjusted EPS; and adjusted EBITDA. Hologic defines its non-GAAP adjusted
revenues to include contingent revenue earned under the Novartis
collaboration post-acquisition which was eliminated under purchase accounting. Hologic defines its non-GAAP adjusted gross
margins, adjusted operating expenses, adjusted operating income,
adjusted interest expense, adjusted pre-tax income and adjusted EPS
to exclude, as applicable: (i) the amortization of intangible assets; (ii)
acquisition-related charges and effects, such as charges for
contingent
consideration
(comprised
of
(a)
adjustments
for
changes
in
the
fair
value
of
the
contingent
consideration
liabilities
initially
recorded as part of the purchase price of an acquisition as required by GAAP, and
(b) contingent consideration that is tied to continuing employment of the
former shareholders and employees which is recorded as compensation expense), transaction costs, integration costs
including retention, and credits and/or charges associated with the write-up of
acquired inventory and fixed assets to fair value, and the effect
of
a
reduction
in
revenue
related
to
the
write-up
of
acquired
unbilled
accounts
receivable
to
fair
value;
(iii)
non-cash
interest
expense related to amortization of the debt discount for convertible debt
securities; (iv) divestiture and restructuring charges; (v) non-cash
loss on exchange of convertible notes; (vi) litigation settlement charges
(benefits); (vii) other-than-temporary impairment losses on
investments; and (viii) other one-time, nonrecurring, unusual or infrequent
charges, expenses or gains that may not be indicative of Hologic’s core
business results; and to include income taxes related to such adjustments. Hologic defines adjusted EBITDA as its non-
GAAP adjusted net income plus interest expense, net, income taxes, and depreciation
and amortization expense included in its non- GAAP adjusted net income.
Hologic believes the use of these non-GAAP financial measures is useful
to investors by eliminating certain of the more significant effects of its
acquisitions and related activities, non-cash charges resulting from the application of GAAP to convertible debt instruments with
cash
settlement
features,
charges
related
to
debt
extinguishment
losses,
investment
impairments,
litigation
settlements,
and
divestiture
and restructuring initiatives. These measures also reflect how Hologic manages its
businesses internally. In addition to the adjustments set forth in the
calculation of Hologic’s non-GAAP adjusted net income and adjusted EPS, its non-GAAP adjusted EBITDA eliminates the
effects
of
financing,
income
taxes
and
the
accounting
effects
of
capital
spending.
As
with
the
items
eliminated
in
its
calculation
of
non-
GAAP adjusted net income, these items may vary for different companies for reasons
unrelated to the overall operating performance of a company’s business.
When analyzing Hologic’s operating performance, investors should not consider these non-GAAP financial
measures as a substitute for net (loss) income prepared in accordance with GAAP.
Use of Non-GAAP Financial Measures
2 |
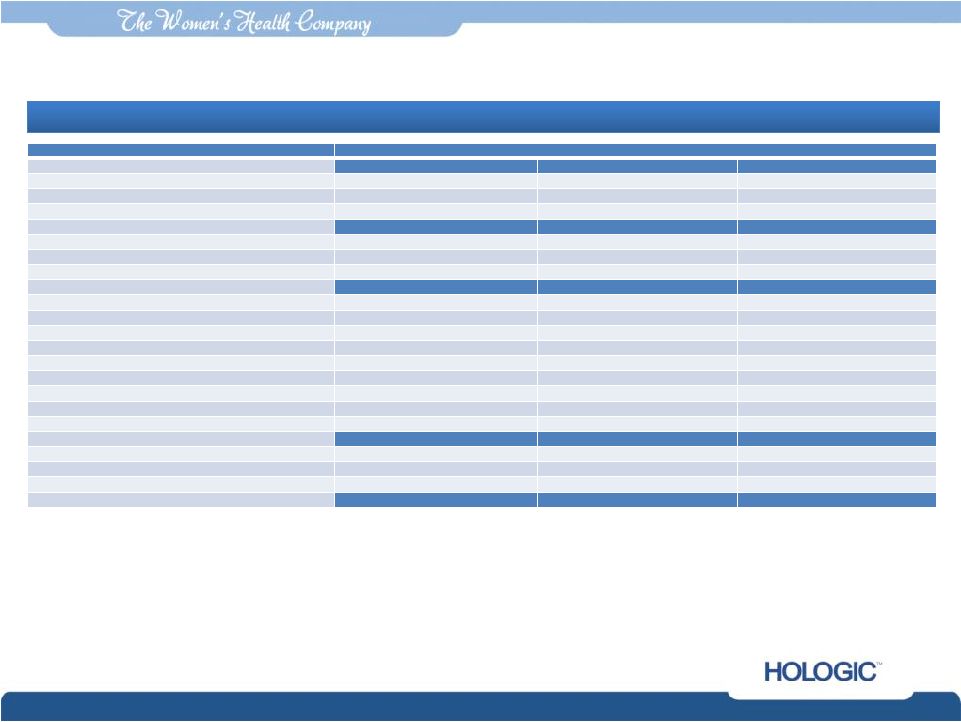 Reconciliation of GAAP to Non-GAAP
(unaudited)
In thousands, except earnings per share
In thousands, except earnings per share
3
Footnotes:
1
To reflect a fair value adjustment recorded in purchase accounting relating to
contingent revenue earned and received under the Novartis collaboration post acquisition which was
eliminated under purchase accounting.
2
Non-GAAP adjusted earnings per share was calculated based on: 268,106; 264,878;
and 267,294 weighted average diluted shares outstanding for the three months ended
September 29, 2012, September 24, 2011, and June 23, 2012, respectively.
Continued on next page
Three Months Ended
Three Months Ended
September 29, 2012
September 29, 2012
September 24, 2011
September 24, 2011
June 23, 2012
June 23, 2012
REVENUES
GAAP revenues
$588,548
Adjustment related to Novartis collaboration
11,606
1
Non-GAAP adjusted revenues
$600,154
$600,154
(LOSS) EARNINGS PER SHARE
GAAP (loss) earnings per share-
Diluted
$(0.29)
$0.10
$0.09
Adjustments to net (loss) income (as detailed below)
0.66
0.24
0.26
Non-GAAP adjusted earnings per share-
Diluted
$0.37
$0.37
2
2
$0.34
$0.34
2
2
$0.35
$0.35
2
2
GROSS MARGINS
GAAP gross margins
$274,317
$243,199
$244,640
Adjustments:
Contingent revenue from Novartis collaboration
11,606
-
-
Amortization of intangibles
66,072
45,978
45,280
Fair value write-up of acquired inventory sold
19,918
-
-
Fair value adjustment for depreciation expense
1,203
-
-
Adiana closure costs
(427)
-
1,546
Acquisition-related costs
612
-
138
Non-GAAP gross margins
$373,301
$373,301
$289,177
$289,177
$291,604
$291,604
GROSS MARGIN PERCENTAGE
GAAP gross margin percentage
46.6%
52.1%
52.0%
Impact of adjustments above
15.6%
9.8%
10.0%
Non-GAAP adjusted gross margin percentage
62.2%
62.2%
61.9%
61.9%
62.0%
62.0% |
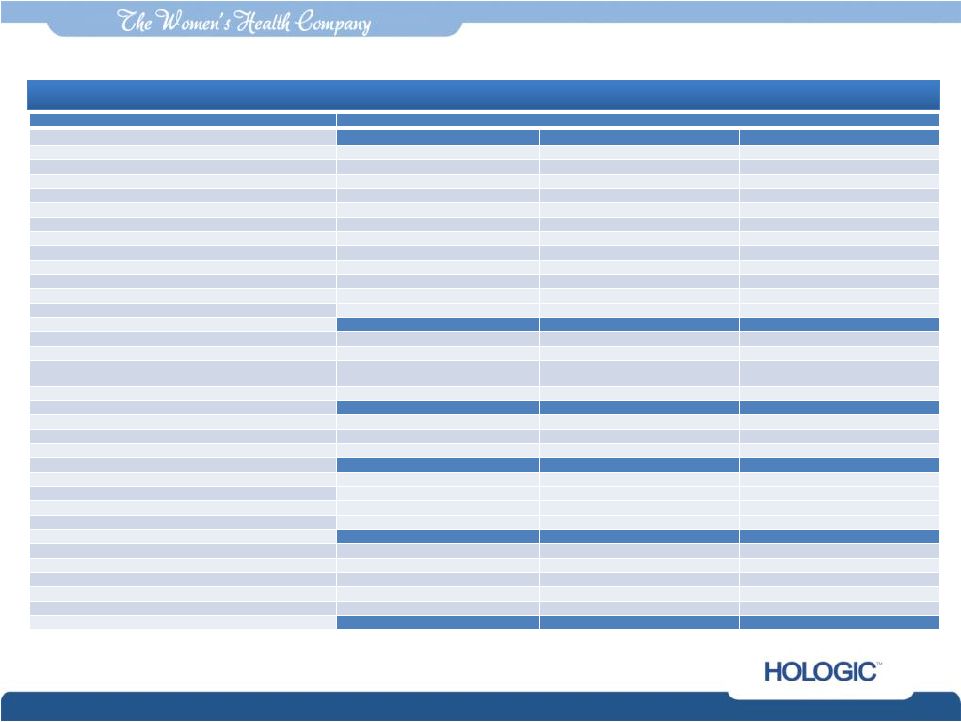 In
thousands, except earnings per share In thousands, except earnings per
share 4
Three Months Ended
Three Months Ended
September 29, 2012
September 29, 2012
September 24, 2011
September 24, 2011
June 23, 2012
June 23, 2012
OPERATING EXPENSES
GAAP operating expenses
$318,020
$169,778
$164,113
Adjustments:
Amortization of intangible assets
(24,832)
(14,492)
(15,733)
Contingent consideration
(40,399)
(11,316)
(2,226)
Acquisition-related costs
(37,901)
(153)
(4,892)
Restructuring and divestiture costs
(16,697)
71
14
Impairment of goodwill
(5,826)
-
-
In-process research and development
(4,500)
-
-
Fair value adjustment for depreciation expense
(1,300)
-
-
Adiana closure costs
-
-
(150)
Other charges
(2)
(320)
-
Non-GAAP adjusted net operating expenses
$186,563
$186,563
$143,568
$143,568
$141,126
$141,126
INTEREST EXPENSE
GAAP interest expense
$56,673
$29,079
$25,593
Adjustment for non-cash interest expense relating to
convertible notes
(16,514)
(18,470)
(15,119)
Other interest expense
-
(214)
(186)
Non-GAAP interest expense
$40,159
$40,159
$10,395
$10,395
$10,288
$10,288
PRE-TAX (LOSS) INCOME
GAAP pre-tax (loss) income
$(97,964)
$41,606
$55,007
Adjustments to pre-tax (loss) income as detailed above
246,955
90,872
85,256
Non-GAAP pre-tax income
$148,991
$148,991
$132,478
$132,478
$140,263
$140,263
NET (LOSS) INCOME
GAAP net (loss) income
$(77,767)
$27,569
$23,594
Adjustments to pre-tax (loss) income as detailed above
246,955
90,872
85,256
Income tax effect of reconciling items
(70,854) ³
(29,655) ³
(16,276) ³
Non-GAAP adjusted net income
$98,334
$98,334
$88,786
$88,786
$92,574
$92,574
EBITDA
Non-GAAP adjusted net income
$98,334
$88,786
$92,574
Interest expense, net, not adjusted above
39,766
9,887
9,593
Provision for income taxes
50,657
43,692
47,689
Depreciation expense, not adjusted above
21,241
17,908
15,926
Adjusted EBITDA
$209,998
$209,998
$160,273
$160,273
$165,782
$165,782
Footnotes:
3
To reflect an annual effective tax rate of 34.0%, 33.2% and 34.0% on a non-GAAP
basis for the three months ended September 29, 2012, September 24, 2011, and
June 23, 2012, respectively. Reconciliation of GAAP to Non-GAAP (unaudited) |
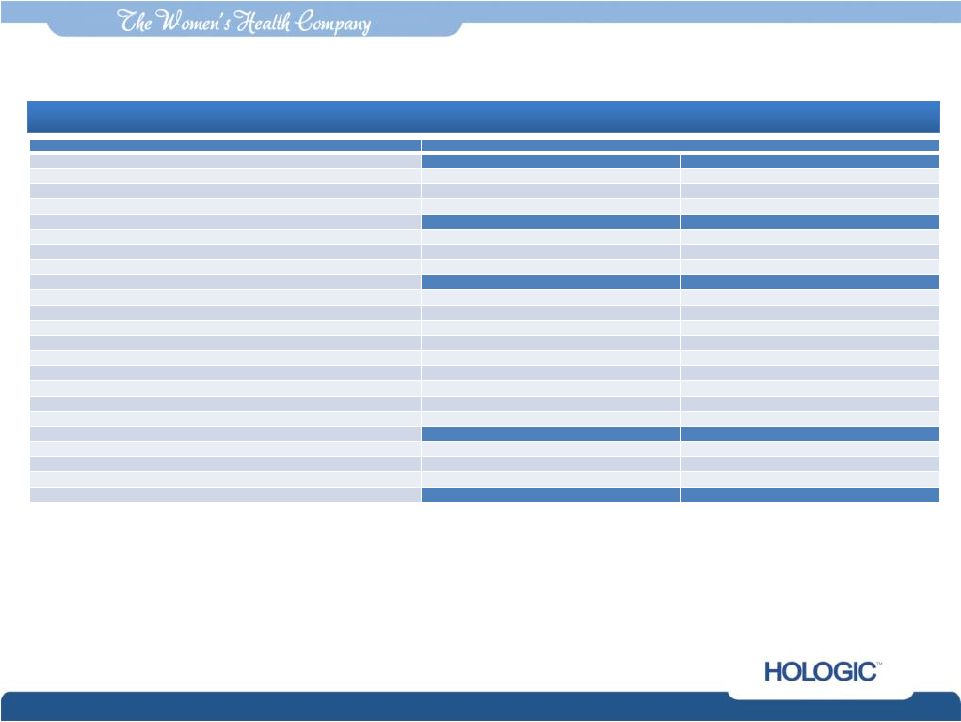 Reconciliation of GAAP to Non-GAAP
(unaudited)
In thousands, except earnings per share
In thousands, except earnings per share
5
Year Ended
Year Ended
September 29, 2012
September 29, 2012
September 24, 2011
September 24, 2011
REVENUES
GAAP revenues
$2,002,652
Adjustment related to Novartis collaboration
11,606
1
Non-GAAP adjusted revenues
$2,014,258
$2,014,258
(LOSS) EARNINGS PER SHARE
GAAP (loss) earnings per share-
Diluted
$(0.28)
$.59
Adjustments to net (loss) income (as detailed below)
1.66
0.68
Non-GAAP adjusted earnings per share-
Diluted
$1.38
$1.38
2
2
$1.27
$1.27
2
2
GROSS MARGINS
GAAP gross margins
$994,437
$923,181
Adjustments:
Contingent revenue from Novartis collaboration
11,606
-
Amortization of intangibles
201,864
177,456
Fair value write-up of acquired inventory sold
19,918
3,298
Fair value adjustment for depreciation expense
1,203
-
Adiana closure costs
19,064
-
Acquisition-related costs and other
800
-
Non-GAAP gross margins
$1,248,892
$1,248,892
$1,103,935
$1,103,935
GROSS MARGIN PERCENTAGE
GAAP gross margin percentage
49.7%
51.6%
Impact of adjustments above
12.3%
10.1%
Non-GAAP adjusted gross margin percentage
62.0%
62.0%
61.7%
61.7%
Footnotes:
1
To reflect a fair value adjustment recorded in purchase accounting relating to
contingent revenue earned and received under the Novartis collaboration post acquisition which was
eliminated under purchase accounting.
2
Non-GAAP
adjusted
earnings
per
sharewas
calculated
based
on
266,795
and
264,305
weighted
average
diluted
shares
outstanding
for
the
year
ended
September
29,
2012
and
September 24, 2011, respectively.
Continued on next page |
 6
Year Ended
Year Ended
September 29, 2012
September 29, 2012
September 24, 2011
September 24, 2011
OPERATING EXPENSES
GAAP operating expenses
$880,720
$548,736
Adjustments:
Amortization of intangible assets
(72,036)
(58,334)
Contingent consideration
(119,497)
(11,986)
Acquisition-related costs and other
(44,305)
(2,102)
Restructuring and divestiture costs (benefit)
(17,036)
71
Impairment of goodwill
(5,826)
-
In-process research and development
(4,500)
-
Fair value adjustment for depreciation expense
(1,300)
-
Adiana closure costs
(479)
-
Gain on sale of intellectual property, net
12,424
84,502
Other
(452)
(770)
Non-GAAP adjusted net operating expenses
$627,713
$627,713
$560,117
$560,117
INTEREST EXPENSE
GAAP interest expense
$140,287
$114,846
Adjustment for non-cash interest expense relating to convertible notes
(68,532)
(72,908)
Other interest expense
(528)
(214)
Non-GAAP interest expense
$71,227
$71,227
$41,724
$41,724
PRE-TAX (LOSS) INCOME
GAAP pre-tax (loss) income
$(61,661)
$227,386
Adjustments to pre-tax (loss) income as detailed above
576,522
242,495
Deb extinguishment loss
42,347
29,891
Other
-
2,445
Non-GAAP pre-tax income
$557,208
$557,208
$502,217
$502,217
NET (LOSS) INCOME
GAAP net (loss) income
$(73,634)
$157,150
Adjustments to pre-tax (loss) income as detailed above
618,869
274,831
Income tax effect of reconciling items
(177,478) ³
(96,500) ³
Non-GAAP adjusted net income
$367,757
$367,757
$335,481
$335,481
EBITDA
Non-GAAP adjusted net income
$367,757
$335,481
Interest expense, net, not adjusted above
68,887
39,864
Provision for income taxes
189,451
166,736
Depreciation expense, not adjusted above
69,348
68,946
Adjusted EBITDA
$695,443
$695,443
$611,027
$611,027
Footnotes:
3
To reflect an annual effective tax rate of 34.0% and 33.2% for the year ended
September 29, 2012 and September 24, 2011, respectively. Reconciliation of GAAP
to Non-GAAP (unaudited) |