Attached files
| file | filename |
|---|---|
| 8-K - U.S. CONCRETE, INC. 8-K - U.S. CONCRETE, INC. | usconcrete8k.htm |
Investor Presentation
November 15, 2012
Three Part Advisors, LLC
2012 Southwest IDEAS Conference
November 15, 2012
Three Part Advisors, LLC
2012 Southwest IDEAS Conference
Forward-Looking Statements
Certain statements provided in this presentation, including those that express a belief, expectation or
intention and those that are not of historical fact, are forward-looking statements within the meaning of
Section 27A of the Securities Act of 1933 and Section 21E of the Securities Exchange Act of 1934. These
statements involve a number of risks and uncertainties and are intended to qualify for the safe harbors from
liability established by the Private Securities Litigation Reform Act of 1995. These risks and uncertainties may
cause actual results to differ materially from expected results and are described in detail in filings made by
U.S. Concrete, Inc. (the Company) with the Securities and Exchange Commission, including the
Companys Annual Report on Form 10-K for the year ended December 31, 2011 and subsequent Quarterly
Reports.
The forward-looking statements speak only as of the date of this presentation. Investors are cautioned not to
rely unduly on them. Many of these forward-looking statements are based on expectations and assumptions
about future events that may prove to be inaccurate. The Companys management considers these
expectations and assumptions to be reasonable, but they are inherently subject to significant business,
economic, competitive, regulatory and other risks, contingencies and uncertainties, most of which are difficult
to predict and many of which are beyond the Companys control. The Company undertakes no obligation to
update these statements unless required by applicable securities laws.
Company Overview
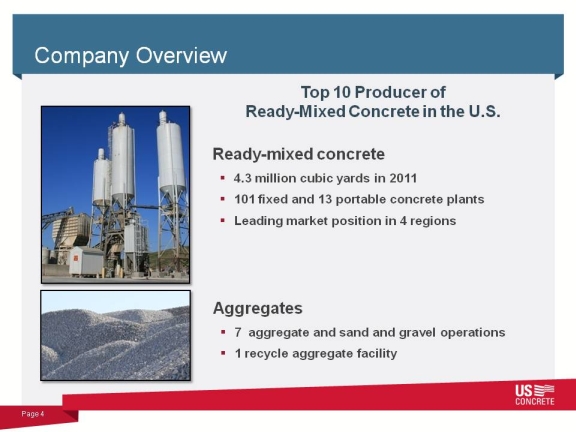
Ready-mixed concrete
4.3 million cubic yards in 2011
101 fixed and 13 portable concrete plants
Leading market position in 4 regions
Company Overview
Top 10 Producer of
Ready-Mixed Concrete in the U.S.
Page 4
Aggregates
7 aggregate and sand and gravel operations
1 recycle aggregate facility
4.3 million cubic yards in 2011
101 fixed and 13 portable concrete plants
Leading market position in 4 regions
Company Overview
Top 10 Producer of
Ready-Mixed Concrete in the U.S.
Page 4
Aggregates
7 aggregate and sand and gravel operations
1 recycle aggregate facility
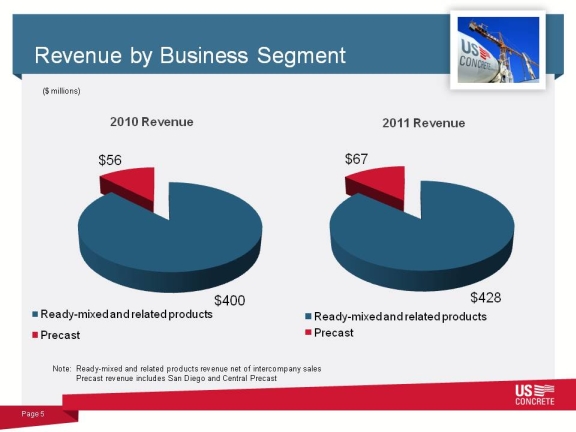
Revenue by Business Segment
$56
2010 Revenue 2011 Revenue
$67
($ millions)
$400
Ready-mixed and related products
Precast
Page 5
$428
Ready-mixed and related products
Precast
Note: Ready-mixed and related products revenue net of intercompany sales
Precast revenue includes San Diego and Central Precast
$56
2010 Revenue 2011 Revenue
$67
($ millions)
$400
Ready-mixed and related products
Precast
Page 5
$428
Ready-mixed and related products
Precast
Note: Ready-mixed and related products revenue net of intercompany sales
Precast revenue includes San Diego and Central Precast
Broad Geographic Footprint
SAN FRANCISCO
SAN JOSE
MD
NJ
DE
NY
PA
Page 6
Headquarters relocated
to Dallas area on
July 1, 2012.
FIXED READY-MIXED
PRECAST
AGGREGATES
RECYCLED AGGREGATES
Corporate Headquarters
SAN FRANCISCO
SAN JOSE
MD
NJ
DE
NY
PA
Page 6
Headquarters relocated
to Dallas area on
July 1, 2012.
FIXED READY-MIXED
PRECAST
AGGREGATES
RECYCLED AGGREGATES
Corporate Headquarters
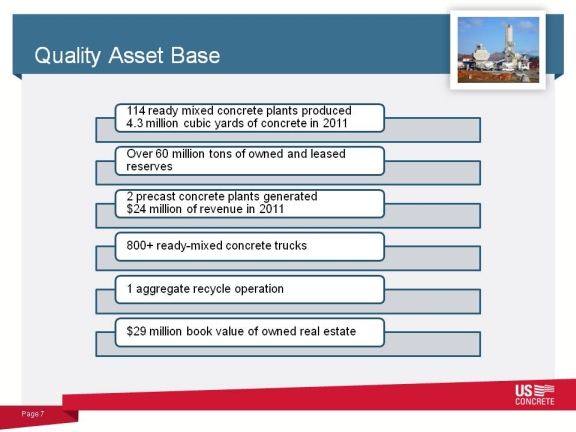
Quality Asset Base
114 ready mixed concrete plants produced
4.3 million cubic yards of concrete in 2011
Over 60 million tons of owned and leased
reserves
2 precast concrete plants generated
$24 million of revenue in 2011
Page 7
800+ ready-mixed concrete trucks
1 aggregate recycle operation
$29 million book value of owned real estate
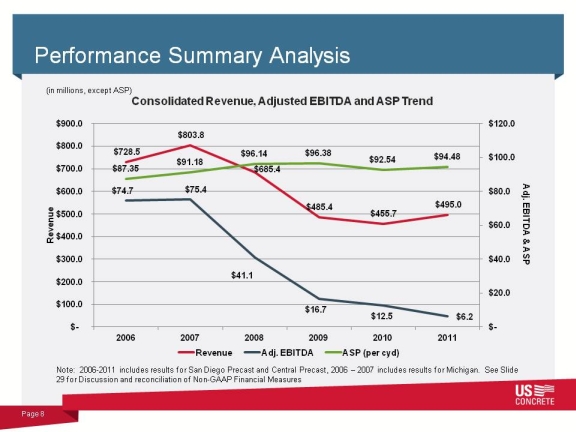
Performance Summary Analysis
$728.5
$803.8
$685.4
$485.4
$455.7
$495.0
$74.7 $75.4
$87.35
$91.18
$96.14 $96.38
$92.54 $94.48
$80.0
$100.0
$120.0
$500.0
$600.0
$700.0
$800.0
$900.0
Adj. EBITDA & ASP
Revenue
Consolidated Revenue, Adjusted EBITDA and ASP Trend
(in millions, except ASP)
$41.1
$16.7
$12.5 $6.2
$-
$20.0
$40.0
$60.0
$-
$100.0
$200.0
$300.0
$400.0
2006 2007 2008 2009 2010 2011
Revenue Adj. EBITDA ASP (per cyd)
Page 8
Note: 2006-2011 includes results for San Diego Precast and Central Precast, 2006 2007 includes results for Michigan. See Slide
29 for Discussion and reconciliation of Non-GAAP Financial Measures
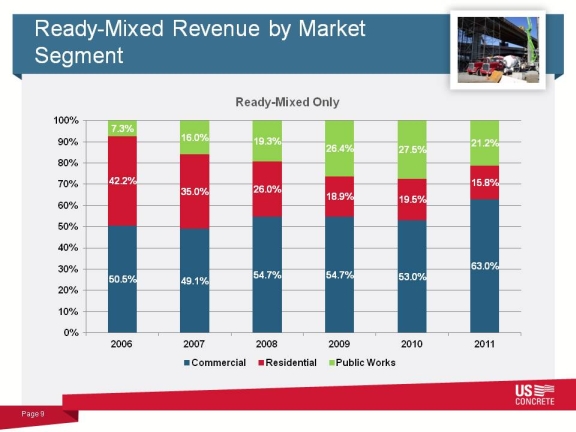
Ready-Mixed Revenue by Market
Segment
Ready-Mixed Only
42.2%
35.0% 26.0%
18.9% 19.5%
15.8%
7.3%
16.0% 19.3%
26.4% 27.5%
21.2%
60%
70%
80%
90%
100%
Page 9
50.5% 49.1%
54.7% 54.7% 53.0%
63.0%
0%
10%
20%
30%
40%
50%
2006 2007 2008 2009 2010 2011
Commercial Residential Public Works
Segment
Ready-Mixed Only
42.2%
35.0% 26.0%
18.9% 19.5%
15.8%
7.3%
16.0% 19.3%
26.4% 27.5%
21.2%
60%
70%
80%
90%
100%
Page 9
50.5% 49.1%
54.7% 54.7% 53.0%
63.0%
0%
10%
20%
30%
40%
50%
2006 2007 2008 2009 2010 2011
Commercial Residential Public Works
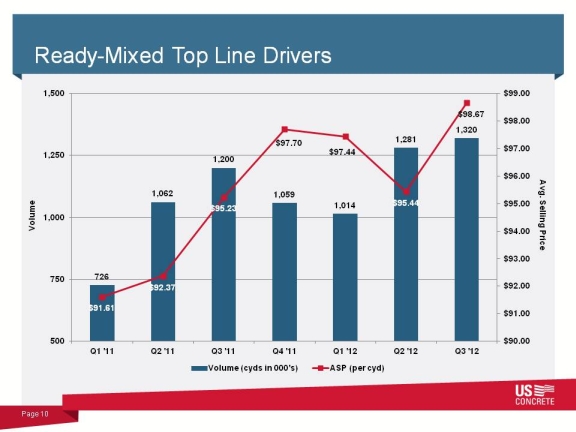
Ready-Mixed Top Line Drivers
1,062
1,200
1,059
1,014
1,281
1,320
$95.23
$97.70
$97.44
$95.44
$98.67
$95.00
$96.00
$97.00
$98.00
$99.00
1,000
1,250
1,500
Avg. Selling Price
Volume
726
$91.61
$92.37
$90.00
$91.00
$92.00
$93.00
$94.00
500
750
Q1 '11 Q2 '11 Q3 '11 Q4 '11 Q1 '12 Q2 '12 Q3 '12
Volume (cyds in 000's) ASP (per cyd)
1,062
1,200
1,059
1,014
1,281
1,320
$95.23
$97.70
$97.44
$95.44
$98.67
$95.00
$96.00
$97.00
$98.00
$99.00
1,000
1,250
1,500
Avg. Selling Price
Volume
726
$91.61
$92.37
$90.00
$91.00
$92.00
$93.00
$94.00
500
750
Q1 '11 Q2 '11 Q3 '11 Q4 '11 Q1 '12 Q2 '12 Q3 '12
Volume (cyds in 000's) ASP (per cyd)
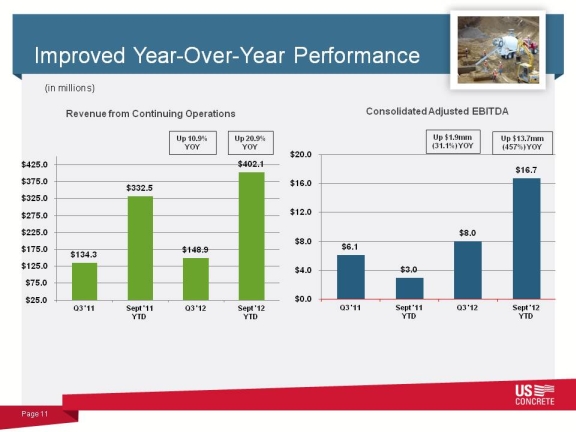
Improved Year-Over-Year Performance
Up $13.7mm
(457%) YOY
Up $1.9mm
(31.1%) YOY
(in millions)
Consolidated Adjusted EBITDA
$332.5
$402.1
$275.0
$325.0
$375.0
$425.0
Up 20.9%
YOY
Up 10.9%
YOY
Revenue from Continuing Operations
$6.1
$3.0
$8.0
$0.0
$4.0
$8.0
Q3 '11 Sept '11
YTD
Q3 '12 Sept '12
YTD
Up $13.7mm
(457%) YOY
Up $1.9mm
(31.1%) YOY
(in millions)
Consolidated Adjusted EBITDA
$332.5
$402.1
$275.0
$325.0
$375.0
$425.0
Up 20.9%
YOY
Up 10.9%
YOY
Revenue from Continuing Operations
$6.1
$3.0
$8.0
$0.0
$4.0
$8.0
Q3 '11 Sept '11
YTD
Q3 '12 Sept '12
YTD
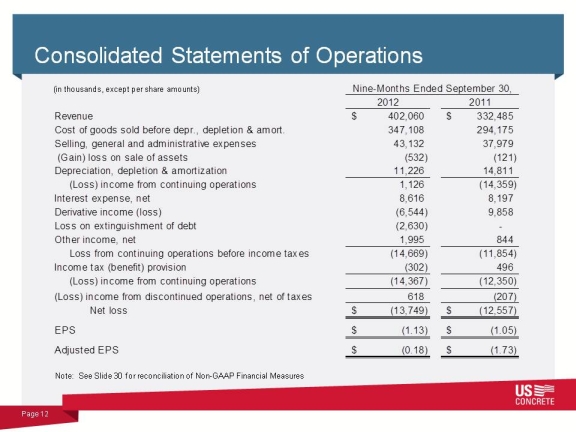
Consolidated Statements of Operations
2012 2011
Revenue $ 402,060 $ 332,485
Cost of goods sold before depr., depletion & amort. 347,108 294,175
Selling, general and administrative expenses 43,132 37,979
(Gain) loss on sale of assets (532) (121)
Depreciation, depletion & amortization 11,226 14,811
(Loss) income from continuing operations 1,126 (14,359)
Interest expense, net 8,616 8,197
Derivative income (loss) (6,544) 9,858
(in thousands, except per share amounts) Nine-Months Ended September 30,
Page 12
Loss on extinguishment of debt (2,630) -
Other income, net 1,995 844
Loss from continuing operations before income taxes (14,669) (11,854)
Income tax (benefit) provision (302) 496
(Loss) income from continuing operations (14,367) (12,350)
(Loss) income from discontinued operations, net of taxes 618 (207)
Net loss $ (13,749) $ (12,557)
EPS $ (1.13) $ (1.05)
Adjusted EPS $ (0.18) $ (1.73)
Note: See Slide 30 for reconciliation of Non-GAAP Financial Measures
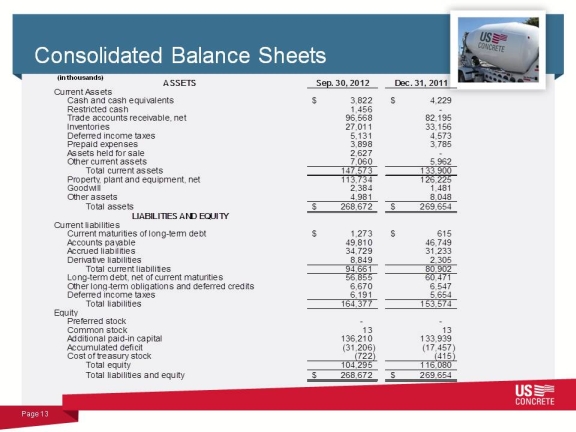
Consolidated Balance Sheets
(in thousands)
Sep. 30, 2012 Dec. 31, 2011
Current Assets
Cash and cash equivalents $ 3,822 $ 4,229
Restricted cash 1,456 -
Trade accounts receivable, net 96,568 82,195
Inventories 27,011 33,156
Deferred income taxes 5,131 4,573
Prepaid expenses 3,898 3,785
Assets held for sale 2,627 -
Other current assets 7,060 5,962
Total current assets 147,573 133,900
Property, plant and equipment, net 113,734 126,225
Goodwill 2,384 1,481
Other assets 4,981 8,048
Total assets $ 2 68,672 $ 269,654
ASSETS
LIABILITIES AND EQUITY
Page 13
Current liabilities
Current maturities of long-term debt $ 1,273 $ 615
Accounts payable 49,810 46,749
Accrued liabilities 34,729 31,233
Derivative liabilities 8,849 2,305
Total current liabilities 94,661 80,902
Long-term debt, net of current maturities 56,855 60,471
Other long-term obligations and deferred credits 6,670 6,547
Deferred income taxes 6,191 5,654
Total liabilities 164,377 153,574
Equity
Preferred stock - -
Common stock 13 13
Additional paid-in capital 136,210 133,939
Accumulated deficit (31,206) (17,457)
Cost of treasury stock (722) (415)
Total equity 104,295 116,080
Total liabilities and equity $ 2 68,672 $ 269,654
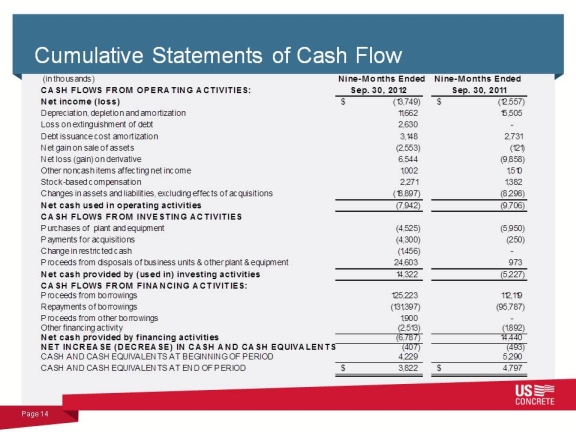
Cumulative Statements of Cash Flow
(in thousands) Nine-Months Ended Nine-Months Ended
CASH F LOWS FROM OP ERAT ING ACT IVIT IES: Sep. 30, 2012 Sep. 30, 2011
Net income ( lo ss) $ (13,749) $ (12,557)
Depreciation, depletion and amortization 11,662 15,505
Loss on extinguishment of debt 2,630 -
Debt issuance cost amortization 3,148 2,731
Net gain on sale of assets (2,553) (121)
Net loss (gain) on derivative 6,544 (9,858)
Other noncash items affecting net income 1,002 1,510
Stock-based compensation 2,271 1,382
Changes in assets and liabilities, excluding effects of acquisitions ( 18,897) (8,298)
Net cash used in o perat ing act ivit ies (7,942) (9,706)
CASH F LOWS FROM INVEST ING ACT IVIT IES
Page 14
Purchases of plant and equipment (4,525) (5,950)
Payments for acquisitions (4,300) (250)
Change in restricted cash (1,456) -
Proceeds from disposals of business units & other plant & equipment 24,603 973
Net cash pro vided by (used in) invest ing act ivit ies 14,322 (5,227)
CASH F LOWS FROM F INANCING ACT IVIT IES:
Proceeds from borrowings 125,223 112,119
Repayments of borrowings (131,397) (95,787)
Proceeds from other borrowings 1,900 -
Other financing activity (2,513) (1,892)
Net cash pro vided by f inancing act ivit ies (6,787) 14,440
NET INCREASE (DECREASE) IN CASH AND CASH EQUIVALENT S (407) (493)
CASH AND CASH EQUIVALENTS AT BEGINNING OF PERIOD 4,229 5,290
CASH AND CASH EQUIVALENTS AT END OF PERIOD $ 3,822 $ 4,797
Industry Overview
$18.5
$30.0
$20.0
$40.0
$60.0
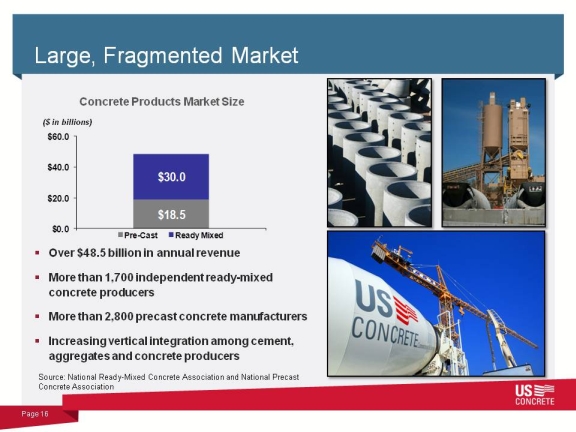
Large, Fragmented Market
Concrete Products Market Size
($ in billions)
$0.0
Pre-Cast Ready Mixed
Over $48.5 billion in annual revenue
More than 1,700 independent ready-mixed
concrete producers
More than 2,800 precast concrete manufacturers
Increasing vertical integration among cement,
aggregates and concrete producers
Page 16
Source: National Ready-Mixed Concrete Association and National Precast
Concrete Association
$30.0
$20.0
$40.0
$60.0
Large, Fragmented Market
Concrete Products Market Size
($ in billions)
$0.0
Pre-Cast Ready Mixed
Over $48.5 billion in annual revenue
More than 1,700 independent ready-mixed
concrete producers
More than 2,800 precast concrete manufacturers
Increasing vertical integration among cement,
aggregates and concrete producers
Page 16
Source: National Ready-Mixed Concrete Association and National Precast
Concrete Association
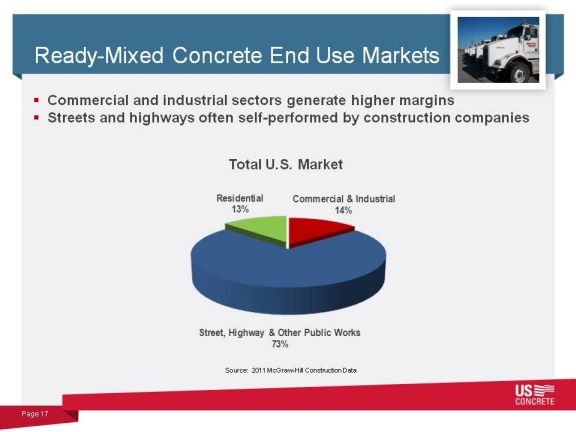
Ready-Mixed Concrete End Use Markets
Total U.S. Market
Residential
13%
Commercial & Industrial
14%
Commercial and industrial sectors generate higher margins
Streets and highways often self-performed by construction companies
Page 17
Source: 2011 McGraw-Hill Construction Data
Street, Highway & Other Public Works
73%
Total U.S. Market
Residential
13%
Commercial & Industrial
14%
Commercial and industrial sectors generate higher margins
Streets and highways often self-performed by construction companies
Page 17
Source: 2011 McGraw-Hill Construction Data
Street, Highway & Other Public Works
73%
Company Strategy and Focus
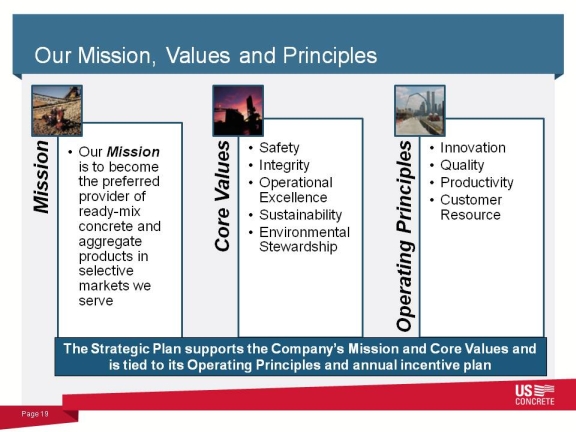
Our Mission, Values and Principles
Mission
Our Mission
is to become
the preferred
provider of
ready-mix Core Values
Safety
Integrity
Operational
Excellence
Sustainability
Operating Principles
Innovation
Quality
Productivity
Customer
Resource
concrete and
aggregate
products in
selective
markets we
serve
Environmental
Stewardship
Page 19
The Strategic Plan supports the Companys Mission and Core Values and
is tied to its Operating Principles and annual incentive plan
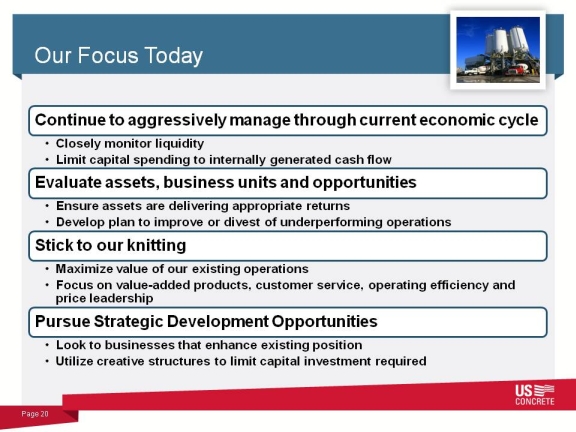
Our Focus Today
Continue to aggressively manage through current economic cycle
Closely monitor liquidity
Limit capital spending to internally generated cash flow
Evaluate assets, business units and opportunities
Ensure assets are delivering appropriate returns
Develop plan to improve or divest of underperforming operations
Stick to our knitting
Maximize value of our existing operations
Focus on value-added products, customer service, operating efficiency and
price leadership
Pursue Strategic Development Opportunities
Look to businesses that enhance existing position
Utilize creative structures to limit capital investment required
Page 20
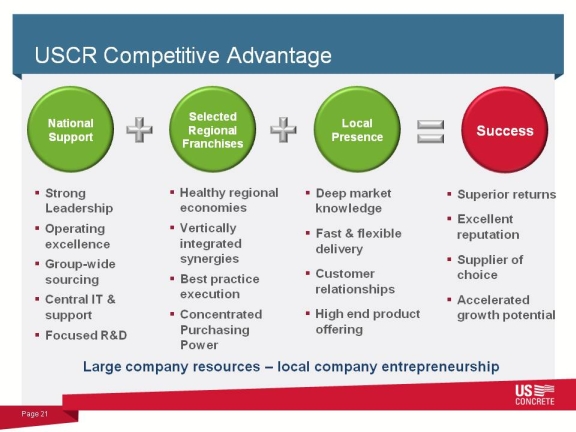
USCR Competitive Advantage
Strong
Leadership
Healthy regional
economies
Deep market
knowledge
Superior returns
Excellent
National
Support
Selected
Regional
Franchises
Local
Presence Success
Operating
excellence
Group-wide
sourcing
Central IT &
support
Focused R&D
Page 21
Vertically
integrated
synergies
Best practice
execution
Concentrated
Purchasing
Power
Fast & flexible
delivery
Customer
relationships
High end product
offering
reputation
Supplier of
choice
Accelerated
growth potential
Large company resources local company entrepreneurship
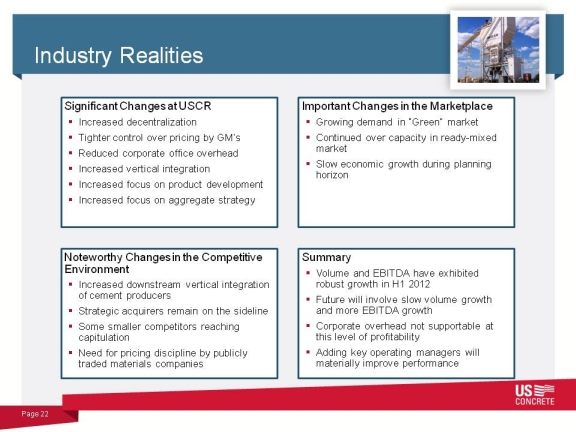
Industry Realities
Significant Changes at USCR
Increased decentralization
Tighter control over pricing by GMs
Reduced corporate office overhead
Increased vertical integration
Increased focus on product development
Increased focus on aggregate strategy
Important Changes in the Marketplace
Growing demand in Green market
Continued over capacity in ready-mixed
market
Slow economic growth during planning
horizon
Noteworthy Changes in the Competitive
Environment
Increased downstream vertical integration
of cement producers
Strategic acquirers remain on the sideline
Some smaller competitors reaching
capitulation
Need for pricing discipline by publicly
traded materials companies
Summary
Volume and EBITDA have exhibited
robust growth in H1 2012
Future will involve slow volume growth
and more EBITDA growth
Corporate overhead not supportable at
this level of profitability
Adding key operating managers will
materially improve performance
Page 22
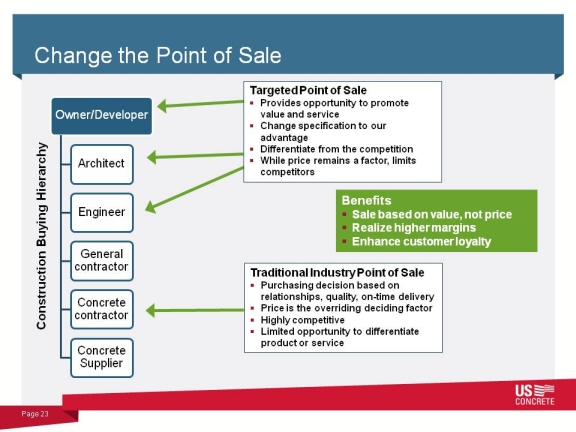
Change the Point of Sale
Owner/Developer
Architect
Engineer
Construction Buying Hierarchy
Targeted Point of Sale
Provides opportunity to promote
value and service
Change specification to our
advantage
Differentiate from the competition
While price remains a factor, limits
competitors
Benefits
Sale based on value, not price
General
contractor
Concrete
contractor
Concrete
Supplier
Page 23
Realize higher margins
Enhance customer loyalty
Traditional Industry Point of Sale
Purchasing decision based on
relationships, quality, on-time delivery
Price is the overriding deciding factor
Highly competitive
Limited opportunity to differentiate
product or service
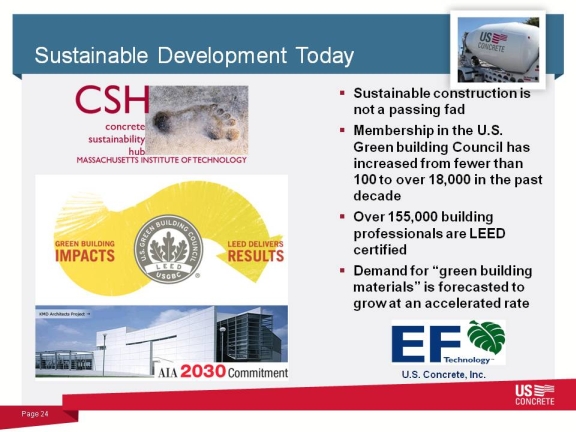
Sustainable Development Today
Sustainable construction is
not a passing fad
Membership in the U.S.
Green building Council has
increased from fewer than
100 to over 18,000 in the past
decade
Over 155,000 building
Page 24
U.S. Concrete, Inc.
professionals are LEED
certified
Demand for green building
materials is forecasted to
grow at an accelerated rate
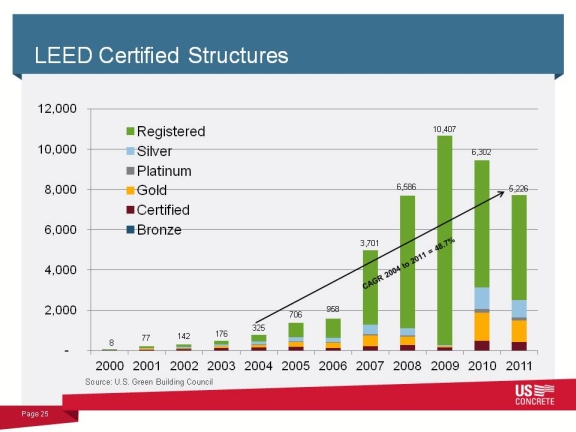
LEED Certified Structures
6,586
10,407
6,302
8,000 5,226
10,000
12,000
Registered
Silver
Platinum
Gold
Certified
8
77 142 176
325
706
958
3,701
-
2,000
4,000
6,000
2000 2001 2002 2003 2004 2005 2006 2007 2008 2009 2010 2011
Bronze
Page 25
Source: U.S. Green Building Council
6,586
10,407
6,302
8,000 5,226
10,000
12,000
Registered
Silver
Platinum
Gold
Certified
8
77 142 176
325
706
958
3,701
-
2,000
4,000
6,000
2000 2001 2002 2003 2004 2005 2006 2007 2008 2009 2010 2011
Bronze
Page 25
Source: U.S. Green Building Council
Demand for Sustainable Construction
Materials
$128.6
$150.2
$173.5
$150.0
$200.0
Projected US Green Building Market Value
CAGR 2010 to 2015 = 19.5%
Page 26
$71.1
$90.0
$108.9
$0.0
$50.0
$100.0
2010 2011 2012 2013 2014 2015
($ billions)
Source: Environmental Leader Business News
Materials
$128.6
$150.2
$173.5
$150.0
$200.0
Projected US Green Building Market Value
CAGR 2010 to 2015 = 19.5%
Page 26
$71.1
$90.0
$108.9
$0.0
$50.0
$100.0
2010 2011 2012 2013 2014 2015
($ billions)
Source: Environmental Leader Business News
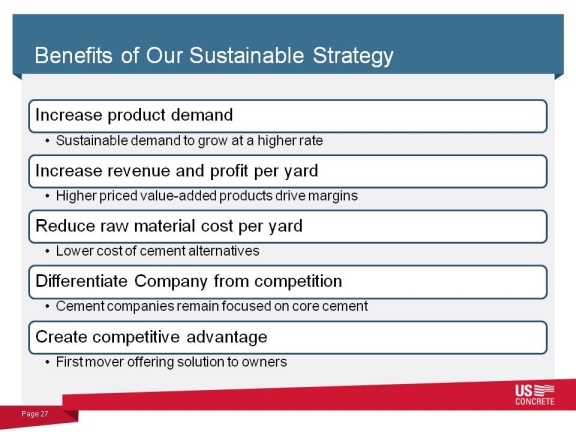
Benefits of Our Sustainable Strategy
Increase product demand
Sustainable demand to grow at a higher rate
Increase revenue and profit per yard
Higher priced value-added products drive margins
Reduce raw material cost per yard
Lower cost of cement alternatives
Differentiate Company from competition
Cement companies remain focused on core cement
Create competitive advantage
First mover offering solution to owners
Page 27
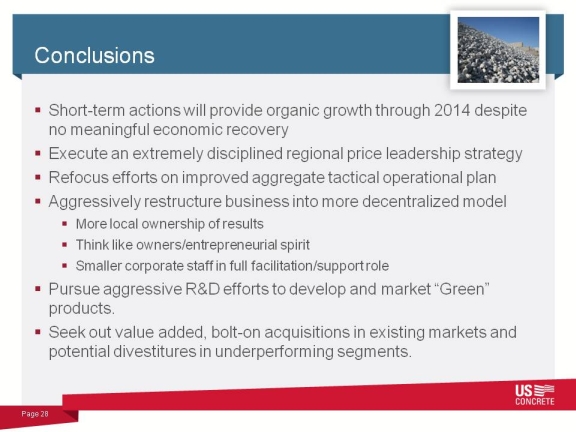
Conclusions
Short-term actions will provide organic growth through 2014 despite
no meaningful economic recovery
Execute an extremely disciplined regional price leadership strategy
Refocus efforts on improved aggregate tactical operational plan
Aggressively restructure business into more decentralized model
More local ownership of results
Think like owners/entrepreneurial spirit
Smaller corporate staff in full facilitation/support role
Pursue aggressive R&D efforts to develop and market Green
products.
Seek out value added, bolt-on acquisitions in existing markets and
potential divestitures in underperforming segments.
Page 28
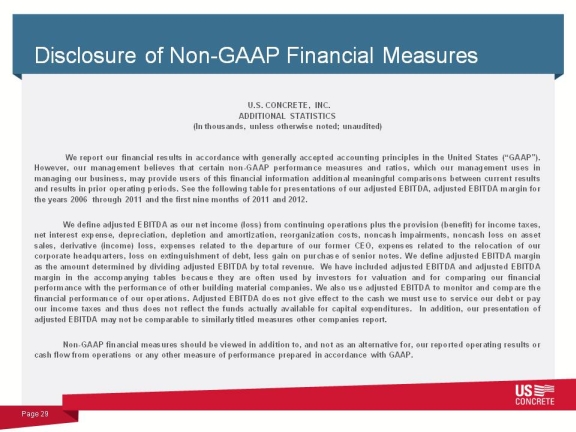
Disclosure of Non-GAAP Financial Measures
U.S. CONCRETE, INC.
ADDITIONAL STATISTICS
(In thousands, unless otherwise noted; unaudited)
We report our financial results in accordance with generally accepted accounting principles in the United States (GAAP).
However, our management believes that certain non-GAAP performance measures and ratios, which our management uses in
managing our business, may provide users of this financial information additional meaningful comparisons between current results
and results in prior operating periods. See the following table for presentations of our adjusted EBITDA, adjusted EBITDA margin for
the years 2006 through 2011 and the first nine months of 2011 and 2012.
We define adjusted EBITDA as our net income (loss) from continuing operations plus the provision (benefit) for income taxes,
net interest expense, depreciation, depletion and amortization, reorganization costs, noncash impairments, noncash loss on asset
sales, derivative (income) loss, expenses related to the departure of our former CEO, expenses related to the relocation of our
corporate headquarters, loss on extinguishment of debt, less gain on purchase of senior notes. We define adjusted EBITDA margin
as the amount determined by dividing adjusted EBITDA by total revenue. We have included adjusted EBITDA and adjusted EBITDA
margin in the accompanying tables because they are often used by investors for valuation and for comparing our financial
performance with the performance of other building material companies. We also use adjusted EBITDA to monitor and compare the
financial performance of our operations. Adjusted EBITDA does not give effect to the cash we must use to service our debt or pay
our income taxes and thus does not reflect the funds actually available for capital expenditures. In addition, our presentation of
adjusted EBITDA may not be comparable to similarly titled measures other companies report.
Non-GAAP financial measures should be viewed in addition to, and not as an alternative for, our reported operating results or
cash flow from operations or any other measure of performance prepared in accordance with GAAP.
Page 29
Reconciliation of Non-GAAP Financial
Measures
(in thousands, except per share amounts)
Adjusted EBITDA reconciliation: 2006 2007 2008 2009 2010 2011 Sept 2011 Sept 2012
Net loss (income) from continuing operations $ (7,333) $ (63,760) $ (128,454) $ (78,354) $ 19,763 $ (11,703) $ (12,350) $ (14,367)
Income tax expense (benefit) 1,378 48 (17,996) (315) 628 (782) 496 (302)
Interest expense, net 21,588 27,978 26,470 25,941 20,754 11,057 8,197 8,616
Goodwill and other asset impairments 38,948 82,242 135,631 47,595 - - - -
Depreciation, depletion and amortization 20,141 28,882 25,446 26,325 23,744 19,662 14,811 11,226
Derivative (income) loss - - - - (996) (13,422) (9,858) 6,544
Gain on purchase of senior notes - - - (7,406) - - - -
Reorganization Items - - - - (59,191) - - -
Reorganization items included in SG&A expenses - - - - 7,790 - - -
---------------------- Year Ended December 31, ----------------------- -------- Year-to-Date -------
Page 30
Expenses related to departure of former CEO - - - - - 1,414 1,700 -
Expenses related to corporate headquarters relocation - - - - - - - 2,325
Loss on extinguishment of debt - - - - - - - 2,630
Non-cash loss on sale of Sacramento assets - - - 2,954 - - - -
Adjusted EBITDA $ 74,722 $ 75,390 $ 41,097 $ 16,740 $ 12,492 $ 6,226 $ 2,996 $ 16,672
Adjusted EBITDA margin 10.3% 9.4% 6.0% 3.4% 2.7% 1.3% 0.9% 4.1%
Adjusted earnings per share reconciliation:
Net loss per share $ (1.05) $ (1.13)
Add: Impact of derivative (income) loss $ (0.82) $ 0.54
Add: Impact of loss on extinguishment of debt $ 0.22
Add: Impact of exp. related to departure of former CEO $ 0.14 -
Add: Impact of expenses related to corporate HQ relo. - $ 0.19
Adjusted EPS $ (1.73) $ (0.18)

Investor Presentation
November 15, 2012
Three Part Advisors, LLC
2012 Southwest IDEAS Conference
November 15, 2012
Three Part Advisors, LLC
2012 Southwest IDEAS Conference