Isola Group Ltd. - FORM S-1/A - November 13, 2012
Attached files
Use these links to rapidly review the document
TABLE OF CONTENTS
INDEX TO CONSOLIDATED FINANCIAL STATEMENTS
Table of Contents
As filed with the Securities and Exchange Commission on November 13, 2012
Registration No. 333-177611
UNITED STATES
SECURITIES AND EXCHANGE COMMISSION
Washington, D.C. 20549
Amendment No. 5
to
FORM S-1
REGISTRATION STATEMENT
UNDER
THE SECURITIES ACT OF 1933
Isola Group Ltd.
(Exact name of registrant as specified in its charter)
|
|
|
|
|
Cayman Islands
(State or other jurisdiction of
incorporation or organization) |
|
3672
(Primary Standard Industrial
Classification Code Number) |
|
38-3853493
(I.R.S. Employer
Identification No.) |
3100 West Ray Road, Suite 301
Chandler, Arizona 85226
(480) 893-6527
(Address, including zip code, and telephone number, including
area code, of registrant's principal executive offices)
Raymond P. Sharpe
President and Chief Executive Officer
Isola Group Ltd.
3100 West Ray Road, Suite 301
Chandler, Arizona 85226
(480) 893-6527
(Name, address, including zip code, and telephone number, including area code, of agent for service)
|
|
|
| Copies to: |
Steven D. Pidgeon, Esq.
DLA Piper LLP (US)
2525 East Camelback Road, Suite 1000
Phoenix, Arizona 85016
(480) 606-5100
Fax: (480) 606-5101 |
|
Julia Cowles, Esq.
Davis Polk & Wardwell LLP
1600 El Camino Real
Menlo Park, California 94025
(650) 752-2000
Fax: (650) 752-2111 |
Approximate date of commencement of proposed sale to the public:
As soon as practicable after the effectiveness of this registration statement.
If any of the securities being registered on this Form are being offered on a delayed or continuous basis pursuant to Rule 415 under the Securities Act of
1933, check the following box. o
If this form is filed to register additional securities for an offering pursuant to Rule 462(b) under the Securities Act, check the following box and list
the Securities Act registration statement number of the earlier effective registration statement for the same offering. o
If this form is a post-effective amendment filed pursuant to Rule 462(c) under the Securities Act, check the following box and list the
Securities Act registration statement number of the earlier effective registration statement for the same offering. o
If this form is a post-effective amendment filed pursuant to Rule 462(d) under the Securities Act, check the following box and list the
Securities Act registration statement number of the earlier effective registration statement for the same offering. o
Indicate by check mark whether the registrant is a large accelerated filer, an accelerated filer, a non-accelerated filer, or a smaller reporting
company. See the definitions of "large accelerated filer", "accelerated filer" and "smaller reporting company" in Rule 12b-2 of the Exchange Act. (Check one):
|
|
|
|
|
|
|
| Large accelerated filer o |
|
Accelerated filer o |
|
Non-accelerated filer ý
(Do not check if a
smaller reporting company) |
|
Smaller reporting company o |
The registrant hereby amends this registration statement on such date or dates as may be necessary to delay its effective date until the registrant shall
file a further amendment which specifically states that this registration statement shall thereafter become effective in accordance with Section 8(a) of the Securities Act of 1933 or
until the registration statement shall become effective on such date as the Commission, acting pursuant to said Section 8(a), may determine.
Table of Contents
The information in this prospectus is not complete and may be
changed. We may not sell these securities until the registration statement filed with the Securities and Exchange Commission is effective. This prospectus is not an offer to sell these securities and
we are not soliciting an offer to buy these securities in any jurisdiction where the offer or sale is not permitted.
|
|
|
|
|
|
PRELIMINARY PROSPECTUS |
|
Subject to completion, |
|
Dated November 13, 2012 |
|
Shares

Ordinary shares
This is the initial public offering of our ordinary shares. No public market currently exists for our ordinary shares. It is currently estimated that the
initial public offering price will be between $ and $ per share.
We
have applied to have our ordinary shares listed on the Nasdaq Global Market under the symbol "ISLA".
We are an "emerging growth company" under applicable federal securities laws and will be subject to reduced public company reporting requirements. Investing in our ordinary
shares involves a high degree of risk. Before buying any shares, you should carefully read the discussion of material risks of investing in our ordinary shares in "Risk Factors" beginning on
page 12 of this prospectus.
Neither the Securities and Exchange Commission nor any other regulatory body has approved or disapproved of these securities or determined if this prospectus is truthful or
complete. Any representation to the contrary is a criminal offense.
|
|
|
|
|
|
|
|
|
|
Per share
|
|
Total
|
|
| |
|
Initial public offering price |
|
$ |
|
|
$ |
|
|
| |
|
Underwriting discount |
|
$ |
|
|
$ |
|
|
| |
|
Proceeds, before expenses, to us |
|
$ |
|
|
$ |
|
|
| |
|
The
underwriters have the option, exercisable on or before the thirtieth day after the date of this prospectus, to purchase up to an
additional ordinary shares from us
at the public offering price, less the underwriting discounts and commissions, to cover over-allotments, if any.
The
underwriters are offering the ordinary shares as set forth under "Underwriting". Delivery of the shares will be made on or
about , 2012.
|
|
|
|
UBS Investment Bank
|
|
Piper Jaffray
|
|
|
|
|
Needham & Company
|
|
Oppenheimer & Co.
|
The
date of this prospectus is , 2012
Table of Contents
You should rely only on the information contained in this prospectus. We and the underwriters have not authorized anyone to provide you with information different from that
contained in this prospectus. We are offering to sell, and seeking offers to buy, ordinary shares only in jurisdictions where offers and sales are permitted. The information contained in this
prospectus is accurate only as of the date on the front cover of this prospectus, or such other dates as are stated in this prospectus, regardless of the time of delivery of this prospectus or of any
sale of our ordinary shares.
TABLE OF CONTENTS
Prospectus
Through and including , 2012 (25 days after the commencement of
the offering), all dealers effecting transactions
in these securities, whether or not participating in this offering, may be required to deliver a prospectus. This is in addition to the dealer's obligation to deliver a prospectus when acting as an
underwriter and with respect to unsold allotments or subscriptions.
i
Table of Contents
MARKET RANKING AND INDUSTRY DATA
This prospectus includes estimates of market share and industry data and forecasts that we obtained from industry publications and surveys, including
market research firms and government sources, and internal company sources. We commissioned and paid for some of this research. Industry publications, surveys and forecasts generally state that the
information contained therein has been obtained from sources believed to be reliable. In addition, certain market and industry data included in this prospectus, and our position and the positions of
our competitors within these markets, are based on estimates of our management, which are primarily based on our management's knowledge and experience in the markets in which we operate. These
estimates involve risks and uncertainties and are subject to change based on various factors, including those discussed under the heading "Risk Factors" in this prospectus.
Throughout
this prospectus, when we refer to our "addressable" market for PCB laminate materials, or segments of our "addressable" market for PCB laminate materials, we exclude paper and composite
segments, portions of the FR-4 and specialty laminate segments, and the internal Japanese market, none of which are addressed by Isola.
TRADEMARKS AND TRADE NAMES
This prospectus contains registered and unregistered trademarks and service marks of us and our subsidiaries, as well as trademarks and service marks
of third parties. All brand names, trademarks and service marks appearing in this prospectus are the property of their respective holders.
CONVENTIONS THAT APPLY IN THIS PROSPECTUS
Fiscal Year
In this prospectus, unless the context requires otherwise, references to fiscal 2011 are for the fiscal year ending December 31, 2011,
references to fiscal 2010 are for the fiscal year ended January 1, 2011, references to fiscal 2009 are for the fiscal year ended December 26, 2009, references to fiscal 2008 are for the
fiscal year ended December 27, 2008, references to fiscal 2007 are for the fiscal year ended December 29, 2007, references to fiscal 2006 are for the fiscal year ended
December 30, 2006, references to fiscal 2005 are for the fiscal year ended December 31, 2005, and references to fiscal 2004 are for the fiscal year ended December 31, 2004.
Technical Terms
- –>
- "Dielectric"
refers to an electrical insulator that can be polarized by an applied electric field. When a dielectric is placed in an electric field, electric charges
do not flow through the material, as in a conductor, but only slightly shift from their average equilibrium positions causing dielectric polarization.
- –>
- "Dielectric
Constant" refers to a measure of how close a material comes to free space (air) conditions and how constant these conditions hold through the material.
- –>
- "Glass
Transition Temperature" or "Tg" refers to the temperature in Celsius at which the laminate begins to change between a hard, relatively brittle condition and a
viscous, or rubbery, condition.
- –>
- "Lead-free"
refers to laminates or prepreg that are suitable for lead-free soldering in the assembly of finished printed circuit boards. No
laminates or prepreg actually contain the element lead. The distinction is important, however, as lead-free solders melt at higher temperatures than solders containing lead, which require
laminates and prepreg capable of withstanding the stresses of a higher temperature environment.
ii
Table of Contents
- –>
- "Loss",
in the context of a material's characteristics, refers to the ratio of energy dissipated to energy stored.
- –>
- "Prepreg"
is an industry term derived from the contraction of "previously
impregnated". Prepreg is a dielectric material that provides electrical insulation properties. It is manufactured, as the
term suggests, by the impregnation of fabric with specially formulated resin systems that confer specific electrical, thermal and physical properties to the prepreg. While modern prepreg is generally
made from fiberglass fabric, some simple consumer electronics still use prepreg made from paper or paper composite. Prepreg is both a final product and an intermediate-stage product in the manufacture
of copper-clad laminate.
iii
Table of Contents
Prospectus Summary
This summary highlights important information about our business and about this prospectus. This summary does
not contain all of the information that may be important to you. You should carefully read this prospectus in its entirety before making an investment decision. In particular, you should read the
section titled "Risk Factors" and the consolidated financial statements and notes related to those statements included elsewhere in this prospectus. Unless the context indicates otherwise, we use the
terms "Isola", "we", "our", the "Company", and "us" in this prospectus to refer to Isola Group Ltd., and, where appropriate, its consolidated subsidiaries. Unless otherwise indicated, the
information contained in this prospectus assumes the completion of the reorganization as described in this prospectus under "Concurrent Transactions" immediately prior to the consummation of this
offering.
ISOLA GROUP LTD.
Overview
Isola is a leading global material sciences company that designs, develops and manufactures copper-clad laminate ("CCL")
and prepreg (collectively, "laminate materials") used to fabricate advanced multilayer printed circuit boards ("PCBs"). PCBs provide the physical platform for the semiconductors, passive components
and connection circuitry that power and control virtually all modern electronics. We focus on the market for high-performance laminate materials, developing proprietary resins that are
critical to the performance of PCBs used in advanced electronic applications. We continually invest in research and development ("R&D") and believe that our industry-leading resin formulations, many
of which are patented, provide us with a competitive advantage. With 11 manufacturing facilities and three research centers worldwide, as well as a global sales force, we are the largest supplier of
laminate materials to PCB fabricators in the United States and Europe, and we are one of the larger suppliers in our addressable Asian market, based on revenue for fiscal year 2011.
Our
high-performance PCB laminate materials are used in a variety of advanced electronics, including network and communications equipment and high-end consumer electronics, as
well as advanced automotive, aerospace, military and medical applications. Demand in these markets is driven by the rapid growth of bandwidth-intensive high-speed data transmission, the
expansion of the internet, the emergence of cloud computing and the evolution of increasingly complex communications technology. This has led to an urgent need for the development of the underlying
infrastructure to support this growth, including faster and more efficient semiconductor technology. In addition, increasingly pervasive environmental regulations are driving a need for
lead-free compatible, high-performance laminate materials.
We
sell our products globally to leading PCB fabricators, including Ruwel, Sanmina, TTM Technologies, Viasystems and WUS Printed Circuit. These fabricators produce PCBs incorporating our laminate
materials for electronic equipment designed or produced by a broad group of major original equipment manufacturers, or OEMs, including Alcatel-Lucent, Brocade, Cisco, Dell, Ericsson, Google,
Hewlett-Packard, Huawei, IBM and Sun Microsystems (now Oracle). We work closely with these leading PCB fabricators and major OEMs to ensure that our high-performance laminate
materials incorporating our proprietary resins meet the thermal, electrical and physical performance criteria of each new generation of electronic equipment.
We
were acquired in 2004 by a group of investors led by TPG, a global private equity firm, and Redfern Partners, a strategic partner and investor in the laminate materials industry. Under the
direction of TPG and our management, we have undertaken a number of operational changes that have increased manufacturing efficiencies and improved business processes. We believe that these measures,
together with our focus on higher margin high-performance products, provide us with the operating leverage to take advantage of improving economic conditions.
1
Table of Contents
Our
history dates back 100 years to the founding of Isola Werke AG in Germany in 1912. Isola Werke AG manufactured insulators utilizing the then-revolutionary Bakelite plastic
technology, which provided superior insulating and heat resistance properties. We began production of copper-clad epoxy laminates, the direct predecessors of today's PCB laminate products,
in the 1960s. In 2006, we acquired the assets of Polyclad Laminates, Inc., which extended our product portfolio and expanded our business in the growing Asian markets.
For the nine months ended September 29, 2012, our revenue was $437.8 million, our net loss was $64.5 million, and our Adjusted EBITDA was $78.4 million, as compared to
revenue of $459.4 million, net income of $7.1 million, and Adjusted EBITDA of $68.6 million for the nine months ended October 1, 2011. For fiscal 2011, our revenue was
$597.0 million, our net income was $10.0 million, and our Adjusted EBITDA was $86.2 million. For fiscal 2010, our revenue was $612.0 million, our net income was
$1.2 million, and our Adjusted EBITDA was $92.4 million, as compared to revenue of $424.2 million, a net loss of $100.7 million, and Adjusted EBITDA of $31.6 million
in fiscal 2009. For an understanding of our primary non-GAAP metric, Adjusted EBITDA, including reconciliation to net income, see our discussion of non-GAAP financial measures
in "Selected Historical Consolidated Financial and Other Data", included elsewhere in this prospectus.
We continue to shift our product mix towards high-growth, high-margin, high-performance laminates. In 2011, we generated 83% of our gross sales (revenues less
certain adjustments, as described in "Management's Discussion and Analysis of Financial Condition and Results of Operations") from high-performance laminate products, compared to 68% in
2008. For the nine months ended September 29, 2012, high-performance laminate products accounted for 87% of gross sales. We witnessed significant migration towards high-performance
laminates in Asia, our largest market, with the high-performance category generating 92% of gross sales in 2011 compared to 76% in 2008. In Europe, sales of high-performance
laminate products grew from 28% of gross sales in 2008 to 45% of gross sales in 2011. Europe is a distinct market with standard products accounting for a significant portion of our laminate sales.
However, nearly half of the standard products we sell in Europe are sold to less price-sensitive end markets, including applications for industrial and medical equipment. In the Americas,
high-performance laminate products accounted for 98% of gross sales in 2011 compared to 97% in 2008.
Industry Overview and Market Opportunity
Current trends and drivers in the PCB laminate materials industry include:
- –>
- rapidly
expanding infrastructure requirements for high-speed data transmission and increasing demand for high-performance PCB laminate
materials;
- –>
- increased
performance requirements of advanced electronics requiring high-performance PCB laminate materials;
- –>
- growing
demand for environmentally friendly, lead-free compatible laminate materials; and
- –>
- greater
emphasis on collaboration with OEMs and PCB fabricators.
High-performance
PCB laminate materials are defined by their superior performance capabilities achieved primarily through the use of advanced resin formulations. These products compete
primarily on their technological capabilities and are used in circuit boards that combine eight or more layers, with some applications requiring circuit boards with more than 20 layers. Our
high-performance laminate materials have a variety of applications in the markets for servers and storage devices, network communications, advanced automotive electronics,
high-end consumer electronics, military/aerospace equipment, medical equipment and satellite television receivers.
Significant
barriers to entry exist within the high-performance PCB laminate materials industry, including capital intensity, long-term customer relationships characterized by
pre-production collaboration, and lengthy periods (often up to one year) taken by OEMs to qualify laminates for new products. Once a
2
Table of Contents
particular
PCB laminate material is designed in or qualified for use in a specific product line and one or more particular laminate suppliers are selected, these suppliers tend to remain suppliers of
choice, even as the PCBs for these products change to address OEM product line improvements, extensions or next generation developments.
According
to Prismark, an independent research firm, our addressable market for PCB laminate materials was $4.8 billion in 2011. Prismark prepared this analysis at our request, and we paid a
customary fee for its services. A majority of our high-performance product sales are low-loss laminates used primarily in applications for routers and servers. According to
BPA, another independent research firm, the markets for low loss laminate for routers and servers are expected to grow from 2011 to 2015 at compound annual growth rates (CAGRs) of 10% and 6%,
respectively.
Our Competitive Strengths
We believe that we possess the following competitive strengths, which will enable us to continue to grow our business globally:
Product technology leadership. Our significant technology expertise enables us to produce market-leading high-performance PCB laminate materials. We
possess an extensive portfolio of patent and other intellectual property rights covering our proprietary resin formulations and we believe we have pioneered the development of several product
categories with "best in class" technology. Our proprietary resin formulations are capable of supporting complex circuit boards used in the most demanding electronic equipment and differentiate our
products from commonly available, lower-performance materials. We continue to devote considerable efforts to research and develop new resin formulations and other PCB laminate materials to meet
evolving market needs.
Recognized market leadership. We maintain leading market shares, based on revenues, in our
addressable markets in the high-Tg and high-speed digital categories within the high-performance segment for PCB laminate materials. According to Prismark, our
market share in our high-Tg addressable market increased to 30% in 2011 from 29% in 2010; and our market share in our high-speed digital addressable market increased to 45% in
2011 from 37% in 2010. We have an established reputation as an industry leader and product innovator with strong brand recognition, which we believe will play a significant role in our future growth.
Blue-chip customer base served by global strategic manufacturing locations. We have developed strong, long-term relationships with leading
global PCB fabricators and the major OEMs they serve. We believe that these collaborative relationships provide us with a competitive advantage and assist us in bringing new products to market
in a timely manner. As new products gain market acceptance, many OEMs shift high-volume production to lower cost Asian facilities. Because we maintain
state-of-the-art equipment in manufacturing facilities that are strategically located throughout Asia, we are able to seamlessly move laminate production to meet
our customers' needs. In addition, our global network of plants facilitates quick-turn manufacturing and delivery of product, which reduces our customers' inventory levels and shipping
costs.
Streamlined manufacturing with significant operating leverage. We seek to achieve continual improvement in our manufacturing and business processes in order to
improve quality and reduce costs. We use "six sigma" processes and "lean" best practices; we recently completed the implementation of a sophisticated SAP-based enterprise resource planning
("ERP") system across our global operations which has enhanced our production planning and inventory management capabilities on a worldwide basis. In 2009, we closed three of our manufacturing
facilities to improve factory utilization in our remaining facilities, which lowered our fixed and semi-fixed manufacturing costs and improved our remaining manufacturing capacity
utilization. Together with other measures, we estimate that these closures reduced our annual net costs by approximately $30.0 million (with approximately $15.0 million first realized in
fiscal 2009 and approximately $15.0 million first realized in fiscal 2010).
3
Table of Contents
Experienced management team. We have a highly experienced management team comprised of well-respected industry veterans who possess an average of over
20 years of experience in the electronics industry. Our management team has a proven track record of implementing sound
business practices, including focusing our product development on higher margin products, improving the efficiency of our manufacturing facilities and successfully integrating acquired businesses.
Our Growth Strategies
We intend to extend our market leadership in the higher margin, high-performance laminate materials market through the following growth
strategies:
Leverage collaborative relationships and technology leadership to develop innovative solutions. We have implemented focused product development teams to further
expand our relationships with leading PCB fabricators and the OEMs they serve. Our product development teams include members of our research and development, technical support and OEM marketing
groups, all working under the direction of our Chief Technology Officer. Our teams actively monitor OEM product developments and engage in regular dialog with OEMs and their PCB fabricators in
order to anticipate and plan for future electrical, thermal and physical product specifications. Through this collaborative effort, we seek to develop innovative laminate materials solutions that meet
future OEM product requirements.
Further penetrate the Asian market. Many OEMs and PCB fabricators are migrating manufacturing of increasingly complex electronic equipment to Asia. In
addition, several Asian markets are simultaneously undergoing infrastructure build-outs as their economies grow and develop. To supply this market, six of our 11 manufacturing facilities
are located in Asia, and we maintain a sales force dedicated to serving this region. We will seek to capitalize on the opportunities presented by the very large and fast growing Asian markets for
high-performance laminate materials based on the high quality of our products and technology.
Extend high-performance products into new applications. We believe that other markets will benefit from our laminate materials and proprietary resin
formulations, including the markets for advanced automotive equipment and consumer devices such as next generation smart phones and tablets. In addition, we believe that environmental regulations will
become increasingly global and expand the addressable market for our high-performance, lead-free compatible and halogen-free PCB laminate materials. We intend to
devote sales and technical resources to address these growing potential markets.
Opportunistically pursue strategic acquisitions and alliances. We have grown through select acquisitions since we were acquired in 2004. While we believe that our
future success will depend primarily on product innovation from collaborative relationships with our major customers and the OEMs they serve, we may pursue strategic acquisitions that provide
complementary products or technologies.
Risk Factors
An investment in our ordinary shares involves risks. For a discussion of factors you should consider before deciding to invest in our ordinary
shares, we refer you to "Risk Factors" and the following summary:
- –>
- the
markets for our customers' products are volatile, which can cause wide swings in the demand for our products;
- –>
- we
depend upon a relatively small number of customers for a large portion of our sales, and a decline in sales to major customers could harm our results of
operations;
- –>
- we
sell on a purchase order basis and are subject to uncertainties and variability in demand by our customers that could decrease revenues and harm our results of
operations;
- –>
- we
depend on a small number of suppliers for the raw materials and certain components used to manufacture our products. If these suppliers fail to provide an
adequate supply of raw materials or components of sufficient quality, or these suppliers become unavailable to us, we may experience
4
Table of Contents
significant
delays in the manufacturing and shipping of our products to customers and our business could suffer;
- –>
- we
face intense competition in the PCB materials industry, including from diversified manufacturers and suppliers, which could negatively impact our results of
operations and cause our market share to decline;
- –>
- if
demand for high-performance, higher margin products does not increase, our future gross margins and operating results may be worse than expected; and
- –>
- our
failure to respond timely or adequately to market changes may render our existing technology less competitive or obsolete, and our operating results may suffer.
The Principal Sponsors
Our current principal sponsors (the "Principal Sponsors") are:
TPG. TPG Global, LLC (together with its affiliates, "TPG") is a leading private investment firm founded in 1992 with approximately $49 billion of assets
under management as of December 31, 2011 and offices in Fort Worth, Houston, New York, San Francisco, Brazil, Beijing, Chongqing, Hong Kong, Melbourne, Mumbai, Shanghai, Singapore, Tokyo,
London, Luxembourg, Moscow, and Paris. TPG has extensive experience with global public and private investments executed through leveraged buyouts, recapitalizations, spinouts, growth investments,
joint ventures and restructurings. TPG's investments span a variety of industries including financial services, travel and entertainment, technology, industrials, retail, consumer, media and
communications, and healthcare.
Oaktree. Oaktree Capital Management, L.P. (together with its affiliates, "Oaktree") is a premier global alternative and non-traditional
investment manager with approximately $74.9 billion of assets under management as of December 31, 2011. The firm emphasizes an opportunistic, value-oriented and
risk-controlled approach to investments in distressed debt, high-yield bonds, convertible securities, senior loans, corporate control, real estate, emerging market equities and
mezzanine finance. Oaktree was founded in 1995 by a number of
principals who had previously worked together since the mid-1980s. Headquartered in Los Angeles, the firm has over 600 staff members and offices in 13 cities worldwide.
Concurrent Transactions
Corporate Reorganization
Currently, we operate through Isola Group S.à r.l., a holding company incorporated in Luxembourg (the "Luxembourg Holding
Company"), a low-tax jurisdiction. The Luxembourg Holding Company is owned by investors that include TPG, Oaktree, Clearlake Capital and its affiliates, Tennenbaum Capital and its
affiliates, GSO Capital Partners LP (an affiliate of The Blackstone Group LP) and its affiliates, Redfern Partners, LLC and its affiliates and certain members of our management
(collectively, the "Sponsors"). The Sponsors hold their investment in the Luxembourg Holding Company through two parent entities: TPG Hattrick Partners, L.P. (the "Sponsor Limited Partnership")
and TPG Hattrick Holdco, LLC (the "Sponsor Holding Company"). The Sponsor Holding Company is the general partner of the Sponsor Limited Partnership.
The
Sponsor Limited Partnership currently owns all of the issued and outstanding securities of the Luxembourg Holding Company, including 500 common shares and three classes of convertible preferred
certificates (420,455 Class A convertible preferred certificates, 95,788,400 Class B convertible preferred certificates and 43,500,666 Class C convertible preferred certificates)
that are accounted for as debt.
In preparation for our initial public offering, the Sponsor Limited Partnership recently formed a new company, Isola Group Ltd., in the Cayman Islands, a tax-exempt jurisdiction.
Isola Group Ltd. will be our
5
Table of Contents
new holding company and the issuer in this initial public offering. Immediately prior to the completion of our initial public offering, we will undergo a corporate reorganization that includes the
following steps:
- –>
- all
of the outstanding securities of the Luxembourg Holding Company, including the common shares and convertible preferred certificates described above, will be
contributed by the Sponsor Limited Partnership to Isola Group Ltd. which will result in Isola Group Ltd. becoming our new holding company and the Luxembourg Holding Company becoming a
subsidiary of Isola Group Ltd.;
- –>
- both
the Sponsor Limited Partnership and the Sponsor Holding Company will be liquidated and the ordinary shares of Isola Group Ltd. will be distributed to our
Sponsors; and
- –>
- all
outstanding management equity awards in the Sponsor Limited Partnership will be terminated and replaced with new equity awards for ordinary shares of Isola
Group Ltd. that have the same value and substantially the same terms.
At
the completion of our initial public offering:
- –>
- Isola
Group Ltd. will be a public company;
- –>
- assuming
the underwriters do not exercise their over-allotment option, the Principal Sponsors will together own approximately % of our
outstanding ordinary shares, investors in our initial public offering will own approximately % of our outstanding ordinary shares and there will be options outstanding to purchase
approximately % of our outstanding ordinary shares; and
- –>
- the
Sponsors and Isola Group Ltd. will enter into a shareholders' agreement that provides for certain board representation rights and registration rights with
respect to their ordinary shares.
Refinancing
Concurrently with this offering, we expect to enter into a new $ million senior secured revolving credit facility and issue
$ million of senior secured notes due 2019 at an assumed interest rate of %. The proceeds from the issuance of the senior secured notes, together with the net
proceeds of this offering, will be used to repay the remaining outstanding balances under the existing senior secured credit agreement and mezzanine credit agreement as described in "Use of Proceeds".
See "Description of Indebtedness" for a more detailed description of our new revolving credit facility and senior secured notes. This offering, the senior secured notes offering and the closing of the
senior secured revolving credit facility are each conditional upon the closing of the other transactions.
For
an illustration of the pro forma financial impacts of the corporate reorganization and refinancing described above, see "Unaudited Pro Forma Financial Information".
Corporate Information about Isola Group Ltd.
Isola Group Ltd. was incorporated under the laws of the Cayman Islands on September 20, 2011. Our principal executive offices
are located at 3100 W. Ray Road, Suite 301, Chandler, Arizona 85226. The telephone number of our principal executive offices is (480) 893-6527, and we maintain
a website at www.isola-group.com. The information on, or that can be accessed through, our website is not part of this prospectus.
6
Table of Contents
The Offering
|
|
|
| Issuer |
|
Isola Group Ltd. |
Ordinary Shares Offered by Issuer |
|
shares. |
Option to Purchase Additional Shares |
|
We have granted the underwriters a 30-day option to purchase up to an additional ordinary
shares at the initial public offering price less the underwriting discount. |
Ordinary Shares to Be Outstanding Immediately After this Offering |
|
shares. |
Ordinary Shares to be Beneficially Owned by the Sponsors Immediately After this Offering |
|
shares. See "Principal Shareholders". |
Use of Proceeds |
|
We intend to use the net proceeds of this offering, together with the proceeds of the senior secured notes that we have issued, to prepay all of the term loans outstanding under our existing senior
secured credit agreement and mezzanine credit agreement plus interest to the prepayment date. The syndicate of lenders under our existing senior secured credit agreement and mezzanine agreement includes certain of our Sponsors. See "Certain
Relationships and Related Party Transactions—Agreements With Our Sponsors—Loan Agreement and Private Placement of Securities". |
|
|
As of September 29, 2012, we had $210.0 million aggregate principal amount of senior secured term loans outstanding that currently bear interest at a rate of 10% per annum and mature on
September 30, 2015, and $201.0 million aggregate principal amount of unsecured term loans outstanding, plus $4.1 million of accrued paid-in-kind ("PIK") interest, outstanding that currently bear interest at a rate of 16% per annum and
mature on March 24, 2016. See "Use of Proceeds" and "Management's Discussion and Analysis of Financial Condition and Results of Operations—Liquidity and Capital Resources". |
Conditions to This Offering |
|
This offering, the senior secured notes offering and the closing of the senior secured revolving credit facility are each conditional upon the closing of the other transactions. For a discussion of
the conditions precedent to the senior secured notes offering and the senior secured revolving credit facility, see "Description of Indebtedness". |
Dividend Policy |
|
We do not intend to pay cash dividends on our ordinary shares for the foreseeable future. See "Dividend Policy". |
7
Table of Contents
|
|
|
| Lock-up |
|
We, our executive officers and directors and certain holders of our outstanding ordinary shares, stock options and other equity awards that together hold at
least % of our outstanding ordinary shares have agreed with the underwriters, subject to certain exceptions, not to offer, sell, contract to sell or otherwise, directly or indirectly, dispose of or
hedge any of our ordinary shares or securities convertible into or exchangeable or exercisable for our ordinary shares for a period of 180 days after the date of this prospectus. See "Underwriting" for more information. |
Proposed Nasdaq Global Market Symbol |
|
ISLA. |
The number of ordinary shares to be outstanding immediately after this offering as set forth above is based on the number of ordinary shares outstanding at
, 2012, and excludes an aggregate
of additional ordinary shares that will be available for future awards pursuant to our
2012 Equity Incentive Plan.
Unless
otherwise indicated, all information in this prospectus assumes no exercise of the underwriters' option to purchase additional ordinary shares from us.
8
Table of Contents
Summary Historical Consolidated and Pro Forma Financial and Other Data
The following table presents our summary historical consolidated and pro forma financial and other data for the periods and as of the dates
presented. The consolidated statements of operations data and other financial data for fiscal 2011, 2010, and 2009, and the consolidated balance sheet data as of the end of fiscal 2011, are derived
from our audited consolidated financial statements which are included elsewhere in this prospectus. The consolidated statements of operations and other financial data for the nine months ended
September 29, 2012 and October 1, 2011, and the consolidated balance sheet data as of September 29, 2012, are derived from our unaudited interim financial statements for those
periods, which are also included elsewhere in this prospectus. These unaudited interim financial statements have been prepared on a basis consistent with the respective audited consolidated financial
statements and, in the opinion of management, include all adjustments, consisting of normal, recurring adjustments, necessary for a fair presentation of that
information for such periods. The financial data presented for the interim periods are not necessarily indicative of the results for the full year.
The unaudited pro forma financial information has been derived by the application of pro forma adjustments to our historical consolidated financial statements. The unaudited pro forma consolidated
balance sheet as of September 29, 2012 gives effect to the following events as if they had occurred on September 29, 2012. The unaudited pro forma statements of operations for the nine
months ended September 29, 2012 and the year ended December 31, 2011 give effect to the following events as if they had occurred on January 2, 2011:
- –>
- the
issuance of ordinary shares in this offering to investors;
- –>
- the
issuance of $ principal amount of new senior secured notes (at an assumed interest rate of %), the entrance into a new senior secured
revolving credit facility and the reduction of our annual interest expense as a result of the repayment of our existing loans described below;
- –>
- the
application of the net proceeds of this offering, together with the proceeds of the senior secured notes, to repay all of the term loans outstanding under our
existing senior secured and mezzanine credit agreements;
- –>
- the
termination of the TPG Management Agreement; and
- –>
- the
reorganization as Isola Group Ltd. as described under "Prospectus Summary—Concurrent Transactions—Corporate Reorganization".
The summary historical consolidated and pro forma financial and other data below should be read in conjunction with "Use of Proceeds", "Capitalization", "Selected Historical Consolidated Financial and
Other Data", "Unaudited Pro Forma Financial Information", "Management's Discussion and Analysis of Financial Condition and Results of Operations" and the consolidated financial statements and related
notes included elsewhere in this prospectus. The unaudited pro forma financial information is presented for illustrative purposes only, and is based on preliminary estimates and currently available
information and assumptions that our management believes are reasonable. Therefore, the unaudited pro forma balance sheet as of September 29, 2012 and the unaudited pro forma statements of
operations for the nine months ended September 29, 2012 and the year ended December 31, 2011 are not necessarily indicative of the financial position or results of operations that would
have been achieved had the foregoing events occurred on September 29, 2012 and January 2, 2011, respectively, nor is it indicative of our results to be expected for any future period. A
number of factors may affect our results. See "Forward-Looking Statements" and "Risk Factors".
9
Table of Contents
|
|
|
|
|
|
|
|
|
|
|
|
|
|
|
|
|
|
|
|
|
|
|
|
|
|
|
Pro forma |
|
For the
nine months ended |
|
Fiscal year |
|
|
|
For the
nine
months
ended
September 29,
2012
|
|
Fiscal
year
2011
|
|
September 29,
2012
|
|
October 1,
2011
|
|
2011
|
|
2010
|
|
2009
|
|
| |
|
|
|
(dollars in thousands,
except share data)
|
|
Consolidated Statement of Operations Data: |
|
|
|
|
|
|
|
|
|
|
|
|
|
|
|
|
|
|
|
|
|
|
Revenues |
|
|
|
|
|
|
|
$ |
437,804 |
|
$ |
459,448 |
|
$ |
596,989 |
|
$ |
611,987 |
|
$ |
424,199 |
|
Cost of goods sold |
|
|
|
|
|
|
|
|
310,585 |
|
|
350,669 |
|
|
455,404 |
|
|
467,751 |
|
|
342,832 |
|
| |
|
|
|
|
|
|
|
|
|
|
|
|
|
|
|
Gross profit |
|
|
|
|
|
|
|
|
127,219 |
|
|
108,779 |
|
|
141,585 |
|
|
144,236 |
|
|
81,367 |
|
| |
|
|
|
|
|
|
|
|
|
|
|
|
|
|
|
Operating expenses: |
|
|
|
|
|
|
|
|
|
|
|
|
|
|
|
|
|
|
|
|
|
|
| |
Sales, general and administrative |
|
|
|
|
|
|
|
|
59,647 |
|
|
57,057 |
|
|
77,545 |
|
|
65,271 |
|
|
61,816 |
|
| |
Research and development |
|
|
|
|
|
|
|
|
9,248 |
|
|
7,913 |
|
|
10,653 |
|
|
9,532 |
|
|
9,239 |
|
| |
Restructuring |
|
|
|
|
|
|
|
|
(76 |
) |
|
462 |
|
|
1,250 |
|
|
4,782 |
|
|
17,497 |
|
| |
Loss on liquidation of subsidiary |
|
|
|
|
|
|
|
|
— |
|
|
— |
|
|
— |
|
|
— |
|
|
3,548 |
|
| |
|
|
|
|
|
|
|
|
|
|
|
|
|
|
|
| |
|
Total operating expenses |
|
|
|
|
|
|
|
|
68,819 |
|
|
65,432 |
|
|
89,448 |
|
|
79,585 |
|
|
92,100 |
|
| |
|
|
|
|
|
|
|
|
|
|
|
|
|
|
|
Operating income / (loss) |
|
|
|
|
|
|
|
|
58,400 |
|
|
43,347 |
|
|
52,137 |
|
|
64,651 |
|
|
(10,733 |
) |
Other income—net |
|
|
|
|
|
|
|
|
2,382 |
|
|
1,375 |
|
|
1,629 |
|
|
4,758 |
|
|
1,268 |
|
Embedded derivative gain / (loss)—net |
|
|
|
|
|
|
|
|
(45,890 |
) |
|
27,959 |
|
|
42,256 |
|
|
21,165 |
|
|
(27,513 |
) |
Interest expense(1) |
|
|
|
|
|
|
|
|
(62,840 |
) |
|
(59,544 |
) |
|
(80,210 |
) |
|
(72,134 |
) |
|
(54,893 |
) |
Interest income |
|
|
|
|
|
|
|
|
79 |
|
|
138 |
|
|
221 |
|
|
339 |
|
|
567 |
|
Foreign exchange gain / (loss)—net |
|
|
|
|
|
|
|
|
1,920 |
|
|
(4,132 |
) |
|
4,833 |
|
|
9,596 |
|
|
(2,083 |
) |
| |
|
|
|
|
|
|
|
|
|
|
|
|
|
|
|
Income / (loss) before taxes |
|
|
|
|
|
|
|
|
(45,949 |
) |
|
9,143 |
|
|
20,866 |
|
|
28,375 |
|
|
(93,387 |
) |
Provision for income taxes(2) |
|
|
|
|
|
|
|
|
(18,593 |
) |
|
(2,075 |
) |
|
(10,893 |
) |
|
(27,158 |
) |
|
(7,339 |
) |
| |
|
|
|
|
|
|
|
|
|
|
|
|
|
|
|
Net income / (loss) |
|
|
|
|
|
|
|
$ |
(64,542 |
) |
$ |
7,068 |
|
$ |
9,973 |
|
$ |
1,217 |
|
$ |
(100,726 |
) |
| |
|
|
|
|
|
|
|
|
|
|
|
|
|
|
|
Net income / (loss) per common share |
|
|
|
|
|
|
|
|
|
|
|
|
|
|
|
|
|
|
|
|
|
|
| |
Basic |
|
|
|
|
|
|
|
$ |
(129.08 |
) |
$ |
14.14 |
|
$ |
19.95 |
|
$ |
2.43 |
|
$ |
(201.45 |
) |
| |
Diluted |
|
|
|
|
|
|
|
$ |
(129.08 |
) |
$ |
14.14 |
|
$ |
19.95 |
|
$ |
2.43 |
|
$ |
(201.45 |
) |
Weighted average number of common and common equivalent shares outstanding |
|
|
|
|
|
|
|
|
|
|
|
|
|
|
|
|
|
|
|
|
|
|
| |
Basic |
|
|
|
|
|
|
|
|
500 |
|
|
500 |
|
|
500 |
|
|
500 |
|
|
500 |
|
| |
Diluted |
|
|
|
|
|
|
|
|
500 |
|
|
500 |
|
|
500 |
|
|
500 |
|
|
500 |
|
|
|
|
|
|
|
|
|
|
|
|
|
|
Pro
Forma |
|
|
|
|
|
|
|
Nine months
ended |
|
|
|
|
|
Nine
months
ended
September 29,
2012
|
|
|
|
|
|
Fiscal year |
|
|
|
September 29,
2012
|
|
|
|
2011
|
|
| |
|
|
|
|
|
(dollars in thousands)
|
|
Consolidated Balance Sheet Data: |
|
|
|
|
|
|
|
|
|
|
Cash |
|
|
|
|
$ |
60,171 |
|
$ |
47,481 |
|
Current assets |
|
|
|
|
|
232,729 |
|
|
206,909 |
|
Current liabilities |
|
|
|
|
|
145,270 |
|
|
130,478 |
|
Working capital |
|
|
|
|
|
87,459 |
|
|
76,431 |
|
Long-term debt and capital lease obligations |
|
|
|
|
|
352,454 |
|
|
331,592 |
|
Convertible preferred certificates |
|
|
|
|
|
218,560 |
|
|
208,009 |
|
Embedded derivative liability |
|
|
|
|
|
74,666 |
|
|
28,924 |
|
Total liabilities |
|
|
|
|
|
860,729 |
|
|
772,952 |
|
Common stock and additional paid in capital |
|
|
|
|
|
35,186 |
|
|
33,284 |
|
Total stockholders' deficiency |
|
|
|
|
|
(468,259 |
) |
|
(404,778 |
) |
10
Table of Contents
|
|
|
|
|
|
|
|
|
|
|
|
|
|
|
|
|
|
|
|
|
|
|
|
|
Pro Forma |
|
For the
nine months ended |
|
Fiscal year |
|
|
|
For the nine
months ended
September 29,
2012
|
|
Fiscal
year
2011
|
|
September 29,
2012
|
|
October 1,
2011
|
|
2011
|
|
2010
|
|
2009
|
|
| |
|
|
|
(dollars in thousands)
|
|
Other Financial Data: |
|
|
|
|
|
|
|
|
|
|
|
|
|
|
|
|
|
|
|
|
|
|
Adjusted EBITDA(3) |
|
|
|
|
|
|
|
$ |
78,354 |
|
$ |
68,635 |
|
$ |
86,183 |
|
$ |
92,365 |
|
$ |
31,625 |
|
- (1)
- Interest expense for the nine months ended September 29, 2012 was $62.8 million (comprised of cash interest expense of $28.1 million and non-cash
interest expense of $34.7 million). Non-cash interest expense includes the amortization of deferred loan origination costs, the amortization of original issue discount, interest
paid-in-kind ("PIK") on the debt under our mezzanine credit agreement and the accretion of interest on our convertible preferred certificates. We intend to use the proceeds of
this offering to reduce our current indebtedness and to refinance the remaining balance of our current indebtedness with the proceeds from the issuance of $ million of senior
secured notes bearing interest at % per annum. If such transactions had occurred as of the end of fiscal 2011, our total interest expense would have been
$ million
for the nine months ended September 29, 2012, and our cash interest expense would have been $ million for the nine months ended September 29, 2012. See "Unaudited
Pro Forma Financial Information".
- (2)
- Provision for income taxes and net income / (loss) were impacted by unfavorable changes in our uncertain tax positions, after the effect of valuation allowances, in
the amount of
$2.5 million for fiscal 2011, $9.8 million for fiscal 2010 and $3.5 million for fiscal 2009. The unfavorable impact in fiscal 2010 resulted from changes in estimates of prior
years' positions arising out of an ongoing examination by taxing authorities in Germany. During fiscal 2011, a favorable adjustment reduced the provision for income taxes in the amount of
$12.1 million as a result of settlements with taxing authorities in Germany and Taiwan.
- (3)
- Adjusted EBITDA is a supplemental non-GAAP measure used by management and external users of our consolidated financial statements. We define Adjusted EBITDA as net
income / (loss) plus (i) interest expense and interest income, net, (ii) provision for income taxes, (iii) depreciation and amortization and (iv) certain additional
adjustments. These additional adjustments include stock-based compensation, restructuring charges, foreign exchange gain / (loss)—net, goodwill impairment, management fees paid to
TPG, embedded derivatives gain / (loss)—net, expenses related to this offering and a gain related to the settlement of a patent infringement dispute in fiscal 2010. For more
information on Adjusted EBITDA and a reconciliation of net income (loss), the most directly comparable financial measure under accounting principles generally accepted in the U.S.
("U.S. GAAP"), to Adjusted EBITDA for the periods presented, see footnote 3 to "Selected Historical Consolidated Financial and Other Data". Because not all companies use identical
calculations, our presentation of Adjusted EBITDA may not be comparable to other similarly titled measures of other companies.
11
Table of Contents
Risk Factors
An investment in our ordinary shares involves a high degree of risk. You should carefully consider the
following information, together with other information in this prospectus, before buying our ordinary shares. If any of the following risks or uncertainties occur, our business, results of operations
and financial condition could be materially adversely affected. In that case, the trading price of our ordinary shares could decline, and you may lose all or a part of the money you paid to buy our
ordinary shares.
RISKS RELATED TO OUR INDUSTRY AND BUSINESS
The markets for our customers' products are volatile, which can cause wide swings in the demand for our products.
Our business depends on the electronics industry, which is cyclical and subject to significant downturns characterized by diminished product demand,
rapid declines in average selling prices and over-capacity. This industry has experienced periods characterized by relatively low demand and price depression and is likely to experience
recessionary periods in the future. Economic conditions affecting the electronics industry in general, or specific market segments, such as computers and communications, have adversely affected our
operating results in the past and may do so in the future.
Over
the past three years, the global economy has been greatly impacted by the recessionary conditions linked to rising default levels in the U.S. home mortgage sector, volatile fuel prices, and a
changing political and economic landscape. These factors have contributed to historically low consumer confidence levels, resulting in a significantly intensified downturn in demand for products
incorporating PCBs, which in turn lowered demand for our products and adversely affected our operating results. When we experience excess capacity, variable margins from our revenues may not fully
cover our fixed overhead expenses, and our gross margins may fall. A lasting economic recession, excess manufacturing capacity, or a prolonged decline in the electronics industry could negatively
affect our business, results of operations, and financial condition.
In order to respond to quick-turn orders and offer short lead times at some of our production facilities, in some cases as little as 12 to 48 hours, these facilities must operate at less
than full capacity. However, if we do not receive as many quick-turn orders as we expect at these facilities and have foregone other production, we may underutilize our manufacturing
capacity.
We depend upon a relatively small number of customers for a large portion of our sales, and a decline in sales to major customers could harm our results of operations.
A small number of customers, which include PCB manufacturers and distributors, are responsible for a significant portion of our sales. Our ten
largest customers accounted for approximately 63% of our revenue for the nine months ended September 29, 2012 and 61% of our revenue in fiscal 2011. Our single largest customer (Viasystems and
its subsidiaries) accounted for approximately 15% of our revenue for the nine months ended September 29, 2012 and 16% our revenue in fiscal 2011. Although we cannot assure you that our
principal customers will continue to purchase our products at past levels, we expect to continue to depend upon a relatively small number of customers for a significant portion of our revenue. Our
customer concentration could fluctuate, depending on future customer requirements, which will depend in large part on conditions in the end-markets in which our customers operate. The loss
of one or more significant customers or a decline in sales to our significant customers could harm our business, results of operations, and financial condition and lead to declines in the trading
price of our ordinary shares.
In
addition, during industry downturns, we may need to reduce prices and we may be unable to collect payments from our customers. There can be no assurance that key customers will not cancel orders,
or that
12
Table of Contents
Risk Factors
they
will continue to place orders with us in the future at the same levels as experienced by us in prior periods, or that they will be able to meet their payment obligations. This concentration of
customers may materially and adversely affect our operating results due to the loss or cancellation of business from any of these key customers, significant changes in scheduled deliveries to any of
these customers, or decreases in the prices of the products sold to any of these customers.
We sell on a purchase order basis and are subject to uncertainties and variability in demand by our customers that could decrease revenues and harm our operating results.
We sell to customers on a purchase order basis and not pursuant to long-term contracts. Customers may cancel their orders, reduce
production quantities or delay production at any time for a number of reasons. Many of our customers have, over the past several years, experienced significant decreases in demand for their products
and services. The uncertain economic conditions in the global economy and in several of the markets in which our customers operate have in the past prompted some of our customers to cancel orders,
delay the delivery of some of the products that we manufacture or order fewer products than we previously anticipated. Consequently, our sales are subject to short-term variability in
demand by our customers. In the past, we have been required to increase staffing and other expenses in order to meet the anticipated demand of our customers. The level and timing of orders placed by
our customers may vary due to:
- –>
- changes
in our customers' inventory levels;
- –>
- changes
in customers' manufacturing strategies;
- –>
- demand
fluctuations for our customers' products; and
- –>
- changes
in new product introductions.
Future
terminations, reductions, or delays in our customers' orders could harm our business, results of operations, and financial condition. Variability in demand from our customers may contribute to
fluctuations in our quarterly results, which may make our revenues more difficult to accurately forecast.
In
addition, we have experienced a gradual shift of revenue to Asia where our customers typically have negotiated longer payment terms than in our other regions. Our days' sales outstanding ("DSOs")
in Asia are generally between 85 to 95 days while DSOs in the Americas are between 45 to 50 days and in Europe are between 35 to 45 days.
While
this revenue shift has not historically had a materially adverse effect on our financial position, operating results or cash flows, as sales to Asia increase, the increase in our accounts
receivable could have an increasingly adverse effect on our working capital position.
Just
as we extend relatively long payment terms to our customers in Asia, our vendors in Asia also extend relatively long payment terms to us. As our business in Asia expands, short-term
vendor financing also increases. For more information, see "Management's Discussion and Analysis of Financial Condition and Results of Operations—Liquidity and Capital
Resources—Liquidity".
We depend on a small number of suppliers for the raw materials and certain components used to manufacture our products. If these suppliers fail to provide an adequate supply of raw materials or components of sufficient
quality, or these suppliers become unavailable to us, we may experience significant delays in the manufacturing and shipping of our products to customers and our business could suffer.
We depend on a small number of suppliers for the raw materials, including copper, resin and fiberglass, as well as certain components, used in the
manufacture of our products. These suppliers must comply with Isola's stringent specifications and technical requirements. Our reliance on these suppliers involves
13
Table of Contents
Risk Factors
significant
risks and uncertainties, including whether they will provide an adequate supply of required raw materials or components of sufficient quality, will not increase prices for the raw
materials or components and will perform their obligations on a timely basis. If we are unable to obtain raw materials or components from third-party suppliers in the quantities and of the quality
that we require on a timely basis and at acceptable prices, we may not be able to deliver our products on a timely or cost-effective basis to our customers, which could cause customers to
end their business with us, reduce our gross profit and seriously harm our business, results of operations and financial condition. Moreover, if any of our suppliers becomes financially unstable, we
may have to find new suppliers. It may take several months to locate alternative suppliers, if required. We may experience significant delays in manufacturing and shipping our products to customers
and incur additional development, manufacturing and other costs to establish alternative sources of supply if we lose any of these sources. We cannot predict if we will be able to obtain replacement
raw materials and components within the time frames that we require at an affordable cost, or at all.
There may be shortages of, or price fluctuations with respect to, raw materials or components, which would cause us to curtail our manufacturing or incur higher than expected costs.
We purchase the raw materials and certain components we use in producing our products, and we may be required to bear the risk of price fluctuations
of raw materials or components. Shortages of raw materials and price fluctuations have occurred in the past and may occur in the future. The cost of copper foil comprises approximately half of the
total cost of our raw materials. Copper prices have been particularly volatile in the last four years, declining to less than $3,000 per ton in late 2008 and increasing to more than $10,000 per ton
during fiscal 2011. Although historically we have been able to pass through a substantial portion of the raw material cost increases
to our customers, we may not continue to be able to do so in the future if we experience significant supply disruptions or excess levels of industry capacity or due to other factors outside of our
control, in which case our profitability could suffer. We generally experience a delay of approximately one to two months from the time when costs of raw materials change until we are able to make
corresponding price adjustments. Our ability to pass through raw material price increases may also be limited by the level of industry excess capacity, competitive practices and other
regional-specific factors which are out of our control. In addition, if we experience a shortage of materials or components, we may not be able to produce products for our customers in a timely
fashion.
In addition, the SEC adopted rules required by the Dodd-Frank Act of 2010 that impose new annual disclosure and reporting requirements for public companies to report their use of "conflict
minerals" originating from the Democratic Republic of Congo and its nine immediate neighbors. The new requirements are effective for 2013 with a reporting deadline of May 31, 2014 for affected
issuers. The current list of "conflict minerals" under the Dodd-Frank Act includes gold, tantalum, tin and tungsten (although additional minerals may be added in the future). To the best
of our knowledge, the only metal which is added to our products is copper foil, which is not currently listed as a "conflict mineral." If any of the metals used in our products are classified as
"conflict minerals" in the future, there may only be a limited pool of suppliers who provide conflict-free metals, and we cannot assure you that we will be able to obtain products in
sufficient quantities or at competitive prices.
We are vulnerable to an increase in the cost of energy.
Our production processes require us to use substantial amounts of power. In the past several years, there has been a significant increase in global
energy prices. Changes in the cost or availability of energy resources, including oil, gas and electricity, are beyond our control and could materially increase our cost of operations. We maintain
only limited back-up power generation facilities at some of our manufacturing locations. In the event of a power shortage, we could be required to cease operations at an affected facility
14
Table of Contents
Risk Factors
until power is restored. There can be no assurance that our facilities will avoid material utility-based interruptions, which could have a material adverse effect on our results of operations and
financial condition.
We may experience significant fluctuations in results of operations from period to period.
Our periodic results may vary significantly depending on various factors, many of which are beyond our control. These factors include:
- –>
- the
volume of customer orders;
- –>
- changes
in demand for customers' and OEMs' products;
- –>
- pricing
and other competitive pressures;
- –>
- our
effectiveness in managing manufacturing processes;
- –>
- changes
in cost and availability of raw materials and labor;
- –>
- changes
in our product mix;
- –>
- changes
in political and economic conditions; and
- –>
- local
factors and events that may affect our production volume, such as local holidays.
Our
sales may, from time to time, shift from one period to the next, affecting anticipated results. See "Management's Discussion and Analysis of Financial Condition and Results of
Operations—Results of Operations" for more information about our period to period results and the effect of these factors on them.
If demand for high-performance, higher margin products does not increase, our future gross margins and operating results may be worse than expected.
We typically earn lower gross margins on certain of our base, low-Tg products and higher gross margins on certain of our
high-performance laminate materials. We experience continued pressure from customers to reduce prices, and competition remains intense, particularly in Asia. This pricing pressure has
affected, and could continue to adversely affect, our gross margins. If demand for our high-performance, higher margin products does not increase in the future, our gross margins and
operating results may be worse than expected.
Our failure to respond timely or adequately to market changes may render our existing technology less competitive or obsolete, and our operating results may suffer.
The market for our products is characterized by continuing product development and changing technologies. The success of our business depends in part
upon our ability to maintain and enhance our technological capabilities, develop and market products and services that meet changing customer needs and successfully anticipate or respond to
technological product platform changes on a cost-effective and timely basis. There can be no assurance that we will effectively respond to the technological product requirements of the
changing market, including having sufficient cash flow to make additional capital expenditures that may be required as a result of those changes. To the extent we are unable to respond to such
technological product requirements, our operating results may suffer.
15
Table of Contents
Risk Factors
Our customers require our products to undergo a lengthy and expensive qualification process which does not assure follow-on product sales. If we are unsuccessful or delayed in qualifying any of our products with a
customer, our business and operating results would suffer.
In general, OEMs require that our products undergo an extensive qualification process, which may involve testing of our products for
performance and reliability. This qualification process may continue for several months or even up to one year in certain cases. Moreover, qualification of a product by a customer does not assure any
sales of the product to that customer. After our products are qualified, it can take several months or more before the customer commences volume production of components or systems that incorporate
our products. Despite these uncertainties, we devote substantial resources, including design, engineering, sales, marketing and management efforts, to qualifying our products with customers in
anticipation of sales. If we are unsuccessful or delayed in qualifying any of our products with a customer, sales of those products to the customer may be precluded or delayed, which may impede our
growth and cause our business to suffer.
In
addition, we work closely with OEMs to develop products that are well suited to their changing needs. We will not recover the cost of this product development directly even if we are
actually engaged as a supplier to an OEM's product line, and there can be no guarantee that such collaborations will result in any sales of our products to such OEM.
Our products may contain design or manufacturing defects, which could result in reduced demand for our services and liability claims against us.
We manufacture products that are highly complex and need to meet increasingly demanding technical and quality requirements. These products may
contain design or manufacturing errors or failures, despite our quality control and quality assurance efforts. Defects in the products we manufacture, whether caused by a design, manufacturing, or
materials failure or error, may result in delayed shipments, customer dissatisfaction, a reduction or cancellation of purchase orders, or liability claims against us. If these defects occur frequently
or in large quantities, our reputation may be impaired. Although our invoices and sales arrangements contain provisions designed to limit our exposure to product liability and related claims, existing
or future laws or unfavorable judicial decisions could negate these provisions. Product liability litigation against us, even if it were unsuccessful, would be time-consuming and costly to
defend. We may not maintain technology errors and omissions insurance at any given time for all or certain of our operations, and we may not be able to purchase such insurance coverage in the future
on terms that are satisfactory to us, if at all. Moreover, such coverage may not be sufficient to cover actual losses.
We face intense competition in the PCB materials industry, including from diversified manufacturers and suppliers, which could negatively impact our results of operations and cause our market share to decline.
The PCB materials industry is intensely competitive, and we compete worldwide in the markets for such materials. Our principal competitors are
substantially larger and have greater financial resources than us, and our operating results may be affected by our ability to maintain our competitive positions in these markets. Some of our
competitors and potential competitors may have advantages over us, including:
- –>
- greater
financial and manufacturing resources that can be devoted to the development, production, and sale of their products;
- –>
- more
established and broader sales and marketing channels;
- –>
- manufacturing
facilities that are located in countries with lower production costs;
- –>
- more
manufacturing facilities worldwide, some of which are closer in proximity to PCB fabricators;
16
Table of Contents
Risk Factors
- –>
- lower
capacity utilization, which in peak market conditions can result in shorter lead times to customers;
- –>
- ability
to add additional capacity faster or more efficiently;
- –>
- preferred
vendor status with existing and potential customers;
- –>
- greater
name recognition; and
- –>
- larger
customer bases.
In
addition, these competitors may respond more quickly to new or emerging technologies, adapt more quickly to changes in customer requirements or devote greater resources to the development,
promotion, and sale of their products than we do.
Consolidation trends among our customers could adversely affect our business.
In recent years, a number of our customers have consolidated and further consolidation of customers may continue. If an existing customer is not the
controlling entity of the supply chain function following a consolidation, we may not be retained as a preferred or approved supplier. In addition, product duplication could result in the termination
of a product line that we currently support. While there is potential for increasing our position with the combined customer, our revenues may decrease if we are not retained as a supplier. We may
also be subject to increased pricing pressure from the combined customer because of its increased market share.
Our international sales and operations subject us to additional risks that could adversely affect our operating results.
We derive, and expect to continue to derive, a significant portion of our revenue from international sales in various Asian and European markets.
Sales in non-U.S. markets accounted for approximately 84% of our total revenue for the nine months ended September 29, 2012 as well as for fiscal 2011. Moreover, we manufacture a
significant
portion of our products in manufacturing facilities outside of the United States. Our international revenue and operations are subject to a number of material risks, including, but not limited to:
- –>
- difficulties
in staffing, managing and supporting operations in multiple countries;
- –>
- rising
costs of labor in certain countries;
- –>
- difficulties
in enforcing agreements and collecting receivables through foreign legal systems and other relevant legal issues;
- –>
- fewer
legal protections for intellectual property;
- –>
- foreign
and U.S. taxation issues and international trade barriers;
- –>
- difficulties
in obtaining any necessary governmental authorizations for the export of our products to certain foreign jurisdictions;
- –>
- potential
fluctuations in foreign economies;
- –>
- government
currency control and restrictions on repatriation of earnings;
- –>
- fluctuations
in the value of foreign currencies and interest rates;
- –>
- general
economic and political conditions in the markets in which we operate;
- –>
- the
taking of our property or property we lease by foreign governments;
17
Table of Contents
Risk Factors
- –>
- domestic
and international economic or political changes, social unrest, hostilities and other disruptions in regions where we currently operate or may operate in
the future; and
- –>
- different
and changing legal and regulatory requirements in the jurisdictions in which we currently operate or may operate in the future.
Negative
developments in any of these areas in one or more countries could result in a reduction in demand for our products, the cancellation or delay of orders already placed, threats to our
intellectual property, difficulty in collecting receivables, and a higher cost of doing business, any of which could negatively impact our business, financial condition or results of operations.
Moreover, our sales, including sales to customers outside the United States, are primarily denominated in U.S. dollars, and downward fluctuations in the value of foreign currencies relative to the
U.S. dollar may make our products more expensive than other products, which could harm our business.
As of September 29, 2012, approximately 128 of our employees (or 6.4% overall) were members of one of the following unions: in Singapore, the United Workers of Electronic and Electrical
Industries; in Germany, IG Metall; and in Italy, FEMCA CISL and FILTEA CGIL. Although our relationship with these unions generally has been satisfactory and we have not experienced any labor disputes
or strikes, any future labor disputes or strikes involving either us or our customers could negatively affect our revenue, profitability and operations. A labor dispute involving another supplier to
our customers that results in a slowdown or closure of our customers' facilities could also have an adverse effect on our business.
We
operate in countries that have experienced political unrest or instability or government controls over the conduct of business, including China and countries in Southeast Asia. Recently, in China,
labor disputes and strikes based partly on wages have slowed or stopped production at certain
manufacturers. In some cases, employers have responded by significantly increasing the wages of workers at such plants. In addition, regulatory authorities and others have increased their scrutiny of
labor conditions in countries in which we operate. To the extent such developments result in more burdensome labor laws and regulations or require us to increase the wages of employees, our ability to
adequately staff our plants and the costs associated with the manufacture and shipping of our products in those jurisdictions could be adversely affected, which would have a material adverse effect on
our business and operating results. For more information about how these factors affect our results of operation, see "Management's Discussion and Analysis of Financial Condition and Results of
Operations—Results of Operations".
Our leverage and our debt service obligations may adversely affect our cash flow.
As of September 29, 2012, we had total indebtedness of approximately $572.7 million, and a stockholders' deficiency of
$468.3 million. After giving effect to the application of the proceeds from this offering (at an assumed initial public offering price of $ per share, the midpoint of
the range
set forth on the cover of this prospectus) and the proceeds from the concurrent issuance of $ million of senior secured notes, as set forth in "Use of Proceeds", and the effective
conversion of our convertible preferred certificates to equity, we expect our total indebtedness to be $ million. Although we expect that our new
$ million
senior secured revolving credit facility will be undrawn at the closing of this offering, any subsequent borrowings under the senior secured revolving credit facility will further increase our total
indebtedness.
Our
indebtedness and resulting financial leverage could have significant negative consequences, including:
- –>
- increasing
our vulnerability to general adverse economic and industry conditions;
- –>
- requiring
the use of a substantial portion of our cash flow from operations to service our indebtedness, thereby reducing the amount of cash flow available for other
purposes, including capital expenditures;
18
Table of Contents
Risk Factors
- –>
- limiting
our flexibility in planning for, or reacting to, changes in our business and the industry in which we compete; and
- –>
- placing
us at a possible competitive disadvantage to less leveraged competitors and competitors that have better access to capital resources.
Our new senior secured revolving credit facility and the indenture governing the senior secured notes will each contain financial and operating covenants that will limit our
management's discretion with respect to certain business matters. Among other things, these covenants will restrict our ability and our subsidiaries' ability to incur additional debt, create liens or
other encumbrances, make investments, change the nature of our business, sell or otherwise dispose of assets and merge or consolidate with other entities. A failure to comply with these covenants
could result in an event of default under the senior secured revolving credit facility or the indenture governing the senior secured notes which, if not cured or waived, could result in the
acceleration of the indebtedness. See "Description of Indebtedness" for a more detailed description of our new senior secured notes and revolving credit facility.
If we fail to protect, or incur significant costs in defending, our intellectual property and other proprietary rights, our business and results of operations could be materially harmed. If we seek or obtain injunctions
against third parties in the course of defending our intellectual property rights, our relationships with customers or OEMs that use affected products could be adversely impacted.
Our success depends in part on our ability to protect our intellectual property and other proprietary rights. We rely primarily on patents,
trademarks, copyrights, trade secrets and unfair competition laws to protect our intellectual property and other proprietary rights. Significant technology used in our products, however, is not the
subject of any patent protection, and we may be unable to obtain patent protection on such technology in the future. In addition, we may fail to protect our title in our registered intellectual
property, such as our patents and trademarks, by failing to timely record evidence of our legal ownership in applicable intellectual property offices. Moreover, existing U.S. legal standards relating
to the validity, enforceability and scope of protection of intellectual property rights offer only limited protection, may not provide us with any competitive advantages, and may be challenged by
third parties. In addition, the laws of foreign countries in which
we manufacture and market our products may afford little or no effective protection of our intellectual property. Accordingly, despite our efforts, we may be unable to prevent third parties from
infringing upon or misappropriating our intellectual property or otherwise gaining access to our technology. In addition to the legal methods that we use to protect our intellectual property described
above, we may elect to manufacture certain of our products in the United States, where manufacturing costs are higher, in order to better protect our intellectual property. Unauthorized third parties
may try to copy or reverse engineer our products or portions of our products or otherwise obtain and use our intellectual property. This could result in third parties manufacturing and selling
competitive products that employ our technologies. If we fail to protect our intellectual property and other proprietary rights, our business, results of operations or financial condition could be
materially harmed.
In addition, defending our intellectual property rights may entail significant expense. We have, from time to time, resorted to legal proceedings to protect our intellectual property and may continue
to do so in the future. For example, on June 25, 2012, our wholly-owned U.S. subsidiary, Isola USA Corp. ("Isola USA") filed a patent infringement lawsuit against Taiwan Union Technology
Corporation ("TUC"), and another patent infringement lawsuit against Park Electrochemical Corporation, Nelco Products, Inc. and Neltec, Inc. (collectively, "Park"), each in United States
District Court. Each of these actions alleges infringement of patents that provide enhanced thermal electrical properties in laminate materials used to fabricate PCBs. On August 14, 2012, Isola
USA amended these complaints against TUC and Park to add a third patent to the lawsuits. These ongoing lawsuits seek money damages and injunctions against TUC and
19
Table of Contents
Risk Factors
the Defendants to prevent infringement of the applicable patents. On August 17, 2012, Isola USA filed a complaint against TUC with the United States International Trade Commission ("USITC"),
seeking to enforce an earlier consent order enjoining TUC from importing products that infringe other of our patents. On October 3, 2012, we were informed that the USITC instituted an
enforcement proceeding to determine whether TUC is in violation of the previously issued consent order and what, if any, enforcement measures are appropriate. For more information, see
"Business—Legal Proceedings". Any of our intellectual property rights may be challenged by others, including TUC or Park, or invalidated through administrative processes or litigation. The
proceedings against TUC and Park, and any other legal proceedings that we initiate in the future to enforce our intellectual property rights or to determine the validity and scope of the intellectual
property or other proprietary rights of others, could result in significant expense to us and divert the attention and efforts of our management and technical employees, even if we prevail. If
unsuccessful, these efforts could also result in the limitation, invalidation or loss of the intellectual property rights we sought to enforce. In addition, the proceedings against TUC and Park,
including our requests for injunctions against TUC and Park from infringing on the applicable patents, could adversely impact our relationship with certain customers or OEMs that also utilize affected
products sold by TUC or Park. Finally, during the course of any patent litigation, including the proceedings against TUC and Park, there may be public announcements of the results of hearings,
motions, and other interim proceedings or developments in the litigation. If securities analysts or investors regard these announcements as negative, the market price of our ordinary shares may
decline. General proclamations or statements by key public figures may also have a negative impact on the perceived value of our intellectual property.
We may be subject to attempts by others to gain unauthorized access to our information technology systems, which could result in third-party claims and harm our business and results of operations.
We face attempts by others to gain unauthorized access through the Internet to our information technology systems. If successful, these attempts
could harm our business, our products, or our customers and end users. We seek to detect and investigate these security incidents and to prevent their occurrence, but in some cases we might be unaware
of an incident or its magnitude and effects. The theft or unauthorized use or publication of our trade secrets and other confidential business information as a result of such an incident could
adversely affect our competitive position and reduce marketplace acceptance of our products; the value of our investment in R&D, product development, and marketing could be reduced; and third parties
might assert against us or our customers claims related to resulting losses of confidential or proprietary information or end-user data, or system reliability. Our business could be
subject to significant disruption, and we could suffer monetary and other losses, including the cost of product recalls and returns and reputational harm, in the event of such incidents and claims.
We may be sued by third parties for alleged infringement of their proprietary rights, which could be costly, time-consuming to defend and limit our ability to use certain technologies in the future.
Because our competitors and others actively seek patent protections, we may in the future be subject to claims that our technologies infringe upon
third parties' intellectual property or other proprietary rights. In addition, the vendors from which we license technology used in our products or our customers could become subject to similar
infringement claims. Any claims, with or without merit, could be time-consuming and expensive to defend, and could divert our management's attention away from the execution of our business
plan. Moreover, any settlement or adverse judgment resulting from the claim could require us to pay substantial amounts or obtain a license to continue to use the technology that is the subject of the
claim, or otherwise restrict or prohibit our use of the technology. There can be no assurance that we would be able to obtain a license from the third party asserting the claim on commercially
reasonable terms, or at all; that
20
Table of Contents
Risk Factors
we
would be able to develop alternative technology on a timely basis, if at all; or that we would be able to obtain a license to use a suitable alternative technology to permit us to continue
offering, and our customers to continue using, our affected product. In addition, we may be required to indemnify our vendors or customers for third-party intellectual property infringement claims,
which would increase the cost to us of an adverse ruling in such a claim. An adverse determination could also
prevent us from offering our products to others. Infringement claims asserted against us or our vendors or customers may have a material adverse effect on our business, results of operations or
financial condition.
Our confidentiality, assignment of invention and other intellectual property-related agreements with employees and others may not adequately protect our intellectual property rights or prevent the disclosure of our trade
secrets and other proprietary information.
We rely substantially upon proprietary information, trade secrets and know-how to conduct our manufacturing operations and research and
development activities. We take steps to protect our proprietary rights and information, including the use of confidentiality, non-disclosure, invention-assignment and other agreements with our
employees and consultants and in our commercial relationships, including with distributors and customers. However, these steps may be inadequate. Confidentiality agreements used in some of our
commercial relationships expire after a stated term. In addition, these agreements may be violated, and there may be no adequate remedy available for any such violation. To the extent that our
employees and consultants use intellectual property owned by others in their works for us, disputes may arise as to the rights in related or resulting inventions and know-how. Furthermore, our
employees and consultants may not agree to assign us their rights in any inventions that result from their work for us, which could adversely affect our exclusive rights in such inventions and any
patents that claim such inventions. Moreover, we cannot assure you that our proprietary information will be kept confidential or that we can meaningfully protect our trade secrets. Our competitors may
independently develop substantially equivalent proprietary information or may otherwise gain access to our trade secrets, which could adversely affect our ability to compete in the market.
We depend on the experience and expertise of our senior management team and key technical employees, and the loss of any key employee may impair our ability to operate effectively.
Our success depends upon the continued services of our senior management team and key technical employees, particularly in our research and
development department. Each of our executive officers, key technical personnel and other employees could terminate his or her relationship with us at any time. The loss of any member of our senior
management team might significantly delay or prevent the achievement of our business objectives and could materially harm our business and customer relationships. In addition, because of the highly
technical nature of our business, the loss of any significant number of our existing engineering and project management personnel could have a material adverse effect on our business and operating
results.
Furthermore,
our manufacturing process requires a skilled labor force. Although we are not generally dependent on any one employee or a small number of employees involved in our manufacturing process,
we have in the past experienced periods of high employee turnover and may in the future experience significantly high employee turnover at our Asian facilities. If we are not able to replace these
people with new employees with comparable capabilities, our operations could suffer as we may be unable to keep up with innovations in the industry or the demands of our customers. As a result, we may
not be able to continue to compete effectively.
21
Table of Contents
Risk Factors
Unfavorable tax law changes, unfavorable government reviews of our tax returns, changes in our geographical earnings mix, or imposition of withholding taxes on repatriated earnings could adversely affect our effective
tax rate and our operating results.
Our operations are subject to income and transaction taxes in the United States and other jurisdictions. A change in the tax laws in the
jurisdictions in which we do business, including an increase in tax rates or an adverse change in the treatment of an item of income or expense, could result in a material increase in the amount of
taxes we incur. In particular, proposals have been made to change certain U.S. tax laws relating to foreign entities with U.S. connections. Legislation has been proposed that would require treating
certain foreign corporations as U.S. domestic corporations (and therefore taxable on all of their worldwide income) if the management and control of the foreign corporation occurs, directly or
indirectly, primarily within the United States. In addition, the U.S. government has proposed various other changes to the U.S. international tax system, certain of which could adversely impact
foreign-based multinational corporate groups, and increased enforcement of U.S. international tax laws. Although these U.S. tax law changes may not be enacted in their current forms, it is possible
that these or other changes in the U.S. tax laws could significantly increase our U.S. income tax liability in the future.
We
are subject to periodic audits or other reviews by tax authorities in the jurisdictions in which we conduct our activities. Audits can result in increased tax payments, penalties and interest,
which would affect our results of operation and cash position (particularly if we were required to settle a significant claim with a lump sum payment). Provision for income taxes and net income /
(loss) were impacted by unfavorable changes in our uncertain tax positions, after the effect of valuation allowances, in the amount of $2.5 million for fiscal 2011, $9.8 million for
fiscal 2010 and $3.5 million for fiscal 2009. The unfavorable impact in fiscal 2010 resulted from changes in estimates of prior years' positions arising out of an ongoing examination by taxing
authorities in Germany. During fiscal 2011, a favorable adjustment reduced income tax expense in the amount of $12.1 million as a result of settlements with taxing authorities in Germany and
Taiwan.
Because
we conduct operations in multiple jurisdictions, our effective tax rate is influenced by the amounts of income and expense attributed to each such jurisdiction. If such amounts were to change
so as to increase the amounts of our net income subject to taxation in higher-tax jurisdictions, or if we were to commence operations in jurisdictions assessing relatively higher tax
rates, our effective tax rate could be adversely affected.
In
addition, we may determine that it is advisable from time to time to repatriate earnings from subsidiaries, under circumstances which could give rise to the imposition of potentially significant
withholding taxes by the jurisdictions in which such amounts were earned, without our receiving the benefit of any offsetting tax credits, which also could adversely impact our effective tax rate.
We are subject to risks of currency fluctuations.
A portion of our cash and other current assets is held in currencies other than the U.S. dollar. As of September 29, 2012, we had
approximately $39 million of current assets held by subsidiaries with a functional currency other than the U.S. dollar. Changes in exchange rates among other currencies and the U.S. dollar will
affect the value of these assets as translated to U.S. dollars in our balance sheet. To the extent that we ultimately decide to repatriate some portion of these funds to the United States, the actual
value transferred could be impacted by movements in exchange rates. Any such type of movement could negatively impact the amount of cash available to fund operations or to repay debt. Significant
inflation or disproportionate changes in foreign exchange rates could occur as a result of general economic conditions, acts of war or terrorism, changes in governmental monetary or tax policy, or
changes in local interest rates.
22
Table of Contents
Risk Factors
The impact of future exchange rate fluctuations between the U.S. dollar and other currencies cannot be predicted. To the extent that we may have outstanding indebtedness denominated in other
currencies, the appreciation of other currencies against the U.S. dollar will have an adverse impact on our financial condition and results of operations.
Our failure to comply with the requirements of environmental laws could result in litigation, fines and revocation of permits necessary to our manufacturing processes.
Our operations are regulated under a number of international, federal, state, local, and foreign environmental and safety laws and regulations that
govern, among other things, the discharge of hazardous materials into the air and water, as well as the handling, storage, and disposal of such materials. Because we use hazardous materials and
generate hazardous wastes in our manufacturing processes, we may be subject to potential financial liability for costs associated with the investigation and remediation of our own sites, or sites at
which we have arranged for the disposal of hazardous wastes, if such sites become contaminated. Even if we fully comply with applicable environmental laws and are not directly at fault for the
contamination, we may still be liable.
Although
in recent periods the Company has not incurred any material environmental costs, any material violations of environmental laws or failure to maintain required environmental permits could
subject us to fines, penalties, and other sanctions, including the revocation of our effluent discharge permits, which could require us to cease or limit production at one or more of our facilities,
and harm our business, results of operations, and financial condition. Even if we ultimately prevail, environmental lawsuits against us would be time consuming and costly to defend.
Environmental
laws could become more stringent over time, imposing greater compliance costs and increasing risks and penalties associated with violation. We operate in environmentally sensitive
locations, and we are subject to potentially conflicting and changing regulatory agendas of political, business, and environmental groups. We are increasingly required to certify compliance with
various material content restrictions in our products based on laws of various jurisdictions or territories such as the Restriction of Hazardous Substances ("RoHS") and Registration, Evaluation,
Authorization and Restriction of Chemicals ("REACH") directives in the European Union and China's RoHS legislation. In addition, our customers or the OEMs they supply may adopt more stringent
environmental requirements for their products in response to political or social pressure. Changes or restrictions on discharge limits, emissions levels, material storage, handling or disposal or
increasingly stringent certification requirements might require a high level of unplanned capital investment or facility or materials relocation. It is possible that environmental compliance costs and
penalties from new or existing regulations may harm our business, results of operations, and financial condition. See "Business—Regulation".
Our business and operations could be adversely impacted by climate change initiatives.
Our manufacturing processes require that we purchase significant quantities of energy from third parties, which results in the generation of
greenhouse gasses, either directly on-site or indirectly at electric utilities. Both domestic and international legislation to address climate change by reducing greenhouse gas emissions
and establishing a price on carbon could create increases in energy costs and price volatility. Considerable international attention is now focused on development of an international policy framework
to guide international action to address climate change. Proposed and existing legislative efforts to control or limit greenhouse gas emissions could affect our energy source and supply choices as
well as increase the cost of energy and raw materials derived from sources that generate greenhouse gas emissions.
23
Table of Contents
Risk Factors
Damage to our manufacturing facilities due to fire, natural disaster, or other events could harm our financial results.
We have manufacturing facilities in the United States in Arizona, California and South Carolina. We also have manufacturing facilities in Germany,
Italy, China, Singapore, Malaysia and Taiwan. The destruction or closure of any of our facilities for a significant period of time as a result of fire, explosion, blizzard, act of war or terrorism,
flood, tornado, earthquake, lightning, or other natural disaster could harm us financially, increasing our costs of doing business and limiting our ability to deliver our products on a timely basis.
We may engage in future acquisitions or dispositions that could disrupt our business, cause dilution to our shareholders or adversely impact our financial condition and operating results.
In the future we may acquire companies or assets of companies or dispose of portions of our business in order to enhance our market position or
strategic strengths. We are not currently a party to any agreements or commitments, and we have no understandings with respect to any such acquisitions or dispositions. We may not be able to find
suitable acquisition candidates, and we may not be able to complete acquisitions or dispositions on favorable terms, if at all, even after devoting substantial resources to them. If we do complete
acquisitions or dispositions, we cannot be sure that they will ultimately strengthen our competitive position or that they will not be viewed negatively by customers, financial markets, or investors.
In addition, any acquisitions that we make could lead to difficulties in integrating personnel and operations from the acquired businesses and in retaining and motivating key personnel from these
businesses. Acquisitions or dispositions may disrupt our ongoing operations, divert management from day-to-day responsibilities, increase our expenses, and adversely impact our
operating results or financial condition. Future acquisitions may reduce our cash available for operations and other uses and could result in an increase in amortization expense related to
finite-lived intangible assets acquired, potentially dilutive issuances of equity securities, or the incurrence of debt, any of which could adversely affect our financial condition and operating
results.
We are an emerging growth company and cannot be certain if the reduced disclosure requirements applicable to emerging growth companies will make our ordinary shares less attractive to investors.
We are an "emerging growth company" under the Jumpstart Our Business Startups Act of 2012 (the "JOBS Act"), and may take advantage of certain
exemptions from various reporting requirements that are applicable to other public companies that are not emerging growth companies including, but not limited to, not being required to comply with the
auditor attestation requirements of Section 404 of the Sarbanes-Oxley Act, reduced disclosure obligations regarding executive compensation in our periodic reports and proxy statements, and
exemptions from the requirements of holding a nonbinding advisory vote on executive compensation and shareholder approval of any golden parachute payments not previously approved. We cannot predict if
investors will find our ordinary shares less attractive because we will rely on these exemptions. If some investors find our ordinary shares less attractive as a result, our stock price may be lower
than it otherwise would be, there may be a less active trading market for our ordinary shares and our stock price may be more volatile.
We will remain an emerging growth company until the earliest of (i) the last day of our fiscal year during which we have total annual gross revenues of at least $1.0 billion; (ii) the
last day of our fiscal year ending after the fifth anniversary of the completion of this offering; (iii) the date on which we have, during the previous three-year period, issued more than $1.0
billion in non-convertible debt; or (iv) the date on which we are deemed to be a "large accelerated filer" under the Securities Exchange Act of 1934 as amended (the "Exchange Act").
24
Table of Contents
Risk Factors
We will incur significantly increased costs as a result of operating as a public company, and our management will be required to devote substantial time to new compliance initiatives.
We have never operated as a public company. As a public company, we will incur significant legal, accounting and other expenses that we did not incur
as a private company. There may be further increases if and when we are no longer an "emerging growth company". In preparation for our initial public offering, we have increased our personnel devoted
to legal, accounting and human resources matters and have implemented additional procedures to improve compliance and effectiveness in these functional areas. In addition, the Sarbanes-Oxley Act of
2002, the Dodd-Frank Act of 2010, and rules subsequently implemented and yet to be implemented by the Securities and Exchange Commission and Nasdaq have imposed and will impose various new
requirements on public companies, including requiring changes in corporate governance practices. Our management and other personnel will need to devote a substantial amount of time to these new
compliance initiatives. Moreover, these rules and regulations will increase our legal and financial compliance costs and will make some activities more time-consuming and costly,
particularly after we are no longer an "emerging growth company". For example, we expect these new rules and regulations to make it more difficult and more expensive for us to obtain director and
officer liability insurance, and we may be required to incur substantial costs to maintain the same or similar coverage.
In addition, the Sarbanes-Oxley Act requires, among other things, that we maintain effective internal control over financial reporting and disclosure controls and procedures. In particular, we must
perform system and process evaluation and testing of our internal control over financial reporting to allow management and, when we are no longer an "emerging growth company" under the JOBS Act, our
independent registered public accounting firm, to report on the effectiveness of our internal control over financial reporting, as required by Section 404 of the Sarbanes-Oxley Act. Compliance
will require us to increase our general and administrative expense in order to pay added compliance personnel, outside legal counsel and consultants to assist us in, among other things, external
reporting, instituting and monitoring a more comprehensive compliance function and board governance function, establishing and maintaining internal controls over financial reporting in accordance with
Section 404
of the Sarbanes-Oxley Act, and preparing and distributing periodic public reports in compliance with our obligations under the U.S. federal securities laws. We currently do not have an internal audit
group, and we will evaluate the need to hire additional accounting and financial staff with appropriate public company experience and technical accounting knowledge. Moreover, if we are not able to
comply with the requirements of Section 404 in a timely manner, the market price of our stock could decline and we could be subject to sanctions or investigations by Nasdaq, the Securities and
Exchange Commission or other regulatory authorities, which would require additional financial and management resources.
25
Table of Contents
Risk Factors
We have in the past and may in the future identify material weaknesses in our internal control over financial reporting. If we fail to maintain an effective system of internal controls in the future, we may not be able
to accurately report our financial results or prevent fraud. As a result, current and potential shareholders could lose confidence in our financial reporting, which could harm our business and the trading price of our stock.
In
2011, in preparation for this offering, we and our independent registered public accounting firm identified a material weakness in our internal controls over financial reporting, which we
substantially remediated as of the end of the second quarter of 2012. Under standards established by the Public Company Accounting Oversight Board, a material weakness is a deficiency, or combination
of deficiencies, in internal control over financial reporting such that there is a reasonable possibility that a material misstatement of our financial statements will not be prevented or detected and
corrected in a timely manner. Our internal control deficiencies resulted in material adjustments to our previously issued consolidated financial statements for fiscal years 2004 through 2009 and to
our consolidated financial statements for fiscal 2010 and the six months ended July 2, 2011. These material adjustments were not previously identified by us because we had limited resources
within the accounting function possessing a requisite level of technical experience in the selection and application of certain accounting principles. Management and our independent registered public
accounting firm determined that internal controls over identifying and evaluating complex transactions required strengthening. The accounting principles at issue included distinguishing liabilities
from equity, accounting for derivatives and hedging, determination of functional currency and accounting for stock-based compensation for securities issued by the Sponsor Limited Partnership.
In January 2012, we determined that our internal control deficiencies resulted in the need for additional material adjustments to our previously issued consolidated financial statements. The need for
these adjustments resulted in the restatement of our previously issued consolidated financial statements and related to the accounting for derivatives and hedging, the presentation of the results of
operations and cash flows from the liquidation of MAS Italia s.r.l. the presentation on the balance sheet and in the statement of cash flows related to an entrustment loan in China and the related
restricted cash and the presentation in the results of operations of withholding tax expense on dividends paid by certain of our subsidiaries.
Beginning
in the third quarter of fiscal 2011, we implemented changes and improvements in our internal control over financial reporting to address the underlying causes of our material weakness
(including hiring a Director of External Reporting, who has experience working in the accounting departments of public companies; continuing to recruit additional accounting and finance personnel;
engaging outside technical accounting and financial advisors on an ongoing basis; and requiring our accounting and financial staff to attend professional courses or seminars regarding accounting
pronouncements and the additional complexities and reporting requirements of a public company), which we have substantially remediated as of the end of the second quarter of 2012. We cannot assure you
that the measures we took will be effective in mitigating or preventing significant deficiencies or material weaknesses in our internal control over financial reporting in the future. Any failure to
maintain or implement required new or improved controls, or any difficulties we encounter in their implementation, could result in additional material weaknesses or cause us to fail to meet our
periodic reporting obligations.
We will be required, pursuant to Section 404 of the Sarbanes-Oxley Act, to furnish a report by management on, among other things, the effectiveness of our internal control over financial
reporting with our second Annual Report on Form 10-K after the completion of this offering. This assessment will need to include disclosure of any material weaknesses identified by
our management in our internal control over financial reporting. However, our independent registered public accounting firm will not be required to formally attest to the effectiveness of our internal
control over financial reporting pursuant to Section 404 until the
26
Table of Contents
Risk Factors
later of the year following our first annual report required to be filed with the SEC, or the date we are no longer an emerging growth company.
If we cease to be an emerging growth company, our independent registered accounting firm would be required to perform the work necessary to render an opinion on our internal controls, which could be
costly and time consuming. In addition, even if our management concludes that our internal controls are effective, our independent registered public accounting firm, if required to render an opinion
on our internal controls, may issue a report that is adverse if it is not satisfied with our controls or the level at which our controls are documented, designed, operated or reviewed, or if it
interprets the relevant requirements differently from us. In response, we may need to undertake various actions, such as implementing additional internal controls and procedures or hiring additional
accounting and internal control staff. During the course of the evaluation, documentation or attestation, we or our independent registered accounting firm may identify one or more material weaknesses
that could result in errors in our financial statements, cause us to fail to meet our reporting obligations and cause investors to lose confidence in our reported financial information, leading to a
decline in the trading price of our stock.
We have elected under the JOBS Act to delay the adoption of new or revised accounting pronouncements applicable to public companies until such pronouncements are made applicable to private companies.
Under the JOBS Act, an "emerging growth company" can delay the adoption of certain accounting standards until those standards would otherwise apply
to private companies. We intend to take advantage of this extended transition period. Since we will not be required to comply with new or revised accounting standards on the relevant dates on which
adoption of such standards is required for other public companies, our financial statements may not be comparable to financial statements of companies that comply with public company effective dates.
We are subject to the Foreign Corrupt Practices Act ("FCPA"). A determination that we violated this act may affect our business and operations adversely.
We are subject to the regulations imposed by the FCPA, which generally prohibits companies that are publicly listed in the U.S. and their
intermediaries from making improper payments to foreign officials for the purpose of obtaining or keeping business. In connection with our initial public offering, we are implementing policies and
procedures to train our personnel in FCPA compliance matters. Any determination that we have violated the FCPA could have a material adverse effect on our financial position, operating results and
cash flows.
RISKS RELATED TO THIS OFFERING AND OWNERSHIP OF OUR ORDINARY SHARES
We are controlled by the Sponsors, whose interests may not be aligned with yours.
Prior to the completion of this offering, the Sponsors own, directly or indirectly, % of our outstanding ordinary shares. After giving
effect to this offering, assuming an offering
of ordinary
shares, the Sponsors will control, directly or indirectly, approximately % of our ordinary shares, assuming no
exercise of the underwriters' option to purchase additional shares. In addition, at the completion of this offering, we will enter into a shareholders' agreement with our Sponsors that will give each
of TPG and Oaktree the right to nominate representatives to our board of directors and require our Sponsors to vote for the election of these nominees to our board of directors, so long as TPG and
Oaktree own specified percentages of our outstanding voting securities. See "Certain Relationships and Related Party Transactions—Agreements with Our Sponsors—Shareholders and
Registration Rights Agreement". As a result, the Sponsors will continue to be able to control the election of our directors, determine our
27
Table of Contents
Risk Factors
corporate
and management policies and determine, without the consent of our other shareholders, the outcome of any corporate transaction or other matter submitted to our shareholders for approval,
including potential mergers or acquisitions, asset sales and other significant corporate transactions. The Sponsors will also have sufficient voting power to amend our organizational documents. The
interests of the Sponsors may not coincide with the interests of other holders of our ordinary shares.
Furthermore,
each of the Sponsors is in the business of making investments in companies and may, from time to time, acquire and hold interests in businesses that compete directly or indirectly with
us. The Sponsors may also pursue, for their own accounts, acquisition opportunities that may be complementary to our business, and as a result, those acquisition opportunities may not be available to
us. Our memorandum and articles of association do not prohibit the Sponsors, or any of their respective officers, directors, agents, employees, shareholders, members, partners, affiliates and
subsidiaries, or any of our directors, from acquiring an interest or expectancy in corporate opportunities, and do not impose upon such persons or entities any duty to disclose such potential
corporate opportunities to us or refrain from competing with us, even if such opportunities are ones we or our subsidiaries might reasonably be deemed to have pursued or had the desire to pursue.
Furthermore, such persons or entities may take such corporate opportunities for themselves or offer them to other persons or entities. Our Sponsors may also consider combining our operations with
those of another company. So long as the Sponsors continue to own a significant amount of our outstanding ordinary shares, they will continue to be able to strongly influence or effectively control
our decisions, including potential mergers or acquisitions, asset sales and other significant corporate transactions.
We will be a "controlled company" within the meaning of Nasdaq rules and, as a result, will qualify for and will rely on exemptions from certain corporate governance requirements.
After completion of this offering, the Sponsors will continue to control a majority of the voting power of our outstanding ordinary shares. As a
result, we will be a "controlled company" within the meaning of the corporate governance standards of Nasdaq. Under Nasdaq rules, a company of which more than 50% of the voting power is held by a
person or group of persons acting together is a "controlled company" and may elect not to comply with certain corporate governance requirements of Nasdaq, including the requirements that:
- –>
- a
majority of the board of directors consists of independent directors;
- –>
- the
nominating and corporate governance committee is composed entirely of independent directors with a written charter addressing the committee's purpose and
responsibilities;
- –>
- the
compensation committee be composed entirely of independent directors with a written charter addressing the committee's purpose and responsibilities; and
- –>
- there
is an annual performance evaluation of the nominating and corporate governance and compensation committees.
We
have adopted charters for our audit, nominating and corporate governance and compensation committees, intend to conduct annual performance evaluations for these committees, and initially expect all
of our committee members and a majority of our board of directors to be considered independent directors under the independence criteria of Nasdaq. Although we intend to comply with these listing
requirements whether or not we are a controlled company, there is no guarantee that we will not take advantage of the exemptions available to "controlled companies" in the future. Accordingly, you may
not have the same protections afforded to shareholders of companies that are subject to all of the corporate governance requirements of Nasdaq.
28
Table of Contents
Risk Factors
Shareholder rights under Cayman Islands law may differ materially from shareholder rights in the United States, which could adversely affect the ability of us and our shareholders to protect our and their interests.
We are a company incorporated under the laws of the Cayman Islands. Our corporate affairs are governed by our memorandum and articles of association,
by the Companies Law of the Cayman Islands and the common law of the Cayman Islands, as amended and restated from time to time. The rights of shareholders to take action against the directors, actions
by minority shareholders and the fiduciary responsibilities of our directors to us under Cayman Islands law are to a large extent governed by the common law of the Cayman Islands. The common law in
the Cayman Islands is derived in part from comparatively limited judicial precedent in the Cayman Islands as well as from English common law, the decisions of whose courts are of persuasive authority
but are not binding on a court in the Cayman Islands. In particular, some states, such as Delaware, have more fully developed and judicially interpreted bodies of corporate laws. Moreover, we could be
involved in a corporate combination in which dissenting shareholders would have no rights comparable to appraisal rights which would otherwise ordinarily be available to dissenting shareholders of
United States corporations. Also, our Cayman Islands counsel is not aware of a significant number of reported class actions or derivative actions having been brought in Cayman Islands courts. Such
actions are ordinarily available in respect of United States corporations in U.S. courts. Finally, Cayman Islands companies may not have standing to initiate shareholder derivative actions before the
federal courts of the United States. As a result, our public shareholders may face different considerations in protecting their interests in actions against the management, directors or the Sponsors
than would shareholders of a corporation incorporated in a jurisdiction in the United States, and our ability to protect our interests may be limited if we are harmed in a manner that would otherwise
enable us to sue in a United States federal court. See "Description of Share Capital—Differences in Corporate Law".
Certain provisions of our charter documents could discourage, delay or prevent a merger or acquisition at a premium price.
Our memorandum and articles of association will contain provisions that:
- –>
- permit
us to issue, without any further vote or action by our shareholders, 25,000,000 preferred shares in one or more series and, with respect to each series, to
fix the number of shares constituting the series and the designation of the series, the voting powers (if any) of the shares of such series, and the preferences and other special rights, if any, and
any qualifications, limitations or restrictions, of the shares of the series; and
- –>
- at
such time as we are no longer a "controlled company", will allow our board of directors to establish a classified board, and limit the ability of shareholders to
call extraordinary general meetings or act by written consent in lieu of a meeting (we believe that such action by written consent would be impractical after the consummation of this offering, even
while we are a "controlled company," because it requires unanimous shareholder approval under the laws of the Cayman Islands).
The
foregoing provisions may impose various impediments to the ability of a third party to acquire control of us, even if a change in control would be beneficial to our existing shareholders.
As a holder of the ordinary shares, you may have difficulty obtaining or enforcing a judgment against us because we are incorporated under the laws of the Cayman Islands.
Because we are a Cayman Islands company, there is uncertainty as to whether the Grand Court of the Cayman Islands would recognize or enforce
judgments of United States courts obtained against us predicated upon the civil liability provisions of the securities laws of the United States or any state thereof,
29
Table of Contents
Risk Factors
or
be competent to hear original actions brought in the Cayman Islands against us predicated upon the securities laws of the United States or any state thereof.
An active trading market for our ordinary shares may not develop, and you may not be able to sell your ordinary shares at or above the initial public offering price.
Prior to this offering, there has been no public market for our ordinary shares. Although we have applied to have our ordinary shares quoted on the
Nasdaq Global Market, an active trading market for our ordinary shares may never develop or be sustained following this offering. If no trading market develops, securities analysts may not initiate or
maintain research coverage of our Company, which could further depress the market for our ordinary shares. As a result, investors may not be able to sell their ordinary shares at or above the initial
public offering price or at the time that they would like to sell.
If equity research analysts do not publish research or reports about our business or if they issue unfavorable commentary or downgrade our ordinary shares, the price of our ordinary shares could decline.
The trading market for our ordinary shares will rely in part on the research and reports that equity research analysts publish about us and our
business. We do not control these analysts. The price of our stock could decline if one or more equity analysts downgrade our stock or if those analysts issue other unfavorable commentary or cease
publishing reports about us or our business.
The market price of our ordinary shares may be volatile, which could result in substantial losses for investors purchasing shares in this offering.
The initial public offering price for our ordinary shares will be determined through negotiations with the underwriters. This initial public offering
price may vary from the market price of our ordinary shares after the offering. Some of the factors that may cause the market price of our ordinary shares to fluctuate include:
- –>
- the
failure of securities analysts to cover our ordinary shares after this offering, or changes in financial estimates or recommendations by analysts;
- –>
- actual
or anticipated variations in our or our competitors' operating results;
- –>
- failure
by us or our competitors to meet analysts' projections or guidance that we or our competitors may give the market;
- –>
- volatility
in our operating performance;
- –>
- future
sales of our ordinary shares;
- –>
- investor
perceptions of us and the industry;
- –>
- the
public's reaction to our press releases, our other public announcements and our filings with the Securities and Exchange Commission;
- –>
- general
economic conditions; and
- –>
- the
other factors described elsewhere in these "Risk Factors".
In
addition, if the market for stocks of companies in our industry or the stock market in general experiences a loss of investor confidence, the trading price of our ordinary shares could decline for
reasons unrelated to our business, financial condition or results of operations. If any of the foregoing occurs, it could cause our stock price to fall and may expose us to class action lawsuits that,
even if unsuccessful, could be costly to defend and a distraction to management.
30
Table of Contents
Risk Factors
We may not be able to obtain capital when desired on favorable terms, if at all, or without dilution to our shareholders.
We anticipate that the net proceeds of this offering, together with current cash, cash equivalents, cash provided by operating activities, funds from
the senior secured notes and funds available from our new senior secured revolving credit facility that we expect to enter into upon the closing of this offering will be sufficient to meet our current
and anticipated needs for general corporate purposes. It is possible, however, that we may not generate sufficient cash flow from operations or otherwise have the capital resources to meet our future
capital needs, refinance our indebtedness or take advantage of acquisition opportunities. If this occurs, we may need additional financing to execute on our current or future business strategies,
including to:
- –>
- hire
additional engineers and other personnel;
- –>
- develop
new or enhance existing products;
- –>
- enhance
our operating infrastructure;
- –>
- acquire
complementary businesses or technologies; or
- –>
- otherwise
respond to competitive pressures.
If
we raise additional funds through the issuance of convertible debt or equity securities, the percentage ownership of our shareholders could be significantly diluted, and these newly issued
securities may have rights, preferences or privileges senior to those of existing shareholders, including those acquiring shares in this offering. We cannot assure you that additional financing will
be available on terms favorable to us, or at all. If adequate funds are not available or are not available on acceptable terms, if and when needed, our ability to fund our operations, take advantage
of unanticipated opportunities, develop or enhance our products, or otherwise respond to competitive pressures would be significantly limited.
A significant portion of our total outstanding shares may be sold into the public market in the near future, which could cause the market price of our ordinary shares to drop significantly, even if our business is doing
well.
Sales of a substantial number of our ordinary shares in the public market could occur at any time after the expiration of the lock-up
agreements described in "Underwriters". These sales, or the market perception that the holders of a large number of shares intend to sell shares, could reduce the market price of our ordinary shares.
After this offering, we will
have ordinar
y shares outstanding based on the number of shares outstanding as
of , 2012.
This includes
the shares
that we
are selling in this offering, which may be resold in the public market immediately. The
remaining sh
ares, or % of our outstanding shares after this offering, will be able
to be sold, subject to any applicable volume limitations under U.S. federal securities laws, in the near future as set forth below.
In
addition, the Sponsors have certain registration rights, which they may exercise in order to sell their shares through a registration statement filed by us on their behalf. For more information,
see "Certain Relationships and Related Party Transactions—Agreements with Our Sponsors—Shareholders and Registration Rights Agreement".
We plan to offer stock awards, which have the potential to dilute shareholder value and cause the price of our ordinary shares to decline.
We expect to offer stock awards to our directors, officers and employees, some of which may be vested at the time of this offering. If the stock
awards are vested and exercised, and those shares are sold into the
31
Table of Contents
Risk Factors
public
market, the market price of our ordinary shares may decline. In addition, the availability of ordinary shares for award under any equity incentive plan that we adopt, or the grant of stock
awards, may adversely affect the market price of our ordinary shares.
If you purchase ordinary shares sold in this offering, you will experience immediate and substantial dilution because our existing holders of ordinary shares paid substantially less than the initial public offering price
for your shares.
You will experience immediate and substantial dilution of $ in pro forma net tangible book value per share because the price that you
pay will be substantially greater than the net tangible book value per share of the shares you acquire, based on the net tangible book value per share as
of , 2012.
This dilution is due
in large part to the fact that our earlier investors paid substantially less than the initial public offering price when they purchased their shares.
We do not currently intend to pay dividends on our ordinary shares and, consequently, your ability to achieve a return on your investment will depend on appreciation in the price of our ordinary shares.
Isola Group Ltd. has never declared or paid any cash dividends on its ordinary shares. We currently intend to invest our future earnings, if
any, to fund our growth and do not anticipate paying cash dividends on our ordinary shares in the future. In addition, the instruments currently governing our indebtedness contain covenants that place
limitations on the amount of
dividends we may pay. Therefore, you are not likely to receive any dividends on your ordinary shares for the foreseeable future.
32
Table of Contents
Forward-looking Statements
This prospectus contains "forward-looking statements". All statements other than statements of historical fact are "forward-looking"
statements for purposes of the U.S. federal and state securities laws. These statements may be identified by the use of forward-looking terminology such as "anticipate", "believe", "continue",
"could", "estimate", "expect", "intend", "may", "might", "plan", "potential", "predict", "should" or "will" or the negative thereof or other variations thereon or comparable terminology. In
particular, statements about our expectations, beliefs, plans, objectives, assumptions or future events or performance contained in this prospectus under the headings "Prospectus Summary", "Risk
Factors", "Management's Discussion and Analysis of Financial Condition and Results of Operations" and "Business" are forward-looking statements.
We
have based these forward-looking statements on our current expectations, assumptions, estimates and projections. While we believe these expectations, assumptions, estimates and projections are
reasonable, such forward-looking statements are only predictions and involve known and unknown risks and uncertainties, many of which are beyond our control. These and other important factors,
including those discussed in this prospectus under the headings "Prospectus Summary", "Risk Factors", "Management's Discussion and Analysis of Financial Condition and Results of Operations" and
"Business", may cause our actual results, performance or achievements to differ materially from any future results, performance or achievements expressed or implied by these forward-looking
statements. Some of the key factors that could cause actual results to differ from our expectations include:
- –>
- adverse
developments in the global economy;
- –>
- our
dependence on growth in our customers' businesses;
- –>
- our
ability to remain competitive in the markets we serve;
- –>
- our
inability to continue to develop, manufacture and market innovative, customized products and services that meet customers' requirements for performance and
reliability;
- –>
- any
failure of our suppliers to provide us with raw materials;
- –>
- termination
of our key contracts, including technology license agreements, or loss of our key customers;
- –>
- our
inability to protect our intellectual property;
- –>
- our
failure to realize anticipated benefits from completed acquisitions, divestitures or restructurings, or the possibility that such acquisitions, divestitures or
restructurings could adversely affect us;
- –>
- the
loss of key employees;
- –>
- our
exposure to foreign currency exchange rate risks;
- –>
- terrorist
acts or acts of war; and
- –>
- other
risks and uncertainties, including those listed under the caption "Risk Factors".
Given
these risks and uncertainties, you are cautioned not to place undue reliance on such forward-looking statements. The forward-looking statements included in this prospectus are made only as of
the date hereof. We undertake no obligation to update or revise any forward-looking statements, either to reflect new developments, or for any other reason, except as required by law.
33
Table of Contents
Use of Proceeds
We estimate that our net proceeds from this offering, after deducting underwriting discounts and estimated offering expenses, will be
approximately $ million, assuming the shares are offered at $ per ordinary share, which is the midpoint of the estimated offering range
set forth on the cover page
of this prospectus.
We
intend to use the net proceeds as follows:
- –>
- $ million
of the net proceeds will be used to prepay $ million in aggregate principal amount of indebtedness under our
existing senior secured credit agreement plus interest to the prepayment date; and
- –>
- $ million
of the net proceeds will be used to prepay $ million in aggregate principal amount of indebtedness under our
mezzanine credit agreement plus interest to the prepayment date.
As of September 29, 2012, we had $210.0 million aggregate principal amount of secured term loans outstanding under our senior credit agreement which currently bear interest at a rate of
10% per annum and mature on September 30, 2015, and $201.0 million aggregate principal amount of unsecured loans and $4.1 million accrued PIK interest outstanding under our mezzanine
credit agreement which currently bear interest at a rate of 16% per annum and mature on March 24, 2016. The syndicate of lenders under our existing senior secured credit agreement and mezzanine
agreement includes certain of our Sponsors. See "Certain Relationships and Related Party Transactions".
After
application of the proceeds of this offering, the remaining balances of the loans under the senior and mezzanine credit agreements will be repaid with the proceeds of the issuance of senior
secured notes. The senior secured notes offering will be completed concurrently with the closing of this offering. This offering, the senior secured notes offering and the closing of the senior
secured revolving credit facility are each conditional upon the closing of the other transactions.
The following table summarizes the estimated sources and uses of proceeds in connection with the sale of ordinary shares by us and the issuance of $ million of senior secured
notes, assuming this offering and the refinancing had occurred on September 29, 2012. We also expect to enter into a new $ million senior secured revolving credit facility,
which we expect will be undrawn at the closing of this offering. You should read the following together with the information set forth under "Prospectus Summary—Concurrent Transactions".
|
|
|
|
|
Sources
|
|
Amount
|
|
| |
|
|
|
(dollars in millions) |
|
Ordinary shares offered hereby |
|
$ |
|
|
New senior secured notes |
|
|
|
|
| |
|
|
|
Total Sources |
|
$ |
|
|
|
|
|
|
|
Uses
|
|
Amount
|
|
| |
|
|
|
(dollars in millions)
|
|
Repay existing secured term loans |
|
$ |
|
|
Repay existing unsecured term loans |
|
|
|
|
Fees and expenses |
|
|
|
|
Cash on balance sheet |
|
|
|
|
| |
|
|
|
Total Uses |
|
$ |
|
|
34
Table of Contents
Dilution
Dilution represents the difference between the amount per share paid by investors in this offering and the as adjusted net tangible
book value per share of our ordinary shares immediately after this offering.
Our
net tangible book value as of , 2012 was a surplus of
$ million, or $ per ordinary share. Net tangible book value per share represents the
amount of our total tangible assets less total liabilities, divided by the number of ordinary shares outstanding.
After
giving effect to our receipt of the estimated net proceeds from our sale of ordinary shares in this offering, and after deducting the underwriting discounts and commissions and other estimated
offering expenses payable by us, our net tangible book value, as adjusted, as of , 2012
would have been $ million, or $ per ordinary share. This
represents an immediate increase in net tangible book value of $ per common share to our existing shareholders and an immediate dilution of
$ per share to new investors
purchasing our ordinary shares in this offering. The following table illustrates this per share dilution to the later investors:
|
|
|
|
|
|
| |
|
Initial public offering price per share |
|
$ |
|
|
| |
Pro forma net tangible book value per share as
of , 2012 |
|
|
|
|
| |
Increase per share attributable to investors purchasing our ordinary shares in this offering |
|
|
|
|
| |
|
|
|
As adjusted net tangible book value per share after this offering |
|
|
|
|
| |
|
|
|
Dilution in net tangible book value per share to new investors purchasing our ordinary shares in this offering |
|
$ |
|
|
| |
|
|
|
The following table summarizes, as of , 2012, the number of shares
purchased from us, the total consideration paid or to be paid to us, and the
average price per share paid or to be paid to us by existing shareholders and new investors purchasing our ordinary shares in this offering at an assumed offering price of
$ per share,
which is the midpoint of the price range listed on the cover page of this prospectus, before deducting underwriting discounts and commissions and estimated offering expenses payable by us. As the
table shows, new investors purchasing shares in this offering will pay an average price per share substantially higher than our existing shareholders paid.
|
|
|
|
|
|
|
|
|
|
|
|
|
|
|
|
|
|
|
Shares purchased |
|
Total consideration |
|
|
|
|
|
Average price
per share
|
|
|
|
Number
|
|
Percent
|
|
Amount
|
|
Percent
|
|
| |
|
Existing shareholders |
|
|
|
|
|
|
% |
|
|
|
|
|
% |
$ |
|
|
New investors |
|
|
|
|
|
|
|
|
|
|
|
|
|
|
|
|
Total |
|
|
|
|
|
100 |
% |
|
|
|
|
100 |
% |
|
|
|
A $1.00 increase (decrease) in the assumed initial public offering price of $ per share would increase (decrease) the total consideration paid by
new investors by $ million and increase (decrease) the percent of total consideration paid by new investors by %
assuming that the number of shares offered by us,
as set forth on the cover of this prospectus, remains the same.
The
number of ordinary shares to be outstanding after this offering is based on ordinary
shares outstanding as of , 2012. Except as otherwise indicated, the discussion
and tables above assume no exercise of the underwriters' option to purchase additional shares, and no exercise of any of our outstanding stock awards. If the underwriters' option to purchase
additional shares is exercised in full, the number of ordinary shares held by existing shareholders upon the completion of this offering would
35
Table of Contents
Dilution
be ,
or %, and the number of ordinary shares held by new investors upon the completion of this offering would
be , or %, of the total number
of shares outstanding upon the completion of this offering. Our net tangible book value, as adjusted, will be $ , or
$ per ordinary share, and the dilution per ordinary
share to new investors will be $ , if the underwriters' over-allotment option is exercised in full.
In
addition, effective immediately upon the signing of the underwriting agreement for this offering, an aggregate
of of our ordinary shares will be reserved for issuance under our 2012
Equity Incentive Plan. To the extent that any of our outstanding stock awards are exercised, new options are issued under our 2012 Equity Incentive Plan or we issue additional ordinary shares or other
equity securities in the future, there will be further dilution to investors participating in this offering. Furthermore, we may choose to raise additional capital through the sale of equity or
convertible debt securities due to market conditions or strategic considerations even if we believe we have sufficient funds for our current or future operating plans.
36
Table of Contents
Dividend Policy
Isola Group Ltd. has never declared or paid any cash dividends on its ordinary shares. We currently intend to retain earnings,
if any, to finance the development and growth of our business and do not anticipate paying cash dividends on our ordinary shares in the future. Our payment of any future dividends is restricted by our
current credit agreements. The declaration and payment of dividends also is subject to the discretion of our board of directors and depends on various factors, including our net income, financial
condition, cash requirements, future prospects and other factors deemed relevant by our board of directors.
In
addition, under the Companies Law of the Cayman Islands, our board of directors may declare dividends only out of our accumulated net profits, out of share premium, provided that immediately
following the date on which the dividend is to be paid we can pay our debts as they come due in the ordinary course of business, or (subject to the same solvency test as applies to payments from
premium) out of any distributable capital reserve resulting from contributed surplus paid in to us.
37
Table of Contents
Capitalization
Prior to this offering, a substantial amount of the investment in Isola is represented by convertible preferred certificates issued
by Isola's current Luxembourg Holding Company to the Sponsor Limited Partnership, which is controlled by our Sponsors. Immediately prior to this offering, we will reorganize as Isola
Group Ltd., a Cayman Islands company, and all of the outstanding securities of the Luxembourg Holding Company, including the common shares and the convertible preferred certificates, will be
effectively converted into ordinary shares of Isola Group Ltd., as described in "Prospectus Summary—Concurrent Transactions—Corporate Reorganization" (the "Corporate
Reorganization and Conversion").
The following table sets forth both our cash and cash equivalents and our capitalization as of September 29, 2012:
- –>
- on
an actual basis;
- –>
- on
a pro forma as adjusted basis to give effect to:
- –>
- the
Corporate Reorganization and Conversion;
- –>
- the
sale of ordinary shares by us in this offering at an assumed initial public offering price of $ per share, the midpoint of the range set forth on
the front cover page of this prospectus;
- –>
- the
sale of $ principal amount of our new senior secured notes; and
- –>
- the
application of the net proceeds of this offering and our new senior secured notes as described under "Use of Proceeds".
This
table should be read in conjunction with our consolidated financial statements and accompanying notes thereto, "Use of Proceeds" and "Management's Discussion and Analysis of Financial Condition
and Results of Operations—Liquidity and Capital Resources" included elsewhere in this prospectus.
|
|
|
|
|
|
|
|
|
|
|
|
|
|
As of September 29, 2012 |
|
|
|
Actual
|
|
Pro forma
Adjustments
|
|
Pro forma
as adjusted
|
|
| |
|
|
|
(dollars in thousands,
except for share data)
|
|
Cash |
|
$ |
60,171 |
|
|
|
|
|
|
|
| |
|
|
|
|
|
|
|
|
|
Debt and borrowings |
|
|
|
|
|
|
|
|
|
|
| |
Secured term loans issued under existing senior secured credit agreement, net of unamortized discount of $19.3 million |
|
|
190,664 |
|
|
|
|
|
|
|
| |
Unsecured term loans issued under mezzanine credit agreement, net of unamortized discount of $56.8 million and includes $4.1 million of accrued
PIK interest |
|
|
148,329 |
|
|
|
|
|
|
|
| |
Senior secured notes |
|
|
— |
|
|
|
|
|
|
|
| |
Loans issued under new senior secured revolving credit facility |
|
|
— |
|
|
|
|
|
|
|
| |
Convertible preferred certificates |
|
|
218,560 |
|
|
|
|
|
|
|
| |
Other short-term indebtedness |
|
|
15,100 |
|
|
|
|
|
|
|
| |
|
|
|
|
|
|
|
Total debt and borrowings |
|
$ |
572,653 |
|
$ |
|
|
$ |
|
|
| |
|
|
|
|
|
|
|
Stockholders' deficiency |
|
|
|
|
|
|
|
|
|
|
| |
Common shares of Isola Group S.à.r.l., €25 par value ($31), 500 shares authorized, issued and outstanding (actual) |
|
|
15 |
|
|
|
|
|
|
|
| |
Ordinary shares of Isola Group Ltd., 100,000,000 shares authorized,
shares issued and outstanding (pro forma), and shares issued and outstanding (pro
forma as adjusted) |
|
|
— |
|
|
|
|
|
|
|
Additional paid-in capital |
|
|
35,171 |
|
|
|
|
|
|
|
Accumulated deficit |
|
|
(453,036 |
) |
|
|
|
|
|
|
Accumulated other comprehensive income / (loss) |
|
|
(50,409 |
) |
|
|
|
|
|
|
| |
|
|
|
|
|
|
|
Total stockholders' deficiency |
|
|
(468,259 |
) |
|
|
|
|
|
|
| |
|
|
|
|
|
|
|
Total capitalization |
|
$ |
104,394 |
|
$ |
|
|
$ |
|
|
| |
|
|
|
|
|
|
|
38
Table of Contents
Selected Historical Consolidated Financial and Other Data
The following table presents our selected historical consolidated financial and other data. The consolidated statements of operations
data, balance sheet data and other financial data as of and for fiscal 2011, 2010, 2009, 2008, and 2007 are derived from our audited consolidated financial statements which, except for fiscal 2007 and
2008 and balance sheet data as of the end of fiscal 2009, are included elsewhere in this prospectus. The consolidated statements of operations data, balance sheet data and other financial data as of
September 29, 2012 and for the nine months ended September 29, 2012 and October 1, 2011 are derived from our unaudited interim financial statements for those periods included
elsewhere in this prospectus and have been prepared on a basis consistent with the respective audited consolidated financial statements and, in the opinion of management, include all adjustments,
consisting of normal, recurring adjustments, necessary for a fair presentation of that information for such periods. The financial data presented for the interim periods is not necessarily indicative
of the results for the full year. The selected historical consolidated financial and other data below should be read in conjunction with "Use of Proceeds", "Capitalization", "Management's Discussion
and Analysis of Financial Condition and Results of Operations" and the consolidated financial statements and related notes included elsewhere in this prospectus.
|
|
|
|
|
|
|
|
|
|
|
|
|
|
|
|
|
|
|
|
|
|
|
|
|
|
|
For the nine
months ended |
|
|
|
|
|
|
|
|
|
|
|
|
|
Fiscal year |
|
|
|
September 29,
2012
|
|
October 1,
2011
|
|
|
|
2011
|
|
2010
|
|
2009
|
|
2008
|
|
2007
|
|
| |
|
|
|
(dollars in thousands, except for share data)
|
|
Consolidated Statement of Operations Data: |
|
|
|
|
|
|
|
|
|
|
|
|
|
|
|
|
|
|
|
|
|
|
Revenues |
|
$ |
437,804 |
|
$ |
459,448 |
|
$ |
596,989 |
|
$ |
611,987 |
|
$ |
424,199 |
|
$ |
603,543 |
|
$ |
667,595 |
|
Cost of goods sold |
|
|
310,585 |
|
|
350,669 |
|
|
455,404 |
|
|
467,751 |
|
|
342,832 |
|
|
522,168 |
|
|
559,886 |
|
| |
|
|
|
|
|
|
|
|
|
|
|
|
|
|
|
Gross profit |
|
|
127,219 |
|
|
108,779 |
|
|
141,585 |
|
|
144,236 |
|
|
81,367 |
|
|
81,375 |
|
|
107,709 |
|
| |
|
|
|
|
|
|
|
|
|
|
|
|
|
|
|
Operating expenses: |
|
|
|
|
|
|
|
|
|
|
|
|
|
|
|
|
|
|
|
|
|
|
| |
Sales, general and administrative |
|
|
59,647 |
|
|
57,057 |
|
|
77,545 |
|
|
65,271 |
|
|
61,816 |
|
|
69,362 |
|
|
68,321 |
|
| |
Research and development |
|
|
9,248 |
|
|
7,913 |
|
|
10,653 |
|
|
9,532 |
|
|
9,239 |
|
|
10,677 |
|
|
8,511 |
|
| |
Restructuring |
|
|
(76 |
) |
|
462 |
|
|
1,250 |
|
|
4,782 |
|
|
17,497 |
|
|
8,218 |
|
|
3,988 |
|
| |
Loss on liquidation of subsidiary |
|
|
— |
|
|
— |
|
|
— |
|
|
— |
|
|
3,548 |
|
|
— |
|
|
— |
|
| |
Goodwill impairment |
|
|
— |
|
|
— |
|
|
— |
|
|
— |
|
|
— |
|
|
8,513 |
|
|
— |
|
| |
|
|
|
|
|
|
|
|
|
|
|
|
|
|
|
| |
|
Total operating expenses |
|
|
68,819 |
|
|
65,432 |
|
|
89,448 |
|
|
79,585 |
|
|
92,100 |
|
|
96,770 |
|
|
80,820 |
|
| |
|
|
|
|
|
|
|
|
|
|
|
|
|
|
|
Operating income / (loss) |
|
|
58,400 |
|
|
43,347 |
|
|
52,137 |
|
|
64,651 |
|
|
(10,733 |
) |
|
(15,395 |
) |
|
26,889 |
|
Other income—net |
|
|
2,382 |
|
|
1,375 |
|
|
1,629 |
|
|
4,758 |
|
|
1,268 |
|
|
2,467 |
|
|
3,526 |
|
Embedded derivative gain / (loss)—net |
|
|
(45,890 |
) |
|
27,959 |
|
|
42,256 |
|
|
21,165 |
|
|
(27,513 |
) |
|
115,352 |
|
|
59,707 |
|
Interest expense(2) |
|
|
(62,840 |
) |
|
(59,544 |
) |
|
(80,210 |
) |
|
(72,134 |
) |
|
(54,893 |
) |
|
(60,652 |
) |
|
(51,290 |
) |
Interest income |
|
|
79 |
|
|
138 |
|
|
221 |
|
|
339 |
|
|
567 |
|
|
1,821 |
|
|
3,010 |
|
Foreign exchange gain / (loss)—net |
|
|
1,920 |
|
|
(4,132 |
) |
|
4,833 |
|
|
9,596 |
|
|
(2,083 |
) |
|
(979 |
) |
|
(25,931 |
) |
| |
|
|
|
|
|
|
|
|
|
|
|
|
|
|
|
Income / (loss) before taxes |
|
|
(45,949 |
) |
|
9,143 |
|
|
20,866 |
|
|
28,375 |
|
|
(93,387 |
) |
|
42,614 |
|
|
15,911 |
|
Provision for income taxes |
|
|
(18,593 |
) |
|
(2,075 |
) |
|
(10,893 |
) |
|
(27,158 |
) |
|
(7,339 |
) |
|
(6,815 |
) |
|
(11,456 |
) |
| |
|
|
|
|
|
|
|
|
|
|
|
|
|
|
|
Net income / (loss) |
|
$ |
(64,542 |
) |
$ |
7,068 |
|
$ |
9,973 |
|
$ |
1,217 |
|
$ |
(100,726 |
) |
$ |
35,799 |
|
$ |
4,455 |
|
| |
|
|
|
|
|
|
|
|
|
|
|
|
|
|
|
Net income / (loss) per common share |
|
|
|
|
|
|
|
|
|
|
|
|
|
|
|
|
|
|
|
|
|
|
| |
Basic |
|
$ |
(129.08 |
) |
$ |
14.14 |
|
$ |
19.95 |
|
$ |
2.43 |
|
$ |
(201.45 |
) |
$ |
71.60 |
|
$ |
8.91 |
|
| |
Diluted |
|
$ |
(129.08 |
) |
$ |
14.14 |
|
$ |
19.95 |
|
$ |
2.43 |
|
$ |
(201.45 |
) |
$ |
71.60 |
|
$ |
8.91 |
|
Weighted average number of common and common equivalent shares outstanding |
|
|
|
|
|
|
|
|
|
|
|
|
|
|
|
|
|
|
|
|
|
|
| |
Basic |
|
|
500 |
|
|
500 |
|
|
500 |
|
|
500 |
|
|
500 |
|
|
500 |
|
|
500 |
|
| |
Diluted |
|
|
500 |
|
|
500 |
|
|
500 |
|
|
500 |
|
|
500 |
|
|
500 |
|
|
500 |
|
39
Table of Contents
Selected Historical Consolidated Financial and Other Data
|
|
|
|
|
|
|
|
|
|
|
|
|
|
|
|
|
|
|
|
|
|
|
|
|
As of |
|
|
|
|
|
|
|
|
|
|
|
|
|
Fiscal year |
|
|
|
September 29,
2012
|
|
October 1,
2011
|
|
|
|
2011
|
|
2010
|
|
2009
|
|
2008
|
|
2007
|
|
| |
|
|
|
(dollars in thousands)
|
|
Consolidated Balance Sheet Data: |
|
|
|
|
|
|
|
|
|
|
|
|
|
|
|
|
|
|
|
|
|
|
Cash and cash equivalents |
|
$ |
60,171 |
|
$ |
56,874 |
|
$ |
47,481 |
|
$ |
36,733 |
|
$ |
38,932 |
|
$ |
74,084 |
|
$ |
88,564 |
|
Current assets |
|
|
232,729 |
|
|
230,405 |
|
|
206,909 |
|
|
201,208 |
|
|
178,362 |
|
|
213,435 |
|
|
277,742 |
|
Total assets |
|
|
392,470 |
|
|
398,371 |
|
|
368,174 |
|
|
377,194 |
|
|
357,852 |
|
|
424,324 |
|
|
528,482 |
|
Current liabilities |
|
|
145,270 |
|
|
151,484 |
|
|
130,478 |
|
|
131,603 |
|
|
480,461 |
|
|
467,488 |
|
|
215,994 |
|
Working capital (deficit) |
|
|
87,459 |
|
|
78,921 |
|
|
76,431 |
|
|
69,605 |
|
|
(302,099 |
) |
|
(254,053 |
) |
|
61,748 |
|
Long-term debt and capital lease obligations |
|
|
352,454 |
|
|
325,167 |
|
|
331,592 |
|
|
306,547 |
|
|
16,408 |
|
|
30,254 |
|
|
313,325 |
|
Convertible preferred certificates |
|
|
218,560 |
|
|
213,699 |
|
|
208,009 |
|
|
199,136 |
|
|
176,595 |
|
|
162,567 |
|
|
152,700 |
|
Total liabilities |
|
|
860,729 |
|
|
791,575 |
|
|
772,952 |
|
|
778,623 |
|
|
756,210 |
|
|
726,882 |
|
|
852,935 |
|
Common stock and additional paid in capital |
|
|
35,186 |
|
|
32,519 |
|
|
33,284 |
|
|
30,667 |
|
|
28,175 |
|
|
26,418 |
|
|
25,196 |
|
Total stockholders' deficiency |
|
|
(468,259 |
) |
|
(393,204 |
) |
|
(404,778 |
) |
|
(401,429 |
) |
|
(398,358 |
) |
|
(302,558 |
) |
|
(324,453 |
) |
Other Financial Data: |
|
|
|
|
|
|
|
|
|
|
|
|
|
|
|
|
|
|
|
|
|
|
Adjusted EBITDA(3) |
|
$ |
78,354 |
|
$ |
68,635 |
|
$ |
86,183 |
|
$ |
92,365 |
|
$ |
31,625 |
|
$ |
30,847 |
|
$ |
63,910 |
|
- (1)
- For factors that may affect the comparability of financial information included in this table to future results of operations, see "Management's Discussion and Analysis of Financial
Condition and Results of Operation—Factors Affecting Comparability".
- (2)
- Interest expense for the nine months ended September 29, 2012 was $62.8 million (comprised of cash interest expense of $28.1 million and non-cash
interest expense of $34.7 million). Non-cash interest expense includes the amortization of deferred loan origination costs, amortization of original issue discount, interest
paid-in-kind on debt under our mezzanine credit agreement and accretion of interest on our convertible preferred certificates. We intend to use the proceeds of this offering,
together with the proceeds from the issuance of $ million of senior secured notes bearing interest at % per annum, to reduce our current indebtedness and to
refinance the remaining balance of our current indebtedness. If such transactions had occurred as of the end of fiscal 2011, our interest expense for the nine months ended September 29, 2012
would have been $ million, and our cash interest expense for the nine months ended September 29, 2012 would have been
$ million.
- (3)
- Adjusted EBITDA is defined as net income / (loss) plus (i) interest expense and interest income, net, (ii) provision for income taxes, (iii)
depreciation and
amortization and (iv) certain additional adjustments. These additional adjustments include stock-based compensation, restructuring charges, foreign exchange gain / (loss)—net,
goodwill impairment, management fees paid to TPG, embedded derivatives gain / (loss)—net, expenses related to this offering and a gain related to the settlement of a patent infringement
dispute in fiscal 2010.
- Adjusted EBITDA is a measure used by management and external users of our consolidated financial statements to evaluate operating performance, but it is not
a recognized term under U.S. GAAP and is not an alternative to net income as a measure of overall financial performance or to Cash Flows from Operating Activities as a measure of cash generated
from operating activities. Additionally, Adjusted EBITDA is not intended to be a measure of free cash flow available for management's discretionary use, as it does not consider certain cash
requirements such as tax payments and debt service requirements, nor does it consider the need for incremental working capital or capital expenditures.
- We believe Adjusted EBITDA is useful because it allows us to more effectively evaluate our operating performance, compare the results of our operations from
period-to-period and compare the results of our operations against our peers without regard to our financing methods or capital structure. We exclude the items listed above from net income (loss) in
arriving at Adjusted EBITDA because these amounts can vary substantially from company-to-company within our industry depending on accounting methods and book values of assets, capital structure and
the method by which assets were acquired. We further believe that Adjusted EBITDA is frequently used by securities analysts, investors and other interested parties in their evaluation of companies,
many of which present an EBITDA or Adjusted EBITDA measure when reporting their results. We use non-GAAP financial measures to supplement U.S. GAAP measures to provide a further
understanding of the factors and trends affecting the business that U.S. GAAP measures alone cannot provide. Because not all companies use identical calculations, our presentation of Adjusted
EBITDA may not be comparable to other similarly titled measures of other companies.
40
Table of Contents
Selected Historical Consolidated Financial and Other Data
The following table presents a reconciliation of net income / (loss), the most directly comparable financial measure under U.S. GAAP, to Adjusted EBITDA
for the periods presented.
|
|
|
|
|
|
|
|
|
|
|
|
|
|
|
|
|
|
|
|
|
|
|
|
|
For the nine
months ended |
|
|
|
|
|
|
|
|
|
|
|
|
|
Fiscal year |
|
|
|
September 29,
2012
|
|
October 1,
2011
|
|
|
|
2011
|
|
2010
|
|
2009
|
|
2008
|
|
2007
|
|
| |
|
|
|
(dollars in thousands)
|
|
Net income / (loss): |
|
$ |
(64,542 |
) |
$ |
7,068 |
|
$ |
9,973 |
|
$ |
1,217 |
|
$ |
(100,726 |
) |
$ |
35,799 |
|
$ |
4,455 |
|
Interest expense |
|
|
62,840 |
|
|
59,544 |
|
|
80,210 |
|
|
72,134 |
|
|
54,893 |
|
|
60,652 |
|
|
51,290 |
|
Interest income |
|
|
(79 |
) |
|
(138 |
) |
|
(221 |
) |
|
(339 |
) |
|
(567 |
) |
|
(1,821 |
) |
|
(3,010 |
) |
Provision for income taxes |
|
|
18,593 |
|
|
2,075 |
|
|
10,893 |
|
|
27,158 |
|
|
7,339 |
|
|
6,815 |
|
|
11,456 |
|
Depreciation and amortization |
|
|
12,297 |
|
|
12,889 |
|
|
17,222 |
|
|
16,903 |
|
|
19,786 |
|
|
23,772 |
|
|
24,872 |
|
Stock-based compensation |
|
|
1,925 |
|
|
1,876 |
|
|
2,650 |
|
|
2,219 |
|
|
1,757 |
|
|
1,222 |
|
|
2,350 |
|
Restructuring charges |
|
|
(76 |
) |
|
462 |
|
|
1,250 |
|
|
4,782 |
|
|
17,497 |
|
|
8,218 |
|
|
3,988 |
|
Foreign exchange translation (gain) / loss)—net |
|
|
(1,920 |
) |
|
4,132 |
|
|
(4,833 |
) |
|
(9,596 |
) |
|
2,083 |
|
|
979 |
|
|
25,931 |
|
Goodwill impairments |
|
|
— |
|
|
— |
|
|
— |
|
|
— |
|
|
— |
|
|
8,513 |
|
|
— |
|
Management fee expense—TPG |
|
|
1,536 |
|
|
1,536 |
|
|
2,048 |
|
|
2,052 |
|
|
2,050 |
|
|
2,050 |
|
|
2,285 |
|
Embedded derivative (gain) / loss)—net |
|
|
45,890 |
|
|
(27,959 |
) |
|
(42,256 |
) |
|
(21,165 |
) |
|
27,513 |
|
|
(115,352 |
) |
|
(59,707 |
) |
Gain related to settlement of a patent infringement matter |
|
|
— |
|
|
— |
|
|
— |
|
|
(3,000 |
) |
|
— |
|
|
— |
|
|
— |
|
Pre-IPO expenses |
|
|
1,890 |
|
|
7,150 |
|
|
9,247 |
|
|
— |
|
|
— |
|
|
— |
|
|
— |
|
| |
|
|
|
|
|
|
|
|
|
|
|
|
|
|
|
Adjusted EBITDA |
|
$ |
78,354 |
|
$ |
68,635 |
|
$ |
86,183 |
|
$ |
92,365 |
|
$ |
31,625 |
|
$ |
30,847 |
|
$ |
63,910 |
|
| |
|
|
|
|
|
|
|
|
|
|
|
|
|
|
|
41
Table of Contents
Unaudited Pro Forma Financial Information
The following presents the unaudited pro forma consolidated balance sheet as of September 29, 2012 and unaudited pro forma
consolidated statement of operations for the nine months ended September 29, 2012 and the year ended December 31, 2011.
The unaudited pro forma financial information has been derived by the application of pro forma adjustments to our historical consolidated financial statements. The unaudited pro forma consolidated
balance sheet as of September 29, 2012 gives effect to the following events as if they had occurred on September 29, 2012. The unaudited pro forma statements of operations for the nine
months ended September 29, 2012 and the year ended December 31, 2011 give effect to the following events as if they had occurred on January 2, 2011:
- –>
- the
issuance of ordinary shares in this offering to investors;
- –>
- the
issuance of $ principal amount new senior secured notes (at an assumed interest rate of %), the entrance into a new senior secured
revolving credit facility and the reduction of our annual interest expense as a result of the repayment of our existing loans described below;
- –>
- the
application of the net proceeds of this offering, together with the proceeds of the senior secured notes, to repay all of the term loans outstanding under our
existing senior secured and mezzanine credit agreements;
- –>
- the
termination of the TPG Management Agreement; and
- –>
- the
reorganization as Isola Group Ltd., a Cayman Islands company, which involves the effective conversion of all of the outstanding securities of the
Luxembourg Holding Company, including its common shares and convertible preferred certificates, including accreted interest payable, into ordinary shares of Isola Group Ltd.
The unaudited pro forma financial information is presented for illustrative purposes only, and is based on preliminary estimates and currently available information and assumptions that our management
believes are reasonable. Therefore, the unaudited pro forma balance sheet as of September 29, 2012 and the unaudited pro forma statements of operations for the nine months ended
September 29, 2012 and the year ended December 31, 2011 are not necessarily indicative of the financial position or results of operations that would have been achieved had the foregoing
events occurred on September 29, 2012 and January 2, 2011, respectively, nor is it necessarily indicative of our results to be expected for any future period. A number of factors may
affect our results. See "Forward-Looking Statements" and "Risk Factors".
42
Table of Contents
Unaudited Pro Forma Financial Information
BALANCE SHEET
|
|
|
|
|
|
|
|
|
|
|
|
|
|
|
As of September 29, 2012 |
|
|
|
Actual
|
|
Pro forma
adjustments
|
|
Pro forma
|
|
| |
|
|
|
(dollars in thousands,
except for share data)
|
|
Assets |
|
|
|
|
|
|
|
|
|
|
Current assets: |
|
|
|
|
|
|
|
|
|
|
| |
Cash |
|
$ |
60,171 |
|
|
|
|
|
|
|
| |
Accounts receivable—net |
|
|
112,635 |
|
|
|
|
|
|
|
| |
Other receivables |
|
|
1,922 |
|
|
|
|
|
|
|
| |
Inventories |
|
|
45,784 |
|
|
|
|
|
|
|
| |
Deferred tax assets |
|
|
1,948 |
|
|
|
|
|
|
|
| |
Prepaid expenses and other current assets |
|
|
10,269 |
|
|
|
(1) |
|
|
|
| |
|
|
|
|
|
|
|
| |
|
Total current assets |
|
|
232,729 |
|
|
|
|
|
|
|
Restricted cash |
|
|
1,391 |
|
|
|
|
|
|
|
Property, plant, and equipment—net |
|
|
134,117 |
|
|
|
|
|
|
|
Intangible assets—net |
|
|
5,235 |
|
|
|
|
|
|
|
Deferred tax assets |
|
|
7,547 |
|
|
|
|
|
|
|
Debt issuance costs and other assets |
|
|
11,451 |
|
|
|
(1) |
|
|
|
| |
|
|
|
|
|
|
|
Total assets |
|
$ |
392,470 |
|
|
|
|
|
|
|
| |
|
|
|
|
|
|
|
Liabilities and Stockholder's Deficiency |
|
|
|
|
|
|
|
|
|
|
Current liabilities: |
|
|
|
|
|
|
|
|
|
|
| |
Accounts payable |
|
$ |
73,396 |
|
|
|
|
|
|
|
| |
Short-term debt and current portion—long-term debt |
|
|
15,100 |
|
|
|
|
|
|
|
| |
Accrued liabilities |
|
|
55,411 |
|
|
|
(2) |
|
|
|
| |
Deferred tax liabilities |
|
|
72 |
|
|
|
|
|
|
|
| |
Other current liabilities |
|
|
1,291 |
|
|
|
|
|
|
|
| |
|
|
|
|
|
|
|
| |
|
Total current liabilities |
|
|
145,270 |
|
|
|
|
|
|
|
Long-term debt—net of current portion |
|
|
338,993 |
|
|
|
(3)(4) |
|
|
|
Convertible preferred certificates (including accreted interest) |
|
|
218,560 |
|
|
|
(5) |
|
|
|
Capital lease obligations—net of current portion |
|
|
13,461 |
|
|
|
|
|
|
|
Embedded derivatives |
|
|
74,666 |
|
|
|
(5)(6) |
|
|
|
Pension and other retirement benefits |
|
|
52,374 |
|
|
|
|
|
|
|
Uncertain tax positions and other liabilities |
|
|
14,056 |
|
|
|
|
|
|
|
Deferred tax liabilities |
|
|
3,349 |
|
|
|
|
|
|
|
| |
|
|
|
|
|
|
|
| |
|
Total liabilities |
|
|
860,729 |
|
|
|
|
|
|
|
| |
|
|
|
|
|
|
|
Commitments and contingencies |
|
|
|
|
|
|
|
|
|
|
Stockholder's deficiency: |
|
|
|
|
|
|
|
|
|
|
| |
Common stock |
|
|
15 |
|
|
|
(3)(5) |
|
|
|
| |
Additional paid-in capital |
|
|
35,171 |
|
|
|
(3)(5) |
|
|
|
| |
Accumulated deficit |
|
|
(453,036 |
) |
|
|
|
|
|
|
| |
Accumulated other comprehensive loss |
|
|
(50,409 |
) |
|
|
|
|
|
|
| |
|
|
|
|
|
|
|
| |
|
Total stockholder's deficiency |
|
|
(468,259 |
) |
|
|
|
|
|
|
| |
|
|
|
|
|
|
|
Total liabilities and stockholder's deficiency |
|
$ |
392,470 |
|
|
|
|
|
|
|
| |
|
|
|
|
|
|
|
43
Table of Contents
Unaudited Pro Forma Financial Information
CONSOLIDATED STATEMENT OF OPERATIONS
|
|
|
|
|
|
|
|
|
|
|
|
|
|
|
|
|
|
|
|
|
|
|
|
For the nine months ended September 29, 2012 |
|
For the year ended December 31, 2011 |
|
|
|
Actual
|
|
Pro forma
adjustments
|
|
Pro forma
|
|
Actual
|
|
Pro forma
adjustments
|
|
Pro forma
|
|
| |
|
|
|
(dollars in thousands, except for share data)
|
|
Revenues |
|
$ |
437,804 |
|
|
|
|
|
|
|
$ |
596,989 |
|
|
|
|
|
|
|
Cost of goods sold |
|
|
310,585 |
|
|
|
|
|
|
|
|
455,404 |
|
|
|
|
|
|
|
| |
|
|
|
|
|
|
|
|
|
|
|
|
|
Gross profit |
|
|
127,219 |
|
|
|
|
|
|
|
|
141,585 |
|
|
|
|
|
|
|
| |
|
|
|
|
|
|
|
|
|
|
|
|
|
Operating expenses |
|
|
|
|
|
|
|
|
|
|
|
|
|
|
|
|
|
|
|
| |
Sales, general, and administrative |
|
|
59,647 |
|
|
|
|
|
|
|
|
77,545 |
|
|
|
(7) |
|
|
|
| |
Research and development |
|
|
9,248 |
|
|
|
|
|
|
|
|
10,653 |
|
|
|
|
|
|
|
| |
Restructuring |
|
|
(76 |
) |
|
|
|
|
|
|
|
1,250 |
|
|
|
|
|
|
|
| |
|
|
|
|
|
|
|
|
|
|
|
|
|
| |
|
Total operating expenses |
|
|
68,819 |
|
|
|
|
|
|
|
|
89,448 |
|
|
|
|
|
|
|
Operating income |
|
|
58,400 |
|
|
|
|
|
|
|
|
52,137 |
|
|
|
|
|
|
|
Other income—net |
|
|
2,382 |
|
|
|
|
|
|
|
|
1,629 |
|
|
|
|
|
|
|
Embedded derivative gain/(loss)—net |
|
|
(45,890 |
) |
|
|
|
|
|
|
|
42,256 |
|
|
|
(8) |
|
|
|
Interest expense |
|
|
(62,840 |
) |
|
|
|
|
|
|
|
(80,210 |
) |
|
|
(9)(10) |
|
|
|
Interest income |
|
|
79 |
|
|
|
|
|
|
|
|
221 |
|
|
|
|
|
|
|
Foreign exchange gain/(loss)—net |
|
|
1,920 |
|
|
|
|
|
|
|
|
4,833 |
|
|
|
(8) |
|
|
|
| |
|
|
|
|
|
|
|
|
|
|
|
|
|
Income/(loss) before taxes |
|
|
(45,949 |
) |
|
|
|
|
|
|
|
20,866 |
|
|
|
|
|
|
|
Provision for income taxes |
|
|
(18,593 |
) |
|
|
|
|
|
|
|
(10,893 |
) |
|
|
(11) |
|
|
|
| |
|
|
|
|
|
|
|
|
|
|
|
|
|
Net income/(loss) |
|
$ |
(64,542 |
) |
|
|
|
|
|
|
$ |
9,973 |
|
|
|
|
|
|
|
| |
|
|
|
|
|
|
|
|
|
|
|
|
|
Net income/(loss) per common share |
|
$ |
(129.08 |
) |
|
|
|
|
|
|
$ |
19.95 |
|
|
|
|
|
|
|
| |
|
|
|
|
|
|
|
|
|
|
|
|
|
Weighted average number of common and potential common shares outstanding |
|
|
|
|
|
|
|
|
|
|
|
|
|
|
|
|
|
|
|
| |
Basic |
|
|
500 |
|
|
|
|
|
|
|
|
500 |
|
|
|
(3) |
|
|
|
| |
|
|
|
|
|
|
|
|
|
|
|
|
|
| |
Diluted |
|
|
500 |
|
|
|
|
|
|
|
|
500 |
|
|
|
(3) |
|
|
|
| |
|
|
|
|
|
|
|
|
|
|
|
|
|
- (1)
- Reflects the write-off of $ million of deferred financing costs associated with our current senior secured
and mezzanine credit agreements.
- (2)
- Reflects the termination of the TPG Management Agreement described under "Certain Relationships and Related Party Transactions—Agreements with Our Sponsors",
including the
elimination of approximately $ million in accrued management fees and related expenses to TPG.
- (3)
- Reflects the issuance
of ordinary shares in this offering at a price of
$ per share, which is the midpoint of the range set forth on the cover of this
prospectus, and the application of the net proceeds of this offering of $ million, together with the proceeds from the issuance of
$ million of senior
secured notes, to repay all of the term loans outstanding under our existing senior secured credit agreement and mezzanine credit agreement as described under "Use of Proceeds".
- (4)
- Reflects the write-off of $ million of original issue discount costs associated
with our current senior secured and mezzanine credit agreements.
- (5)
- Reflects the reclassification of $ million of convertible preferred certificates and
$ million of accreted interest payable and the
associated embedded derivative liabilities of $ million to additional paid in capital as a result of the corporate reorganization as described in "Prospectus
Summary—Concurrent Transactions—Corporate Reorganization".
- (6)
- Reflects the write-off of the embedded derivative liabilities associated with our current senior secured and mezzanine credit agreements of
$ .
- (7)
- Reflects the payment of $8.0 million in transaction fees and elimination of approximately
$ million in accrued management fees and related expenses
payable to TPG pursuant to the TPG Management Agreement described under "Certain Relationships and Related Party Transactions—Agreements with Our Sponsors".
44
Table of Contents
Unaudited Pro Forma Financial Information
- (8)
- Reflects the decrease in embedded derivative loss of $ million consisting of: (i) a
$ million decrease in connection with the change
in fair value previously recorded related to embedded derivative liabilities associated with our convertible preferred certificates; (ii) $ million of foreign exchange
gain/(loss) previously recorded related to embedded derivative liabilities associated with our convertible preferred certificates; and (iii) a $ million decrease in
connection with the change in fair value previously recorded related to embedded derivative liabilities associated with our existing senior secured and mezzanine credit agreements. As described in
"Description of Indebtedness" and "Use of Proceeds", in connection with this offering all of the term loans outstanding under our existing senior secured and mezzanine credit agreements will be
prepaid, and the senior secured and mezzanine credit agreements will then be terminated and therefore no longer subject to future fair value measurements.
- (9)
- Reflects the decrease in interest expense of $ million, consisting of: (i) a
$ million decrease related to the repayment of all of
the term loans outstanding under our existing senior secured and mezzanine credit agreements; and (ii) a $ million decrease related to the conversion of our convertible
preferred certificates to additional paid in capital.
- (10)
- Reflects the decrease in interest expense of $ million under our new senior secured notes
from the interest expense under our existing senior secured and
mezzanine credit agreements (based on an annual rate of %. A 1/8th variance in the assumed interest rate would result in a change in pro forma net
income of
$ for the year ended December 31, 2011 and $ for the nine months ended September 29,
2012).
- (11)
- Reflects the increase in income tax expense related to the changes in the following expense
items: .
45
Table of Contents
Management's Discussion and Analysis of Financial Condition and Results of Operations
The following discussion and analysis of the financial condition and results of our operations should be read
in conjunction with the consolidated financial statements and related footnotes included elsewhere in this prospectus. This discussion contains forward-looking statements that involve risks and
uncertainties. Our actual results could differ materially from those discussed below. Factors that could cause or contribute to such differences include, but are not limited to, those identified
below, and those discussed in the sections titled "Risk Factors" and "Forward-Looking Statements" included elsewhere in this prospectus. You should read the following discussion together with the
sections titled "Risk Factors", "Selected Historical Consolidated Financial and Other Data" and our consolidated financial statements, including the related footnotes, included elsewhere in this
prospectus.
OVERVIEW
Business
Isola is a leading global material sciences company that designs, develops and manufactures copper-clad laminate, or CCL, and prepreg
(collectively, "laminate materials") used to fabricate advanced multilayer printed circuit boards, or PCBs. PCBs provide the physical platform for the semiconductors, passive components and connection
circuitry that power and
control virtually all modern electronics. We focus on the market for high-performance laminate materials, developing proprietary resins that are critical to the performance of PCBs used in
advanced electronic applications. We continually invest in research and development and believe that our industry-leading resin formulations, many of which are patented, provide us with a competitive
advantage. With 11 manufacturing facilities and three research centers worldwide, as well as a global sales force, we are the largest supplier of laminate materials to PCB fabricators in the United
States and Europe, and we are one of the larger suppliers in our addressable Asian market, based on revenue for fiscal year 2011.
Our
high-performance PCB laminate materials are used in a variety of advanced electronics, including network and communications equipment and high-end consumer electronics, as
well as advanced automotive, aerospace, military and medical applications. Demand in these markets is driven by the rapid growth of bandwidth-intensive, high-speed data transmission, the
expansion of the internet, the emergence of cloud computing and the evolution of increasingly complex communications technology. This has led to an urgent need for the development of the underlying
infrastructure to support this growth, including faster and more efficient semiconductor technology. In addition, increasingly pervasive environmental regulations are driving a need for
lead-free compatible, high-performance laminate materials.
We
sell our laminate materials globally to leading PCB fabricators, including Ruwel, Sanmina, TTM Technologies, Viasystems and WUS Printed Circuit. These fabricators produce PCBs incorporating our
laminate materials for electronic equipment designed or produced by a broad group of major original equipment manufacturers, or OEMs, including Alcatel-Lucent, Brocade, Cisco, Dell, Ericsson, Google,
Hewlett-Packard, Huawei, IBM and Sun Microsystems (now Oracle). We work closely with these leading PCB fabricators and major OEMs to ensure that our high-performance laminate
materials incorporating our proprietary resins meet the thermal, electrical and physical performance criteria of each new generation of electronic equipment.
46
Table of Contents
Management's Discussion and Analysis of Financial Condition and Results of Operations
Recession and Response
Over the past three years, we have improved our manufacturing capacity utilization and business processes, focused on designing and manufacturing
higher margin, high-performance products, and refinanced our indebtedness. Many of these improvements were a result of our response to the global recession.
We
entered into two credit facilities in 2006, referred to as our first- and second-lien facilities. The leverage covenants set forth in these facilities became more restrictive over time,
requiring periodic increases in our EBITDA (as defined under those facilities) relative to our outstanding indebtedness. At the end of the second quarter of 2008, we were unable to comply with the
tightened covenants. In August 2008, we negotiated amendments to these facilities that provided us with more flexible financial covenants, but also resulted in increased interest expense and loan
amortization.
In the wake of the global recession that began in 2008, our revenues and EBITDA declined significantly in the last two quarters of 2008, and in January 2009 we notified the lenders under our first-
and second-lien facilities that we had defaulted under the revised leverage covenants and were suspending cash interest payments. With the assistance of an outside advisor, we took
aggressive measures to reduce fixed expenses and cash outflows. The more significant measures were the closures of our manufacturing facilities in Fremont, California, Dalian, China and Bottegone,
Italy, and the transfer of production from these closed facilities to other nearby manufacturing sites. We also suspended matching grants for U.S. employee 401(k) contributions and our annual
company-wide bonus plan and initiated mandatory salary reductions. The consolidation of manufacturing and related actions permanently reduced our annual fixed and semi-fixed
operating costs by an estimated $30.0 million and significantly improved our manufacturing capacity utilization. These cost reductions contributed to the increase in gross profit from 13.5% in
fiscal 2008 to 23.7% in fiscal 2011 and 29.1% for the nine months ended September 29, 2012. We estimate that approximately $15.0 million of the cost reduction was first realized in
fiscal 2009 and approximately $15.0 million was first realized in fiscal 2010. Additional incremental benefits are not expected from these earlier facility closures, although we will strive to
improve manufacturing capacity utilization in our remaining facilities by increasing revenues and unit volumes.
When
global demand for electronic products began to improve in mid-2009, our enhanced operational leverage, in combination with our increased emphasis on higher margin,
high-performance products, led to improved profits and cash flow. In September 2010, based on these improvements, we paid in full the principal and accrued interest on our first- and
second-lien credit facilities from cash on hand and loans under two new credit agreements: a $210.0 million senior credit and guaranty agreement, referred to as our senior secured
credit agreement, and a mezzanine credit and guaranty agreement in an initial principal amount of $175.0 million, referred to as our mezzanine credit agreement.
Immediately
prior to this offering, we will undergo a corporate reorganization pursuant to which the Luxembourg Holding Company will become a wholly owned subsidiary of Isola Group Ltd. The
reorganization is expected to be a tax-free transaction, and we do not anticipate that there will be any material income tax expense as a result of the restructuring or any material change
to our ongoing tax position.
KEY FINANCIAL MEASURES
Revenue
Revenue consists primarily of sales of our laminate materials: copper-clad laminates and dielectric prepreg. We sell these materials to
major PCB fabricators primarily through our direct global sales force, and we sell to smaller fabricators primarily through third-party distribution arrangements. Revenue from direct sales comprised
92% of our total revenue for the nine months ended September 29, 2012 and 91% of our total
47
Table of Contents
Management's Discussion and Analysis of Financial Condition and Results of Operations
revenue for the nine months ended October 1, 2011, as well as in fiscal 2011 and 90% of our total revenue in both fiscal 2010 and 2009. We have no long-term customer agreements and
sell to customers on a purchase order basis. Consequently, we maintain very little backlog, and our revenue is subject to short-term variability in demand. Although we do not maintain
long-term agreements with our customers, we have developed close relationships with them and the major OEMs that they serve. Through these relationships, we seek to ensure that our
PCB laminate materials are qualified for use in an OEM's product line. In some cases, OEMs may specify Isola laminates as the preferred material. Once a particular PCB laminate material is
"designed in" or qualified for use in a specific product line and one or more particular laminate suppliers are selected, these suppliers tend to remain suppliers of choice, even as PCBs for these
products change to address OEM product line improvements or extensions or next generation developments.
Revenue in the laminate materials industry tends to reflect broad economic trends, as well as trends in the semiconductor industry. Historically, revenue has been disproportionally affected (both
positively and negatively) by such trends due to adjustments of inventory levels within the supply chain in response to changing economic conditions. In particular, PCB fabricators tend to discontinue
laminate purchases at the perceived onset of economic downturns and tend to wait to restock supplies until they reach critical levels following recessionary conditions. Revenue was
$424.2 million for fiscal 2009, $612.0 million for fiscal 2010 and $597.0 million for fiscal 2011 reflecting the decline into, and ongoing recovery from, the global recession.
Revenue was $437.8 million for the nine months ended September 29, 2012.
Our
sales prices are affected primarily by competitive factors, as well as changing costs of raw materials, especially copper. The cost of copper foil comprises approximately half of the total cost of
our raw materials. Copper is a globally traded commodity subject to ongoing market fluctuations. When feasible, we pass on changes in costs of raw materials to our customers. We believe that the
high-performance segment of the PCB materials industry is more resilient to economic downturns and that customers are generally more willing to absorb, or share, increases in raw materials
costs for such products.
A significant percentage of our revenue has historically been concentrated in a limited number of large customers. Revenue from our ten largest customers represented approximately 63% of our total
revenue for the nine months ended September 29, 2012 as compared to 60% for the nine months ended October 1, 2011. Revenue from our ten largest customers was approximately 61% in fiscal
2011 and approximately 60% in both fiscal 2010 and fiscal 2009. In each of these periods, only one of our customers (Viasystems and its subsidiaries) accounted for more than 10% of our revenues (but
less than 20%). Though the composition of our top ten customers varies from year to year, we expect that sales to a limited number of customers will continue to account for a significant percentage of
our total revenue for the foreseeable future.
Cost of Goods Sold
Our cost of goods sold includes the cost of raw materials, direct and indirect labor and variable and fixed overhead costs. Cost of goods sold was
$310.6 million (70.9% of revenue) for the nine months ended September 29, 2012 as compared to $350.7 million (76.3% of revenue) for the nine months ended October 1, 2011.
Cost of goods sold was $455.4 million in fiscal 2011 (76.3% of total revenue) as compared $467.8 million in fiscal 2010 (76.4% of total revenue), and $342.8 million in fiscal 2009
(80.8% of total revenue). Depreciation and amortization expense included in cost of goods sold was $9.7 million for the nine months ended September 29, 2012, $10.6 million for the
nine months ended October 1, 2011, $14.2 million in fiscal 2011, $14.1 million in fiscal 2010, and $16.4 million in fiscal 2009.
Cost
of goods sold, and revenue, are generally a function of the demand for our products. As demand and unit volumes increase, our cost of goods sold, and revenue, each increase. As a percentage of
revenue, cost of goods sold is a function of our ability to pass through raw material and other manufacturing cost increases
48
Table of Contents
Management's Discussion and Analysis of Financial Condition and Results of Operations
to
our customers in the form of product pricing. Changes in cost of goods sold as compared to revenue are discussed in the "Gross Margin" section below.
Some of our manufacturing costs are variable and others are fixed. Variable costs include the cost of raw materials, direct labor and indirect labor. Fixed costs include rental expense of leased
manufacturing facilities and equipment or the depreciation expense of owned manufacturing facilities and equipment used in the production process. As unit volumes produced in our factories increase,
these fixed costs are unchanged and our gross margin, which is gross profit as a percentage of total revenue, improves. The best measure of this operating leverage is captured in our capacity
utilization statistics which are more fully discussed below. Our manufacturing capacity utilization was 64.5% for the nine months ended September 29, 2012; this was slightly improved from the
63.6% we achieved for the nine months ended October 1, 2011, and much improved over the 50.3% experienced in the recessionary year of fiscal 2009. Manufacturing capacity utilization was 61.6%
in fiscal 2011 and 66.7% in fiscal 2010. We achieved a marked improvement in manufacturing capacity utilization after the restructuring activities and facility closures that took place in fiscal 2008
and fiscal 2009, which reduced our fixed factory overhead and other conversion costs. The improvement in manufacturing capacity utilization is best measured by the average per unit conversion costs.
Conversion costs are all factory costs except the cost of raw materials.
Gross Margin
Gross margin has historically been, and is expected in the future to be, affected by a variety of factors, including the mix of products we sell,
competitive pricing pressures, changes in the costs of raw materials (and our ability to pass through these changes to our customers), labor costs, overhead costs, production volume and manufacturing
capacity utilization.
Our
high-performance products, which address technically challenging applications, typically have higher average selling prices and higher gross margins than our standard products. In
addition, when we provide products on a "quick-turn" basis we are often able to command a pricing premium, which results in higher gross margin than products provided on a standard
lead-time basis.
Our overall gross margin was 29.1% for the nine months ended September 29, 2012 as compared to 23.7% for the nine months ended October 1, 2011. Our overall gross margin was 23.7% in
fiscal 2011, relatively unchanged from the 23.6% in fiscal 2010, but substantially improved over the 19.2% in fiscal 2009. Our ongoing product strategy of focusing on higher-priced
high-performance products has improved our gross margin. In addition, a number of operational improvements made during fiscal 2008 and 2009, including the closure of three manufacturing
facilities, have subsequently improved our gross margin by reducing manufacturing capacity, improving the capacity utilization rates in our remaining factories and decreasing our average per unit
conversion costs.
We expect overall gross margin to continue to improve over time as high-performance products become an increasing percentage of our overall revenue. However, our revenue and gross margin
will continue to be subject to general economic conditions and cyclical factors affecting our industry.
Operating Expenses
Our operating expenses include the following:
Sales, general and administrative expense. Our sales, general and administrative, or SG&A, expense includes expenses incurred in the selling and marketing of our
products to customers, as well as corporate administrative expenses. Sales expenses consist primarily of compensation, benefits and other expenses for sales and marketing personnel, as well as
expenses related to advertising, marketing and trade shows, plus bad debt expense. General and administrative expense consists primarily of compensation and associated expenses for executive
management, human resources, finance and administrative personnel. SG&A
49
Table of Contents
Management's Discussion and Analysis of Financial Condition and Results of Operations
expense was $59.6 million for the nine months ended September 29, 2012 (13.6% of total revenue) as compared to $57.1 million for the nine months ended October 1, 2011
(12.4% of total revenue). SG&A expense was $77.5 million in fiscal 2011 (13.0% of total revenue), as compared to $65.3 million in fiscal 2010 (10.7% of total revenue), and
$61.8 million in fiscal 2009 (14.6% of total revenue). The increase in SG&A expense for the nine months ended September 29, 2012 compared to the prior year period was primarily due to
higher personnel costs, partially offset by a net decrease in other SG&A expense. In the prior year we incurred higher audit and legal fees associated with this offering. The increase in SG&A expense
during fiscal 2011 was due to higher professional fees associated with this offering and an increase in withholding tax payments from our international subsidiaries related to remittances of
intercompany management fees and commissions. The increase in SG&A expense as a percentage of revenue in fiscal 2011 compared to fiscal 2010 was primarily a result of the higher professional fees and
withholding tax payments, while the reduction in SG&A expense as a percentage of revenue in fiscal 2010 compared to fiscal 2009 was primarily attributable to the increase in revenue. We expect SG&A
expense as a percentage of revenue to decrease in the future as the economy continues to strengthen, demand for our products increases and we no longer incur the professional fees associated with this
offering.
Research and development expense. Research and development, or R&D, expense consists of the
compensation, benefits and other expenses of R&D personnel, as well as other product development costs, such as direct product design, development and process engineering expenses, legal fees related
to the defense of intellectual property and the depreciation of the capital equipment and facilities used by R&D staff. All R&D costs are recorded as expenses when incurred. Our investments in R&D
were $9.2 million for the nine months ended September 29, 2012 (2.1% of total revenue) as compared to $7.9 million for the nine months ended October 1, 2011 (1.7% of total
revenue). R&D expenses were $10.7 million in fiscal 2011 (1.8% of total revenue), as compared to $9.5 million in fiscal 2010 (1.6% of total revenue) and $9.2 million in fiscal 2009 (2.2%
of total revenue). We are committed to adding more technical resources to this important function and expect that R&D expenses will increase over time. However, R&D expenses as a percentage of our
revenue is expected to decline in the future as demand for our products increases.
Based on input from OEMs and PCB fabricators, we develop new resin formulations that achieve specific needs for electrical, thermal and physical performance. We undertake very little
exploratory research that is not directly linked to particular market or customer needs. Our OEM marketing and R&D efforts are tightly integrated, with both functions reporting to our Chief Technology
Officer. The expense of these OEM marketing efforts is included in SG&A expense and totaled approximately $3.9 million for the nine months ended September 29, 2012 as compared to the
$3.1 million for the nine months ended October 1, 2011, $4.5 million in both fiscal 2011 and fiscal 2010, and approximately $3.6 million in fiscal 2009.
Restructuring expense. We identify separately the expenses related to restructuring activities, including the cost of site closures and attendant severance
expenses, as well as professional fees incurred in connection with restructuring activities. As described above, in 2008 and 2009 we initiated a number of measures centered on streamlining our
organizational structure, reducing labor costs and improving manufacturing capacity utilization. We do not anticipate any further major restructuring efforts. We expect to incur an immaterial amount
of restructuring expenses in 2012 for our reorganization as a Cayman Islands company and some limited residual costs associated with various prior site closures. We recorded a net gain in
restructuring expense of $0.1 million for the nine months ended September 29, 2012 as compared to expense of $0.5 million for the nine months ended October 1, 2011,
$1.3 million in fiscal 2011, $4.8 million in fiscal 2010 and $17.5 million in fiscal 2009. The net gain for the nine months ended September 29, 2012 was due to a
$0.2 million gain on the sale of our previously closed Fremont, California manufacturing facility.
Loss on liquidation of subsidiary. The loss on liquidation of subsidiary of $3.5 million in fiscal 2009 reflects the loss on the disposal of our closed
Italian laminate facility, MAS Italia s.r.l. We have completed the liquidation of this subsidiary pursuant to a formal legal process. Upon approval of the liquidation of this
50
Table of Contents
Management's Discussion and Analysis of Financial Condition and Results of Operations
subsidiary by the Italian authorities in fiscal 2009, we terminated our interest in the subsidiary and all assets of the subsidiary became the property of the courts to liquidate for the benefit of
the subsidiary's creditors. We do not expect to incur any further significant losses in connection with the liquidation of this subsidiary.
Non-operating Expenses
Other income—net. Other income—net consists of royalty income and other various forms of non-operating income and expenses.
Other income—net was $2.4 million for the nine months ended September 29, 2012, which included a gain of $1.0 million arising out of the payment by the Singapore
government for taking a portion of our leased land, which required us to move our loading docks and purchase select new equipment. Other income—net was $1.4 million for the nine
months ended October 1, 2011; $1.6 million in fiscal 2011; $4.8 million in fiscal 2010, which included a $3.0 million gain on the successful settlement of an intellectual
property dispute; and $1.3 million in fiscal 2009.
Embedded derivative gain/(loss)—net. A derivative is any financial instrument whose value depends on another underlying instrument or index. An
embedded derivative, however, does not stand alone or trade independently. Instead, it is included in a "host contract". The features of our embedded derivatives require them to be separated from the
host contracts and accounted for separately at fair value.
We
have two types of embedded derivatives. First, our convertible preferred certificates, which are considered debt, provide both the Company and the holders of the convertible preferred certificates
certain rights to convert some, or all, of the convertible preferred certificates into common shares of
our Luxembourg Holding Company upon the occurrence of certain events. This conversion feature of the convertible preferred certificates is considered an embedded derivative, which is bifurcated from
the convertible preferred certificates and accounted for separately as a derivative liability. This separate accounting is required because the conversion feature affords the holders the right to
participate in any appreciation of the value of the Company through conversion of the convertible preferred certificates into common shares of our Luxembourg Holding Company. Conversion of the
convertible preferred certificates could provide the holders more value than would otherwise be obtained through the stated par value plus accreted interest.
In
addition, our current senior secured and mezzanine credit agreements contain provisions that require prepayment of principal prior to the stated maturity dates upon the occurrence of certain
events, including a change in control. These mandatory prepayment features triggered by a change in control are considered embedded derivatives that require bifurcation from the senior secured and
mezzanine credit agreements and separate accounting as derivative liabilities. This separate accounting is required because the change of control event requiring prepayment of the principal amounts is
not credit-related.
The
embedded derivative liabilities of our convertible preferred certificates and current credit agreements were recorded at fair value when initially issued. Management reassesses these fair values
quarterly, using input from an independent third-party valuation specialist. Any changes in the fair values of the embedded derivative liabilities are recorded as an embedded derivative gain /
(loss)—net in the consolidated statement of operations.
The changes in the fair values of these embedded derivative liabilities have no impact on our cash flows. As a result of our corporate reorganization and the effective conversion of our Sponsors'
investment in Isola from convertible preferred certificates to ordinary shares as well as the refinancing of our current credit agreements, we will no longer incur financial effects from the change in
the fair value of these embedded derivative liabilities after the completion of this offering.
51
Table of Contents
Management's Discussion and Analysis of Financial Condition and Results of Operations
Embedded derivatives associated with the convertible preferred certificates
We determine the fair values of the embedded derivative liabilities in accordance with Accounting Standards Codification ("ASC") 815,
Derivatives and Hedging. For the embedded derivative liabilities associated with our convertible preferred certificates, we use
methodologies and assumptions consistent with the AICPA Practice Aid, Valuation of Privately Held Company Equity Securities Issued as Compensation.
The
fair values ascribed to the embedded derivative liabilities of our convertible preferred certificates depend on our total equity value, which is derived after computing our total enterprise value
("TEV"). We usually estimate our TEV by using both income and market approaches. Only market approaches were used in fiscal 2009 due to the difficulties in forecasting our future cash flows, as
required under the income approach, in the midst of the recession and while operating in default under our prior first-and second-lien credit agreements.
The
income approach estimates our TEV by discounting our expected future cash flows at our weighted average cost of capital ("WACC"), which is the estimated after-tax weighted average cost
of the debt and equity that finances our assets, to determine a net present value. The market approaches estimate our TEV by comparing our business to similar businesses, whose securities are actively
traded in public markets, or to public transactions, such as mergers or acquisitions, from which valuation metrics can be obtained. Valuation multiples of key metrics, such as revenues and EBITDA, are
derived from the trading or transaction multiples of public companies that participate in our industry. These valuation multiples are then applied to the equivalent financial metrics of our business,
giving consideration to differences between our company and similar companies for such factors as company size, liquidity, financial leverage, profitability and growth prospects.
We
derive the total equity value of our Company by subtracting the fair value of our debt from the TEV. When the estimated total equity value of our Company increases from period to period, the value
of the embedded derivative liabilities associated with the convertible preferred certificates increases, and we record an embedded derivative loss. Conversely, when the total equity value of our
Company decreases from period to period, we record an embedded derivative gain. Any changes in TEV determined by the income approach will depend on our internally forecasted cash flows and our
estimated WACC, which in turn depends on interest rates and equity market risk premiums, among other factors. Any changes in TEV determined by the market approaches to valuation will depend on the
outlook for the economy, investor sentiment and the prospects for the electronics sector in which we participate.
In
fiscal 2008, our financial performance significantly worsened, reflecting the weakening worldwide economy, which resulted in a much lower total equity value, and an embedded derivative gain
associated with the convertible preferred certificates of $115.4 million.
As
the worldwide economy began to recover in mid-2009, our improved financial performance and more optimistic outlook for the future increased our total equity value, and we recorded an
embedded derivative loss of $27.5 million.
Our
total equity value continued to increase during fiscal 2010 as our actual and forecasted revenue, profits and cash flows each increased. However, we recorded an embedded derivative gain associated
with the convertible preferred certificates of $21.8 million due to the financing transaction that took place in September 2010. The issuance of and allocation of value to the additional
Class C convertible preferred certificates at the transaction date resulted in a reduction of the fair value of the embedded derivative liability associated with the previously outstanding
Class A convertible preferred certificates resulting in an embedded derivative gain for the year. The fair value of the embedded derivative liability related to the Class C convertible
preferred certificates was recorded as a discount at the date of issuance and therefore did not have
52
Table of Contents
Management's Discussion and Analysis of Financial Condition and Results of Operations
an
impact on the statement of operations. See Note 4 to our consolidated annual financial statements included elsewhere in this prospectus for a further discussion of the September 2010
financing transaction.
Our
total equity value decreased in fiscal 2011 reflecting a less optimistic outlook as the year unfolded. Consequently, we recorded an embedded derivative gain associated with the convertible
preferred certificates of $43.3 million.
Our total equity value increased for the nine months ended September 29, 2012, which resulted in an increase in the embedded derivative liability associated with the convertible preferred
certificates, and we recorded an embedded derivative loss of $55.4 million. The increase in our total equity value reflected a more optimistic outlook for cash profits and cash flows as of
September 29, 2012. This improved outlook primarily reflects our current expectation that we will sustain improved gross margins due to an increased percentage of revenue generated from our
high-performance products, as well as a reduction in forecasted capital expenditures over the next several years that will result in improved free cash flows. In addition to our improved outlook, the
market multiples of comparable publicly traded companies also increased, which when applied to our improved results from the last twelve month period, increased the indicated value using the market
approach.
See
"Critical Accounting Policies and Estimates—Fair Value Measurements" for additional details on factors affecting total equity value in each period, a further discussion of our WACC and
the factors and assumptions used to determine the fair value of the embedded derivatives associated with our convertible preferred certificates.
Embedded derivatives associated with the credit agreements
The embedded derivative gain / (loss) associated with the mandatory prepayment features of our current credit agreements does not depend on the TEV
or total equity
value of the Company. Instead, it reflects the changes in the assumed probability of a change in control event and the assumed timing of that event. The fair value of the embedded derivative
liabilities associated with our current credit agreements is determined by, first, computing the net present value of the projected future cash flows under these credit agreements assuming they
continue to maturity, and then by comparing that net present value to the net present value assuming a change-in-control event occurs, using an estimated probability of a
change in control and an estimated timing of the change in control.
The change in fair value of the embedded derivative liability associated with our credit agreements and the mandatory prepayment feature resulted in a gain of $9.5 million for the nine months
ended September 29, 2012, a loss of $1.0 million for fiscal 2011, and a loss of $0.6 million in fiscal 2010, the first period in which the credit agreements were outstanding.
See
"Critical Accounting Policies and Estimates—Fair Value Measurements" for a further discussion of the factors and assumptions used to determine the fair value of the embedded
derivatives associated with our current credit agreements.
Interest expense. Interest expense consists of cash and non-cash interest expense. Non-cash interest expense includes the amortization of
deferred loan origination costs, the amortization of original issue discount ("OID"), the accrual of PIK interest on our mezzanine debt and the accretion of interest on our convertible preferred
certificates. See "Description of Indebtedness—Our Existing Credit Agreements".
Total interest expense was $62.8 million for the nine months ended September 29, 2012, as compared to $59.5 million for the nine months ended October 1, 2011. This
$3.3 million increase was primarily due to higher amortization of both OID and deferred loan origination costs, both of which are amortized using the effective interest method. The amortization
expense is a constant percentage of the carrying value of the debt. Therefore, as the carrying value of the debt (principal less unamortized discounts) increases, the
53
Table of Contents
Management's Discussion and Analysis of Financial Condition and Results of Operations
amortization expense increases. Interest expense also increased due to an increase in the accreted interest on our mezzanine credit agreement. These increases in interest expense were offset by lower
accreted interest on our convertible preferred certificates due to the strengthening of the U.S. Dollar against the euro.
Non-cash interest expense was $34.7 million for the nine months ended September 29, 2012, as compared to $32.3 million for the nine months ended October 1,
2011. For the nine months ended September 29, 2012, non-cash interest included $11.8 million of PIK interest on
our mezzanine debt and $9.8 million of OID amortization expense (of which $3.7 million was attributable to loans under the senior secured credit agreement and $6.1 million was
attributable to loans under the mezzanine agreement), and $2.3 million amortization of deferred loan origination costs. Non-cash interest also includes $10.8 million of
accreted interest on the convertible preferred certificates for the nine months ended September 29, 2012.
Total
interest expense was $80.2 million in fiscal 2011, as compared to $72.1 million in fiscal 2010. This $8.1 million increase was primarily due to higher interest rates as well as higher OID
amortization (fiscal 2010 included only three months of OID amortization compared to a full 12 months of OID amortization in fiscal 2011). Non-cash interest expense was $43.6
million in fiscal 2011, as compared to $21.2 million in fiscal 2010. In fiscal 2011, non-cash interest included $14.7 million of PIK interest on our mezzanine credit agreement and $10.7
million of OID amortization expense (of which $4.5 million was attributable to loans under the senior secured credit agreement and $6.2 million was attributable to loans under the mezzanine credit
agreement), and $2.4 million amortization of deferred loan origination costs. Non-cash interest also includes accreted interest on the convertible preferred certificates of $15.8 million
in fiscal 2011 and $10.7 million in fiscal 2010.
Total interest expense was $72.1 million in fiscal 2010 and $54.9 million in fiscal 2009. Interest expense increased $17.2 million in fiscal 2010 compared to fiscal 2009. Interest
expense in fiscal 2010 included $9.5 million of "interest on unpaid interest" under the previous first- and second-lien credit facilities. Non-cash interest expense was
$21.2 million in fiscal 2010 and $11.7 million in fiscal 2009. Of the non-cash interest expense in fiscal 2010, $3.6 million was PIK interest on our mezzanine credit
agreement and $2.3 million was OID amortization (of which $1.0 million was attributable to loans under the senior secured credit agreement and $1.3 million was attributable to
loans under the mezzanine credit agreement). Non-cash interest of $4.6 million in fiscal 2010 was attributable to deferred loan origination costs of which $2.8 million was
due to the write-off of deferred loan origination costs related to our prior first- and second-lien credit facilities which were repaid in the fourth quarter of fiscal 2010.
Non-cash interest expense also includes interest on the convertible preferred certificates of $10.7 million in fiscal 2010 and $10.5 million in fiscal 2009.
We
intend to prepay in full our outstanding senior secured and mezzanine debt with the proceeds of this offering and with the proceeds of the issuance of new senior secured notes. The remaining
outstanding balances of the unamortized OID and deferred loan origination costs associated with our current credit agreements will be written off and charged as an expense in the current period. See
"—Factors Affecting Comparability—Reduction of Interest Expense" and "Use of Proceeds".
Foreign Exchange Effects
Our functional currency and reporting currency is the U.S. dollar. Gains or losses resulting from foreign currency transactions (transactions
denominated in a currency other than our subsidiaries' functional currencies) are included in foreign exchange gains and losses in the consolidated statement of operations in the period they occur.
Foreign
currency transaction gains and losses, unrealized translation gains and losses associated with certain of our foreign subsidiaries with a U.S. dollar functional currency that maintain their
books of record in a currency other than the U.S. dollar and unrealized translation gains and losses on short-term intercompany and operating receivables and payables denominated in a
currency other than the functional currency are included in foreign exchange gains and losses in the consolidated statement of operations.
54
Table of Contents
Management's Discussion and Analysis of Financial Condition and Results of Operations
For each foreign subsidiary whose functional currency is the local currency, assets and liabilities are translated into U.S. dollars using exchange rates prevailing at the end
of each reporting period, while revenues and expenses are translated at average rates in effect for the period. The related translation gains and losses are included in accumulated other comprehensive
income / (loss) within equity on the consolidated balance sheet.
Foreign exchange gain / (loss)—net was a gain of $1.9 million for the nine months ended September 29, 2012 as compared to a loss of $4.1 million for the nine months
ended October 1, 2011, a gain of $4.8 million in fiscal 2011, a gain of $9.6 million in fiscal 2010 and a loss of $2.1 million in fiscal 2009.
FACTORS AFFECTING COMPARABILITY
We anticipate that the following factors, which are described in greater detail above, will affect the comparability of our historic and future
financial performance:
- –>
- our
major restructuring activities have been largely completed, and we expect to incur an immaterial amount of charges related to these activities in the future;
- –>
- as
a result of the effective conversion of our Sponsors' investment in Isola from convertible preferred certificates to ordinary shares in connection with our
initial public offering, we will not incur financial effects (principally accreted non-cash interest expense and embedded derivative liability gain / (loss) related to these securities
subsequent to the effective date of the offering; and
- –>
- as
a result of the anticipated refinancing of our current credit agreements, we will not incur financial effects from the embedded derivative gain / (loss)
associated with these agreements subsequent to the date the debt is repaid or refinanced.
The
following sets forth additional factors that may affect the comparability of our historic and future results.
Fiscal Year and 53rd Week Impact
We operate on either a 52- or 53-week fiscal year. References to fiscal 2011 are for the fiscal year ended
December 31, 2011, references to fiscal 2010 are for the fiscal year ended January 1, 2011, and references to fiscal 2009 are for the fiscal year ended December 26, 2009.
Each
quarterly period of the fiscal year typically has 13 weeks, except for the occasional 53-week year when the fourth quarter has 14 weeks. This 53-week year
occurs every five to six years to keep the fiscal and calendar quarters in approximate alignment. Our fiscal years 2009 consisted of 52 weeks. Our 2010 fiscal year consisted of 53 weeks,
which had a favorable impact on revenue and operating income. Fiscal year 2011 was a 52-week year.
Reduction of Interest Expense
Immediately prior to the completion of our initial public offering, we will undergo a corporate reorganization that includes the effective conversion
of all of our outstanding convertible preferred certificates to ordinary shares. As a result of this conversion, we will no longer record accreted interest expense related to the convertible preferred
certificates. Accreted interest expense was $10.8 million for the nine months ended September 29, 2012 and $15.8 million in fiscal 2011. In the fiscal quarter in which the
conversion takes place, we will also reclassify the embedded derivative liabilities associated with our convertible preferred certificates to stockholder's equity in the consolidated balance sheet.
These embedded derivative liabilities had a balance of $ million
at , 2012. Additionally, we will
55
Table of Contents
Management's Discussion and Analysis of Financial Condition and Results of Operations
reclassify approximately $ million of OID incurred in connection with the Class C convertible preferred certificates to stockholder's equity in the consolidated
balance
sheet.
We
intend to use the proceeds of this offering, together with the proceeds from the issuance of $ million of senior secured notes due 2019 bearing interest
at %
per annum, to reduce our current indebtedness and to refinance the remaining balance of our current indebtedness. We also expect to enter into a new $ million senior
secured
revolving credit facility, bearing interest on outstanding amounts at % per annum.
As a result of these transactions, we expect to reduce our annualized cash interest expense by $ million and our total interest expense by
$ million.
Annualized interest expense savings are based on our annualized actual cash and non-cash interest expense for the nine months ended September 29, 2012. Also, in the fiscal quarter
in which we pay down and refinance our current debt, we will amortize to interest expense approximately $ million of OID, representing all of the remaining outstanding
OID
incurred in connection with these prior financings and write off approximately $ million of deferred loan origination costs. We expect that our interest expense will
be reduced
from the termination of the amortization of OID and deferred loan origination costs described above.
Management Fees and Expense
In connection with the acquisition and investment in the Isola Group by TPG, we entered into a management agreement with TPG, which remains one of
our Principal Sponsors. Management fees and related expenses were $1.5 million for both the nine months ended September 29, 2012 and October 1, 2011, $2.0 million in fiscal
2011 and $2.1 million in both fiscal 2010 and fiscal 2009. We had $0.6 million of accrued TPG management fees outstanding as of both September 29, 2012 and December 31,
2011. Concurrently with the closing of this offering, the TPG Management Agreement will be terminated, and we will no longer be obligated to pay future management fees to TPG. However, we will remain
obligated to pay TPG an $8.0 million transaction fee plus any accrued but unpaid management fees and related expenses through such date. See "Certain Relationships and Related Party
Transactions—Agreements with Our Sponsors".
Public Company Expense
Upon consummation of this public offering, we will become a public company and our ordinary shares will be listed for trading on the Nasdaq Global
Market. As a result, we will need to comply with numerous additional laws, regulations, and requirements. In 2011, we hired a General Counsel, a Director of External Reporting and a Senior Tax
Director, and we plan to hire other tax, finance, accounting and human resources personnel, as needed, to enhance our internal compliance capabilities. We have also added new independent board
members, who will be compensated in accordance with market practice, and we will procure more comprehensive director and officer liability insurance to cover our increased exposure as a public
company. We estimate that incremental annual public company costs will be approximately $3.0 million.
We expect that we will incur between $13 million and $14 million in expenses in connection with this offering, including our reorganization as a Cayman Islands company. We have incurred
$11.1 million in expenses in connection with this offering as of September 29, 2012, which we have elected to expense.
Non-cash Stock-based Compensation Charges
Upon consummation of the offering and capitalization of our new Cayman holding company, outstanding management equity awards will be converted to
equivalent awards in the new, publicly traded company. In
56
Table of Contents
Management's Discussion and Analysis of Financial Condition and Results of Operations
addition,
we adopted our 2012 Equity Incentive Plan under which we may make future equity awards to directors, executives, and other employees.
Upon
the closing, we anticipate granting restricted stock to our independent directors and various equity awards to officers and key employees. These equity awards will result in a
non-cash compensation charge to the consolidated statement of operations in future fiscal periods as the awards vest.
Tax Contingencies and Uncertain Tax Positions
We file income tax returns with U.S. federal, state and local and non-U.S. jurisdictions and are subject to audits of those returns. We
have closed or are otherwise no longer subject to Internal Revenue Service examinations for periods prior to 2010, although carry-forward attributes that were generated prior to 2010 may still be
adjusted upon examination by the Internal Revenue Service if they are used in a future period. We also recently closed an examination by German taxing authorities of our 2004 to 2007 tax years. With a
few exceptions, the Company and its subsidiaries are no longer subject to examination for years prior to 2004 in any jurisdiction.
Our effective tax rate had significant fluctuations over the periods presented (ranging from (7.9)% in fiscal 2009 to 95.7% in fiscal 2010 to 52.2% in fiscal 2011) primarily as a result of the
following factors: differences in statutory tax rates in the jurisdictions in which we do business; our recognition of valuation allowances in certain jurisdictions; and our accrual for uncertain tax
positions. These factors increased or decreased our effective tax rate by as much as 119.8% during the periods reported. Following this offering, as a result of our Sponsors converting their
investments in the convertible preferred certificates to ordinary shares and the refinancing of our existing credit
agreements, we anticipate that these factors will have a 12% to 23% impact on our effective tax rate for the foreseeable future.
As of December 31, 2011 and January 1, 2011, we have liabilities of $52.6 million and $53.4 million related to uncertain tax positions, respectively. The increase in our
uncertain tax positions during fiscal 2011 was partially reduced by settlements with taxing authorities. In this regard, an uncertain tax position represents our expected treatment of a tax position
taken in a filed tax return, or planned to be taken in a future tax return or claim that has not been reflected in measuring income tax expense for financial reporting purposes. Until these positions
are sustained by the taxing authorities, we do not recognize the tax benefits resulting from such positions and report the tax effects as a liability for uncertain tax positions in our consolidated
balance sheet. Much of the recorded liability for uncertain tax positions is associated with tax jurisdictions where we have experienced significant net operating losses in the past. Accordingly, a
significant portion of the recorded liability, if settled unfavorably, would not be settled in cash.
The
planned change in our domicile from Luxembourg to the Cayman Islands will not have an impact on our future income tax because neither Luxembourg nor the Cayman Islands imposes taxes on income
generated by lower-tier subsidiaries.
57
Table of Contents
Management's Discussion and Analysis of Financial Condition and Results of Operations
RESULTS OF OPERATIONS
The following table sets forth selected results of operations data for the periods presented and as a percentage of our revenue for those periods:
|
|
|
|
|
|
|
|
|
|
|
|
|
|
|
|
|
|
|
|
|
|
|
|
|
|
|
|
|
|
|
|
|
|
|
|
Nine months ended |
|
Fiscal year |
|
|
|
September 29,
2012 |
|
October 1,
2011 |
|
2011 |
|
2010 |
|
2009 |
|
|
|
Amount
|
|
% of
revenue
|
|
Amount
|
|
% of
revenue
|
|
Amount
|
|
% of
revenue
|
|
Amount
|
|
% of
revenue
|
|
Amount
|
|
% of
revenue
|
|
| |
|
Revenue |
|
$ |
437,804 |
|
|
100.0 |
% |
$ |
459,448 |
|
|
100 |
% |
$ |
596,989 |
|
|
100.0 |
% |
$ |
611,987 |
|
|
100.0 |
% |
$ |
424,199 |
|
|
100.0 |
% |
Cost of goods sold |
|
|
310,585 |
|
|
70.9 |
% |
|
350,669 |
|
|
76.3 |
% |
|
455,404 |
|
|
76.3 |
% |
|
467,751 |
|
|
76.4 |
% |
|
342,832 |
|
|
80.8 |
% |
| |
|
|
|
|
|
|
|
|
|
|
|
|
|
|
|
|
|
|
|
|
|
|
|
|
Gross profit |
|
|
127,219 |
|
|
29.1 |
% |
|
108,779 |
|
|
23.7 |
% |
|
141,585 |
|
|
23.7 |
% |
|
144,236 |
|
|
23.6 |
% |
|
81,367 |
|
|
19.2 |
% |
Operating expenses |
|
|
|
|
|
|
|
|
|
|
|
|
|
|
|
|
|
|
|
|
|
|
|
|
|
|
|
|
|
|
|
| |
Sales, general and administrative |
|
|
59,647 |
|
|
13.6 |
% |
|
57,057 |
|
|
12.4 |
% |
|
77,545 |
|
|
13.0 |
% |
|
65,271 |
|
|
10.7 |
% |
|
61,816 |
|
|
14.6 |
% |
| |
Research and development |
|
|
9,248 |
|
|
2.1 |
% |
|
7,913 |
|
|
1.7 |
% |
|
10,653 |
|
|
1.8 |
% |
|
9,532 |
|
|
1.6 |
% |
|
9,239 |
|
|
2.2 |
% |
| |
Restructuring |
|
|
(76 |
) |
|
0.0 |
% |
|
462 |
|
|
0.1 |
% |
|
1,250 |
|
|
0.2 |
% |
|
4,782 |
|
|
0.8 |
% |
|
17,497 |
|
|
4.1 |
% |
| |
Loss on liquidation of subsidiary |
|
|
— |
|
|
0.0 |
% |
|
— |
|
|
0.0 |
% |
|
— |
|
|
0.0 |
% |
|
— |
|
|
0.0 |
% |
|
3,548 |
|
|
0.8 |
% |
| |
|
|
|
|
|
|
|
|
|
|
|
|
|
|
|
|
|
|
|
|
|
|
|
|
| |
|
Total operating expenses |
|
|
68,819 |
|
|
15.7 |
% |
|
65,432 |
|
|
14.2 |
% |
|
89,448 |
|
|
15.0 |
% |
|
79,585 |
|
|
13.0 |
% |
|
92,100 |
|
|
21.7 |
% |
Operating income / (loss) |
|
|
58,400 |
|
|
13.3 |
% |
|
43,347 |
|
|
9.4 |
% |
|
52,137 |
|
|
8.7 |
% |
|
64,651 |
|
|
10.6 |
% |
|
(10,733 |
) |
|
(2.5 |
)% |
Other income—net |
|
|
2,382 |
|
|
0.5 |
% |
|
1,375 |
|
|
0.3 |
% |
|
1,629 |
|
|
0.3 |
% |
|
4,758 |
|
|
0.8 |
% |
|
1,268 |
|
|
0.3 |
% |
Embedded derivative gain / (loss)—net |
|
|
(45,890 |
) |
|
(10.5 |
)% |
|
27,959 |
|
|
6.1 |
% |
|
42,256 |
|
|
7.1 |
% |
|
21,165 |
|
|
3.5 |
% |
|
(27,513 |
) |
|
(6.5 |
)% |
Interest expense |
|
|
(62,840 |
) |
|
(14.4 |
)% |
|
(59,544 |
) |
|
(13.0 |
)% |
|
(80,210 |
) |
|
(13.4 |
)% |
|
(72,134 |
) |
|
(11.8 |
)% |
|
(54,893 |
) |
|
(12.9 |
)% |
Interest income |
|
|
79 |
|
|
0.0 |
% |
|
138 |
|
|
0.0 |
% |
|
221 |
|
|
0.0 |
% |
|
339 |
|
|
0.1 |
% |
|
567 |
|
|
0.1 |
% |
Foreign exchange gain / (loss)—net |
|
|
1,920 |
|
|
0.4 |
% |
|
(4,132 |
) |
|
(0.9 |
)% |
|
4,833 |
|
|
0.8 |
% |
|
9,596 |
|
|
1.6 |
% |
|
(2,083 |
) |
|
(0.5 |
)% |
| |
|
|
|
|
|
|
|
|
|
|
|
|
|
|
|
|
|
|
|
|
|
|
|
|
Income / (loss) before taxes |
|
|
(45,949 |
) |
|
(10.5 |
)% |
|
9,143 |
|
|
2.0 |
% |
|
20,866 |
|
|
3.5 |
% |
|
28,375 |
|
|
4.6 |
% |
|
(93,387 |
) |
|
(22.0 |
)% |
Provision for income taxes |
|
|
(18,593 |
) |
|
(4.2 |
)% |
|
(2,075 |
) |
|
(0.5 |
)% |
|
(10,893 |
) |
|
(1.8 |
)% |
|
(27,158 |
) |
|
(4.4 |
)% |
|
(7,339 |
) |
|
(1.7 |
)% |
| |
|
|
|
|
|
|
|
|
|
|
|
|
|
|
|
|
|
|
|
|
|
|
|
|
Net income / (loss) |
|
$ |
(64,542 |
) |
|
(14.7 |
)% |
$ |
7,068 |
|
|
1.5 |
% |
$ |
9,973 |
|
|
1.7 |
% |
$ |
1,217 |
|
|
0.2 |
% |
$ |
(100,726 |
) |
|
(23.7 |
)% |
| |
|
|
|
|
|
|
|
|
|
|
|
|
|
|
|
|
|
|
|
|
|
|
|
|
Nine Months Ended September 29, 2012 Compared to Nine Months Ended October 1, 2011
Overview—Revenue for the nine months ended September 29, 2012 was $437.8 million, a decrease of $21.6 million, or 4.7%, from
$459.4 million for the nine months ended October 1, 2011. Operating income for the nine months ended September 29, 2012 was $58.4 million, an increase of
$15.1 million, or 34.7%, from the comparable prior year period. Operating expenses increased $3.4 million, primarily due to higher personnel costs. Higher operating income on lower
revenues reflected a higher gross margin in the current period as a result of an improved product mix and lower raw material costs, both of which were partially offset by higher operating expenses for
increased personnel-related spending.
Revenue--
|
|
|
|
|
|
|
|
|
|
|
|
|
|
|
|
Nine months ended |
|
|
|
|
|
|
|
Change |
|
|
|
September 29,
2012
|
|
October 1,
2011
|
|
|
|
Amount
|
|
%
|
|
| |
|
|
|
(dollars in thousands)
|
|
Asia |
|
$ |
283,561 |
|
$ |
271,959 |
|
$ |
11,602 |
|
|
4.3 |
% |
Americas |
|
|
79,556 |
|
|
83,293 |
|
|
(3,737 |
) |
|
(4.5 |
)% |
Europe |
|
|
74,687 |
|
|
104,196 |
|
|
(29,509 |
) |
|
(28.3 |
)% |
| |
|
|
|
|
|
|
|
|
|
|
Total revenue |
|
$ |
437,804 |
|
$ |
459,448 |
|
$ |
(21,644 |
) |
|
(4.7 |
)% |
| |
|
|
|
|
|
|
|
|
|
|
58
Table of Contents
Management's Discussion and Analysis of Financial Condition and Results of Operations
Total revenue was $437.8 million for the nine months ended September 29, 2012 compared to $459.4 million for the nine months ended
October 1, 2011, a decrease of $21.6 million, or 4.7%. There was a reduction in unit volumes and change in product mix in each region as more fully detailed below, which resulted in a
net $6.3 million decrease in revenue. Prices were reduced for certain products to partially pass-through lower raw material costs. Lower prices accounted for a $9.6 million decrease in
revenue. The weaker euro to U.S. dollar exchange rate reduced revenue by $7.0 million in Europe.
Revenue in Asia for the nine months ended September 29, 2012 was $283.6 million, an increase of $11.6 million, or 4.3%, over the comparable prior year period. Total unit volumes
were 4.2% lower in the current period which accounted for a reduction in revenues of $11.3 million. Revenue was further eroded by $4.4 million due to price reductions to partially
pass-through lower raw material costs on certain products. The impact of lower total unit volumes and limited price reductions was more than offset by increased revenue from higher-priced,
high-performance products which accounted for a $27.2 million increase in Asia's revenue and reflected our success in qualifying our high-performance products for new applications. Our standard
product unit volume declined 40.1% in the current year period compared to the prior year period as a result of lower demand for automotive applications and low-technology applications in India.
Revenue in the Americas for the nine months ended September 29, 2012 was $79.6 million, a decrease of $3.7 million, or 4.5%, from the comparable prior year period. Lower revenue
reflected lower unit volumes, which decreased 6.9% as a result of generally weaker end-market demand in the current period and resulted in a $5.9 million reduction in revenue. We believe that
the lower revenue for the nine months ended September 29, 2012 was a result of generally weaker end-market demand for servers, storage devices and other electronic products relating to
uncertain worldwide economic conditions. Price reductions to partially pass through lower raw material costs decreased revenue by $0.9 million. The decrease in revenue due to lower unit volumes
and lower pricing was offset by an improved product mix which increased revenue by $2.9 million.
Revenue in Europe for the nine months ended September 29, 2012 was $74.7 million, a decrease of $29.5 million, or 28.3%, compared to the nine months ended October 1, 2011.
The current economic and political crises in the eurozone have severely reduced demand for our products. The reduction in revenue was attributable to lower unit volumes, which decreased 20.3% on
reduced demand for medical and industrial applications, including applications for the solar power industry that has been further challenged by uncertainties about the continuation of government
subsidies for solar power. Lower unit volumes accounted for $19.2 million of the reduction in revenue. Also contributing to the revenue reduction was the weaker euro to U.S. dollar exchange
rate, which accounted for a $7.0 million decrease in revenue, and lower average selling prices, which accounted for $4.4 million of the decrease in revenue.
Overall, revenue from our high-performance products increased 1.3% for the nine months ended September 29, 2012 compared to the nine months ended October 1, 2011. Sales of
high-performance products accounted for 87% of our gross sales for the nine months ended September 29, 2012 compared to 82% of gross sales for the nine months ended October 1, 2011. The
stronger demand for our high-performance products reflected our continued marketing focus on these products.
Revenue from our high-speed digital products, a subset of our high-performance products, increased significantly, offsetting decreases in our other high performance product categories. Our high-speed
digital products are used in enterprise class servers and storage applications, as well as in high-speed routers and communication equipment, that support the expanding cloud computing environment and
increased Internet traffic. Our increased revenue from high-speed digital products reflects our success in qualifying these products for new applications as well as the relative price inelasticity of
these products.
59
Table of Contents
Management's Discussion and Analysis of Financial Condition and Results of Operations
Gross sales for our high-performance and standard products are shown below:
|
|
|
|
|
|
|
|
|
|
|
|
|
|
|
|
|
Nine months ended |
|
|
|
|
|
|
|
Change |
|
|
|
September 29,
2012
|
|
October 1,
2011
|
|
Gross Sales(1)
|
|
Amount
|
|
%
|
|
| |
|
|
|
(dollars in thousands)
|
|
High-performance |
|
|
|
|
|
|
|
|
|
|
|
|
|
| |
High-Tg |
|
$ |
229,581 |
|
$ |
271,845 |
|
$ |
(42,264 |
) |
|
(15.5 |
)% |
| |
High-speed digital |
|
|
138,050 |
|
|
86,282 |
|
|
51,768 |
|
|
60.0 |
% |
| |
Military, specialty and other |
|
|
21,191 |
|
|
25,845 |
|
|
(4,654 |
) |
|
(18.0 |
)% |
| |
|
|
|
|
|
|
|
|
|
|
Total high-performance |
|
|
388,822 |
|
|
383,972 |
|
|
4,850 |
|
|
1.3 |
% |
Standard |
|
|
58,515 |
|
|
86,564 |
|
|
(28,049 |
) |
|
(32.4 |
)% |
| |
|
|
|
|
|
|
|
|
|
|
Total gross sales |
|
$ |
447,337 |
|
$ |
470,536 |
|
$ |
(23,199 |
) |
|
(4.9 |
)% |
| |
|
|
|
|
|
|
|
|
|
|
- (1)
- Gross sales represent revenue prior to certain adjustments for cash discounts, rebates and other revenue adjustments that cannot be allocated to a specific product segment. These
adjustments totaled $9.5 million for the nine months ended September 29, 2012 and $11.1 million for the nine months ended October 1, 2011. Revenue was $437.8 million
for the nine months ended September 29, 2012 and $459.4 million for the nine months ended October 1, 2011. Management uses gross sales as a measure of operating performance.
Cost of goods sold and gross profit--
|
|
|
|
|
|
|
|
|
|
|
|
|
|
|
|
|
|
|
|
|
|
Nine months ended |
|
|
|
|
|
|
|
September 29, 2012 |
|
October 1, 2011 |
|
|
|
|
|
|
|
Change |
|
|
|
|
|
% of
revenue
|
|
|
|
% of
revenue
|
|
|
|
Amount
|
|
Amount
|
|
Amount
|
|
%
|
|
| |
|
|
|
(dollars in thousands)
|
|
Cost of goods sold |
|
$ |
310,585 |
|
|
70.9 |
% |
$ |
350,669 |
|
|
76.3 |
% |
$ |
(40,084 |
) |
|
(11.4 |
)% |
Gross profit |
|
$ |
127,219 |
|
|
29.1 |
% |
$ |
108,779 |
|
|
23.7 |
% |
$ |
18,440 |
|
|
17.0 |
% |
Cost of goods sold was $310.6 million for the nine months ended September 29, 2012, a decrease of $40.1 million, or 11.4%, from the
comparable prior year period. The decrease in cost of goods sold was driven primarily by the following factors:
- –>
- a
$16.5 million decrease in raw material costs due to lower unit volumes, which decreased 7.5%;
- –>
- a
$17.5 million decrease in the cost of raw materials, which decreased 7.4% on an average per unit basis, primarily due to the lower cost of copper and glass;
and
- –>
- a
$6.1 million decrease in conversion costs that is, all factory costs except the cost of raw materials.
Gross profit was $127.2 million for the nine months ended September 29, 2012, an increase of $18.4 million, or 17.0%, from the comparable prior year period. The increase in gross
profit was driven primarily by a $18.9 million increase due to an improved product mix; that is, an increased percentage of revenue from our higher margin, high-performance products,
specifically high-speed digital products. The weaker euro to U.S. dollar exchange rate reduced gross profit by $1.0 million.
Operating expenses. Total operating expenses increased by $3.4 million, or 5.2%, for the nine months ended September 29, 2012 compared to the nine
months ended October 1, 2011. The increase in operating
60
Table of Contents
Management's Discussion and Analysis of Financial Condition and Results of Operations
expenses was due to higher SG&A expense and research and development expense, as more fully described below.
|
|
|
|
|
|
|
|
|
|
|
|
|
|
|
|
|
|
|
|
|
|
Nine months ended |
|
|
|
|
|
|
|
September 29, 2012 |
|
October 1, 2011 |
|
|
|
|
|
|
|
Change |
|
|
|
|
|
% of
revenue
|
|
|
|
% of
revenue
|
|
|
|
Amount
|
|
Amount
|
|
Amount
|
|
%
|
|
| |
|
|
|
(dollars in thousands)
|
|
Sales, general and administrative |
|
$ |
59,647 |
|
|
13.6 |
% |
$ |
57,057 |
|
|
12.4 |
% |
$ |
2,590 |
|
|
4.5 |
% |
Research and development |
|
|
9,248 |
|
|
2.1 |
% |
|
7,913 |
|
|
1.7 |
% |
|
1,335 |
|
|
16.9 |
% |
Restructuring |
|
|
(76 |
) |
|
0.0 |
% |
|
462 |
|
|
0.1 |
% |
|
(538 |
) |
|
(116.5 |
)% |
| |
|
|
|
|
|
|
|
|
|
|
|
|
|
Total operating expenses |
|
$ |
68,819 |
|
|
15.7 |
% |
$ |
65,432 |
|
|
14.2 |
% |
$ |
3,387 |
|
|
5.2 |
% |
| |
|
|
|
|
|
|
|
|
|
|
|
|
|
Sales, general and administrative. SG&A expense increased to $59.6 million (13.6% of revenue) for the nine months ended September 29, 2012 from
$57.1 million (12.4% of revenue) for the nine months ended October 1, 2011. The $2.6 million increase in SG&A expense for the current year period was primarily due to higher
salaries and other personnel-related expense, which increased $3.2 million as a result of increased headcount and higher accruals required for our variable incentive compensation plan. The
higher personnel-related costs were partially offset by a $0.6 million decrease in other SG&A expense.
Research and development. R&D expense for the nine months ended September 29, 2012 increased to $9.2 million (2.1% of revenue) from
$7.9 million (1.7% of revenue) for the nine months ended October 1, 2011. The $1.3 million increase in R&D expense was primarily due to higher personnel-related costs and higher
legal fees in support of intellectual property defense.
Restructuring. The restructuring expense for both periods was primarily attributable to ongoing maintenance expenses associated with our previously closed facility
in Fremont, California. Restructuring expense for the nine months ended September 29, 2012 included a gain of $0.2 million on the sale of our facility in Fremont, California.
Operating income/(loss)
|
|
|
|
|
|
|
|
|
|
|
|
|
|
|
|
|
|
|
|
|
|
Nine months ended |
|
|
|
|
|
|
|
September 29, 2012 |
|
October 1, 2011 |
|
|
|
|
|
|
|
Change |
|
|
|
|
|
% of
revenue
|
|
|
|
% of
revenue
|
|
|
|
Amount
|
|
Amount
|
|
Amount
|
|
%
|
|
| |
|
|
|
(dollars in thousands)
|
|
Asia |
|
$ |
61,337 |
|
|
14.0 |
% |
$ |
45,580 |
|
|
9.9 |
% |
$ |
15,757 |
|
|
34.6 |
% |
Americas |
|
|
17,206 |
|
|
3.9 |
% |
|
11,125 |
|
|
2.4 |
% |
|
6,081 |
|
|
54.7 |
% |
Europe |
|
|
(232 |
) |
|
(0.1 |
)% |
|
7,980 |
|
|
1.7 |
% |
|
(8,212 |
) |
|
(102.9 |
)% |
Corporate |
|
|
(19,911 |
) |
|
(4.5 |
)% |
|
(21,338 |
) |
|
(4.6 |
)% |
|
1,427 |
|
|
6.7 |
% |
| |
|
|
|
|
|
|
|
|
|
|
|
|
|
|
|
|
Total operating income |
|
$ |
58,400 |
|
|
13.3 |
% |
$ |
43,347 |
|
|
9.4 |
% |
$ |
15,053 |
|
|
34.7 |
% |
| |
|
|
|
|
|
|
|
|
|
|
|
|
|
|
|
|
Operating income for the nine months ended September 29, 2012 was $58.4 million, which was an increase of $15.1 million, or 34.7%, compared
to the nine months ended October 1, 2011. The primary driver of our improved operating income in the current year period was an improved gross margin, which increased to 29.1% in the current
year period from 23.7% in the prior year period due to an improved product mix as well as lower raw material costs. However, the impact on operating income of the higher gross profit earned in the
current year period was moderated by higher operating expenses, as discussed above.
61
Table of Contents
Management's Discussion and Analysis of Financial Condition and Results of Operations
Operating income in Asia for the nine months ended September 29, 2012 was $61.3 million, an increase of $15.8 million, or 34.6%, from the comparable prior year period. The
increase in operating income was due to the following factors:
- –>
- an
$11.6 million increase in revenue (as discussed above) despite lower unit volumes, which decreased 4.2%;
- –>
- an
$10.1 million decrease in raw materials costs, reflecting a $6.5 million decrease due to lower unit volumes and a $3.6 million (2.3% on an
average per unit basis) decrease in the purchase price of raw materials;
- –>
- a
$1.2 million increase in conversion costs (6.9% on an average per unit basis), which reflected lower unit volumes;
- –>
- a
$3.2 million increase in SG&A expense primarily related to personnel-related costs ($1.8 million), the absence in the current year of the reversal of
an environmental claim in the second quarter of the prior year ($0.7 million), and an increase in other expenses ($0.7 million); and
- –>
- a
$1.5 million net decrease due to higher other operating expenses.
Operating income in the Americas for the nine months ended September 29, 2012 was $17.2 million, an increase of $6.1 million, or 54.7%, from the comparable prior year period.
Operating income increased despite a $3.7 million decrease in revenue (as discussed above) due to lower unit volumes which decreased 6.9%. The increase in operating income was primarily due to
the following factors:
- –>
- an
$8.9 million increase in intercompany revenues as a result of increased exports of high-performance resin systems to Asia;
- –>
- a
$1.6 million decrease in raw materials costs, reflecting lower unit volumes, which decreased raw material costs by $3.2 million, partially offset by
a $1.6 million (3.6% on an average per unit basis) increase in the purchase price of raw materials, principally copper foil and fiberglass fabrics; and
- –>
- a
$0.7 million net decrease due to higher operating expenses offset by lower conversion costs.
Operating income in Europe for the nine months ended September 29, 2012 was a loss of $0.2 million, a decrease of $8.2 million, or 102.9%, compared to the prior year period. The
decrease in operating income was driven primarily by:
- –>
- a
$29.5 million decrease in revenue (as discussed above) due to lower unit volumes, which decreased 20.3%;
- –>
- a
$13.3 million decrease in raw materials costs, reflecting lower unit volumes, which decreased raw materials costs by $9.6 million, and a
$3.7 million decrease (7.3% on an average per unit basis) in the purchase price of raw materials primarily due to the lower cost of copper and glass;
- –>
- a
$6.1 million decrease in conversion costs due to lower labor costs and variable overhead expenses which decreased $4.0 million and other factory
costs which decreased $2.1 million; and
- –>
- a
$1.9 million increase due to higher intercompany revenue and lower operating expenses.
The Corporate operating loss for the nine months ended September 29, 2012 was $19.9 million compared to $21.3 million for the nine months ended October 1, 2011. The lower
operating loss in the current period was driven primarily by:
- –>
- lower
SG&A expense of $0.7 million resulting from lower audit and legal fees ($4.2 million) offset by higher accruals under our variable incentive
compensation plan and higher personnel-related costs due to increased headcount ($1.5 million). During the second half of fiscal 2011, we hired new employees,
62
Table of Contents
Management's Discussion and Analysis of Financial Condition and Results of Operations
primarily
in finance and accounting to support our efforts related to this offering and the subsequent reporting requirements as a public company. Other SG&A expense increased $2.0 million; and
- –>
- higher
R&D expense of $1.4 million resulting from higher personnel-related costs ($0.7 million) as well as higher legal fees ($0.6 million) in
support of intellectual property defense. Other R&D expense increased $0.1 million.
Other non-operating income / (expense)
|
|
|
|
|
|
|
|
|
|
|
|
|
|
|
|
|
|
|
|
|
|
Nine months ended |
|
|
|
|
|
|
|
September 29, 2012 |
|
October 1, 2011 |
|
|
|
|
|
|
|
Change |
|
|
|
|
|
% of
revenue
|
|
|
|
% of
revenue
|
|
|
|
Amount
|
|
Amount
|
|
Amount
|
|
%
|
|
| |
|
|
|
(dollars in thousands)
|
|
Other income--net |
|
$ |
2,382 |
|
|
0.5 |
% |
$ |
1,375 |
|
|
0.3 |
% |
$ |
1,007 |
|
|
73.2 |
% |
Embedded derivative gain / (loss)--net |
|
|
(45,890 |
) |
|
(10.5 |
)% |
|
27,959 |
|
|
6.1 |
% |
|
(73,849 |
) |
|
(264.1 |
)% |
Interest expense |
|
|
(62,840 |
) |
|
(14.4 |
)% |
|
(59,544 |
) |
|
(13.0 |
)% |
|
(3,296 |
) |
|
(5.5 |
)% |
Interest income |
|
|
79 |
|
|
0.0 |
% |
|
138 |
|
|
0.0 |
% |
|
(59 |
) |
|
(42.8 |
)% |
Foreign exchange gain / (loss)--net |
|
|
1,920 |
|
|
0.4 |
% |
|
(4,132 |
) |
|
(0.9 |
)% |
|
6,052 |
|
|
146.5 |
% |
| |
|
|
|
|
|
|
|
|
|
|
|
|
|
|
|
|
Total non-operating income / (expense) |
|
$ |
(104,349 |
) |
|
(23.8 |
)% |
$ |
(34,204 |
) |
|
(7.4 |
)% |
$ |
(70,145 |
) |
|
(205.1 |
)% |
| |
|
|
|
|
|
|
|
|
|
|
|
|
|
|
|
|
Other income--net. Other income--net was $2.4 million for the nine months ended September 29, 2012 and $1.4 million for the nine months ended
October 1, 2011. The current year period includes a gain of $1.0 million arising from compensation from the government of Singapore government in exchange for taking a portion of our
leased land, which required us to relocate our loading docks and purchase certain new equipment.
Embedded derivative gain / (loss)--net. The embedded derivative gain / (loss)--net reflected the change in the values of the embedded derivatives in some of our
financial instruments. The change in value is determined quarterly. The conversion feature of our convertible preferred certificates is considered an embedded derivative. In addition, the mandatory
prepayment features, triggered by a change in control under our current senior secured and mezzanine credit agreements, are also considered embedded derivatives. We recorded a net embedded derivative
loss of $45.9 million for the nine months ended September 29, 2012 compared to a net embedded derivative gain of $28.0 million for the nine months ended October 1, 2011.
When our embedded derivative liabilities increase, we record an embedded derivative loss. Conversely, when our embedded derivative liabilities decrease, we record an embedded derivative gain. We
recorded an embedded derivative loss related to the convertible preferred certificates of $55.4 million for the nine months ended September 29, 2012 compared to a gain of
$29.5 million for the nine months ended October 1, 2011. The net embedded derivative loss for the current year period primarily reflected an increase in our total equity value due to
more optimistic projections for the Company's profits and cash flows as of September 29, 2012. The improved outlook was based on the expectation that we will sustain improved gross margins due
to a greater percentage of revenues generated from our high-performance products and our continued success in qualifying them for new applications, as well as the anticipated reduction in our required
capital expenditures over the next several years which increased our projected free cash flows. In addition, the revenue and EBITDA multiples of the comparable companies benchmarked in
63
Table of Contents
Management's Discussion and Analysis of Financial Condition and Results of Operations
the market guideline public company approach improved resulting in a higher TEV which, in turn, resulted in a higher embedded derivative liability.
For the nine months ended October 1, 2011, we recorded a net embedded derivative gain associated with the convertible preferred certificates although our TEV and total equity value increased
slightly (1.4% and 1.3%, respectively) compared to the end of fiscal 2010. This was the result of changes made to other underlying assumptions in the determination of our TEV and total equity value.
Volatility decreased from 80% as of January 1, 2011 to 70% as of October 1, 2011 reflecting an improved economic outlook and improvements in our actual and projected operating financial
performance. We reduced the time-to-liquidity assumption from twelve months as of January 1, 2011 to six months as of October 1, 2011, as a result of two factors. First, we estimated
that the extensive work associated with the planned initial public offering ("IPO"), including the preparation of due diligence materials, would shorten the amount of time for a potential acquirer to
be able to evaluate and complete a transaction with the Company. Second, we believed that an initial IPO filing, which we considered to be closer to completion as of October 1, 2011 than as of
January 1, 2011, could motivate potential acquirers to approach the Company about a possible transaction. The decrease in both the volatility and the time-to-liquidity assumptions resulted in a
decrease in the value of the embedded derivative liability and the recognition of a net embedded derivative gain for the nine months ended October 1, 2011.
We recorded an embedded derivative gain of $9.5 million for the nine months ended September 29, 2012 and an embedded derivative loss of $1.5 million for the nine months ended
October 1, 2011 related to our current credit agreements. The decrease in the value of the embedded derivative liability was primarily due to the reduction in the assumed probability of the
occurrence of a change of control event from 20% as of December 31, 2011 to 5% as of September 29, 2012. The reduction in the assumed probability of a change in control reflected the
passing of time without a potential acquirer coming forth to express interest prior to the completion of the planned IPO.
The derivative loss in the prior year period related to our credit agreements reflected a decrease in the expected time to a potential change in control event (such as a sale of the company or
potential alternate transaction) as of October 1, 2011.
Our Sponsors will effectively convert their investments in the Company from convertible preferred certificates to ordinary shares in connection with this offering, and thereafter we will not incur
further financial effects related to the convertible preferred certificates. However, any change in the value of the convertible preferred certificates' embedded derivative will be included in our
financial statements for periods prior to the date this offering is completed.
Interest expense and interest income. Total interest expense increased $3.3 million, or 5.5%, to $62.8 million for the nine months ended
September 29, 2012 from $59.5 million for the comparable prior year period. The increase in interest expense was due to increased amortization of OID and deferred loan origination costs
related to our senior secured and mezzanine credit agreements in the current year period as well as the higher outstanding principal balances under the mezzanine credit agreement in the current year
period compared to the prior year period due to the accretion of the PIK component of interest expense. The increase in interest expense due to the items enumerated above was partially offset by lower
accreted interest expense on our CPCs. The accreted interest expense on our CPCs is a euro-denominated transaction. The US dollar gained strength against the euro in the current year period resulting
in lower accreted interest expense on the CPCs.
Interest expense for the nine months ended September 29, 2012 included $9.8 million of OID amortization ($3.7 million related to our senior secured credit agreement and
$6.1 million related to our mezzanine credit agreement) as well as $2.3 million amortization of deferred loan origination costs. For the nine months ended October 1, 2011,
interest expense included $7.8 million of OID amortization ($3.3 million related to
64
Table of Contents
Management's Discussion and Analysis of Financial Condition and Results of Operations
our senior secured credit agreement and $4.5 million related to our mezzanine credit agreement) as well as $1.7 million amortization of deferred loan origination costs.
Foreign exchange gain / (loss)--net. We recorded a net foreign exchange gain of $1.9 million for the nine months ended September 29, 2012 compared to
a net foreign exchange loss of $4.1 million for the nine months ended October 1, 2011.
During the first six months of the fiscal 2012 period, the U.S. dollar strengthened against the euro which resulted in a net foreign exchange gain for the nine months ended September 29, 2012.
The U.S. dollar lost strength against the euro on the third quarter of fiscal 2012 slightly offsetting the foreign exchange gains recorded during the first half of the year. During the nine months
ended October 1, 2011, the U.S. dollar weakened against the euro, which resulted in a foreign exchange loss.
The net foreign exchange gain for the nine months ended September 29, 2012 was primarily related to our subsidiary in the United Kingdom ($0.8 million) and our Luxembourg holding
companies ($0.4 million). Our U.K. subsidiary has euro-denominated accounts payable. The functional currency of this subsidiary was the British pound for the first eight months of fiscal 2012.
The British pound strengthened against the euro during the nine months ended September 29, 2012 resulting in a foreign exchange gain. During the third quarter of fiscal 2012, the functional
currency of this subsidiary was changed to the U.S. dollar. See "Critical Accounting Policies and Estimates--Foreign Currency Transactions and Translations".
The functional currency of our Luxembourg holding companies is the U.S. dollar. The convertible preferred certificates and the associated embedded derivative liabilities are euro-denominated
liabilities. As the U.S. dollar strengthens against the euro, it requires fewer U.S. dollars to settle the convertible preferred certificates and the associated embedded derivative liabilities, and we
record a foreign exchange gain.
For the nine months ended October 1, 2011, the net foreign exchange loss was primarily related to our Luxembourg holding companies and the convertible preferred certificates and the associated
embedded derivative liabilities. We recorded a foreign exchange loss of $4.8 million for the nine months ended October 1, 2011 related to the convertible preferred certificates and
associated embedded derivative liabilities.
The foreign exchange loss for the prior year period related to the convertible preferred certificates and associated embedded derivative liabilities was partially offset by a foreign exchange gain of
$0.6 million in our German subsidiary related to U.S. dollar-denominated payables.
Provision for income taxes
|
|
|
|
|
|
|
|
|
|
|
|
|
|
|
|
|
|
|
|
|
|
Nine months ended |
|
|
|
|
|
|
|
September 29, 2012 |
|
October 1, 2011 |
|
|
|
|
|
|
|
Change |
|
|
|
|
|
% of
revenue
|
|
|
|
% of
revenue
|
|
|
|
Amount
|
|
Amount
|
|
Amount
|
|
%
|
|
| |
|
|
|
(dollars in thousands)
|
|
Income / (loss) before taxes |
|
$ |
(45,949 |
) |
|
(10.5 |
)% |
$ |
9,143 |
|
|
2.0 |
% |
$ |
(55,092 |
) |
|
(602.6 |
)% |
Provision for income taxes |
|
$ |
(18,593 |
) |
|
(4.2 |
)% |
$ |
(2,075 |
) |
|
(0.5 |
)% |
$ |
(16,518 |
) |
|
(796.0 |
)% |
Effective tax rate |
|
|
(40.5 |
)% |
|
|
|
|
22.7 |
% |
|
|
|
|
(63.2 |
)% |
|
|
|
Our interim income tax provisions are calculated based on quarterly forecasts of our expected annual effective tax rate which is then applied to interim pre-tax
income, after possible adjustments for any discrete items such as statutory tax rate changes that occurred within the period. Our effective tax rate, after consideration of discrete items, was (40.5)%
for the nine months ended September 29, 2012, a change of 63.2 percentage points from the comparable prior year period. The decrease in the forecasted effective tax
65
Table of Contents
Management's Discussion and Analysis of Financial Condition and Results of Operations
rate is due to a 211.4 percentage point decrease related to valuation allowances offset by 145.0 percentage point increase related to settlements reached with tax authorities in Germany and Taiwan.
Our forecasted annual effective tax rate was affected by valuation allowances and accruals for uncertain tax positions. Valuation allowances against deferred tax assets are required when there is
uncertainty about our ability to generate future profits in a particular tax jurisdiction. We recognized changes in valuation allowances in two material jurisdictions, which decreased the forecasted
effective rate for the nine months ended September 29, 2012, as compared to the nine months ended October 1, 2011 as follows:
|
|
|
|
|
Jurisdiction
|
|
Valuation
allowance
|
|
| |
|
Luxembourg |
|
|
(260.9 |
)% |
United States |
|
|
49.5 |
% |
| |
|
|
|
Total |
|
|
(211.4 |
)% |
| |
|
|
|
As a result of embedded derivative losses associated with our convertible preferred certificates, the taxable loss of our Luxembourg entities increased in the
nine months ended September 29, 2012, compared to the comparable prior year period, which required an increase to the valuation allowance and decreased our effective tax rate by
260.9 percentage points. Our Sponsors will effectively convert their investments in the convertible preferred certificates to ordinary shares in connection with this offering. Accordingly, our
effective tax rate will not be impacted by embedded derivative gains or losses after the completion of this offering.
As a result of embedded derivative gains associated with our senior secured and mezzanine credit agreements, our entities in the United States incurred reduced losses for the nine months ended
September 29, 2012, compared to the prior year period. These reduced losses resulted in a reduction to the valuation allowance in the United States and an increase in our forecasted effective
tax rate of 49.5 percentage points. All of the loans outstanding under our existing senior secured and mezzanine credit agreements will be repaid in connection with this offering and the
concurrent refinancing. Therefore, our forecasted effective tax rate will not be impacted by the embedded derivative gains or losses, or related changes in the required valuation allowances, after the
completion of this offering.
Settlements were reached with the tax authorities in Taiwan during the nine months ended September 29, 2012 and with tax authorities in Germany and Taiwan during the prior year period. As a
result of these settlements, the uncertain tax positions had the following impact on our forecasted effective rate for the nine months ended September 21, 2012, as compared to the nine months
ended October 1, 2011:
|
|
|
|
|
Jurisdiction
|
|
Uncertain tax positions
|
|
| |
|
Germany |
|
|
122.5 |
% |
Taiwan |
|
|
22.5 |
% |
| |
|
|
|
Total |
|
|
145.0 |
% |
| |
|
|
|
Fiscal Year 2011 Compared to Fiscal Year 2010
Overview—Overall revenues decreased a relatively modest 2.5% for fiscal 2011 compared to fiscal 2010, reflecting less robust unit demand as a result of challenging
macroeconomic conditions and events affecting the supply chain during the year, offset in part by higher prices. We continued to experience relatively stronger demand for our
high-performance products, consistent with our strategic focus on these products.
66
Table of Contents
Management's Discussion and Analysis of Financial Condition and Results of Operations
Operating
income for fiscal 2011 was $12.5 million, or 19.4%, lower than in the prior year, primarily due to $9.2 million of operating expenses related to preparation for our initial
public offering. Our gross margin was slightly higher in fiscal 2011 (23.7%) than in fiscal 2010 (23.6%), reflecting higher selling prices and improved product mix.
Revenue—
|
|
|
|
|
|
|
|
|
|
|
|
|
|
|
|
Fiscal Year |
|
Change |
|
|
|
2011
|
|
2010
|
|
Amount
|
|
%
|
|
| |
|
|
|
(dollars in thousands)
|
|
Asia |
|
$ |
362,182 |
|
|
349,421 |
|
|
12,761 |
|
|
3.7 |
% |
Americas |
|
|
108,832 |
|
|
129,109 |
|
|
(20,277 |
) |
|
(15.7 |
)% |
Europe |
|
|
125,975 |
|
|
133,457 |
|
|
(7,482 |
) |
|
(5.6 |
)% |
| |
|
|
|
|
|
|
|
|
|
|
Total revenue |
|
$ |
596,989 |
|
$ |
611,987 |
|
$ |
(14,998 |
) |
|
(2.5 |
)% |
| |
|
|
|
|
|
|
|
|
|
|
Total revenue was $597.0 million for fiscal 2011 compared to $612.0 million for fiscal 2010, a decrease of $15.0 million, or 2.5%. Lower unit
volumes resulted in a $75.9 million reduction of revenue
while higher prices increased revenue by $54.0 million. The stronger euro to the U.S. dollar exchange rate contributed $6.9 million of additional revenue.
Revenue
in Asia for fiscal 2011 increased $12.8 million, or 3.7%, over the comparable prior year period. Improved pricing resulted in an increase in total revenue of $29.5 million, which was
partially offset by a decrease in revenue of $16.7 million due to a 7.5% reduction in unit volumes. Unit volumes decreased in Asia in fiscal 2011 due to weaker industry demand in the last three
quarters of the year, reflecting economic uncertainties and disruption in the supply chain caused by the tsunami and its aftermath in Japan and the record flooding around Bangkok, Thailand. Unit
volumes of our high-performance products decreased 1.8% and unit volumes of our standard products decreased 38.1% in fiscal 2011 as compared to fiscal 2010. The average selling price of our
high-performance and standard products increased 10.1% and 15.7%, respectively, in fiscal 2011. The price increases reflected in part the pass-through of the increased cost of raw
materials, which increased 11.1% on a per unit basis.
Revenues
in the Americas were $20.3 million, or 15.7%, lower in fiscal 2011 compared to the prior year. Lower revenues reflect the lower unit volumes, which were down 20.4% as a result of the weaker
economic environment and increased uncertainties for the future of the U.S. economy which cause inventory tightening within the supply chain and dampened capital spending for electronic equipment. In
contrast, fundamental demand for electronics in the prior year was bolstered by inventory restocking of materials within the supply chain. Lower unit volumes in fiscal 2011 resulted in a decrease in
revenue of $25.7 million; however the impact of lower volumes was partially offset by higher pricing which contributed $5.5 million to revenue in fiscal 2011. Unit volumes of
high-performance products decreased 19.6%, and the unit volumes for our standard products decreased 48.2% in fiscal 2011 as compared to fiscal 2010. The average selling prices for
high-performance products and standard products increased by 5.1% and 17.9%, respectively, in fiscal 2011 as compared to fiscal 2010. The price increases reflected in part the pass-through
of the increased cost of raw materials, which increased 6.4% on a per unit basis.
Revenue
in Europe decreased $7.5 million, or 5.6%, for fiscal 2011 versus fiscal 2010. Improved pricing and a stronger euro to U.S. dollar exchange rate offset the impact of lower unit volumes. Unit
volumes decreased 20.4% resulting in a $33.5 million reduction in revenue in fiscal 2011. Unit volumes decreased due to weaker demand for solar power and other industrial applications due to
uncertainties about the continuation of government subsidies in Germany. Weaker demand was also attributable to the economic uncertainties resulting from the eurozone debt crisis. Higher pricing to
pass through higher costs of raw
67
Table of Contents
Management's Discussion and Analysis of Financial Condition and Results of Operations
materials
partially offset the impact of lower unit volumes and contributed $19.1 million to the change in revenue in fiscal 2011. The effect of the stronger euro to U.S. dollar exchange rate
in fiscal 2011 compared to fiscal 2010 increased revenue by approximately $6.9 million. Unit volumes of high-performance products decreased 11.1% in fiscal 2011; however, the
average selling price increased 18.0%, resulting in an increase in revenue for high-performance products. For our standard products, the unit volumes decreased 25.6% in fiscal 2011. The
decrease in revenue in fiscal 2011 due to lower unit volumes of standard products was offset by a 16.9% increase
in the average selling price. The price increases reflected in part the pass-through of the increased cost of raw materials, which increased 15.6% on a per unit basis.
Overall,
our total company revenue from our high-performance products increased 1.6% in fiscal 2011 versus fiscal 2010, despite a 6.3% decline in unit volumes, reflecting the relatively
price-inelastic nature of the products and our ability to pass through increased raw material costs. The relatively stronger demand for our high-performance products also reflects our
continued marketing focus on these products and success in qualifying them for new applications.
Gross
sales for our high-performance and standard products are shown below:
|
|
|
|
|
|
|
|
|
|
|
|
|
|
|
|
|
Fiscal Year |
|
Change |
|
Gross Sales(1)
|
|
2011
|
|
2010
|
|
Amount
|
|
%
|
|
| |
|
|
|
(dollars in thousands)
|
|
High-performance |
|
|
|
|
|
|
|
|
|
|
|
|
|
| |
High-Tg |
|
$ |
349,895 |
|
$ |
372,063 |
|
$ |
(22,168 |
) |
|
(6.0 |
)% |
| |
High-speed digital |
|
|
123,979 |
|
|
94,662 |
|
|
29,317 |
|
|
31.0 |
% |
| |
Military, specialty and other |
|
|
33,515 |
|
|
31,111 |
|
|
2,404 |
|
|
7.7 |
% |
| |
|
|
|
|
|
|
|
|
|
|
Total high-performance |
|
|
507,389 |
|
|
497,836 |
|
|
9,553 |
|
|
1.9 |
% |
Standard |
|
|
104,826 |
|
|
130,705 |
|
|
(25,879 |
) |
|
(19.8 |
)% |
| |
|
|
|
|
|
|
|
|
|
|
Total gross sales |
|
$ |
612,215 |
|
$ |
628,541 |
|
$ |
(16,326 |
) |
|
(2.6 |
)% |
| |
|
|
|
|
|
|
|
|
|
|
- (1)
- Gross sales represent revenue prior to certain adjustments for cash discounts, rebates and other revenue adjustments that cannot be allocated to a specific product segment. These
adjustments totaled $15.2 million in fiscal 2011 and $16.6 million in fiscal 2010. Revenue was $597.0 million in fiscal 2011 and $612.0 million in fiscal 2010. Management uses gross sales as a measure
of operating performance.
Cost of goods sold and gross profit—
|
|
|
|
|
|
|
|
|
|
|
|
|
|
|
|
|
|
|
|
|
|
Fiscal Year |
|
|
|
|
|
|
|
2011 |
|
2010 |
|
|
|
|
|
|
|
Change |
|
|
|
|
|
% of
revenue
|
|
|
|
% of
revenue
|
|
|
|
Amount
|
|
Amount
|
|
Amount
|
|
%
|
|
| |
|
|
|
(dollars in thousands)
|
|
Cost of goods sold |
|
$ |
455,404 |
|
|
76.3 |
% |
$ |
467,751 |
|
|
76.4 |
% |
$ |
(12,347 |
) |
|
(2.6 |
)% |
Gross profit |
|
$ |
141,585 |
|
|
23.7 |
% |
$ |
144,236 |
|
|
23.6 |
% |
$ |
(2,651 |
) |
|
(1.8 |
)% |
Cost of goods sold was $455.4 million for fiscal 2011, a decrease of $12.3 million, or 2.6%, from fiscal 2010. The decrease in cost of goods sold
was driven primarily by:
- –>
- a
$42.9 million decrease in raw material costs from lower unit volumes, which decreased 12.1%;
- –>
- a
$31.4 million increase in the cost of raw materials, which increased 9.7% on an average per unit basis, primarily due to the higher cost of copper during
fiscal 2011; and
68
Table of Contents
Management's Discussion and Analysis of Financial Condition and Results of Operations
- –>
- a
$0.8 million, or a 0.5%, decrease in conversion costs (that is, all factory costs except the cost of raw materials). Despite lower unit volumes, total
conversion costs remained relatively flat, reflecting a 13.1% increase in conversion costs on a per unit basis from lower production volumes.
Gross
profit was $141.6 million for fiscal 2011, a decrease of $2.7 million, or 1.8%, from fiscal 2010. The decrease in gross profit was driven primarily by:
- –>
- an
$11.9 million decrease from lower unit volumes;
- –>
- a
$7.9 million increase as a result of pricing actions to pass through higher raw material and higher conversion costs to our customers, as well as an
increase in the percentage of revenue from sales of our higher margin, high-performance products in fiscal 2011; and
- –>
- a
$1.3 million increase due to the stronger euro to U.S. dollar exchange rate.
Operating expenses. Total operating expenses increased by $9.9 million, or 12.4%, for fiscal 2011 compared to fiscal 2010. The increase in operating expenses was
due to higher SG&A expense and R&D expense, partially offset by lower restructuring expense, as more fully described below.
|
|
|
|
|
|
|
|
|
|
|
|
|
|
|
|
|
|
|
|
|
|
Fiscal Year |
|
|
|
|
|
|
|
2011 |
|
2010 |
|
|
|
|
|
|
|
Change |
|
|
|
|
|
% of
revenue
|
|
|
|
% of
revenue
|
|
|
|
Amount
|
|
Amount
|
|
Amount
|
|
%
|
|
| |
|
|
|
(dollars in thousands)
|
|
Sales, general and administrative |
|
$ |
77,545 |
|
|
13.0 |
% |
$ |
65,271 |
|
|
10.7 |
% |
$ |
12,274 |
|
|
18.8 |
% |
Research and development |
|
|
10,653 |
|
|
1.8 |
% |
|
9,532 |
|
|
1.6 |
% |
|
1,121 |
|
|
11.8 |
% |
Restructuring |
|
|
1,250 |
|
|
0.2 |
% |
|
4,782 |
|
|
0.8 |
% |
|
(3,532 |
) |
|
(73.9 |
)% |
| |
|
|
|
|
|
|
|
|
|
|
|
|
|
|
|
|
Total operating expenses |
|
$ |
89,448 |
|
|
15.0 |
% |
$ |
79,585 |
|
|
13.0 |
% |
$ |
9,863 |
|
|
12.4 |
% |
| |
|
|
|
|
|
|
|
|
|
|
|
|
|
|
|
|
Sales, general and administrative. SG&A expense increased to $77.5 million (13.0% of revenue) for fiscal 2011 from $65.3 million (10.7% of revenue) in the prior
year. The $12.2 million increase in SG&A expense in fiscal 2011 was primarily due to higher audit fees, which increased $6.2 million, and higher legal and consulting fees, which increased $2.7
million over the prior year. The increase in these fees was primarily related to this offering. We also recorded $2.5 million of expense related to withholding taxes on payments from our
international subsidiaries related to intercompany management fees and commissions.
Research and development. R&D expense in fiscal 2011 increased $1.2 million, or 11.8%, to $10.7 million for fiscal 2011 from $9.5 million for fiscal 2010.
The increase in R&D expense was primarily due to an increase of $1.9 million for higher personnel costs as well higher purchases of materials, supplies and services in support of product
development efforts. These increases were partially offset by lower legal fees in support of intellectual property defense, which decreased $1.1 million in fiscal 2011. In the prior year, we
incurred significant legal fees in connection with the successful legal defense of our intellectual property rights for which a favorable settlement was reached during fiscal 2010.
Restructuring. Restructuring expense was $1.3 million for fiscal 2011, versus $4.8 million in the prior year. This steep reduction of $3.5 million reflects the
substantial completion of our restructuring activities in the prior year. The minimal restructuring expense in fiscal 2011 was primarily related to the impairment loss recorded on the land and
building at our closed Fremont, California facility as well as ongoing legal and other fees associated with the disposal of our closed Italian laminate facility, MAS Italia s.r.l.
69
Table of Contents
Management's Discussion and Analysis of Financial Condition and Results of Operations
Operating income / (loss)
|
|
|
|
|
|
|
|
|
|
|
|
|
|
|
|
|
|
|
|
|
|
Fiscal Year |
|
|
|
|
|
|
|
2011 |
|
2010 |
|
|
|
|
|
|
|
Change |
|
|
|
|
|
% of
revenue
|
|
|
|
% of
revenue
|
|
|
|
Amount
|
|
Amount
|
|
Amount
|
|
%
|
|
| |
|
|
|
(dollars in thousands)
|
|
Asia |
|
$ |
58,506 |
|
|
9.8 |
% |
$ |
58,777 |
|
|
9.6 |
% |
$ |
(271 |
) |
|
(0.5 |
)% |
Americas |
|
|
13,566 |
|
|
2.3 |
% |
|
16,900 |
|
|
2.8 |
% |
|
(3,334 |
) |
|
(19.7 |
)% |
Europe |
|
|
6,050 |
|
|
1.0 |
% |
|
3,958 |
|
|
0.6 |
% |
|
2,092 |
|
|
52.9 |
% |
Corporate |
|
|
(25,985 |
) |
|
(4.4 |
)% |
|
(14,984 |
) |
|
(2.4 |
)% |
|
(11,001 |
) |
|
(73.4 |
)% |
| |
|
|
|
|
|
|
|
|
|
|
|
|
|
|
|
|
Total operating income / (loss) |
|
$ |
52,137 |
|
|
8.7 |
% |
$ |
64,651 |
|
|
10.6 |
% |
$ |
(12,514 |
) |
|
(19.4 |
)% |
| |
|
|
|
|
|
|
|
|
|
|
|
|
|
|
|
|
Operating income was $52.1 million for fiscal 2011, a decrease of $12.5 million, or 19.4%, from fiscal 2010. Despite lower unit volumes, which
decreased 12.1% in fiscal 2011, revenue was only slightly lower (2.5%) than the prior year due to pricing actions to recover higher raw material costs, as well as an increase in the percentage of
revenue from sales of our higher margin, high-performance products in fiscal 2011. However, operating income in fiscal 2011 was significantly affected by an $8.9 million increase in
audit, legal and consulting fees related to this offering, only partially offset by the $0.6 million favorable impact of the stronger euro to U.S. dollar exchange rate.
Operating
income in Asia in fiscal 2011 was $58.5 million, a decrease of $0.3 million, or 0.5%, from fiscal 2010. The decrease in operating income was driven primarily by:
- –>
- a
$12.8 million increase in revenue (as discussed above) despite lower unit volumes, which decreased 7.5%;
- –>
- a
$5.9 million increase in raw materials costs, reflecting a $23.6 million increase (11.1% on an average per unit basis) in the purchase price of raw
materials primarily due to the higher cost of copper during fiscal 2011, partially offset by lower unit volumes, which decreased raw material costs by $17.7 million;
- –>
- a
$3.8 million, or 6.9%, increase in conversion costs (15.6% on an average per unit basis), due to higher labor and utilities expense. Labor expense increased
primarily due to salary and wage increases during the fiscal year, and our utilities expense increased primarily due to the increased cost of fuel;
- –>
- a
$1.8 million increase for withholding tax expense on the remittance of intercompany management fees and commissions to the U.S. from our overseas locations
during fiscal 2011, which was included in SG&A expense; and
- –>
- a
$1.6 million net decrease from lower intercompany revenues and other operating expenses.
Operating
income in the Americas in fiscal 2011 was $13.6 million, a decrease of $3.3 million, or 19.7%, from fiscal 2010. The decrease in operating income was driven primarily by:
- –>
- a
$20.3 million decrease in revenue (as discussed above) from lower unit volumes, which decreased 20.4%;
- –>
- a
$4.9 million decrease in raw material costs, reflecting lower unit volumes, which decreased raw material costs by $15.2 million, partially offset by
a $10.3 million increase (15.9% on an average per unit basis) in the purchase price of raw materials primarily due to the higher cost of copper during fiscal 2011;
- –>
- a
$6.8 million, or 15.3%, decrease in conversion costs primarily due to lower unit volumes, although the impact of lower unit volumes was partially offset by
a 6.4% increase in conversion costs on an average per unit basis, primarily due to the increased cost of fuel and labor;
70
Table of Contents
Management's Discussion and Analysis of Financial Condition and Results of Operations
- –>
- a
$4.8 million increase in intercompany revenues primarily due to increased exports of high-performance resins to Asia; and
- –>
- a
$0.5 million net decrease in other operating expenses.
Operating income in Europe in fiscal 2011 was $6.1 million, an increase of $2.1 million, or 52.9%, from fiscal 2010. The increase in operating income was driven
primarily by:
- –>
- a
$7.5 million decrease in revenue (as discussed above) from lower unit volumes, which decreased 20.4%;
- –>
- a
$8.9 million decrease in raw material costs, reflecting lower unit volumes, which decreased raw material costs by $15.8 million, partially offset by
a $6.9 million (9.8% on an average per unit basis) increase in the purchase price of raw materials primarily due to the higher cost of copper during fiscal 2011;
- –>
- a
$1.0 million decrease in SG&A expense, primarily due to lower bad debt expense as a financially troubled customer led to an increase in our reserves for bad
debt in the prior year; and
- –>
- a
$0.5 million net decrease in intercompany revenue, conversion costs and other operating expenses.
The Corporate operating loss in fiscal 2011 was $26.0 million, an increase of $11.0 million or 73.4% compared to fiscal 2010. The increased Corporate loss was primarily driven by higher
SG&A expense of $9.7 million incurred primarily for outside professional services related to our decision to proceed with this offering. The increase in SG&A expense was offset by lower
restructuring expense of $3.7 million, as our major restructuring activities were substantially completed by the end of fiscal 2010.
Other non-operating income / (expense)
|
|
|
|
|
|
|
|
|
|
|
|
|
|
|
|
|
|
|
|
|
|
Fiscal Year |
|
|
|
|
|
|
|
2011 |
|
2010 |
|
|
|
|
|
|
|
Change |
|
|
|
|
|
% of
revenue
|
|
|
|
% of
revenue
|
|
|
|
Amount
|
|
Amount
|
|
Amount
|
|
%
|
|
| |
|
|
|
(dollars in thousands)
|
|
Other income—net |
|
$ |
1,629 |
|
|
0.3 |
% |
$ |
4,758 |
|
|
0.8 |
% |
$ |
(3,129 |
) |
|
(65.8 |
)% |
Embedded derivative gain / (loss)—net |
|
|
42,256 |
|
|
7.1 |
% |
|
21,165 |
|
|
3.5 |
% |
|
21,091 |
|
|
99.7 |
% |
Interest expense |
|
|
(80,210 |
) |
|
(13.4 |
)% |
|
(72,134 |
) |
|
(11.8 |
)% |
|
(8,076 |
) |
|
(11.2 |
)% |
Interest income |
|
|
221 |
|
|
0.0 |
% |
|
339 |
|
|
0.1 |
% |
|
(118 |
) |
|
(34.8 |
)% |
Foreign exchange gain / (loss)—net |
|
|
4,833 |
|
|
0.8 |
% |
|
9,596 |
|
|
1.6 |
% |
|
(4,763 |
) |
|
(49.6 |
)% |
| |
|
|
|
|
|
|
|
|
|
|
|
|
|
|
|
|
Total non-operating income / (expense) |
|
$ |
(31,271 |
) |
|
(5.2 |
)% |
$ |
(36,276 |
) |
|
(5.9 |
)% |
$ |
5,005 |
|
|
13.8 |
% |
| |
|
|
|
|
|
|
|
|
|
|
|
|
|
|
|
|
Other income—net. Other income—net decreased $3.1 million to $1.6 million in fiscal 2011 from $4.8 million in fiscal 2010. The prior
year included a gain of $3.0 million from the favorable settlement of a dispute related to our intellectual property rights.
Embedded derivative gain / (loss)—net. We recorded a net embedded derivative gain of $42.3 million in fiscal 2011 and $21.2 million in
fiscal 2010.
We recorded an embedded derivative gain related to the convertible preferred certificates of $43.3 million in fiscal 2011 compared to a gain of $21.8 million in fiscal 2010. The
recording of an embedded derivative gain in fiscal 2011 reflects the decline in our TEV and total equity value primarily due to the declining sales during the last three quarters of fiscal 2011. The
slackening demand can be attributed to the tsunami in
71
Table of Contents
Management's Discussion and Analysis of Financial Condition and Results of Operations
Japan and its aftermath that disrupted worldwide supply chains, turmoil in the Middle East that contributed to significant increases in oil prices, the European debt crisis that disrupted the
eurozone, the unprecedented flooding in Thailand that led to shortages of certain electronic components, and the uncertainties in the U.S. government's fiscal and monetary policies.
In
fiscal 2010, we recorded an embedded derivative gain associated with the convertible preferred certificates even though our TEV and total equity value increased due to the financing transaction
that occurred in September 2010. The initial fair value of the embedded derivative liability related to the Class C convertible preferred certificates was recorded as a discount at the date of
issuance and therefore did not have an impact on the statement of operations. The allocation of value to the additional Class C convertible preferred certificates at the transaction date led to
a reduction of the fair value of the embedded derivative liability associated with the previously outstanding Class A convertible preferred certificates, resulting in an embedded derivative
gain for the year. See Note 4 to our consolidated annual financial statements included elsewhere in this prospectus for a further discussion of the September 2010 financing transaction.
We
recorded an embedded derivative loss of $1.0 million in fiscal 2011 and $0.6 million in fiscal 2010 related to our current credit agreements. The recording of an embedded derivative
loss in each year related to these credit agreements reflects a decrease in the expected time to a potential change in control event (such as the sale of the company or potential alternate
transaction) from one year in fiscal 2010 compared to six months in fiscal 2011.
Interest expense and interest income. Total interest expense increased $8.1 million, or 11.2%, to $80.2 million in fiscal 2011 from $72.1 million in fiscal 2010.
The increase in interest expense was due to the higher amortization of OID and deferred loan origination costs related to our senior secured and mezzanine credit agreements in fiscal 2011 as well as
the higher outstanding principal debt balances under the mezzanine credit agreement in fiscal 2011 compared to the prior year due to the accrual of PIK. Interest expense in fiscal 2011 included $10.7
million of OID amortization ($4.5 million related to our senior secured credit agreement and $6.2 million related to our mezzanine credit agreement) as well as $2.4 million
amortization of deferred loan origination costs. We entered into our senior and mezzanine credit agreements early in the fourth quarter of fiscal 2010 and as such only recorded three months of OID
amortization and deferred loan origination costs amortization related to these credit agreements. Fiscal 2010 included $2.3 million of OID amortization ($1.0 million related to our
senior secured credit agreement and $1.3 million related to our mezzanine credit agreement) as well as $4.6 million amortization of deferred loan origination costs, including the
write-off of
$2.8 million of deferred loan origination costs associated with our prior first- and second-lien credit agreements.
Foreign exchange gain / (loss)—net. We recorded a net foreign exchange gain of $4.8 million in fiscal 2011 compared to a net foreign exchange gain of
$9.6 million in fiscal 2010.
For most of fiscal 2011, the U.S. dollar weakened against the euro. However, the U.S. dollar strengthened against the euro in the fourth quarter of fiscal 2011 which resulted in a lower foreign
exchange gain than in the prior year when the U.S. dollar was consistently strengthening against the euro throughout the year. The net foreign exchange gain was primarily related to our convertible
preferred certificates and the associated embedded derivative liabilities of our Luxembourg holding companies ($6.1 million in fiscal 2011). The functional currency of our Luxembourg holding
companies is the U.S. dollar. The convertible preferred certificates and the associated embedded derivative liabilities are euro-denominated liabilities. As the U.S. dollar strengthens
against the euro, we record a foreign exchange gain related to the convertible preferred certificates and related embedded derivative liabilities. As the euro weakens against the U.S. dollar, it
requires fewer U.S. dollars to settle the convertible preferred certificates and the associated embedded derivative liabilities and a foreign exchange gain is recorded.
72
Table of Contents
Management's Discussion and Analysis of Financial Condition and Results of Operations
The net foreign exchange gain in fiscal 2011 also included a foreign exchange loss of $0.2 million related to our German subsidiary in connection with its U.S. dollar-denominated trade accounts
payable. The functional currency of our German subsidiary is the euro. Therefore, the strengthening of the U.S. dollar against the euro has the opposite effect in our German subsidiary compared to our
Luxembourg holding companies. As the U.S. dollar strengthens against the euro, it requires more euros to settle the U.S. dollar denominated payables and our German subsidiary records a foreign
exchange loss.
In
fiscal 2010, the euro weakened against the U.S. dollar throughout the year, resulting in a net foreign exchange gain primarily related to the convertible preferred certificates and the associated
embedded derivative liabilities, which are euro-denominated liabilities of the Luxembourg holding companies. We recorded a foreign exchange gain of $13.0 million in fiscal 2010
related to the convertible preferred certificates and associated embedded derivative liabilities.
In
fiscal 2010, the foreign exchange gain related to the convertible preferred certificates and associated embedded derivative liabilities was partially offset by a foreign exchange loss of
$2.0 million in our German subsidiary related to U.S. dollar-denominated trade accounts payable.
Provision for income taxes
|
|
|
|
|
|
|
|
|
|
|
|
|
|
|
|
|
|
|
|
|
|
Fiscal Year |
|
|
|
|
|
|
|
2011 |
|
2010 |
|
|
|
|
|
|
|
Change |
|
|
|
|
|
% of
revenue
|
|
|
|
% of
revenue
|
|
|
|
Amount
|
|
Amount
|
|
Amount
|
|
%
|
|
| |
|
|
|
(dollars in thousands)
|
|
Income / (loss) before taxes |
|
$ |
20,866 |
|
|
3.5 |
% |
$ |
28,375 |
|
|
4.6 |
% |
$ |
(7,509 |
) |
|
(26.5 |
)% |
Provision for income taxes |
|
$ |
(10,893 |
) |
|
(1.8 |
)% |
$ |
(27,158 |
) |
|
(4.4 |
)% |
$ |
16,265 |
|
|
59.9 |
% |
Effective tax rate |
|
|
52.2 |
% |
|
|
|
|
95.7 |
% |
|
|
|
|
(43.5 |
)% |
|
|
|
Our effective tax rate is a function of a number of factors, including the statutory rate in Luxembourg (considered our domestic tax jurisdiction), the rates of
each jurisdiction in which we operate (reflected as a foreign rate differential), valuation allowances (generally created through operating losses), and uncertain tax positions. Uncertain tax
positions generally increase our effective rate. Settlements with taxing authorities giving rise to these positions may increase or decrease our effective rate depending on the amount of the
settlement relative to any accrual we have made for it. See "Critical Accounting Policies and Estimates—Income taxes" for more information.
Our
effective tax rate for fiscal 2011 was 52.2%, which was 43.5% lower than our effective tax rate for fiscal 2010, primarily as a result of a decrease in the foreign rate differential of 21.3%, a
decrease in the accrual for uncertain tax positions of 62.0%, and an offsetting net increase in the valuation allowance of 48.5%. The material factors contributing to each component are discussed
below.
The
foreign rate differential and valuation allowances had the following impact on the effective rate for fiscal 2011 compared to fiscal 2010:
|
|
|
|
|
|
|
|
Jurisdiction
|
|
Foreign rate
differential
|
|
Valuation
allowance
|
|
| |
|
Luxembourg |
|
|
0 |
% |
|
(17.5 |
)% |
United States |
|
|
(18.9 |
)% |
|
66.0 |
% |
Other |
|
|
(2.4 |
)% |
|
0 |
% |
Total |
|
|
(21.3 |
)% |
|
48.5 |
% |
73
Table of Contents
Management's Discussion and Analysis of Financial Condition and Results of Operations
The taxable loss of our Luxembourg entities decreased in fiscal 2011, compared to fiscal 2010, as a result of embedded derivative gains associated with our
convertible preferred certificates. The fluctuation in the losses of our Luxembourg entities resulted in a net reduction in the valuation allowance for Luxembourg. Because our Sponsors will
effectively convert their investment in the convertible preferred certificates to ordinary shares in connection with this offering, the effective rate will not be impacted by embedded derivative gains
or losses after the completion of this offering. Our U.S. entities incurred higher interest expense during fiscal 2011 compared to the prior year, which generated additional taxable losses and
resulted in a decrease in our foreign rate differential (since our primary tax jurisdiction is Luxembourg) and an increase in the valuation allowance. We expect that the impact of the U.S. valuation
allowance and foreign rate differential on our effective rate will be significantly reduced upon the refinancing of our debt upon the closing of this offering.
The
uncertain tax positions had the following impact on our effective rate for fiscal 2011 compared to fiscal 2010:
|
|
|
|
|
Jurisdiction
|
|
Uncertain
tax positions
|
|
| |
|
United States |
|
|
18.6 |
% |
Germany |
|
|
(69.5 |
)% |
Taiwan |
|
|
(10.2 |
)% |
Other |
|
|
(0.9 |
)% |
Total |
|
|
(62.0 |
)% |
Our accrual for uncertain tax positions in the United States increased our effective rate, which was offset by favorable adjustments in Germany and Taiwan as a
result of a settlements reached with the tax authorities in these countries. In addition, we changed our estimates in fiscal 2010 relating to the prior years' uncertain tax positions in Germany and
the United States as a result of ongoing examinations by the tax authorities in these countries.
Fiscal Year 2010 Compared to Fiscal Year 2009
Overview—The worldwide demand for our products, which had begun to recover in the third
quarter of fiscal 2009, continued to improve in fiscal 2010. The Company was well-positioned to benefit from the economic recovery as a result of improved manufacturing capacity
utilization and cost reduction measures implemented in the prior year.
Revenue—
|
|
|
|
|
|
|
|
|
|
|
|
|
|
|
|
Fiscal year |
|
Change |
|
|
|
2010
|
|
2009
|
|
Amount
|
|
%
|
|
| |
|
|
|
(dollars in thousands)
|
|
Asia |
|
$ |
349,421 |
|
$ |
226,588 |
|
$ |
122,833 |
|
|
54.2 |
% |
Americas |
|
|
129,109 |
|
|
100,275 |
|
|
28,834 |
|
|
28.8 |
% |
Europe |
|
|
133,457 |
|
|
97,336 |
|
|
36,121 |
|
|
37.1 |
% |
| |
|
|
|
|
|
|
|
|
|
|
Total revenue |
|
$ |
611,987 |
|
$ |
424,199 |
|
$ |
187,788 |
|
|
44.3 |
% |
| |
|
|
|
|
|
|
|
|
|
|
Total revenue increased by $187.8 million, or 44.3%, from fiscal 2009 to fiscal 2010, reflecting improvement in the global economy boosted by the
restocking of inventory within the electronics supply chain. Revenue was also higher in fiscal 2010 due to the inclusion of an additional 53rd fiscal week which
74
Table of Contents
Management's Discussion and Analysis of Financial Condition and Results of Operations
increased
revenue by approximately $8.3 million. Revenue in each geographic segment benefited from higher unit volumes, higher pricing, and a more favorable product mix, reflecting an increased
percentage of revenue of high-performance products in the overall revenue mix in 2010 as compared to 2009. Increased unit volumes contributed $149.4 million to the increase in revenue,
while higher pricing contributed $38.5 million.
Revenue
in Asia increased $122.8 million, or 54.2%, from fiscal 2009 to fiscal 2010. Higher unit volumes and the 53rd week accounted for $103.2 million and
$4.5 million, respectively, of the increase in revenue while improved pricing accounted for $15.2 million of the increase in revenue. The increase in unit volumes in Asia was due to
demand for electronics rebounding in the aftermath of the 2008 to 2009 recession and the rebuilding of previously depleted inventories within the supply chain. Unit volumes of
high-performance products increased 48.3%, and the average selling price increased 7.7%. For our standard products, unit volumes increased 8.6% along with an increase in the average
selling price of 8.1%. The price increases were partially due to passing through the increased cost of raw materials which increased 18.2% on a per unit basis.
Revenue
in the Americas increased $28.8 million, or 28.8%, from fiscal 2009 to fiscal 2010. Higher unit volumes and the 53rd week accounted for $22.5 million and
$1.9 million, respectively, of the increase in revenue while improved pricing accounted for $4.5 million of the increase in revenue. As in Asia, unit volumes increased in the Americas in fiscal 2010
due to the increase in end-market demand for electronic products which bolstered inventory restocking of materials within the supply chain. Unit volumes of high-performance
products increased 21.3%, and unit volumes of standard products increased 11.9% in fiscal 2010 compared to the prior year. The average selling prices for our high-performance and standard
products in fiscal 2010 increased 7.7% and 4.3%, respectively, as compared to the prior year. The price increases were partially due to passing through the increased cost of raw materials which
increased 12.6% on a per unit basis.
Revenue
in Europe increased $36.1 million, or 37.1%, from fiscal 2009 to fiscal 2010. The revenue increase in Europe was moderated by the weaker average euro to U.S. dollar exchange rate during
fiscal 2010 compared to fiscal 2009, which reduced revenues by 8.6% or $8.4 million. Higher unit volumes and the 53rd week accounted for $23.8 million and
$1.9 million, respectively, of the increase in revenue while improved pricing accounted for $18.8 million of the increase in revenue. In Europe, the increase in unit volume was due to
higher end-market demand for solar power and industrial applications. Unit volumes of high-performance products increased 52.9% and the average selling price increased 7.7%
from fiscal 2009 to fiscal 2010. For our standard products, unit volumes increased 14.9% and the average selling price increased 7.9% from fiscal 2009 to fiscal 2010. The price increases were
partially due to passing through the increased cost of raw materials which increased 16.9% on a per unit basis.
Overall
demand for our high-performance products outpaced demand for standard products, with gross sales for our high-performance products increasing 51.4% from fiscal 2009 to
fiscal 2010. Gross sales from our high-Tg and high-speed digital product lines, as described in "Business—Product Markets and Product Applications", increased by
43.6% and 98.7%, respectively, in fiscal 2010.
75
Table of Contents
Management's Discussion and Analysis of Financial Condition and Results of Operations
Gross
sales for our high-performance and standard products are shown below:
|
|
|
|
|
|
|
|
|
|
|
|
|
|
|
|
|
Fiscal year |
|
Change |
|
Gross Sales(1)
|
|
2010
|
|
2009
|
|
Amount
|
|
%
|
|
| |
|
|
|
(dollars in thousands)
|
|
High-performance |
|
|
|
|
|
|
|
|
|
|
|
|
|
| |
High-Tg |
|
$ |
372,063 |
|
$ |
259,916 |
|
$ |
112,147 |
|
|
43.1 |
% |
| |
High-speed digital |
|
|
94,662 |
|
|
47,630 |
|
|
47,032 |
|
|
98.7 |
% |
| |
Military, specialty and other |
|
|
31,111 |
|
|
22,123 |
|
|
8,988 |
|
|
40.6 |
% |
| |
|
|
|
|
|
|
|
|
|
|
Total high-performance |
|
|
497,836 |
|
|
329,669 |
|
|
168,167 |
|
|
51.0 |
% |
Standard |
|
|
130,705 |
|
|
106,427 |
|
|
24,278 |
|
|
22.8 |
% |
| |
|
|
|
|
|
|
|
|
|
|
Total gross sales |
|
$ |
628,541 |
|
$ |
436,096 |
|
$ |
192,445 |
|
|
44.1 |
% |
| |
|
|
|
|
|
|
|
|
|
|
- (1)
- Gross sales represent revenue prior to certain adjustments for cash discounts, rebates, and other revenue adjustments that cannot be allocated to a specific product segment. These
adjustments totaled $16.6 million in fiscal 2010 and $11.9 million in fiscal 2009 respectively. Revenue was $612.0 million for fiscal 2010 and $424.2 million for fiscal
2009. Management uses gross sales as a measure of operating performance.
Cost of goods sold and gross profit—
|
|
|
|
|
|
|
|
|
|
|
|
|
|
|
|
|
|
|
|
|
|
Fiscal year |
|
|
|
|
|
|
|
2010 |
|
2009 |
|
|
|
|
|
|
|
Change |
|
|
|
|
|
% of
revenue
|
|
|
|
% of
revenue
|
|
|
|
Amount
|
|
Amount
|
|
Amount
|
|
%
|
|
| |
|
|
|
(dollars in thousands)
|
|
Cost of goods sold |
|
$ |
467,751 |
|
|
76.4 |
% |
$ |
342,832 |
|
|
80.8 |
% |
$ |
124,919 |
|
|
36.4 |
% |
Gross profit |
|
$ |
144,236 |
|
|
23.6 |
% |
$ |
81,367 |
|
|
19.2 |
% |
$ |
62,869 |
|
|
77.3 |
% |
Cost of goods sold in fiscal 2010 was $467.8 million, an increase of $124.9 million, or 36.4%, from fiscal 2009. The increase in cost of goods
sold was driven primarily by:
- –>
- an
$82.3 million increase in raw material costs from higher unit volumes, which increased 33.9%;
- –>
- a
$33.4 million increase in the cost of raw materials, which increased 16.0% on an average per unit basis, primarily due to the higher cost of copper during
fiscal 2010;
- –>
- a
$9.2 million increase in conversion costs, primarily from higher unit volumes. However, conversion costs decreased 20.1% on an average per unit basis due to
higher unit volumes and efficiencies gained as a result of the restructuring activities and factory closures that took place during fiscal 2009, which enabled us, in fiscal 2010, to increase our
volume production while decreasing our labor costs, fixed factory overhead costs and other conversion costs on an average per unit basis.
Gross
profit was $144.2 million for fiscal 2010, an increase of $62.9 million, or 77.3%, from fiscal 2009. The increase in gross profit was driven primarily by:
- –>
- a
$48.4 million increase from higher unit volumes;
- –>
- a
$15.8 million increase as a result of pricing actions to pass through higher raw material and conversion costs to our customers, as well as an increase in
the percentage of revenue from sales of our higher margin, high-performance products in fiscal 2010; and
- –>
- a
$1.3 million decrease due to the weaker U.S. dollar to euro exchange rate.
76
Table of Contents
Management's Discussion and Analysis of Financial Condition and Results of Operations
Operating expenses. Total operating expenses decreased $12.5 million from fiscal 2009 to fiscal 2010, representing a 13.6% decrease, primarily due to lower
restructuring expense, as described below.
|
|
|
|
|
|
|
|
|
|
|
|
|
|
|
|
|
|
|
|
|
|
Fiscal year |
|
|
|
|
|
|
|
2010 |
|
2009 |
|
|
|
|
|
|
|
Change |
|
|
|
|
|
% of
revenue
|
|
|
|
% of
revenue
|
|
|
|
Amount
|
|
Amount
|
|
Amount
|
|
%
|
|
| |
|
|
|
(dollars in thousands)
|
|
Sales, general and administrative |
|
$ |
65,271 |
|
|
10.7 |
% |
$ |
61,816 |
|
|
14.6 |
% |
$ |
3,455 |
|
|
5.6 |
% |
Research and development |
|
|
9,532 |
|
|
1.6 |
% |
|
9,239 |
|
|
2.2 |
% |
|
293 |
|
|
3.2 |
% |
Restructuring |
|
|
4,782 |
|
|
0.8 |
% |
|
17,497 |
|
|
4.1 |
% |
|
(12,715 |
) |
|
(72.7 |
)% |
Loss on liquidation of subsidiary |
|
|
— |
|
|
0.0 |
% |
|
3,548 |
|
|
0.8 |
% |
|
(3,548 |
) |
|
(100.0 |
)% |
| |
|
|
|
|
|
|
|
|
|
|
|
|
|
|
|
|
Total operating expenses |
|
$ |
79,585 |
|
|
13.0 |
% |
$ |
92,100 |
|
|
21.7 |
% |
$ |
(12,515 |
) |
|
(13.6 |
)% |
| |
|
|
|
|
|
|
|
|
|
|
|
|
|
|
|
|
Sales, general and administrative. SG&A expense increased by $3.5 million from 2009 to 2010, representing a 5.6% increase. The increase in SG&A expense was
attributable to higher personnel costs, $4.1 million related to the reinstatement of our variable incentive compensation and $3.0 million related to salary increases. In fiscal 2009,
cost reduction measures, including compensation reductions were taken to improve earnings and cash flow in a difficult economic environment. In fiscal 2010, we saw an increase in revenue and were able
to reinstate our variable incentive compensation program and also increase salaries worldwide. SG&A expense also increased in fiscal 2010 due to higher professional fees ($0.5 million) as we
began investing in new information technology projects. The increase in salaries and professional fees enumerated above were partially offset by a decrease in bad debt expense ($3.0 million)
and a decrease in other SG&A expense of $1.4 million. Fiscal 2009 was adversely impacted by the write-off of uncollectible accounts receivable, a result of the downturn in the
economic environment.
Restructuring. Restructuring expense decreased by $12.7 million from fiscal 2009 to fiscal 2010. In fiscal 2009, we incurred substantial expenses in
connection with the closure of facilities in Fremont, California, and Dalian, China, and professional fees related to these closures. In fiscal 2010, restructuring expense consisted primarily of
professional fees related to financial restructuring activities and some residual expenses related to the previous year's facility closures.
Loss on liquidation of subsidiary. During fiscal 2009, we closed MAS Italia s.r.l. our laminate materials manufacturing facility located in Bottegone, Italy, due
to the overall downturn in the global economy and resulting in excess capacity in our European segment. In December 2009, the Italian legal authorities approved our earlier petition to close MAS
Italia s.r.l. via a "Concordata Preventivo". A Concordata Preventivo is a legal process where the creditors and management reach a mutual agreement regarding repayment of outstanding liabilities. Upon
approval by the Italian authorities, our interest in the subsidiary was abandoned and all assets of the subsidiary became the property of the courts to liquidate for the benefit of the subsidiary's
creditors. In fiscal 2009, we recorded a loss on the liquidation of the subsidiary in the amount of $3.5 million.
77
Table of Contents
Management's Discussion and Analysis of Financial Condition and Results of Operations
Operating income / (loss)
|
|
|
|
|
|
|
|
|
|
|
|
|
|
|
|
|
|
|
|
|
|
Fiscal year |
|
|
|
|
|
|
|
2010 |
|
2009 |
|
Change |
|
|
|
Amount
|
|
% of revenue
|
|
Amount
|
|
% of revenue
|
|
Amount
|
|
%
|
|
| |
|
|
|
(dollars in thousands)
|
|
Asia |
|
$ |
58,777 |
|
|
9.6 |
% |
$ |
21,755 |
|
|
5.1 |
% |
$ |
37,022 |
|
|
170.2 |
% |
Americas |
|
|
16,900 |
|
|
2.8 |
% |
|
2,561 |
|
|
0.6 |
% |
|
14,339 |
|
|
559.9 |
% |
Europe |
|
|
3,958 |
|
|
0.6 |
% |
|
(17,838 |
) |
|
(4.2 |
)% |
|
21,796 |
|
|
122.2 |
% |
Corporate |
|
|
(14,984 |
) |
|
(2.4 |
)% |
|
(17,211 |
) |
|
(4.1 |
)% |
|
2,227 |
|
|
12.9 |
% |
| |
|
|
|
|
|
|
|
|
|
|
|
|
|
|
|
|
Total operating income / (loss) |
|
$ |
64,651 |
|
|
10.6 |
% |
$ |
(10,733 |
) |
|
(2.5 |
)% |
$ |
75,384 |
|
|
702.4 |
% |
| |
|
|
|
|
|
|
|
|
|
|
|
|
|
|
|
|
Consolidated operating income was $64.7 million in fiscal 2010, a substantial improvement from the loss of $10.7 million in the prior year.
Rebounding economic conditions in each geographic segment accounted for the higher unit volumes and revenue, which contributed to the improved operating income. Gross profit increased in fiscal 2010
compared to fiscal 2009 from higher unit volumes, which increased 33.9%, improved manufacturing capacity utilization and increased revenue from our higher margin, high-performance
products. Restructuring expense decreased in fiscal 2010, as most of our restructuring activities were completed by the end of fiscal 2009. Operating income in fiscal 2010 was partially eroded by
increased SG&A expense at Corporate ($3.8 million) and the impact of the weaker euro to U.S. dollar exchange rate in fiscal 2010 ($0.3 million), although these unfavorable impacts were
offset by the absence in fiscal 2010 of the $3.5 million loss on the liquidation of our Italian laminate facility which occurred in fiscal 2009.
Operating
income in Asia in fiscal 2010 was $58.8 million, an increase of $37.0 million, or 170.2%, from fiscal 2009. The increase in operating income was driven primarily by:
- –>
- a
$122.8 million increase in revenue (as discussed above) from higher unit volumes, which increased 40.2%;
- –>
- an
$84.0 million increase in raw material costs, reflecting a $60.7 million increase from higher unit volumes and a $23.2 million increase
(18.2% on an average per unit basis) in the purchase price of raw materials, primarily due to the higher cost of copper during fiscal 2010;
- –>
- an
$8.8 million, or 18.8%, increase in conversion costs primarily due to higher unit volumes, although the impact of higher unit volumes was partially offset
by a 15.3% decrease in conversion costs on an average per unit basis, primarily related to cost savings from the closure of our Dalian, China facility;
- –>
- a
$5.6 million decrease in restructuring expense, as significant restructuring activities in Asia, principally the closure of our Dalian, China facility, were
completed by the end of fiscal 2009; and
- –>
- a
$1.4 million net decrease in other operating expenses and intercompany revenues.
Operating
income in the Americas in fiscal 2010 was $16.9 million, an increase of $14.3 million from fiscal 2009. The increase in operating income was driven primarily by:
- –>
- a
$28.8 million increase in revenue (as discussed above) from higher unit volumes, which increased 21.0%;
- –>
- a
$17.1 million increase in raw material costs, reflecting a $11.2 million increase from higher unit volumes and a $5.9 million increase (12.6%
on an average per unit basis) in the purchase price of raw materials, primarily due to the higher cost of copper during fiscal 2010;
78
Table of Contents
Management's Discussion and Analysis of Financial Condition and Results of Operations
- –>
- a
$6.8 million increase in conversion costs, an 18.1% increase, primarily due to higher unit volumes, although the impact of higher unit volumes was slightly
offset by a 2.4% decrease in conversion costs on an average per unit basis, primarily related to costs savings from the closure of our Fremont, California facility;
- –>
- a
$0.9 million decrease in restructuring expense as significant restructuring activities, principally the closure of our Fremont, California facility, were
substantially completed by the end of fiscal 2009;
- –>
- a
$7.4 million increase in intercompany revenue, primarily due to increased exports of high-performance resins to Asia; and
- –>
- a
$1.1 million net decrease in other operating expenses.
Operating
income in Europe in fiscal 2010 was $4.0 million, an increase of $21.8 million, or 122.2%, from fiscal 2009. The increase in operating income in Europe was driven primarily by:
- –>
- a
$36.1 million increase in revenue (as discussed above) from higher unit volumes, which increased 26.0%;
- –>
- a
$22.6 million increase in raw material costs, reflecting a $14.5 million increase from higher unit volumes and an $8.1 million increase (16.9%
on an average per unit basis) in the cost of raw materials, primarily due to the higher cost of copper during fiscal 2010;
- –>
- a
$4.1 million, or 8.4%, decrease in conversion costs. Conversion costs decreased 27.3% on a per unit basis due to increased unit volumes as well as cost
savings from the closure of MAS Italia s.r.l. our Italian laminate facility;
- –>
- the
completion of the liquidation of MAS Italia s.r.l. in fiscal 2009, which negatively impacted our fiscal 2009 operating income by $3.5 million; and
- –>
- a
$0.7 million net increase due to intercompany revenues offset by higher operating expenses.
The
Corporate operating loss in fiscal 2010 was $15.0 million, a decrease of $2.2 million from the loss of $17.2 million in fiscal 2009. This improvement was primarily a result of
lower restructuring expense in fiscal 2010, which decreased $6.1 million as the majority of the restructuring activities were completed in fiscal 2009. The remainder of the change in operating
income was due to higher SG&A expense, primarily for higher awards under our variable incentive compensation plan that was reinstituted in fiscal 2010.
Other non-operating income / (expense)
|
|
|
|
|
|
|
|
|
|
|
|
|
|
|
|
|
|
|
|
|
|
Fiscal year |
|
|
|
|
|
|
|
2010 |
|
2009 |
|
|
|
|
|
|
|
Change |
|
|
|
|
|
% of
revenue
|
|
|
|
% of
revenue
|
|
|
|
Amount
|
|
Amount
|
|
Amount
|
|
%
|
|
| |
|
|
|
(dollars in thousands)
|
|
Other income / (expense)—net |
|
$ |
4,758 |
|
|
0.8 |
% |
$ |
1,268 |
|
|
0.3 |
% |
$ |
3,490 |
|
|
275.2 |
% |
Embedded derivative gain / (loss)—net |
|
|
21,165 |
|
|
3.5 |
% |
|
(27,513 |
) |
|
(6.5 |
)% |
|
48,678 |
|
|
176.9 |
% |
Interest expense |
|
|
(72,134 |
) |
|
(11.8 |
)% |
|
(54,893 |
) |
|
(12.9 |
)% |
|
(17,241 |
) |
|
(31.4 |
)% |
Interest income |
|
|
339 |
|
|
0.1 |
% |
|
567 |
|
|
0.1 |
% |
|
(228 |
) |
|
(40.2 |
)% |
Foreign exchange gain / (loss)—net |
|
|
9,596 |
|
|
1.6 |
% |
|
(2,083 |
) |
|
(0.5 |
)% |
|
11,679 |
|
|
560.7 |
% |
| |
|
|
|
|
|
|
|
|
|
|
|
|
|
|
|
|
Total non-operating income (expense) |
|
$ |
(36,276 |
) |
|
(5.9 |
)% |
$ |
(82,654 |
) |
|
(19.5 |
)% |
$ |
46,378 |
|
|
56.1 |
% |
| |
|
|
|
|
|
|
|
|
|
|
|
|
|
|
|
|
79
Table of Contents
Management's Discussion and Analysis of Financial Condition and Results of Operations
Other income—net. Other income—net increased by $3.5 million from fiscal
2009 to fiscal 2010, primarily due to a gain of $3.0 million in fiscal 2010 arising from a favorable settlement of a dispute related to our intellectual property rights.
Embedded derivative gain / (loss)—net. There was a net embedded derivative gain of $21.2 million in fiscal 2010 compared to a net loss of
$27.5 million in fiscal 2009. In fiscal 2010, the embedded derivative gain related to the convertible preferred certificates was $21.8 million, and the embedded derivative loss related
to the credit agreements was $0.6 million. In fiscal 2009, there was an embedded derivative loss of $27.5 million, all of which related to the convertible preferred certificates.
In
fiscal 2010, we recorded an embedded derivative gain associated with the convertible preferred certificates even though our TEV and total equity value increased due to the financing transaction
that occurred in September 2010. The initial fair value of the embedded derivative liability related to the Class C convertible preferred certificates was recorded as a discount at the date of
issuance and therefore did not have an impact on the statement of operations. The issuance of and allocation of value to the additional Class C convertible preferred certificates at the
transaction date resulted in a reduction of the fair value of the embedded derivative liability associated with the previously outstanding Class A convertible preferred certificates resulting
in an embedded derivative gain for the year. See Note 4 to our consolidated annual financial statements included elsewhere in this prospectus for a further discussion of the September 2010
financing transaction.
In
fiscal 2009, the value of the embedded derivative liability related to the convertible preferred certificates increased, resulting in an embedded derivative loss. This embedded derivative loss
reflected the increase in our TEV primarily due to a more optimistic outlook for the company in light of an improving global economy that became apparent in mid-2009. Despite lower revenue
in fiscal 2009 compared to the prior year, our EBITDA increased in fiscal 2009 due to cost reductions and improvements in the product mix. The increase in our TEV during fiscal 2009 also reflects
increases in median EBITDA valuation multiples of the market guideline publicly traded companies and market guideline transactions.
In fiscal 2010, the value of the embedded derivative liabilities related to our current credit agreements increased, resulting in an embedded derivative loss of $0.6 million. The fair value of
the embedded derivative liabilities related to these credit agreements was $9.2 million as of October 8, 2010, and increased to $9.8 million as of January 1, 2011. The
increase in the embedded derivative liabilities was due to the decrease in estimated time to a potential change in control event from approximately five fiscal quarters as of October 8, 2010 to
four fiscal quarters as of January 1, 2011 reflecting the increased likelihood of, and estimated time to complete, a change in control event such as a sale of the Company or a business
combination with another company.
Interest expense and interest income. Total interest expense increased by $17.2 million, or 31.4%, from fiscal 2009 to fiscal 2010. In fiscal 2010, we
recorded $9.5 million of additional interest on accrued
interest on our first- and second-lien credit facilities. In addition, fiscal 2010 interest expense included $3.6 million of PIK interest on our mezzanine credit agreement, as well
as $2.3 million of OID amortization expense, of which $1.0 million was attributable to the senior credit agreement and $1.3 million was attributable to the mezzanine credit
agreement. We also expensed $2.8 million of loan origination costs in fiscal 2010 related to our prior first- and second-lien credit facilities which were repaid in the fourth
quarter of fiscal 2010. At the end of fiscal 2010, the cash interest rate on our senior credit agreement was 10.0%, and the interest rate on our mezzanine credit agreement was 16.0%, half payable in
cash and half PIK.
Foreign exchange gain / (loss)—net. We recorded a net foreign exchange gain of $9.6 million in 2010, compared to a net foreign exchange loss of
$2.1 million in 2009.
80
Table of Contents
Management's Discussion and Analysis of Financial Condition and Results of Operations
In fiscal 2010, the U.S. dollar strengthened against the euro, resulting in a net foreign exchange gain primarily related to the convertible preferred certificates and associated embedded derivative
liabilities, which are euro denominated liabilities of our Luxembourg holding companies. The functional currency of our Luxembourg holding companies is the U.S. dollar. As the U.S. dollar strengthens
against the euro, it requires fewer U.S. dollars to settle the convertible preferred certificates and associated embedded derivative liabilities. For this reason, a $13.0 million foreign
exchange gain was recorded in fiscal 2010. This foreign exchange gain was partially offset by a $2.0 million foreign exchange loss at our German subsidiary related to U.S. dollar-denominated
trade accounts payable in fiscal 2010. The functional currency of our German subsidiary is the euro. Therefore, the strengthening of the U.S. dollar against the euro has the opposite effect in our
German subsidiary compared to our Luxembourg holding companies. As the U.S. dollar strengthens against the euro, it requires more euros to settle the U.S. dollar-denominated payables. For this reason,
our German subsidiary recorded a foreign exchange loss in fiscal 2010.
In fiscal 2009, the U.S. dollar weakened against the euro which resulted in a net foreign exchange loss due to the opposite effect described above. For this reason, a foreign exchange loss of
$3.1 million was recorded in fiscal 2009 at our Luxembourg holding companies related to the convertible preferred certificates and associated embedded derivative liabilities. This foreign
exchange loss was partially offset by a $0.3 million foreign exchange gain in fiscal 2009 at our Germany subsidiary related to U.S.-dollar denominated trade account.
Provision for income taxes
|
|
|
|
|
|
|
|
|
|
|
|
|
|
|
|
|
|
|
|
|
|
Fiscal year |
|
|
|
|
|
|
|
2010 |
|
2009 |
|
|
|
|
|
|
|
Change |
|
|
|
|
|
% of
revenue
|
|
|
|
% of
revenue
|
|
|
|
Amount
|
|
Amount
|
|
Amount
|
|
%
|
|
| |
|
|
|
(dollars in thousands)
|
|
Income / (loss) before taxes |
|
$ |
28,375 |
|
|
4.6 |
% |
$ |
(93,387 |
) |
|
(22.0 |
)% |
$ |
121,762 |
|
|
130.4 |
% |
Provision for income taxes |
|
$ |
(27,158 |
) |
|
(4.4 |
)% |
$ |
(7,339 |
) |
|
(1.7 |
)% |
$ |
(19,819 |
) |
|
(270.1 |
)% |
Effective tax rate |
|
|
95.7 |
% |
|
|
|
|
(7.9 |
)% |
|
|
|
|
103.6 |
% |
|
|
|
Our effective tax rate for fiscal 2010 was 95.7%, which was 103.6% higher than our effective tax rate in fiscal 2009. The increase in fiscal 2010 was primarily
a result of an increase in the accrual for uncertain tax positions of 121.5%, and an offsetting decrease in the valuation allowance of 20.1%. The material factors contributing to each component are
discussed below.
The
uncertain tax positions had the following impact on the effective rate for fiscal 2010 as compared to fiscal 2009:
|
|
|
|
|
Jurisdiction
|
|
Uncertain
tax positions
|
|
| |
|
United States |
|
|
84.0 |
% |
Germany |
|
|
34.3 |
% |
Other |
|
|
3.2 |
% |
Total |
|
|
121.5 |
% |
As a result of ongoing examinations by the tax authorities, we changed our estimates in 2010 related to the prior years' uncertain tax positions in Germany and
the United States. In addition, our uncertain tax positions taken in 2010, as compared to 2009, increased our effective rate in Germany and the United States. We anticipate that the accrual for
uncertain tax positions will continue to increase our effective rate
81
Table of Contents
Management's Discussion and Analysis of Financial Condition and Results of Operations
by
8% to 14% following this offering and our debt refinancing that will be completed upon the closing of this offering.
The
valuation allowance had the following impact on the effective rate for fiscal 2010 as compared to fiscal 2009:
|
|
|
|
|
Jurisdiction
|
|
Valuation
allowance
|
|
| |
|
Luxembourg |
|
|
(19.6 |
)% |
Other |
|
|
(0.5 |
)% |
Total |
|
|
(20.1 |
)% |
Our Luxembourg entities reported a lower loss in fiscal 2010 as compared to the reported losses in fiscal 2009 as a result of the embedded derivative loss
associated with our convertible preferred certificates. The fluctuation in the losses of our Luxembourg entities resulted in a net reduction in the valuation allowance for Luxembourg. Because our
Sponsors will effectively convert their investment in the convertible preferred certificates to ordinary shares in connection with this offering, the effective rate will not be impacted by embedded
derivative gains or losses after this offering.
QUARTERLY RESULTS OF OPERATIONS
The following unaudited quarterly condensed consolidated statements of operations for the most recent six quarters ended September 29, 2012
have been prepared on a basis consistent with our audited annual financial statements and include, in the opinion of management, all normal recurring adjustments necessary for the fair statement of
the results of operations for all periods presented. The following consolidated quarterly data should be read in conjunction with our annual financial statements and the related notes included
elsewhere in this prospectus.
|
|
|
|
|
|
|
|
|
|
|
|
|
|
|
|
|
|
|
|
|
|
|
|
Three months ended |
|
|
|
July 2,
2011
(restated(2))
|
|
October 1,
2011
|
|
December 31,
2011
|
|
March 31,
2012
|
|
June 30,
2012
|
|
September 29,
2012
|
|
| |
|
|
|
(dollars in thousands)
|
|
Revenues |
|
$ |
156,047 |
|
$ |
142,865 |
|
$ |
137,541 |
|
$ |
151,711 |
|
$ |
150,102 |
|
$ |
135,991 |
|
Cost of goods sold |
|
|
120,150 |
|
|
110,236 |
|
|
104,735 |
|
|
107,029 |
|
|
105,664 |
|
|
97,892 |
|
| |
|
|
|
|
|
|
|
|
|
|
|
|
|
Gross profit |
|
|
35,897 |
|
|
32,629 |
|
|
32,806 |
|
|
44,682 |
|
|
44,438 |
|
|
38,099 |
|
| |
|
|
|
|
|
|
|
|
|
|
|
|
|
Operating expenses: |
|
|
|
|
|
|
|
|
|
|
|
|
|
|
|
|
|
|
|
| |
Sales, general and administrative |
|
|
20,484 |
|
|
18,686 |
|
|
20,488 |
|
|
19,965 |
|
|
20,643 |
|
|
19,039 |
|
| |
Research and development |
|
|
2,679 |
|
|
2,720 |
|
|
2,740 |
|
|
2,952 |
|
|
3,175 |
|
|
3,121 |
|
| |
Restructuring |
|
|
73 |
|
|
285 |
|
|
788 |
|
|
172 |
|
|
(243 |
) |
|
(5 |
) |
| |
|
|
|
|
|
|
|
|
|
|
|
|
|
| |
|
Total operating expenses |
|
|
23,236 |
|
|
21,691 |
|
|
24,016 |
|
|
23,089 |
|
|
23,575 |
|
|
22,155 |
|
| |
|
|
|
|
|
|
|
|
|
|
|
|
|
Operating income |
|
|
12,661 |
|
|
10,938 |
|
|
8,790 |
|
|
21,593 |
|
|
20,863 |
|
|
15,944 |
|
Non-operating income / (expenses) |
|
|
(15,065 |
) |
|
7,816 |
|
|
2,933 |
|
|
(27,414 |
) |
|
(38,170 |
) |
|
(38,765 |
) |
| |
|
|
|
|
|
|
|
|
|
|
|
|
|
Income / (loss) before taxes |
|
|
(2,404 |
) |
|
18,754 |
|
|
11,723 |
|
|
(5,821 |
) |
|
(17,307 |
) |
|
(22,821 |
) |
Provision for income taxes |
|
|
(5,217 |
) |
|
8,604 |
|
|
(8,818 |
) |
|
(7,231 |
) |
|
(6,369 |
) |
|
(4,993 |
) |
| |
|
|
|
|
|
|
|
|
|
|
|
|
|
Net income / (loss) |
|
$ |
(7,621 |
) |
$ |
27,358 |
|
$ |
2,905 |
|
$ |
(13,052 |
) |
$ |
(23,676 |
) |
$ |
(27,814 |
) |
| |
|
|
|
|
|
|
|
|
|
|
|
|
|
82
Table of Contents
Management's Discussion and Analysis of Financial Condition and Results of Operations
|
|
|
|
|
|
|
|
|
|
|
|
|
|
|
|
|
|
|
|
|
|
Three months ended |
|
|
|
July 2,
2011
(restated(2))
|
|
October 1,
2011
|
|
December 31,
2011
|
|
March 31,
2012
|
|
June 30,
2012
|
|
September 29,
2012
|
|
| |
|
|
|
(dollars in thousands)
|
|
Adjusted EBITDA(1) |
|
$ |
22,495 |
|
$ |
19,421 |
|
$ |
17,548 |
|
$ |
27,975 |
|
$ |
28,313 |
|
$ |
22,066 |
|
| |
|
|
|
|
|
|
|
|
|
|
|
|
|
- (1)
- Adjusted EBITDA is defined as net income / (loss) plus (i) interest expense and interest income, net, (ii) provision for income taxes, (iii) depreciation and
amortization and (iv) certain additional adjustments. These additional adjustments include adding-back expenses for stock-based compensation, restructuring charges, foreign exchange
gain / (loss)—net, goodwill impairment, management fees paid to TPG, embedded derivatives gain / (loss)—net, expenses related to this offering and a one-time gain
related to the settlement of a patent infringement dispute for the first quarter of fiscal 2010.
- Adjusted EBITDA is a measure used by management and external users of our consolidated financial statements to evaluate operating performance, but it is not
a recognized term under U.S. GAAP, and it is not an alternative to net income as a measure of overall financial performance, or an alternative to Cash Flows from Operating Activities as a
measure of cash generated from operating activities. Additionally, Adjusted EBITDA is not intended to be a measure of free cash flow available for management's discretionary use, as it does not
consider certain cash requirements such as for tax payments and debt service requirements, nor does it consider the need for incremental working capital or capital expenditures.
- We believe Adjusted EBITDA is useful because it allows us to more effectively evaluate our operating performance, compare the results of our operations from
period to period and compare the results of our operations against our peers without regard to our financing methods or capital structure. We exclude the items listed above from net income (loss) in
arriving at Adjusted EBITDA because these amounts can vary substantially from company to company within our industry depending on accounting methods and book values of assets, capital structure and
the method by which assets were acquired. We further believe that Adjusted EBITDA is frequently used by securities analysts, investors and other interested parties in their evaluation of companies,
many of which present an EBITDA or Adjusted EBITDA measure when reporting their results. We use non-GAAP financial measures to supplement U.S. GAAP measures to provide a further
understanding of the factors and trends affecting the business that U.S. GAAP measures alone cannot provide. Because not all companies use identical calculations, our presentation of Adjusted
EBITDA may not be comparable to other similarly titled measures of other companies.
- (2)
- Our consolidated financial statements for the six
months ended July 2, 2011 have been restated. Subsequent to the issuance of the company's financial statements for the six
months ended July 2, 2011, management reviewed its accounting for the embedded derivative liability and determined the method used to compute the fair value of the embedded derivative
liabilities related to our convertible preferred certificates and our debt was incorrect.
- The following table sets forth a reconciliation of previously reported and restated net loss and net loss per common share for the periods
shown:
|
|
|
|
|
|
|
|
|
|
|
|
Net loss
Six months ended
July 2, 2011
|
|
Net loss per
common share
Six months ended
July 2, 2011
|
|
| |
|
|
|
(dollars in thousands)
|
|
As previously reported |
|
$ |
(19,107 |
) |
$ |
(38.21 |
) |
| |
Adjustment: |
|
|
|
|
|
|
|
| |
|
Embedded derivative liability adjustment for the three months ended April 2, 2011 |
|
|
2,812 |
|
|
5.62 |
|
| |
|
Embedded derivative liability adjustment for the three months ended July 2, 2011 |
|
|
(3,995 |
) |
|
(7.99 |
) |
| |
|
|
|
|
|
As restated |
|
$ |
(20,290 |
) |
$ |
(40.58 |
) |
| |
|
|
|
|
|
83
Table of Contents
Management's Discussion and Analysis of Financial Condition and Results of Operations
The following table presents a reconciliation of net income / (loss), the most directly comparable financial measure under U.S. GAAP, to Adjusted EBITDA
for the periods presented.
|
|
|
|
|
|
|
|
|
|
|
|
|
|
|
|
|
|
|
|
|
|
Three months ended |
|
|
|
July 2,
2011
(restated(2))
|
|
October 1,
2011
|
|
December 31,
2011
|
|
March 31,
2012
|
|
June 30,
2012
|
|
September 29,
2012
|
|
| |
|
|
|
(dollars in thousands)
|
|
Net income / (loss): |
|
$ |
(7,621 |
) |
$ |
27,358 |
|
$ |
2,905 |
|
$ |
(13,052 |
) |
$ |
(23,676 |
) |
$ |
(27,814 |
) |
Interest expense |
|
|
20,317 |
|
|
20,379 |
|
|
20,666 |
|
|
20,930 |
|
|
20,906 |
|
|
21,004 |
|
Interest income |
|
|
(191 |
) |
|
89 |
|
|
(83 |
) |
|
(37 |
) |
|
(25 |
) |
|
(17 |
) |
Provision for income taxes |
|
|
5,217 |
|
|
(8,604 |
) |
|
8,818 |
|
|
7,231 |
|
|
6,369 |
|
|
4,993 |
|
Depreciation and amortization |
|
|
4,307 |
|
|
4,227 |
|
|
4,333 |
|
|
4,335 |
|
|
4,143 |
|
|
3,819 |
|
Stock-based compensation |
|
|
508 |
|
|
648 |
|
|
774 |
|
|
642 |
|
|
642 |
|
|
641 |
|
Restructuring charges |
|
|
73 |
|
|
285 |
|
|
788 |
|
|
172 |
|
|
(243 |
) |
|
(5 |
) |
Foreign exchange translation (gain) / loss—net |
|
|
6,778 |
|
|
(15,971 |
) |
|
(8,965 |
) |
|
4,648 |
|
|
(12,718 |
) |
|
6,150 |
|
Management fees & expenses—TPG |
|
|
512 |
|
|
512 |
|
|
512 |
|
|
512 |
|
|
512 |
|
|
512 |
|
Embedded derivative (gain) / loss—net |
|
|
(11,204 |
) |
|
(11,969 |
) |
|
(14,297 |
) |
|
2,236 |
|
|
31,608 |
|
|
12,046 |
|
IPO-related expenses |
|
|
3,799 |
|
|
2,467 |
|
|
2,097 |
|
|
358 |
|
|
795 |
|
|
737 |
|
| |
|
|
|
|
|
|
|
|
|
|
|
|
|
Adjusted EBITDA |
|
$ |
22,495 |
|
$ |
19,421 |
|
$ |
17,548 |
|
$ |
27,975 |
|
$ |
28,313 |
|
$ |
22,066 |
|
| |
|
|
|
|
|
|
|
|
|
|
|
|
|
Quarterly Trends
Revenue—
Revenue declined sequentially for the last three quarters of fiscal 2011. The decline in revenue during fiscal 2011 was primarily due to a general
reduction in industry-wide demand caused by disruptions and uncertainties in the worldwide
economy. These disruptions and uncertainties were precipitated by the tsunami in Japan in March 2011 and the subsequent nuclear disaster, the aftermath of which caused a disruption of the worldwide
electronic supply-chain for the second quarter of fiscal 2011 that continued to ripple through the industry for the rest of the year. Revenue continued to decline for the third quarter of fiscal 2011
as other events, such as the turmoil in the Middle East and the eurozone debt crisis, reduced business confidence and further dampened demand. The November flooding around Bangkok, Thailand, an area
from which many key electronic components are sourced, further disrupted the supply-chain and impacted demand for the fourth quarter of fiscal 2011.
The
first quarter of fiscal 2012, as compared to the fourth quarter of fiscal 2011, saw an increase in revenue which reflected increased demand for our high-performance products and the
pickup in demand after the holiday season in Europe and the Americas. Revenue from our high-speed digital products, which are used in enterprise class servers and storage applications, as
well as in high-speed routers and communication equipment, that support the expanding cloud computing environment and associated increase in internet traffic, increased significantly and
represents our success in qualifying our high-performance products for new applications. Revenue from standard products, which had decreased throughout fiscal 2011, increased in the first quarter of
fiscal 2012.
Revenue in the second quarter of fiscal 2012 was $1.6 million, or 1.1%, lower than in the first quarter of fiscal 2012. In the third quarter of fiscal 2012, revenue decreased a further
$14.1 million or 9.4% compared to the second quarter. However, increased demand for our higher margin, high-performance products continued in both the second and third quarters of fiscal 2012.
84
Table of Contents
Management's Discussion and Analysis of Financial Condition and Results of Operations
The percentage of our revenue derived from high-performance products generally increased during fiscal 2011 and through fiscal 2012. The upward trend retreated only
slightly in the first quarter of 2012 before resuming its upward trajectory. This improvement in our product mix reflected our continued marketing focus on high-performance products and success in
qualifying them for new applications. Gross sales of our high-performance and standard products are shown below:
|
|
|
|
|
|
|
|
|
|
|
|
|
|
|
|
|
|
|
|
|
|
|
Three months ended |
|
|
|
July 2,
2011
|
|
October 1,
2011
|
|
December 31,
2011
|
|
March 31,
2012
|
|
June 30,
2012
|
|
September 29,
2012
|
|
| |
|
|
|
(dollars in thousands)
|
|
High-performance |
|
|
|
|
|
|
|
|
|
|
|
|
|
|
|
|
|
|
|
| |
High-Tg |
|
$ |
93,147 |
|
$ |
85,223 |
|
$ |
78,050 |
|
$ |
81,883 |
|
$ |
77,318 |
|
$ |
70,380 |
|
| |
High-speed digital |
|
|
30,476 |
|
|
27,090 |
|
|
37,696 |
|
|
44,440 |
|
|
50,233 |
|
|
43,377 |
|
| |
Military, specialty and other |
|
|
8,140 |
|
|
8,819 |
|
|
7,671 |
|
|
7,237 |
|
|
6,480 |
|
|
7,474 |
|
| |
|
|
|
|
|
|
|
|
|
|
|
|
|
Total high-performance |
|
|
131,763 |
|
|
121,132 |
|
|
123,417 |
|
|
133,560 |
|
|
134,031 |
|
|
121,231 |
|
Standard |
|
|
28,762 |
|
|
24,569 |
|
|
18,262 |
|
|
21,315 |
|
|
19,555 |
|
|
17,645 |
|
| |
|
|
|
|
|
|
|
|
|
|
|
|
|
Total gross sales |
|
$ |
160,525 |
|
$ |
145,701 |
|
$ |
141,679 |
|
$ |
154,875 |
|
$ |
153,586 |
|
$ |
138,876 |
|
| |
|
|
|
|
|
|
|
|
|
|
|
|
|
High-performance sales percentage of total gross sales |
|
|
82.1 |
% |
|
83.1 |
% |
|
87.1 |
% |
|
86.2 |
% |
|
87.3 |
% |
|
87.3 |
% |
- (1)
- Gross sales represent revenue prior to certain adjustments for cash discounts, rebates and other revenue adjustments that cannot be allocated to a specific product
segment. For the three months ended July 2, 2011, October 1, 2011, December 31, 2011, March 31, 2012, June 30, 2012 and September 29, 2012 these adjustments
totaled $4.5 million, $2.8 million, $4.1 million, $3.2 million, $3.5 million and $2.9 million, respectively. Revenue was $156.0 million,
$142.9 million, $137.5 million, $151.7 million, $150.1 million and $136.0 million for the three months ended July 2, 2011, October 1, 2011,
December 31, 2011, March 31, 2012, June 30, 2012 and September 29, 2012, respectively. Management uses gross sales as a measure of operating performance.
Cost of goods sold and gross profit—
In fiscal 2011, cost of goods sold and gross profit followed the revenue trend. As the cost of copper continued to increase during the second and
third quarters of fiscal 2011, our gross margin declined slightly during these periods because of the arithmetic effect of passing through raw materials costs without an added profit component. Gross
margin rebounded for the fourth quarter of fiscal 2011 due, in part, to lower copper costs.
For the fiscal 2012, cost of goods sold and gross profit also followed the revenue trend. In the first and second quarters of fiscal 2012, gross profit also benefitted from a slight decrease in the
purchase price of raw materials, due in part to lower copper and glass costs. In the third quarter of fiscal 2012, gross profit declined slightly due to an increase in the purchase price of raw
materials.
Sales, general and administrative—
Our SG&A expense generally increased throughout fiscal 2011. In fiscal 2011, quarterly variations in SG&A expense were primarily due to the timing of
professional fees associated with this offering. The increase for the fourth quarter of fiscal 2011 was also due to withholding taxes ($1.3 million) on payments received in the United States
from our international subsidiaries related to intercompany management fees and commissions.
In the first quarter of 2012, SG&A expense decreased compared to the fourth quarter of fiscal 2011. The decrease in SG&A was primarily due to lower audit and consulting fees ($1.1 million) and
lower
85
Table of Contents
Management's Discussion and Analysis of Financial Condition and Results of Operations
withholding taxes ($1.5 million) offset by increased personnel costs ($1.6 million) and information technology costs ($0.2 million).
SG&A expense increased $0.7 million in the second quarter of fiscal 2012 compared to the first quarter of fiscal 2012, primarily due to higher audit and legal fees ($0.9 million). In the
third quarter of fiscal 2012, SG&A expense decreased $1.6 million compared to the second quarter of fiscal 2012 primarily due to lower accruals under our variable incentive compensation
program.
Research and development—
Our research and development expense gradually increased during fiscal 2011 and into the first and second quarters of fiscal 2012, primarily due to
higher personnel costs as we added more technical resources to this important function. In the third quarter of fiscal 2012, R&D expense was consistent with the prior quarter.
Quarter-to-quarter variations in R&D spending also reflect changes in the purchases of outside materials and support services as well as legal fees related to the defense of
our intellectual property rights.
Restructuring—
Restructuring expense in fiscal 2011 and the first and second quarters of fiscal 2012 was primarily the residual expenses related to the facility
closures that occurred in fiscal 2009. For the fourth quarter of fiscal 2011, we recorded $0.6 million of impairment expense associated with our previously closed facility in Fremont,
California, which accounted for the increase in restructuring expense. In the second quarter of fiscal 2012, we recorded a net restructuring gain of $0.2 million related to the gain on the sale
of our facility in Fremont, California.
Operating income—
In fiscal 2011, the changes in the operating income from quarter to quarter were a direct result of the changes in revenue and SG&A expense, as
discussed above. SG&A expense increased during fiscal 2011 primarily due to professional fees attendant with this offering and also due to withholding taxes incurred on payments from our international
subsidiaries related to intercompany management fees and commissions.
In the first quarter of fiscal 2012, our operating income increased $12.8 million compared to the fourth quarter of fiscal 2011 due to higher revenue. Operating income was positively impacted
by a decrease in operating expenses of $0.9 million primarily due to decreases in SG&A expense, as discussed above.
Operating income in the second quarter of fiscal 2012 was $20.9 million, a decrease of $0.7 million compared to the first quarter of 2012. As discussed above, in the second quarter of
fiscal 2012
operating income was impacted by higher audit and legal fees and higher R&D spending offset by the gain on the sale of the Fremont, California facility.
In the third quarter of fiscal 2012, operating income decreased $4.9 million compared to the prior quarter. The decrease in operating income was primarily due to the the lower sales and gross
profit. Gross profit decreased $6.3 million in the third quarter of fiscal 2012 compared to the second quarter of fiscal 2012. The decline in the gross profit was partially offset by lower
operating expenses primarily as result of lower accruals under our variable incentive compensation program.
LIQUIDITY AND CAPITAL RESOURCES
Liquidity
We have historically financed our operations, including requirements for our working capital, fixed capital and other cash requirements, through cash
generated from operations and various financing arrangements, including capital and operating leases. We are dependent on remittances from our overseas locations to our
86
Table of Contents
Management's Discussion and Analysis of Financial Condition and Results of Operations
U.S.
subsidiary, as more fully explained below. The tax consequences resulting from the remittances of earnings from our various overseas operating subsidiaries to our U.S. subsidiary does not have a
material effect on our financial position, results of operations or cash flows, owing to our status as a Luxembourg corporation and the fact that we accrue for estimated withholding taxes on
undistributed earnings. We expect this to remain unchanged upon our reorganization to a Cayman Islands holding company.
The
following table sets forth the cash and cash equivalents for each region for the periods presented:
|
|
|
|
|
|
|
|
|
|
|
|
|
|
|
|
|
|
|
As of |
|
|
|
|
|
|
|
|
|
Fiscal year |
|
|
|
September 29,
2012
|
|
October 1,
2011
|
|
|
|
2011
|
|
2010
|
|
2009
|
|
| |
|
|
|
(dollars in thousands)
|
|
Asia |
|
$ |
47,473 |
|
$ |
37,026 |
|
$ |
36,409 |
|
$ |
25,724 |
|
$ |
25,237 |
|
Americas |
|
|
3,729 |
|
|
6,446 |
|
|
2,616 |
|
|
5,674 |
|
|
8,700 |
|
Europe(1) |
|
|
8,924 |
|
|
13,150 |
|
|
8,228 |
|
|
4,974 |
|
|
4,392 |
|
Corporate |
|
|
45 |
|
|
252 |
|
|
228 |
|
|
361 |
|
|
603 |
|
| |
|
|
|
|
|
|
|
|
|
|
|
Total |
|
$ |
60,171 |
|
$ |
56,874 |
|
$ |
47,481 |
|
$ |
36,733 |
|
$ |
38,932 |
|
| |
|
|
|
|
|
|
|
|
|
|
|
The following table sets forth our accounts receivable by region and on a consolidated basis and consolidated revenue and DSOs for the periods presented:
|
|
|
|
|
|
|
|
|
|
|
|
|
|
|
|
|
|
|
As of |
|
|
|
|
|
|
|
|
|
Fiscal Year |
|
|
|
September 29,
2012
|
|
October 1,
2011
|
|
|
|
2011
|
|
2010
|
|
2009
|
|
| |
|
|
|
(dollars in thousands, except for DSOs)
|
|
Asia |
|
$ |
89,684 |
|
$ |
86,491 |
|
$ |
88,259 |
|
$ |
78,953 |
|
$ |
67,966 |
|
Americas |
|
|
12,981 |
|
|
12,851 |
|
|
13,129 |
|
|
14,602 |
|
|
13,360 |
|
Europe(1) |
|
|
9,970 |
|
|
12,171 |
|
|
7,201 |
|
|
9,934 |
|
|
14,000 |
|
| |
|
|
|
|
|
|
|
|
|
|
|
Accounts Receivable |
|
$ |
112,635 |
|
$ |
111,513 |
|
$ |
108,589 |
|
$ |
103,489 |
|
$ |
95,326 |
|
Revenue |
|
$ |
437,804 |
|
$ |
459,448 |
|
$ |
596,989 |
|
$ |
611,987 |
|
$ |
424,199 |
|
Days' Sales Outstanding |
|
|
70 |
|
|
66 |
|
|
66 |
|
|
63 |
|
|
82 |
|
- (1)
- We maintain credit insurance for certain of our accounts receivable to mitigate collection risk. As of September 29, 2012, $6.7 million of our accounts receivables were
covered by credit insurance. We did not have any major customer write-offs in the current year period that were covered by credit insurance.
Our consolidated accounts receivable as of September 29, 2012 increased by $1.1 million compared to October 1, 2011. Accounts receivable in
Asia increased by $3.2 million partially offset by a net decrease of $2.1 million in the Americas and Europe. Our consolidated DSOs were 70 as of September 29, 2012 compared to 66
as of October 1, 2011. The increases in our accounts receivable and DSOs were primarily attributable to a shift in revenue and customer mix, which increased DSOs by three days and increased
accounts receivable by $4.8 million.
Higher DSOs and accounts receivable as of September 29, 2012 were primarily attributable to our Asian region. Revenue from our Asian region represents an increased percentage of our total
revenue in the current year compared to the comparable prior year period, primarily due to increased sales of our high-performance products. In the current year period, revenue from our Asian region
increased to 65% of our total revenue, compared to 59% of our total revenue in the prior year period. Our Asian customers are typically our larger customers and generally have longer payment terms.
Our payment terms are negotiated on a customer-by-customer basis. The increase in revenue from these larger customers increased our DSOs
87
Table of Contents
Management's Discussion and Analysis of Financial Condition and Results of Operations
as of September 29, 2012 by approximately three days compared to October 1, 2011 and increased the ratio of accounts receivable to quarterly revenue by approximately 3.5% in the current
year period.
Our consolidated accounts receivable as of September 29, 2012 increased by $4.0 million compared to December 31, 2011 (year-end fiscal 2011); accounts receivable in
Asia and Europe increased by $1.4 million and $2.7 million; and the Americas decreased by $0.1 million. Our consolidated DSOs were 70 as of September 29, 2012 compared to
consolidated DSOs of 66 as of December 31, 2011. The increase in accounts receivable and DSOs were primarily due to the impact of the shift in revenue and customer mix to our Asian region as
discussed above. The impact of the shift in revenue and change in customer mix was an increase in accounts receivable of $2.0 million, an increase to our consolidated DSOs of one day and
an increase to the ratio of accounts receivable to quarterly revenue of approximately 1.5% in the current year period.
The increase in the DSOs as of September 29, 2012 compared to December 31, 2011 was also due to a seasonal factor in our European region. We have traditionally closed our German
manufacturing facility for the last two weeks of December. Although we continue to receive cash payments on our outstanding accounts receivable during this period, we generate minimal revenues at this
facility, which has the effect of reducing both our accounts receivable and our consolidated DSOs at year-end. As we resume manufacturing operations and generate revenue at the beginning
of the year, our consolidated DSOs and accounts receivable return to more typical levels. The impact of the German factory shutdown on our accounts receivable and consolidated DSOs as of
December 31, 2011 was a reduction in the accounts receivable of $1.8 million, a decrease of one day to our consolidated DSOs and an increase of 1.3% on the ratio of accounts
receivable to quarterly revenue.
Consolidated DSOs as of December 31, 2011 (fiscal year-end 2011) were 66 compared to consolidated DSOs of 63 as of January 1, 2011 (fiscal year-end 2010).
Accounts receivable increased by $5.1 million as of December 31, 2011 compared to the prior year. Asia increased by $9.3 million partially offset by a decrease of
$4.2 million in the Americas and Europe. The three-day increase in DSOs as of December 31, 2011 compared to January 1, 2011 reflected the impact of the timing of the receipt of
payments in Asia, as discussed above. The fiscal 2010 period ended after the December calendar month-end, which resulted in lower DSOs and lower accounts receivable, as payments due at the
end of the calendar month were received prior to the end of our fiscal period.
Our consolidated accounts receivable as of January 1, 2011 (fiscal year-end 2010) increased by $8.2 million compared to December 26, 2009 (fiscal year-end 2009). Asia increased by
$11.0 million partially offset by a decrease of $2.8 million in the Americas and Europe. The increase in the accounts receivable balance is due to the increase in revenue in fiscal 2010
compared to fiscal 2009. Our consolidated DSOs of 82 at fiscal year-end 2009 were unusually high, reflecting the relatively early closing of the fiscal year-end on
December 26, 2009 and the corresponding effect on cash receipts in Asia, as discussed above.
Our DSOs in Asia are generally between 85 to 95 days while DSOs in the Americas are between 45 to 50 days and in Europe are between 35 to 45 days. Just as we extend relatively
long payment terms to our customers in Asia, our vendors in Asia extend relatively long payment terms to us. As our business in Asia expands, short-term vendor financing also expands.
Accounts payable as of September 29, 2012 increased by $6.8 million from fiscal year-end 2011, of which $6.7 million related to our Asian region. As of
October 1, 2011 our accounts payable had increased $7.4 million from the fiscal year-end 2010, of which $6.2 million related to our Asian region.
We
assess the liquidity for each region in terms of the ability to provide adequate cash to fund operating, investing and financing activities. We have no available credit lines and depend on
internally generated cash flows.
88
Table of Contents
Management's Discussion and Analysis of Financial Condition and Results of Operations
The
Asian region is the principal operational cash flow generator. Asia generates sufficient profits and cash flow to fund the incremental working and fixed capital requirements and other cash
requirements in this region, as well as substantial remittances to the United States.
The Asian region has term loans outstanding in China, primarily denominated in U.S. dollars, which, as of September 29, 2012, had an outstanding balance equivalent to $15.1 million.
These are short-term facilities, which are rolled over as they mature. We are dependent on cash remittances from Asia to the United States to service the debt under our current senior
secured and mezzanine credit agreements and to meet other cash requirements. In fiscal 2011, we remitted approximately $40.0 million of cash from Asia to the U.S.
In accordance with the Company Law of the People's Republic of China, our China subsidiaries may be required to appropriate a portion of net income as determined under accounting principles generally
accepted in China ("PRC GAAP") to non-distributable reserves. While the reserves restrict a portion of retained earnings from distribution to shareholders, the reserves are not
withdrawn from the business and remain available for use in operations. The China subsidiaries are required to appropriate not less than 10% of their net income determined under PRC GAAP to the
reserve. Appropriations to the reserve are limited to 50% of each China subsidiary's registered capital. The total appropriations of retained earnings to our China subsidaries' statutory reserves
totaled $1.7 million as of September 29, 2012.
In addition, the Company Law of Taiwan requires our Taiwan subsidiary to reserve 10% of the current year's profit as a legal reserve, which may not be freely distributed as a dividend. While the
reserves restrict a portion of retained earnings from distribution to shareholders, the reserves are not withdrawn from the business and remain available for use in operations. The total
appropriations of retained earnings to our Taiwan subsidiary's legal reserve totaled $9.9 million as of September 29, 2012.
Europe also generates cash flow sufficient to finance its incremental working and fixed capital requirements and other cash obligations in this region. Europe also has three capital leases (totaling
$14.3 million as of September 29, 2012), the largest of which ($12.0 million) financed the building and equipment of our subsidiary in Italy. In 2011, we remitted approximately
$8.0 million of cash from Europe to the U.S.
The Americas and our Corporate headquarters are dependent on the cash flows remitted from Asia and Europe to meet the short- and long-term cash requirements of this region and our
Corporate headquarters. The primary cash needs of the region and headquarters are to service the debt under our current senior secured and mezzanine credit agreements, expenses of our Corporate
headquarters and expenses of our principal research and development facility, both of which are located in the U.S.
All
of our reported cash and cash equivalents are available to meet ongoing cash needs. Restricted cash is reported separately on our balance sheet. Cash repatriation from our overseas subsidiaries to
Luxembourg (since these overseas subsidiaries are organizationally located beneath our intermediary consolidated Luxembourg holding companies) may be subject to withholding taxes at the originating
location at various rates ranging between 5% and 20%. Luxembourg does not impose a tax on dividends received from subsidiaries. Therefore, a reserve for the future anticipated withholding taxes on
undistributed earnings is included in our income tax provision. Refer to Note 12 "Income Taxes" in our consolidated annual financial statements for further discussion.
As of September 29, 2012, we had working capital (current assets less current liabilities) of $87.5 million. Of this amount, unrestricted cash and cash equivalents were
$60.2 million. Restricted cash as of September 29, 2012 was $1.4 million (primarily related to worldwide letters of credit and retirement obligations in Germany).
Based
on our current level of operations and anticipated growth, we believe that our cash flow from operations and other sources of liquidity, including cash and cash equivalents and current
borrowings, will
89
Table of Contents
Management's Discussion and Analysis of Financial Condition and Results of Operations
provide
adequate funds for ongoing operations, planned capital expenditures, debt service and other requirements for at least the next 12 months. Our future capital requirements will depend on
many factors, including our growth rate and related working capital requirements, the timing and extent of our research and development efforts, the level of our sales and marketing activities and
capital expenditures.
We have planned approximately $19.6 million for capital expenditures in fiscal 2012, primarily for cost reduction projects in manufacturing and for quality improvements. Our cash expenditures
related to capital expenditures totaled $12.2 million for the nine months ended September 29, 2012, $12.9 million in 2011, $15.7 million in 2010 and $6.2 million in
2009.
Our Credit Agreements Prior to the Offering
Prior to the offering, our primary lending arrangements consist of a senior secured credit agreement and a mezzanine credit agreement entered into
with a syndicate of lenders, including our Sponsors. We intend to fully repay all loans outstanding under both of these agreements with the proceeds of this offering and our new senior secured notes.
Senior secured credit agreement. Our senior secured credit agreement provides for a senior secured term loan of $210.0 million, the full amount of which was
drawn at closing on September 30, 2010. Loans under the senior secured credit agreement were issued at a discount of $28.5 million. The proceeds were used to refinance part of our
then-existing first- and second-lien term loans, as well as to pay other fees and expenses related to our senior secured credit agreement. Loans under the senior secured credit
agreement bear interest, at our option, at a rate per annum equal either to a base rate (that can be no less than 3%) plus 7%, or an adjusted Eurodollar rate (that can be no less than 2%) plus 8%. As
of September 29, 2012, we had principal of $210.0 million outstanding under the senior secured credit agreement, bearing interest at 10% per annum and $19.3 million of unamortized
original issue discount resulting in a net balance of $190.7 million. Loans under this agreement mature on September 30, 2015. The borrower under this agreement is our wholly-owned
subsidiary, Isola USA Corp. Loans under the agreement are guaranteed by various Isola Group S.à r.l. subsidiaries.
Mezzanine credit agreement. On September 30, 2010, we issued an initial principal amount of $175.0 million in unsecured term loans pursuant to our
mezzanine credit agreement. The unsecured term loans were issued at a discount of $70.4 million. The proceeds were used in part to refinance our then-existing first- and
second-lien term debt, as well as to pay other fees and expenses related to the mezzanine credit agreement. The unsecured term loans issued pursuant to the mezzanine credit agreement bear
interest at a rate of 16% per annum, with half (8% per annum) payable in cash and the other half (8% per annum) payable by accreting such amount to the outstanding principal amount of the unsecured
term loans. The accretion of interest is referred to as payment-in-kind, or PIK, interest expense. As of September 29, 2012, we had principal of $201.0 million
outstanding under the mezzanine credit agreement, which included $26.0 million of accreted PIK interest. We also had an additional $4.1 million of accrued PIK interest that had not been
accreted to the principal balance as of September 29, 2012. The unamortized original issue discount was $56.8 million, resulting in a net balance of $148.3 million.
We incurred $19.2 million of loan origination costs pursuant to the senior secured credit agreement and the mezzanine credit agreement. Recognition of these costs has been deferred and is
amortized to interest expense over the terms of the agreements. As of September 29, 2012, we had $13.7 million of unamortized deferred loan origination costs of which $3.5 million
was included in current assets and $10.2 million was included in long-term assets on our consolidated balance sheet.
The
senior secured credit agreement and mezzanine credit agreement require us to maintain certain covenants that restrict our ability to operate our business, including, but not limited to,
restrictions on the ability of the borrower and certain Isola group subsidiaries to (i) dispose of assets or stock; (ii) incur
90
Table of Contents
Management's Discussion and Analysis of Financial Condition and Results of Operations
additional
indebtedness and guarantee obligations; (iii) pay certain dividends; (iv) create liens on assets; (v) make investments, loans or advances; (vi) restrict
distributions to the borrowers or guarantors from their subsidiaries; (vii) engage in mergers or consolidations; (viii) engage in certain transactions with affiliates; (ix) incur
additional negative pledges; (x) incur capital expenditures; (xi) change our fiscal year or accounting practices or the lines of business in which we and our subsidiaries are involved;
(xii) enter into sale-leaseback transactions; (xiii) prepay principal of, premium, or interest on, or redeem, purchase, retire, defease, or create a sinking fund or make a
similar payment with respect to, any subordinated indebtedness and certain other debt; (xiv) change the conduct of business; (xv) conduct activities of any parent holding company;
(xvi) amend our organizational documents; (xvii) cease to keep in full force and effect our corporate existence and all rights, franchises, licenses and permits material to our business;
(xviii) not pay our taxes or certain claims when they are due; or (xix) allow insurance to expire.
In addition, our senior secured credit agreement requires us to maintain certain financial and operating covenants, including compliance with an interest coverage ratio and a leverage ratio. The
interest coverage ratio is the ratio of Consolidated Adjusted EBITDA to consolidated interest expense for a
rolling four-fiscal quarter period. As of September 29, 2012, the required minimum interest coverage ratio was 2.00:1.00, and our actual ratio was 2.77:1.00. The required minimum
interest coverage ratio increases over time to 2.25:1.00 effective December 28, 2013.
The leverage ratio is the ratio of consolidated total secured debt to Consolidated Adjusted EBITDA for a rolling four-fiscal quarter period. As of September 29, 2012, the maximum
allowed leverage ratio was 3.00:1.00, and our actual leverage ratio was 2.12:1.00. The maximum leverage ratio decreases over time to 2.25:1.00 effective June 28, 2014.
The
definition of Consolidated Adjusted EBITDA under the senior secured credit agreement differs from Adjusted EBITDA used elsewhere in this prospectus. Under our senior secured credit agreement,
Consolidated Adjusted EBITDA includes additional add-backs to net income for certain pension costs, property and other taxes, and certain other expenses.
Our Indebtedness Following the Offering
Concurrently with this offering, we expect to enter into a new $ million senior secured revolving credit facility and issue
$ million of senior secured notes due 2019. The proceeds from the issuance of the senior secured notes will be used to repay the remaining outstanding balances under the existing
senior secured and mezzanine credit agreements that are not repaid from the proceeds of this offering. This offering, the senior secured notes offering and the closing of the senior secured revolving
credit facility are each conditional upon the closing of the other transactions. We expect that our new revolving credit facility will remain undrawn at the closing of this offering. The consummation
of our new revolving credit facility is not a condition to this offering. We anticipate that the new senior secured notes and new senior secured revolving credit facility will reduce our annual
interest expense and subject us to less restrictive financial covenants. For additional information on the principal terms of this facility, see "Description of Indebtedness".
91
Table of Contents
Management's Discussion and Analysis of Financial Condition and Results of Operations
Cash Flows
The table below sets forth selected cash flow data for the periods presented:
|
|
|
|
|
|
|
|
|
|
|
|
|
|
|
|
|
|
|
Nine months ended |
|
|
|
|
|
|
|
|
|
Fiscal year |
|
|
|
September 29,
2012
|
|
October 1,
2011
|
|
|
|
2011
|
|
2010
|
|
2009
|
|
| |
|
|
|
(dollars in thousands)
|
|
Net cash provided by / (used in) operating activities |
|
$ |
25,021 |
|
$ |
27,910 |
|
$ |
23,013 |
|
$ |
(55,348 |
) |
$ |
(15,099 |
) |
Net cash provided by / (used in) investing activities |
|
|
(9,129 |
) |
|
(6,668 |
) |
|
(7,012 |
) |
|
(9,278 |
) |
|
(6,974 |
) |
Net cash provided by / (used in) financing activities |
|
|
(577 |
) |
|
(1,378 |
) |
|
(7,040 |
) |
|
60,642 |
|
|
(13,072 |
) |
Effect of exchange rates on cash and cash equivalents |
|
|
(2,625 |
) |
|
277 |
|
|
1,787 |
|
|
1,785 |
|
|
(7 |
) |
| |
|
|
|
|
|
|
|
|
|
|
|
Net increase / (decrease) in cash and cash equivalents |
|
$ |
12,690 |
|
$ |
20,141 |
|
$ |
10,748 |
|
$ |
(2,199 |
) |
$ |
(35,152 |
) |
| |
|
|
|
|
|
|
|
|
|
|
|
Operating Activities. Cash provided by or (used in) operating activities is the cash we generate through running the business and reflects change in the balances
of operating assets and liabilities as well as adjustments to net income for non-cash income and expense items.
For the nine months ended September 29, 2012, net cash provided by operating activities was $25.0 million. The reported net loss of $64.5 million was adjusted by
$94.1 million for non-cash transactions and $4.6 million in changes in working capital and other activities. Non-cash adjustments consist primarily of
$34.7 million of non-cash interest expense, $12.3 million of depreciation and amortization expense, $0.8 million of unrealized foreign currency exchange loss and a
$45.8 million change in the fair value of our derivatives.
The $4.6 million change in cash due to working capital was a result of:
- –>
- A
higher investment in inventories.
- –>
- An
increase in accounts payable due to the timing of invoices paid and received.
- –>
- An
increase in accounts receivable. The percentage classified as "current" (based on payments within the terms of the invoice) improved to 90.5% as of
September 29, 2012 from 88.0% as of December 31, 2011. DSOs, a key metric used by the Company's management to monitor accounts receivable, increased to 70 as of September 29, 2012
from 66 as of December 31, 2011. Lower DSOs at our fiscal year end were primarily due to a shift in revenue to our Asia region and a change in customer mix as discussed above.
For the nine months ended October 1, 2011, net cash provided by operating activities was $27.9 million. The reported net income of $7.1 million was adjusted by
$19.3 million for
non-cash transactions. Additionally, $1.5 million was provided by reductions in working capital and other activities. Non-cash adjustments consisted primarily of
$32.3 million of non-cash interest expenses and $12.9 million of depreciation and amortization expense, partially offset by a change in the fair value of our embedded
derivative liabilities of $28.0 million.
The $1.5 million change in cash due to working capital was a result of:
- –>
- A
lower investment in inventories.
- –>
- An
increase in accounts payable due to the timing of invoices paid and received.
- –>
- An
increase in accounts receivable balances. Although accounts receivable increased, the percentage classified as "current" (based on payments within the terms of
the invoice) improved to 82.6% as of October 1, 2011 from 78.6% as of January 1, 2011. DSOs, a key metric used by the Company's
92
Table of Contents
Management's Discussion and Analysis of Financial Condition and Results of Operations
management
to monitor accounts receivable, increased slightly to 66 as of October 1, 2011 from 63 as of January 1, 2011.
In
fiscal 2011, net cash provided by operating activities was $23.0 million. The reported net income of $10.0 million was adjusted by $13.4 million for non-cash
transactions and $0.4 million in changes in working capital and other activities. Non-cash adjustments consist primarily of $43.6 million of non-cash interest expense
and $17.3 million of depreciation and amortization expense, partially offset by a change in the fair value of our derivatives of $42.4 million.
The
$0.4 million change in cash due to working capital was a result of:
- –>
- A
lower investment in inventories.
- –>
- A
decrease in accounts receivable reflecting the lower revenue in fiscal 2011. The percentage of accounts receivable classified as "current" (based on payments
within the terms of the invoice) improved to 88.0% as of December 31, 2011 from 78.6% as of January 1, 2011. DSOs, a key metric used by the Company's management to monitor accounts
receivable, increased slightly to 66 as of December 31, 2011 from 63 as of January 1, 2011.
- –>
- A
decrease in accounts payable due to the timing of invoices paid and received
In
fiscal 2010, net cash used in operating activities was $55.3 million. The reported net income of $1.2 million was adjusted by $11.5 million for non-cash
transactions and $68.0 million in changes in working capital and other activities. Non-cash transactions consisted primarily of non-cash interest expense of
$21.2 million and depreciation and amortization expense of $16.9 million, offset by a gain of $21.2 million relating to the change in the fair value of our derivatives, and an
unrealized foreign currency translation gain of $12.1 million.
The
$68.0 million change in cash due to working capital was a result of:
- –>
- The
payment on September 30, 2010 of $76.4 million of interest expense that had been accrued since we defaulted on our then-existing first-
and second-lien credit facilities at the start of fiscal 2009.
- –>
- Higher
receivables reflecting the higher revenue in fiscal 2010 compared to fiscal 2009. The percentage of accounts receivable classified as "current" (based on
payments within the terms of the invoice) decreased to 78.6% as of January 1, 2011 from 84.1% as of December 26, 2009. However, annual DSOs improved to 63 as of January 1, 2011
from 82 as of December 26, 2009. DSOs in fiscal 2009 were impacted by the timing of cash receipts at our Asian subsidiaries. In Asia, invoices are typically due at the end of the calendar
month, which in fiscal 2009 fell after our fiscal month-end.
- –>
- Higher
inventories increased the cash used in operations.
Net
cash used in operating activities was $15.1 million in fiscal 2009. The reported net loss of $100.7 million was adjusted for non-cash transactions of $65.7 million
and $19.9 million in changes in working capital and other activities. Non-cash transactions consisted primarily of a change in the fair value of our derivatives of
$26.4 million, depreciation and amortization expense of $19.8 million and non-cash interest expense of $10.4 million.
The
$19.9 million change in cash due to working capital was a result of:
- –>
- An
increase in the accounts receivable balances. Receivables increased due to an increase in revenue during the last quarter of fiscal 2009, reflecting the recovery
from the economic downturn that had started in mid-fiscal 2008. Our percentage of receivables classified as "current" increased to 84.1% as of December 26, 2009 up from 66.4% as of
December 27, 2008. However, annual DSOs increased to 82 as of December 26, 2009 from 57 as of December 27, 2008. The increase in DSOs was due to the
93
Table of Contents
Management's Discussion and Analysis of Financial Condition and Results of Operations
timing
of cash receipts at our Asian subsidiaries. In Asia, invoices are typically due at the end of the calendar month, which in fiscal 2009 fell after our fiscal month-end.
- –>
- Increased
inventories to support increased demand and revenue.
- –>
- Accounts
payable were reduced as several vendors shortened their credit terms to us.
- –>
- An
increase of $42.7 million in accrued liabilities, most of which was due to the accrual of interest expense on the loans related to the
then-defaulted first- and second-lien credit facilities that we were unable to pay.
Investing Activities. Cash used in investing activities relates primarily to payments to, or proceeds from, restricted cash accounts, and payments for capital
expenditures. Most of our capital expenditures are
to improve manufacturing productivity, to improve the quality of our products, to address environmental health and safety considerations or to replace aging equipment.
For the nine months ended September 29, 2012, cash used in investing activities was $9.1 million and was primarily related to the purchase of property, plant and equipment
($12.2 million) partially offset by proceeds from dispositions ($2.9 million). In the nine months ended September 29, 2012, we sold our previously closed Fremont, California
facility and received proceeds of $2.0 million. In addition, we received proceeds of $0.8 million arising out of the payment by the Singapore government for taking a portion of our
leased land, which required us to move our loading docks and purchase select new equipment.
For the nine months ended October 1, 2011, net cash used in investing activities was $6.7 million. Purchases of property, plant and equipment were $7.0 million, which was offset
by the release of restricted cash of $0.2 million and $0.1 million of proceeds from disposition of property, plant and equipment.
In
fiscal 2011, cash used in investing activities was $7.0 million. Purchases of property, plant and equipment were $12.9 million, which were offset by the release of restricted cash of
$5.8 million ($5.5 million of restricted cash was used to pay-off the entrustment loan by our liquidating facility in Dalian, China) and $0.1 million of proceeds from
the disposition of property, plant and equipment.
In
fiscal 2010, net cash used in investing activities was $9.3 million. Purchases of property, plant and equipment were $15.7 million, which were offset in part by proceeds from the sale
of property, plant and equipment of $4.4 million and the release of restricted cash of $2.0 million following the partial repayment of an entrustment loan by our liquidating facility in
Dalian, China.
In
fiscal 2009, net cash used in investing activities was $7.0 million. Net cash used in investing activities in fiscal 2009 was primarily for the acquisitions of property, plant and equipment
in the amount of $6.2 million. Cash used in investing activities was affected by significantly lower than normal annual investment in capital expenditures due to the severity of the worldwide
recession and our need to conserve cash.
Financing Activities. Cash provided by (used in) financing activities relates primarily to proceeds and payments from capital and debt raising transactions and
payments under credit agreements and facilities, including capital lease obligations.
For the nine months ended September 29, 2012, net cash used in financing activities was $0.6 million. Financing activities occurred primarily at our overseas subsidiaries and reflected
the roll-over of various term loans and payments made under capital lease obligations.
For the nine months ended October 1, 2011, net cash used in financing activities was $1.4 million. Financing activities occurred primarily at our overseas subsidiaries and reflect the
roll-over of various term loans and payments on capital obligations.
94
Table of Contents
Management's Discussion and Analysis of Financial Condition and Results of Operations
In
fiscal 2011, net cash used in financing activities was $7.0 million. Financing activities occurred primarily at our overseas subsidiaries and reflect the roll-over of various
term loans and payments on capital lease obligations as well as the settlement of the entrustment loan by our liquidating facility in Dalian, China.
In
fiscal 2010, net cash provided by financing activities was $60.6 million. We completed a major refinancing in fiscal 2010, entering into new senior secured and mezzanine credit agreements as
well as issuing convertible preferred certificates. We received gross proceeds from these transactions of $376.4 million, which was allocated among the three forms of financing based on their
relative fair values. The funds received from these transactions along with $32.7 million of cash were used to repay the principal and accrued interest of the then-outstanding
first- and second-lien credit facilities. We incurred $19.2 million of debt issuance costs related to the current senior secured and mezzanine credit agreements, which costs have
been deferred and are being amortized over the term of the agreements.
In
fiscal 2009, net cash used in financing activities was $13.1 million. We received proceeds of $30.7 million which reflected the renewal of short-term credit facilities at
our overseas subsidiaries. Debt repayments similarly reflected the repayments of these short-term credit facilities. We made a $6.3 million repayment of principal on our
first-lien credit facility in the U.S. as well as a payment of $2.2 million on the entrustment loan by our liquidating facility in Dalian, China.
CONTRACTUAL OBLIGATIONS AND COMMITMENTS
The following table sets forth, as of December 31, 2011, the aggregate amounts of our significant contractual obligations and commitments with
definitive payment terms due in each of the periods presented:
|
|
|
|
|
|
|
|
|
|
|
|
|
|
|
|
|
|
|
Payments due by period |
|
|
|
Total
|
|
Year 1
|
|
Years 2-3
|
|
Years 4-5
|
|
More than
5 years
|
|
| |
|
|
|
(dollars in thousands)
|
|
Secured term loans under senior secured credit agreement(1) |
|
$ |
289,916 |
|
$ |
15,983 |
|
$ |
42,583 |
|
$ |
231,350 |
|
$ |
— |
|
Unsecured term loans under mezzanine credit agreement(2) |
|
|
344,743 |
|
|
11,838 |
|
|
34,509 |
|
|
298,396 |
|
|
— |
|
Short-term debt(3) |
|
|
15,527 |
|
|
15,527 |
|
|
— |
|
|
— |
|
|
— |
|
Interest rate swaps(4) |
|
|
869 |
|
|
355 |
|
|
514 |
|
|
— |
|
|
— |
|
Capital leases(5) |
|
|
19,184 |
|
|
1,352 |
|
|
2,704 |
|
|
2,704 |
|
|
12,424 |
|
Operating leases(5) |
|
|
3,934 |
|
|
870 |
|
|
1,190 |
|
|
824 |
|
|
1,050 |
|
Purchase obligations(6) |
|
|
18,115 |
|
|
1,499 |
|
|
7,753 |
|
|
2,848 |
|
|
6,015 |
|
Convertible preferred certificates(7) |
|
|
2,184,840 |
|
|
— |
|
|
— |
|
|
— |
|
|
2,184,840 |
|
| |
|
|
|
|
|
|
|
|
|
|
|
Total |
|
$ |
2,877,128 |
|
$ |
47,424 |
|
$ |
89,253 |
|
$ |
536,122 |
|
$ |
2,204,329 |
|
| |
|
|
|
|
|
|
|
|
|
|
|
- (1)
- Represents future principal and interest payments on the senior secured credit agreement entered into on September 30, 2010. Includes projected interest of $79.9 million
based on the interest rate as of December 31, 2011. Refer to Note 4 "Debt" in the consolidated annual financial statements.
- (2)
- Represents future principal and interest payments on the mezzanine credit agreement entered into on September 30, 2010. Includes projected interest of
$169.7 million
based on the interest rate as of December 31, 2011. Of this amount, $94.0 million represents interest "payable in kind" and $75.7 million represents interest payable in cash if
held to maturity. Refer to Note 4 "Debt" in the consolidated annual financial statements.
- (3)
- Represents future principal and interest payments on short-term debt. Includes projected interest of $0.4 million based on interest rates as of December 31,
2011. Refer to Note 4 "Debt" in the consolidated annual financial statements.
95
Table of Contents
Management's Discussion and Analysis of Financial Condition and Results of Operations
- (4)
- Represents obligations related to interest rate swaps entered into in May 2007 and December 2010. Each interest rate swap is based on variable rates. The projected obligation is based
on the interest rate as of December 31, 2011. Refer to Note 6 "Interest Rate Swaps" in the consolidated annual financial statements.
- (5)
- Represents obligations under capital and operating leases. Includes imputed interest of $4.4 million. Refer to Note 9 "Commitments and Contingencies" in
the consolidated
annual financial statements.
- (6)
- Includes amounts associated with agreements to purchase goods or services that are enforceable and legally binding on us and specify all significant terms,
including: fixed or minimum
quantities to be purchased; fixed, minimum or variable price provisions; and the approximate timing of the transaction. These amounts are comprised primarily of contracts for electricity, gas and
other utilities.
- (7)
- Represents future principal and interest payments associated with our convertible preferred certificates, which constitute legal debt instruments in Luxembourg, the
jurisdiction of
issuance. The convertible preferred certificates are denominated in euros and earn interest based on variable rates. The obligation includes projected interest of $2,004.0 million, if held to
maturity, and is based on interest rates as of December 31, 2011. Refer to Note 5 "Convertible Preferred Certificates" in the consolidated annual financial statements. Immediately prior
to this offering, all of the convertible preferred certificates will be effectively converted into ordinary shares of Isola Group Ltd., and the principal and interest on the convertible
preferred certificates will no longer be payable in cash. See the "Pro forma payments due by period" table below, which illustrates the pro forma effect of this conversion.
96
Table of Contents
Management's Discussion and Analysis of Financial Condition and Results of Operations
The above table excludes the following items:
- (a)
- Amounts
potentially payable to taxing authorities for uncertain tax positions taken on returns. The amount and timing of payments with respect to these
items are subject to a number of uncertainties such that we are unable to make sufficiently reliable estimates of the timing and amount of future payments. As of December 31, 2011, we had
accrued $52.6 million related to uncertain tax positions. While each of our uncertain tax positions could be settled in cash at a future date, a significant portion of the uncertain tax
positions relates to jurisdictions in which we have incurred net operating losses. Refer to Note 12 "Income Taxes" in the consolidated annual financial statements.
- (b)
- Amounts
payable to TPG pursuant to an agreement whereby TPG provides financial, advisory and consulting services to us. There are no minimum levels of
service required to be provided pursuant to the agreement and the agreement is in effect until cancelled by either party or the consummation of this offering. The annual amount due under the agreement
is $2.0 million plus reimbursement for reasonable out-of-pocket expenses incurred by TPG. Refer to Note 13 "Related Party Transactions" in the consolidated annual
financial statements.
- (c)
- Estimated
minimum funding requirements and expected voluntary contributions for retiree benefit plans as set forth by ERISA in relation to our pension and
post-retirement benefit obligations. Refer to Note 7 "Pension and Other Retirement Benefits" in the consolidated annual financial statements.
The
following table sets forth, as of December 31, 2011, the aggregate amounts of our significant contractual obligations and commitments with definitive payment terms due in each of the
periods presented on a pro forma basis to give effect to (i) the reorganization and effective conversion of the convertible preferred certificates to ordinary shares and (ii) the
application of $ million of the net proceeds from this offering and the issuance of $ million of senior secured notes to
prepay the secured term loans made
under our senior secured credit agreement and the unsecured term loans made under our mezzanine credit agreement as described in "Use of Proceeds":
|
|
|
|
|
|
|
|
|
|
|
|
|
|
|
|
|
|
|
Pro forma payments due by period |
|
|
|
Total
|
|
Year 1
|
|
Years 2-3
|
|
Years 4-5
|
|
More than
5 years
|
|
| |
|
|
|
(dollars in thousands)
|
|
New senior secured notes(1) |
|
$ |
|
|
$ |
|
|
$ |
|
|
$ |
|
|
$ |
|
|
Short-term debt(2) |
|
|
|
|
|
|
|
|
|
|
|
|
|
|
|
|
Interest rate swaps(3) |
|
|
|
|
|
|
|
|
|
|
|
|
|
|
|
|
Capital leases(4) |
|
|
|
|
|
|
|
|
|
|
|
|
|
|
|
|
Operating leases(4) |
|
|
|
|
|
|
|
|
|
|
|
|
|
|
|
|
Purchase obligations(5) |
|
|
|
|
|
|
|
|
|
|
|
|
|
|
|
|
| |
|
|
|
|
|
|
|
|
|
|
|
Total |
|
$ |
|
|
$ |
|
|
$ |
|
|
$ |
|
|
$ |
|
|
| |
|
|
|
|
|
|
|
|
|
|
|
- (1)
- Represents future principal and interest payments on our new senior secured notes. Includes projected interest of
$ million.
- (2)
- Represents future principal and interest payments on short-term debt. Includes projected interest of
$ million, if held to maturity, based on
interest rates as of December 31, 2011. Refer to Note 4 "Debt" in the consolidated annual financial statements.
- (3)
- Represents obligations related to interest rate swaps entered into in May 2007 and December 2010. Each interest rate swap is based on variable rates. The projected
obligation is based
on the interest rate as of December 31, 2011. Refer to Note 6 "Interest Rate Swaps" in the consolidated annual financial statements.
- (4)
- Represents obligations under capital and operating leases. Includes imputed interest of
$ million. Refer to Note 8 "Commitments and Contingencies" in the
consolidated annual financial statements.
97
Table of Contents
Management's Discussion and Analysis of Financial Condition and Results of Operations
- (5)
- Purchase obligations include amounts associated with agreements to purchase goods or services that are enforceable and legally binding on us and specify all significant terms,
including: fixed or minimum quantities to be purchased; fixed, minimum or variable price provisions; and the approximate timing of the transaction. These amounts are comprised primarily of contracts
for electricity, gas and other utilities.
- (a)
- Amounts
potentially payable to taxing authorities for uncertain tax positions taken on returns. The amount and timing of payments with respect to these
items are subject to a number of uncertainties such that we are unable to make sufficiently reliable estimates of the timing and amount of future payments. As of December 31, 2011, we had
accrued $52.6 million related to uncertain tax positions. While each of our uncertain tax positions could be settled in cash at a future date, a significant portion of the uncertain tax
positions relates to jurisdictions in which we have incurred net operating losses. Refer to Note 12 "Income Taxes" in the consolidated annual financial statements.
- (b)
- Amounts
payable to TPG including a transaction fee of $8.0 million and accrued management fees of $0.6 million as of December 31, 2011
associated with financial, advisory and consulting services provided to the Company. The amounts payable do not have scheduled repayment terms.
- (c)
- Estimated
minimum funding requirements and expected voluntary contributions for retiree benefit plans as set forth by ERISA in relation to the our pension
and post-retirement benefit obligations. Refer to Note 7 "Pension and Other Retirement Benefits" in the consolidated annual financial statements.
PENSION PLANS
Pension Plans. We sponsor several pension plans. We also provide various medical and life insurance benefits to certain retirees at an immaterial cost to Isola.
Although we have terminated or curtailed select benefits or plans, including our U.S. pension plans, several others are expected to continue, including pension plans required by collective bargaining
agreements outside of the United States. Some of these plans are underfunded. Based on various assumptions, in the aggregate our pension plans were underfunded by $56.0 million as of
December 31, 2011. We expect to make annual pension contributions of approximately $5.7 million for the foreseeable future. For additional information on our pension plans and
postretirement benefits, see Note 7 to the consolidated annual financial statements.
QUANTITATIVE AND QUALITATIVE INFORMATION ABOUT MARKET RISK
Interest Rate Risk, Derivative Instruments
We are exposed to certain risks relating to our ongoing business operations. The only risk managed by using derivative instruments is interest rate
risk. We do not use derivative financial instruments for trading or speculation purposes.
We are subject to interest rate risk in connection with borrowings under our existing senior secured credit agreement. As of September 29, 2012, we had $210.0 million in senior secured
term loans outstanding under our existing senior secured credit agreement, the un-hedged portion of which is subject to variable interest rates. We can elect to lock in interest rates on
the existing senior secured credit agreement for one, two, three or six months. The interest rates vary based upon the loan type, which is either a base rate loan or an adjusted Eurodollar rate. As of
September 29, 2012, we had elected to accrue interest for three months using the adjusted Eurodollar rate, which resulted in an interest rate of 10%. Under the existing senior secured credit
agreement, the adjusted Eurodollar rate would need to increase above 2%, which would be an increase of 164 basis points in the Eurodollar rate, to have an impact on future interest expense.
On December 30, 2010, we entered into an interest rate swap agreement with a notional amount of $25.0 million under which we pay a fixed rate of 2.8% and receive the greater of
three-month LIBOR or
98
Table of Contents
Management's Discussion and Analysis of Financial Condition and Results of Operations
2.0%. The swap is set to expire December 31, 2013. Settlement dates occur quarterly. We did not designate this swap agreement as a hedge and, therefore, the change in its fair value is recorded
in our consolidated statement of operations as interest expense, along with the quarterly settlement amounts. This derivative instrument addresses a requirement of our senior secured credit agreement
to have at least 50% of all indebtedness for borrowed money subject to interest rate agreements and/or fixed rates. The fair value of this interest rate swap was immaterial as of September 29,
2012.
Foreign Currency Risk
While the Company generates revenues in several currencies, a majority of its operating expenses are in U.S. dollars. Therefore, the depreciation of
these other currencies against the U.S. dollar would negatively affect revenue upon translation to the U.S. dollars. However, the impact on operating expenses would be less. For example, for the nine
months ended September 29, 2012, a 10% decrease in the value of the euro, against the U.S. dollar would have resulted in a $6.8 million decrease in revenue and would have resulted in a
$0.1 million decrease in our net loss. For fiscal 2011, a 10% decrease in the value of the euro against the U.S. dollar would have resulted in an $11.5 million decrease in revenue and a
$0.9 million decrease in the net income.
Inflation Risk
Inflationary factors, such as increases in our cost of goods sold and operating expenses, may adversely affect our results of operations. Although we
do not believe that inflation has had a material impact on our financial position or results of operations to date, an increase in the rate of inflation in the future, particularly in Europe and
China, may have an adverse affect on our levels of gross profit and operating expenses as a percentage of revenue if the sales prices for our products do not proportionately increase with these
increased expenses.
Commodity Risk
We are subject to commodity risks related to the prices of the raw materials used in the manufacture of our advanced PCB laminate materials,
including copper, glass and resin. These raw materials, especially copper, are subject to price fluctuations. In the past we have been able to pass through to our customers a substantial portion of
the raw material cost increases, although our ability to do so to the same degree in the future is not guaranteed. We generally experience a delay of approximately one to two months between raw
materials cost increases and corresponding adjustments to our product pricing. This delay could affect our short-term profitability. Historically, we have been able to pass through raw
material price increases more readily in connection with our high-performance products.
OFF-BALANCE SHEET ARRANGEMENTS
We do not maintain any off-balance sheet arrangements, transactions, obligations or other relationships with unconsolidated entities that
would be expected to have a material current or future effect upon our results of operations and financial condition.
SEASONALITY
Historically, our business has not been subject to recurring seasonal patterns. Revenue and earnings from quarter-to-quarter
within a fiscal year are driven primarily by general economic factors and the demand for electronic products.
99
Table of Contents
Management's Discussion and Analysis of Financial Condition and Results of Operations
CRITICAL ACCOUNTING POLICIES AND ESTIMATES
The discussion of our financial condition and results of operations is based upon our financial statements, which have been prepared in accordance
with U.S. generally accepted accounting principles, or U.S. GAAP. During the preparation of these financial statements, we are required to make estimates and assumptions that affect the
reported amounts of assets, liabilities, revenue, costs and expenses, and related disclosures. On an ongoing basis, we evaluate our estimates and assumptions, including those discussed below, that are
used to prepare our financial statements. We base our estimates on historical experience and on various other assumptions that we believe are reasonable under the circumstances. The results of our
analysis form the basis for making assumptions about the carrying values of assets and liabilities that are not readily apparent from other sources. Actual results may differ from these estimates
under different assumptions or conditions, and the impact of such differences may be material to our financial statements.
While
our significant accounting policies are described in more detail in the notes to our audited financial statements included later in this prospectus, we believe that the following critical
accounting policies involve our more significant judgments and estimates used in the preparation of our financial statements:
Foreign Currency Transactions and Translation
Our functional currency and reporting currency is the U.S. dollar. All of the subsidiaries of the Company, with the exception of the subsidiaries in
Germany, Italy and Malaysia, have the U.S. dollar as their functional currency. Management determines the functional currency of Isola Group S.à r.l., the Luxembourg
Holding Company, and each of its operating subsidiaries in accordance with ASC 830 Foreign Currency Matters. The functional currency determination for
operating subsidiaries outside of the U.S. was based upon a number of economic factors, including, but not limited, to cash flows and financing transactions. The functional currency of each of our
operating subsidiaries is based on the primary economic environment in which each subsidiary operates. We determined that our corporate functional currency is the U.S. dollar because the net cash
flows of our Luxembourg Holding Company and our primary financing is primarily denominated in the U.S. dollar.
In the third quarter of fiscal 2012, we changed our international structure to execute a more tax efficient repatriation of funds. As a result we reassessed the primary economic environment of our
U.K. subsidiary and determined that change in its functional currency from the British pound to the U.S. dollar was appropriate.
Gains
and losses arising from transactions denominated in a currency other than the functional currency of the entity involved in the transaction, including unrealized translation gains and losses on
short-term receivables and payables, are included in foreign exchange gains and losses in the consolidated statement of operations in the period in which they occur.
For
our foreign subsidiaries that use a currency other than the U.S. dollar as their functional currency, assets and liabilities are translated at exchange rates in effect at the balance sheet date,
and revenues and expenses are translated at the average exchange rate for the period. The effects of these translation adjustments are reported as foreign currency translation gains and losses in
other comprehensive loss on the consolidated balance sheet.
Certain
of our foreign subsidiaries maintain their books of record in a currency other than their functional currency, the U.S. dollar. Assets and liabilities for these subsidiaries are remeasured to
U.S. dollars at current exchange rates except for nonmonetary items such as inventory and property, plant and equipment which are remeasured to U.S. dollars at historical exchange rates. Foreign
currency remeasurement gains and losses are included in foreign exchange gains and losses in the consolidated statement of operations in the period in which they occur.
100
Table of Contents
Management's Discussion and Analysis of Financial Condition and Results of Operations
Revenue Recognition
We recognize revenue from sales of our products net of estimated returns and allowances, when persuasive evidence of an arrangement exists, including
where the agreement of a fixed price to our customers has been reached and collectability is reasonably assured. For the nine months ended September 29, 2012 and October 1, 2011, and
each of fiscal 2011, 2010 and 2009, returns, rebates and other deductions of the Company's products represented approximately 2% of gross sales and cash discounts represented approximately 1% of gross
sales (cash discounts are primarily offered in Europe). Returns are primarily for defective product. Rebates and other deductions are for rebates and sales allowances that are negotiated with specific
customers. Our estimated returns and allowances have not been materially different than the actual results in our historical financial statements.
Customer
purchase orders are used to determine the existence of an arrangement. Our sales terms do not include rights of return (with the exception of returns for defective product) or subsequent
price discounts. Therefore, we recognize revenue on products sold at the time of shipment or delivery, based on the terms of the agreement. Shipping and handling costs charged to customers are
included in revenue, and the associated shipping and handling costs incurred by us are recorded as cost of goods sold.
Allowance for Doubtful Accounts
We perform ongoing credit evaluations of our customers and adjust credit limits based on each customer's creditworthiness, as determined by our
review of current credit information. We continually monitor collections and payments from our customers and maintain an allowance for doubtful accounts based upon our historical experience, our
anticipation of uncollectible accounts receivable and any specific customer collection issues that we have identified. While our credit losses have historically been insignificant (other than a
$6.7 million loss in fiscal 2008 which was a result of the softening of the economic environment), we may experience higher credit loss rates in the future than we have in the past. Our
receivables are concentrated in relatively few customers. Therefore, a significant change in the liquidity or financial position of any one significant customer
could make collection of our accounts receivable more difficult, require us to increase our allowance for doubtful accounts and negatively affect our working capital.
Inventories
Inventories include the cost of materials, direct labor, and related manufacturing overhead and are stated at the lower of cost (computed using the
first-in, first-out method) or market. We continually assess the recoverability of inventory based on assumptions about demand and market conditions. Inventory carrying value
is reduced for estimated excess inventory and obsolescence. The estimated excess and obsolete inventory reserve is based on the difference between cost and estimated market value, as well as
assumptions regarding future forecasted demand and market conditions. Forecasted demand is determined based on historical sales and expected future sales relative to our inventory levels.
Historically, our reserves have been adequate with respect to write downs for excess or obsolete inventory. The reserve for excess and obsolete inventory was $2.8 million and
$2.9 million as of September 29, 2012 and December 31, 2011, respectively. For fiscal 2010, the reserve for excess and obsolete inventory was $4.6 million and for fiscal
2009 the reserve was $4.3 million.
Long-lived Assets, Goodwill and Intangibles
Long-lived assets including property and equipment, and intangible assets subject to amortization, are assessed for impairment whenever
events and circumstances have occurred indicating that the remaining estimated useful lives may warrant revision or the remaining balance of these assets may not be recoverable. For purposes of
evaluating and measuring impairment, we group long-lived assets with other assets and
101
Table of Contents
Management's Discussion and Analysis of Financial Condition and Results of Operations
liabilities
at the lowest level for which identifiable cash flows are available, which is generally at the site or factory level. In performing the review for recoverability, we estimate the future
undiscounted cash flows expected to result from the use of the assets and their eventual disposition. If an asset is impaired, the amount of the impairment loss would be calculated based on the excess
of the carrying amount of the asset over its estimated fair value. Factors we consider important that could trigger an impairment review include continued operating losses, significant negative
industry trends, significant underutilization of the assets and significant changes in the way we plan to use the assets. The estimation of future cash flows involves numerous assumptions, which
require our judgment, including, but not limited to, future use of the assets for our operations versus sale or disposal of the assets,
future selling prices for our products and future production and sales volumes. We must use our judgment in determining the groups of assets for which impairment tests are separately performed.
Depreciation
and amortization of intangible assets and other long-lived assets is provided using the straight-line method over the assets' respective estimated useful lives,
reflecting the pattern of economic benefits associated with these assets. Changes in circumstances such as technological advances, or changes to our business model could cause the actual useful lives
of long-lived assets and other intangible assets to differ from our initial estimates. If we determine that the useful life of an asset should be revised, we depreciate the remaining net
book value over the new estimated useful life.
In
fiscal 2011, we recorded $1.0 million in asset impairments related to the land and buildings located in Fremont, California and Franklin, New Hampshire. In fiscal 2010, we did not record any
asset impairments, and there were no indications of impairment suggesting a requirement to test the long-lived assets for impairment. In fiscal 2009, we recorded $4.1 million in
asset impairments associated with the closure of our manufacturing facilities located in Fremont, California and Dalian, China. In fiscal 2008, we recorded $3.3 million in asset impairments in
connection with our Fremont facility.
Goodwill,
which represents the excess of the purchase price over the fair value of the net tangible and identifiable intangible assets acquired in a business combination, not subject to amortization,
is evaluated, at a minimum, on an annual basis and whenever events or circumstances have occurred that indicate that the carrying value may not be recoverable. Our testing approach utilizes a
discounted cash flow analysis and comparative market multiples to determine each reporting unit's fair value for comparison to its carrying value. In fiscal 2008, we recorded $8.5 million in
goodwill impairments which reduced our goodwill balance to zero. This impairment was attributable primarily to the reduction in our revenues and profits due to the general decline of the economy.
Litigation and Loss Contingencies
From time to time, we may be involved in claims, lawsuits and other proceedings. Such matters involve uncertainty as to the eventual outcomes and any
gains or losses we may ultimately realize when one or more future events occur or fail to occur. We assess the materiality of potential claims at an individual level and in the aggregate. We record
expenses for litigation and loss contingencies when it is probable that a liability has been incurred and the amount of the loss can be reasonably estimated. We estimate the probability of such losses
based on the advice of internal and external counsel, outcomes from similar litigation, status of the lawsuits (including settlement initiatives), legislative developments and other factors.
Due
to the numerous variables associated with these judgments and assumptions, both the precision and reliability of the resulting estimates of the related loss contingencies are subject to
substantial uncertainties. We regularly monitor our estimated exposure to these contingencies and, as additional information becomes known, may change our estimates accordingly.
102
Table of Contents
Management's Discussion and Analysis of Financial Condition and Results of Operations
Fair Value Measurement
We apply fair value accounting for all financial assets and liabilities that are recognized or disclosed at fair value in the financial statements on
a recurring or nonrecurring basis. Fair value is defined as the amount that would be received from selling an asset, or the amount that would be paid to settle a liability, in an orderly transaction
between willing market participants in the primary, or most advantageous market, for that asset or liability.
We
measure the fair value of certain assets and liabilities based upon the fair value hierarchy established in accordance with ASC 820, Fair Value Measurements and
Disclosures. The fair value hierarchy minimizes the use of unobservable inputs by requiring the use of the most observable inputs available. The established hierarchy is as
follows:
- –>
- Level 1—Valuation
is based upon observable inputs such as unadjusted quoted market prices for identical assets or liabilities in active markets
that we have the ability to assess.
- –>
- Level 2—Valuation
is based upon quoted prices for similar assets or liabilities in active markets; quoted prices for identical or similar assets
or liabilities in inactive markets; or valuations based on models where the significant inputs are observable in the market.
- –>
- Level 3—Valuation
is based on models where significant inputs are not observable. The unobservable inputs reflect our own assumptions about the
inputs that market participants would use.
Financial
instruments include cash, trade receivables, bank lines of credit, short-term bank debt and trade payables. The carrying values of these financial instruments approximate their
fair values either because of the short maturities of these instruments or because the interest rates are based on variable contractual rates. Financial instruments also include long-term debt,
including convertible preferred certificates, and derivative instruments. Our long-term debt and our convertible preferred certificates are recorded at their carrying values. Our most significant
derivative instruments are the embedded derivative liabilities associated with our convertible preferred certificates and current credit agreements. The embedded derivative liabilities are recorded at
fair value.
Historically,
the financial effects of the embedded derivatives associated with our convertible preferred certificates (and, to a lesser extent, in our credit agreements) have been significant. As a
result of our corporate reorganization and the effective conversion of our Sponsors' investment in Isola from convertible preferred certificates to ordinary shares, as well as the refinancing of our
current credit agreements, we will no longer incur financial effects from the change in the fair value of these embedded derivative liabilities.
Convertible preferred certificates and fair value derivative adjustments
The fair value of the embedded derivative liabilities associated with our convertible preferred certificates depends on our total equity value, which
is derived from our TEV. The TEV less the fair value of our debt equals our total equity value, which is then allocated among our Luxembourg Holding Company's common shares, convertible preferred
certificates and embedded derivative liabilities. In the absence of a public trading market, our management exercises significant judgment and considers numerous objective and subjective factors to
determine the estimated TEV of our company at each valuation date. Such factors include but are not limited to:
- –>
- our
operating and financial performance;
- –>
- current
business conditions and projections/forecasts;
- –>
- the
market performance of comparable publicly traded companies;
- –>
- the
U.S. and global capital market conditions;
103
Table of Contents
Management's Discussion and Analysis of Financial Condition and Results of Operations
- –>
- our
stage of development and related discount rate; and
- –>
- any
adjustment necessary to recognize a lack of marketability of our common shares.
The
TEV of the Company from which our total equity value was derived was estimated using both income and market approaches.
Income approach
The income approach estimates our TEV by discounting projected future cash flows to a net present value using a risk-adjusted discount
rate. That risk-adjusted discount rate is our estimated after-tax weighted average cost of capital ("WACC"), which is discussed more fully below.
We
prepared long-term financial forecasts needed for the computation of the TEV under the income approach. These financial forecasts take into account our recent experience, and are based
on future expectations for the industry and, more specifically, management's expectations for the company's revenue, operating income and cash flows. There are inherent uncertainties in these
financial forecasts.
In
estimating our TEV under the income approach, we utilize the long-term expected annual revenue growth rates by operating segment, and from these revenue projections we develop
projections for our earnings and cash flows based on historical relationships between fixed and variable expenses and anticipated working capital and fixed capital requirements. The assumed
long-term expected annual revenue growth rates are based on long-term projections provided by such industry consultants as Prismark and BPA, as well as our management's
assessment of, among other things, our marketing strategies and the anticipated success of new product introductions in expanding market share in certain key product lines and anticipated declines of
certain maturing or declining product lines. These assumed revenue growth rates are inherently subject to uncertainties and cannot be relied upon as a prediction of future results.
The rate used to discount projected cash flows is our WACC, which is the estimated after-tax weighted average cost of the debt and equity that finances our assets. We calculate our WACC by
taking into account the relative weights of each component of our capital structure (debt and equity) using market inputs. For the nine months ended September 29, 2012 and October 1,
2011, fiscal 2011 and fiscal 2010, we used an estimated WACC of 16.8%, 17.2%, 17.4%, and 19.0%, respectively. As noted above, we did not use the income approach in fiscal 2009, so there was no
estimate of our WACC in that year. The reduction in the WACC from 19.0% as of January 1, 2011 to 17.4% as of December 31, 2011, as well as the reduction in the WACC from 17.2% as of
October 1, 2011 to 16.8% as of September 29, 2012, was due to a decrease in the risk-free interest rate and a decrease in the Company's specific risk premium. In addition,
there was a decrease in the market cost of debt during the nine months ended September 29, 2012, which also contributed to a decrease in the WACC.
A
decrease in the WACC used in the net present value calculation would increase the TEV and total equity value (holding the fair value of the debt constant), resulting in an increase in the embedded
derivative liabilities and an embedded derivative loss related to our convertible preferred certificates. Conversely, an increase in the WACC used in the net present value calculation would decrease
the TEV and total equity value (holding the fair value of the debt constant), resulting in a decrease in the embedded derivative liabilities and an embedded derivative gain related to our convertible
preferred certificates.
Market approaches
Under the market approaches, including the market guideline public company approach and the market guideline transaction approach, our TEV is
estimated by comparing our business to similar publicly traded companies or to transactions involving public companies, such as acquisitions or divestitures, for which we
104
Table of Contents
Management's Discussion and Analysis of Financial Condition and Results of Operations
have
data. We selected valuation multiples from publicly traded companies in our industry. We used Rogers Corporation and Park Electrochemical Corp. as the public companies most comparable to us.
In
estimating our TEV using the market guideline public company approach, we use a combination of comparable company metrics, including the last twelve months EBITDA, the last twelve months
revenue and the next twelve months consensus forecasts of revenue provided by Capital IQ, an independent market research company. Valuation multiples derived from the market approaches are then
applied to the equivalent financial metrics of our business, giving consideration to differences between our Company and the comparable public companies for factors such as company size, liquidity,
financial leverage, profitability and growth prospects.
In
estimating our TEV using the market guideline transaction approach, we used multiples for the last twelve months EBITDA and the last twelve months revenue of selected companies that were involved
in market transactions over the three years preceding the valuation date. We focused on transaction multiples that were relevant given changing market dynamics. Adjustments were made to the calculated
metrics of the subject transactions due to a number of factors which include, but are not limited to, business models, margins, financial structure and liquidity. For each fiscal period, we placed no
more than 10% weight on the results of the market guideline transaction approach due to the inherent risks in making the adjustments to the subject transaction metrics with the exception of fiscal
2009. For fiscal 2009, we used a 40% weighting due to the fact that we were precluded from using the income approach because of our inability to prepare a long range forecast in light of the uncertain
economic and industry conditions that prevailed in that year.
The
following table summarizes the key factors used in calculating the enterprise values under the income approach and market approaches:
|
|
|
|
|
|
|
|
|
|
|
|
|
|
|
|
|
|
Nine months ended |
|
|
|
|
|
|
|
|
Fiscal year |
|
|
September 29, 2012
|
|
October 1, 2011
|
|
|
2011
|
|
2010
|
|
2009
|
| |
Income Approach |
|
|
|
|
|
|
|
|
|
|
|
|
|
|
| |
Long-term Expected Annual Growth Rate |
|
|
4.0 |
% |
|
4.0 |
% |
|
4.0 |
% |
|
4.0 |
% |
N/A |
| |
Discount Rate/Weighted Average Cost of Capital |
|
|
16.8 |
% |
|
17.2 |
% |
|
17.4 |
% |
|
19.0 |
% |
N/A |
| |
Average Projected EBITDA Margin |
|
|
18.8 |
% |
|
16.2 |
% |
|
16.9 |
% |
|
16.6 |
% |
N/A |
Market Guideline Public Company Multiples |
|
|
|
|
|
|
|
|
|
|
|
|
|
|
| |
Last Twelve Months EBITDA |
|
|
|
|
|
|
|
|
|
|
|
|
|
|
| |
Last Twelve Months Revenue |
|
|
|
|
|
|
|
|
|
|
|
|
|
|
| |
Next Twelve Months Revenue |
|
|
|
|
|
|
|
|
|
|
|
|
|
|
Market Guideline Transaction Multiples |
|
|
|
|
|
|
|
|
|
|
|
|
|
|
| |
Last Twelve Months EBITDA |
|
|
|
|
|
|
|
|
|
|
|
|
|
|
| |
Last Twelve Months Revenue |
|
|
|
|
|
|
|
|
|
|
|
|
|
|
Our higher market guideline transaction multiple of for the last twelve months EBITDA for fiscal 2009 reflects the higher median transaction
multiples of selected companies that were involved in market transactions in this period.
The
value of the embedded derivative liabilities associated with the convertible preferred certificates is primarily impacted by changes in the total equity value of the Company (TEV less fair value
of our debt), which is derived from the TEV. See below for a reconciliation of TEV. Changes in the assumptions underlying the determination of the total equity value have a disproportional impact on
the value of the embedded derivative liabilities associated with the convertible preferred certificates. This disproportional impact is caused by the non-linear relationship between our
total equity value and the value of the embedded derivative liabilities, which arises because of the use of option pricing models to value the
105
Table of Contents
Management's Discussion and Analysis of Financial Condition and Results of Operations
embedded
derivatives. For example, in fiscal 2010, the TEV was $ million. A one-percent change in the total equity value component of the TEV would have resulted in a
two-percent change in the value of the embedded derivative liabilities associated with the convertible preferred certificates. When the TEV is lower, as in fiscal
2011($ million), a one-percent change in the fair value of the total equity component would have resulted in a three-percent change in the value of the embedded
derivative liabilities associated with the convertible preferred certificates.
Details
of the assumptions and judgments used in the enterprise valuations and the additional factors considered in determining changes in fair values between periods are presented below.
Enterprise valuation assumptions for fiscal 2009
As noted above, we utilized only the market approaches for the fiscal 2009 determination of TEV because we were unable to prepare a
long-range forecast in light of the uncertain economic, industry and company conditions. In determining the weighted average TEV under the market approaches, we weighted the market
guideline public company approach at 60% and the market guideline transaction approach at 40% due to the relative reliability of the market data and the higher likelihood of an IPO compared with an
alternate transaction. The resulting TEV as of December 26, 2009 was $ million.
The above-calculated TEV was reduced by the fair value of our outstanding debt at year-end fiscal 2009 and the total equity value allocated among our Luxembourg Holding Company's common
shares, convertible preferred certificates and embedded derivative liabilities using an option pricing method with the following assumptions: a time to liquidity event of one year, a
risk-free rate of 0.43% and expected volatility of 105.0% over the expected time to a liquidity event. The determined fair value of the embedded derivative liabilities related to the
convertible preferred certificates was $27.5 million as of December 26, 2009 as compared to $0 as of December 27, 2008. The value of the embedded derivative liability was $0 as of
December 27, 2008 due to our lower TEV and total equity value as a result of the global recession which began in 2008.
Enterprise valuation assumptions for fiscal 2010
We used both the income approach and market approaches for the fiscal 2010 determination of TEV. We weighted the income approach at 50%, the market
guideline public company approach at 40% and the market guideline transaction approach at 10% in arriving at a weighted average TEV for fiscal 2010. The market guideline transaction approach received
only a 10% weighting in fiscal 2010 due to the limited number of transactions in that year. The resulting TEV was $ million, an increase of
$ million over the
prior year's TEV as a result of an improved outlook in fiscal 2010. Our fiscal 2010 financial performance reflected a dramatic turnaround from the still-recessionary conditions that prevailed during
most of fiscal 2009. Unit volumes in fiscal 2010 increased 34.0% over the prior year, while revenues in fiscal 2010 increased 44.3% over the prior year. The improvements in volume and revenue were due
to improvements in the fundamental demand for electronic products as well as the increased demand for inventory restocking throughout the electronic supply chain. We also completed our debt
refinancing in fiscal 2010 and were no longer operating in default under our prior first- and second-lien credit facilities. In addition, fiscal 2010 had an added 53rd week in
order to bring the comparable fiscal and calendar periods into closer alignment.
The above-calculated TEV of $ million was reduced by the fair value of our outstanding debt and the resulting total equity value was allocated among the common shares, convertible
preferred certificates and embedded derivative liabilities using an option pricing method with the following assumptions: a time to liquidity event of one year, a risk-free rate of 0.29%
and expected volatility of 80.0% over the expected time to a liquidity event. The determined fair value of the embedded derivative liabilities related to the
106
Table of Contents
Management's Discussion and Analysis of Financial Condition and Results of Operations
convertible preferred certificates was $60.5 million as of January 1, 2011 compared to the $27.5 million fair value at the end of the prior year. The higher TEV resulted in a
higher embedded derivative value. The increase in the embedded derivative value was mitigated by lower volatility in fiscal 2010 compared to fiscal 2009 (80% compared to 105%).
Enterprise valuation assumptions fiscal 2011
We used both the income approach and market approaches to determine TEV for fiscal 2011. We weighted the income approach 50%, the market guideline
public company approach 40% and the market guideline transaction approach 10%. As in the prior year, the market transaction approach only received a 10% weighting in fiscal 2011 due to the limited
number of transactions in that year. The resulting TEV was $ million. Sales momentum, which appeared to be fading late in fiscal 2010, resumed briskly in the first quarter of
fiscal 2011, but the improvement was short-lived, and sales declined sequentially for the following three quarters of fiscal 2011. Contributing to the slackening of demand were the tsunami in Japan
and its aftermath that disrupted worldwide supply chains, turmoil in the Middle East that contributed to significant increases in oil prices, the European debt crisis that disrupted the eurozone, the
unprecedented flooding in Thailand that led to shortages of certain electronic components, and the uncertainties in the U.S. government's fiscal and monetary policies. All of the above factors
contributed to a TEV that was $ million lower as of December 31, 2011.
The above-calculated TEV was reduced by the fair value of our outstanding debt and the resultant total equity value was allocated among our Luxembourg Holding Company's common shares, convertible
preferred certificates and embedded derivative liabilities using an option pricing method with the following assumptions: a time to liquidity event of six months, a risk-free rate of 0.06%
and volatility of 90.0% over the time to a liquidity event. The determined fair value of the embedded derivative value related to the convertible preferred certificates was $18.1 million as of
December 31, 2011 compared to the $60.5 million at the prior year-end.
Our
TEV declined $ million (8.6%) and the fair value of the embedded derivative liabilities declined $42.4 million (net of foreign exchange loss) or 70.1%, from fiscal 2010
to fiscal 2011. The reduction in the fair value of the embedded derivative was due to the combined effects of the lower TEV, higher
debt (and consequent decline in total equity value) and a reduction in the time to liquidity assumption used for the fiscal 2011 valuation. Total equity value decreased from 2010 to 2011, which
accounted for 27.6 percentage points of the 70.1% decline in the fair value of the embedded derivatives. The remaining 42.5 percentage point decline in the fair value of the embedded
derivatives was primarily due to a reduction in the time to liquidity assumption, which went from one year to six months (as the time to complete a sale of the Company or alternate transaction
decreased) and resulted in a lower value for the embedded derivative liabilities. This decrease was compounded by the relative total equity value that was below the conversion threshold
(i.e., out of the money) to a greater degree in fiscal 2011 than in fiscal 2010.
Enterprise valuation assumptions for the nine months ended September 29, 2012
We used both the income approach and market approaches to determine TEV for the nine months ended September 29, 2012. We weighted the income
approach 50%, the market guideline public company approach 40%, and the market guideline transaction approach 10%. As in the prior two years, the market transaction approach only received a 10%
weighting as of September 29, 2012 due to the limited number of transactions during that period. The resulting TEV was $ million. The increase in the TEV reflects the more
optimistic outlook as of September 29, 2012. The improved outlook is primarily due to the expectation that we will sustain improved gross margins due to a greater percentage of revenue
generated from our high-performance products and our continued success in qualifying them for new applications, as well as the anticipated reduction in our required capital expenditures over the next
several years which
107
Table of Contents
Management's Discussion and Analysis of Financial Condition and Results of Operations
increased our projected free cash flows. In addition, the revenue and EBITDA multiples of the comparable companies benchmarked in the market guideline company approach improved resulting in a higher
TEV which, in turn, resulted in a higher embedded derivative liability.
The above-calculated TEV was reduced by the fair value of our outstanding debt and the resultant total equity value was allocated among our Luxembourg Holding Company's common shares, convertible
preferred certificates and embedded derivative liabilities using an option pricing method with the following assumptions: a time to liquidity event of six months, a risk-free rate of 0.14%
and volatility of 75.0% over the time to a liquidity event. The determined fair value of the embedded derivative liability related to the convertible preferred certificates was $73.4 million as
of September 29, 2012 compared to the $18.1 million as of December 31, 2011.
Our TEV increased $ million (30.7%) and the fair value of the embedded derivative liability increased $55.3 million (net of foreign exchange gain) or 305.5%, from
December 31, 2011 to September 29, 2012. The increase in the fair value of the embedded derivative liability was due to the increase in our total equity value, as well as the relative
total equity value that was above the conversion threshold (in
the money) at September 29, 2012 as opposed to being below the conversion threshold (i.e., less out of the money) at December 31, 2011.
Debt and fair value derivative adjustments
We also have embedded derivative liabilities associated with the mandatory prepayment features of our current credit agreements in the event of a
change of control. The embedded derivative gain / (loss) associated with the mandatory prepayment features of our current credit agreements does not depend on the TEV or total equity value of the
company. Instead, it depends on the changes in the assumed probability of a change in control event and the assumed timing of that event. The fair value of the embedded derivative liabilities
associated with our current credit agreements is determined by, first, computing the net present value of the projected future cash flows under these credit agreements assuming they continue to
maturity, and then comparing that net present value to the net present value assuming an estimated probability of a change-in-control event occurring using an estimated
probability of and estimated timing of such an event. The determination of the fair value of the embedded derivative liabilities associated with these credit agreements is most sensitive to changes in
the anticipated timing and probability of a change of control event as well as the discount rates used to compute the present value of these credit agreements.
The initial calculation of the fair value of our debt on October 8, 2010 included an assumption of the implied yield to maturity of the fair value of the debt as of the valuation date. As of
December 31, 2011 and January 1, 2011, we adjusted the initial fair value debt rates as of October 8, 2010 to reflect trends in the general level of interest rates and equity
returns from period to period. Since the debt rates were contractually tied to LIBOR, we used the change in LIBOR as a measure for the change in the level of interest rates for the secured debt.
Adjustments to the interest rate of the mezzanine debt were impacted by changes in our estimated cost of equity.
The fair value of the embedded derivative liabilities related to our current credit agreements was $9.2 million on October 8, 2010. We recorded an embedded derivative loss of
$0.6 million related to these credit agreements for fiscal 2010, as the fair value of the embedded derivative liabilities had increased at year-end fiscal 2010 to
$9.8 million. The increase in the fair value of the embedded derivative liabilities was due to the shorter term to a potential prepayment event, resulting from the passage of approximately
three months since the date of issuance. The value of the embedded derivative liabilities is higher when the time to a potential prepayment event is shorter.
108
Table of Contents
Management's Discussion and Analysis of Financial Condition and Results of Operations
The fair value of the embedded derivative liabilities related to the current credit agreements increased to $10.8 million at the end of fiscal 2011, and we reported the
related embedded derivative loss of $1.0 million. The increase in the fair value of the embedded derivative liabilities was due to the heightened potential for a more immediate prepayment
event, such as a sale of the Company or potential alternate transaction, at the end of fiscal 2011 (six months) compared to fiscal 2010 (one year).
The fair value of the embedded derivative liabilities related to the current credit agreements decreased to $1.3 million as of September 29, 2012, and we reported a related embedded
derivative gain of $9.5 million. The decline in the fair value of the embedded derivative liability associated with the current credit agreements was primarily due to a decrease in the
probability of a change-in-control event from 20% as of December 31, 2011 to 5% as of September 29, 2012.
The
following table summarizes the key assumptions used in determining the fair value of the embedded derivative liabilities associated with the current credit agreements:
|
|
|
|
|
|
|
|
|
|
|
|
|
|
|
|
|
|
|
|
Nine months ended |
|
|
|
|
|
|
|
|
|
September 29,
2012
|
|
October 1,
2011
|
|
Fiscal year
2011
|
|
Fiscal year
2010
|
|
October 8,
2010(1)
|
|
| |
|
Probability of a change in control event |
|
|
5 |
% |
|
20 |
% |
|
20.0 |
% |
|
20.0 |
% |
|
20.0 |
% |
Discount Rate |
|
|
|
|
|
|
|
|
|
|
|
|
|
|
|
|
| |
Mezzanine Credit Agreement |
|
|
22.0 |
% |
|
25.8 |
% |
|
25.7 |
% |
|
25.7 |
% |
|
25.6 |
% |
| |
Senior Secured Credit Agreement |
|
|
8.5 |
% |
|
11.8 |
% |
|
11.7 |
% |
|
11.3 |
% |
|
11.2 |
% |
Estimated date of change in control event occurring |
|
|
March 2013 |
|
|
March 2012 |
|
|
June 2012 |
|
|
December 2011 |
|
|
December 2011 |
|
- (1)
- Senior secured credit agreement and mezzanine credit agreement issuance date.
Stock-based compensation and fair value adjustments
We also record the cost associated with our stock-based compensation awards based on a determination of fair value at the time of such awards. The
fair value of stock-based compensation awards is most sensitive to our determination of the total equity value of the company which is derived from the TEV of the company. The TEV used to determine
the fair value of our stock-based compensation awards is the same TEV used to value the embedded derivatives of our convertible preferred certificates. Valuation methodologies used for stock-based
awards are included in the footnotes to the consolidated financial statements and in "—Stock-based Compensation Expense" below.
109
Table of Contents
Management's Discussion and Analysis of Financial Condition and Results of Operations
Enterprise value reconciliation
The following table provides a reconciliation of the TEVs of the Company at each valuation date presented and the value assigned to each financial
instrument (in millions):
|
|
|
|
|
|
|
|
|
|
|
|
|
|
|
|
|
|
|
|
|
|
December 26,
2009
|
|
October 8,
2010
|
|
January 1,
2011
|
|
October 1,
2011
|
|
December 31,
2011
|
|
September 29,
2012
|
|
| |
|
Total enterprise value (TEV) |
|
$ |
|
|
$ |
|
|
$ |
|
|
$ |
|
|
$ |
|
|
$ |
|
|
Fair value of debt (including debt embedded derivative)(1) |
|
|
|
|
|
|
|
|
|
|
|
|
|
|
|
|
|
|
|
| |
|
|
|
|
|
|
|
|
|
|
|
|
|
Total equity value to allocate |
|
$ |
|
|
$ |
|
|
$ |
|
|
$ |
|
|
$ |
|
|
$ |
|
|
| |
|
|
|
|
|
|
|
|
|
|
|
|
|
Common shares(2) |
|
$ |
|
|
$ |
|
|
$ |
|
|
$ |
|
|
$ |
|
|
$ |
|
|
Convertible preferred certificates |
|
|
|
|
|
|
|
|
|
|
|
|
|
|
|
|
|
|
|
Embedded derivative—CPC |
|
|
|
|
|
|
|
|
|
|
|
|
|
|
|
|
|
|
|
- (1)
- Fair value of debt is calculated based on market interest rates applied to scheduled payments based a probability weighted term to principal repayment.
- (2)
- The fair value allocated to the common shares was de minimis because the value of our common shares is a very small component of our overall capitalization.
The following table summarizes the per share value at each valuation date presented below:
|
|
|
|
|
|
|
|
|
|
|
|
|
|
|
|
|
|
|
|
|
|
|
|
|
|
|
Convertible Preferred
Certificates—Per Share Value |
|
Embedded Derivative
Liabilities—Per Share Value |
|
|
|
Common
Shares
|
|
|
|
Class A
|
|
Class B
|
|
Class C
|
|
Class A
|
|
Class B
|
|
Class C
|
|
| |
|
December 26, 2009 |
|
$ |
65.73 |
|
$ |
66.29 |
|
$ |
0.86 |
|
|
N/A |
(1) |
$ |
65.44 |
|
$ |
— |
|
|
N/A |
(1) |
October 8, 2010 |
|
|
1.62 |
|
|
2.22 |
|
|
1.02 |
|
$ |
2.07 |
|
|
1.20 |
|
|
— |
|
$ |
1.30 |
|
January 1, 2011 |
|
|
1.81 |
|
|
2.50 |
|
|
1.25 |
|
|
2.33 |
|
|
1.25 |
|
|
— |
|
|
1.38 |
|
April 2, 2011 |
|
|
1.90 |
|
|
2.70 |
|
|
1.53 |
|
|
2.49 |
|
|
1.17 |
|
|
— |
|
|
1.34 |
|
October 1, 2011 |
|
|
1.21 |
|
|
2.10 |
|
|
1.49 |
|
|
1.86 |
|
|
0.61 |
|
|
— |
|
|
0.76 |
|
December 31, 2011 |
|
|
0.64 |
|
|
1.45 |
|
|
1.11 |
|
|
1.24 |
|
|
0.34 |
|
|
— |
|
|
0.41 |
|
September 29, 2012 |
|
|
2.39 |
|
|
3.12 |
|
|
1.67 |
|
|
2.92 |
|
|
1.45 |
|
|
— |
|
|
1.67 |
|
- (1)
- The Class C convertible preferred certificates were not outstanding as of December 26, 2009.
Our Luxembourg Holding Company had 500 common shares, 420,455 shares of Class A convertible preferred certificates and 95,788,400 shares of
Class B convertible preferred certificates outstanding at each valuation date between December 26, 2009 and September 29, 2012. The Class C convertible preferred
certificates were issued with the September 2010 financing transaction and there were 43,500,666 shares of Class C convertible preferred certificates outstanding at each valuation date
between October 8, 2010 and September 29, 2012.
The
issuance of 43,500,666 shares of Class C convertible preferred certificates in the fourth quarter of fiscal 2010 caused a steep decline in the value of the common shares on and after
October 8, 2010. The dilution of the common shares is caused by two factors: (1) the conversion price of the Class C convertible preferred certificates is lower than the
conversion price of the Class A convertible preferred certificates and (2) the Class C convertible preferred certificates have a liquidation preference that increases the
threshold before the Class A convertible preferred certificates and the common shares receive the majority of their returns.
110
Table of Contents
Management's Discussion and Analysis of Financial Condition and Results of Operations
As of December 26, 2009, the entire equity value above the $187.2 million aggregate liquidation preference of the Class A and Class B convertible preferred certificates was
allocated to the common shares and the Class A convertible preferred certificates. Because there are very few Class A convertible preferred certificate shares (420,455) and even fewer
common shares (500) outstanding as of that date, the per share value allocated to the common shares as of December 26, 2009 was higher than for the periods after the issuance of the
Class C convertible preferred certificates.
Subsequent to the issuance of the Class C convertible preferred certificates, the liquidation preference of the Class C convertible preferred certificates, as well as the Class A and
Class B convertible preferred certificates ($258.0 million in the aggregate at September 29, 2012) would need to be paid before the common shares would receive any value in an
exit transaction. Accordingly, at valuation dates on and after October 8, 2010, the value attributed to the common shares was substantially reduced when considering exit scenarios where the
liquidation preferences apply and where the Class A or Class C convertible preferred certificates were assumed to convert.
Income Taxes
We are subject to income taxes in the United States and in foreign jurisdictions, and we use estimates in determining our provision for income taxes.
We account for taxes under the asset and liability method. Under this method, deferred tax assets and liabilities are determined based on the differences between financial reporting and
tax-basis reporting of assets and liabilities that are measured using the enacted tax rates and laws that are expected to be in effect when differences are expected to reverse. We are
required to adjust our deferred tax assets and liabilities in the period in which tax rates change or new relevant provisions of the income tax laws are enacted.
The
Company's effective tax rate may vary significantly from year to year as it is heavily influenced not only by the mix of taxable income across the various jurisdictions in which we operate, but
also by the tax impact of two significant transactions, which have no impact on operating income: (i) non-cash foreign exchange gains or losses in Luxembourg and
(ii) non-cash gains or losses on the embedded derivatives associated with the convertible preferred certificates and our current senior secured and mezzanine credit agreements. No
income tax expense or benefit is recognized related to these non-cash transactions due to valuation allowances in the U.S. and Luxembourg, which may result in substantial variations in our
consolidated effective tax rate. Following this offering and our reorganization to a Cayman Islands holding company structure, as well as the refinancing of our current senior secured and mezzanine
credit agreements and conversion of our convertible preferred certificates in conjunction with these events, we will no longer be exposed to the effects of the non-cash gains or losses
described in (i) and (ii) above and, as a result, we expect to incur less fluctuation in our consolidated effective tax rate. Our effective tax rate may also be affected by the accrual
of uncertain tax positions.
For
fiscal 2011, our tax expense was $10.9 million on pre-tax income of $20.9 million, for an effective tax rate of 52.2%. Our 2011 tax expense was comprised of taxes
incurred by overseas operating subsidiaries, primarily in China and Taiwan, and an accrual for uncertain tax positions. Our fiscal 2011 effective tax rate differed from our Luxembourg statutory rate
of 28.8% primarily as a result of: (i) differences in the statutory rates applied to our subsidiaries which resulted in a decrease of 23.2%; (ii) net increases in uncertain tax positions
(increases net of reductions for settlements) which resulted in an increase of 57.8%; and (iii) a reduction in valuation allowances related to continuing operations recognized primarily in
Luxembourg which resulted in a decrease of 9.3%.
For
fiscal 2010, our tax expense was $27.2 million on pre-tax income of $28.4 million, for an effective tax rate of 95.7%. Our 2010 tax expense was comprised of taxes
incurred by overseas operating subsidiaries, primarily in China and Taiwan, and an additional accrual related to a change in estimate of prior years'
111
Table of Contents
Management's Discussion and Analysis of Financial Condition and Results of Operations
uncertain
tax positions. Our fiscal 2010 effective rate differed from our Luxembourg statutory rate of 28.6% primarily as a result of: (i) an additional accrual for uncertain tax positions
associated with a change in our estimates of prior years' positions as a result of ongoing tax examinations which resulted in an increase of 64.6%, partially offset by associated decreases in
valuation allowances of 57.8% primarily in the US and Luxembourg; and (ii) uncertain tax positions taken in the current year which resulted in an increase of 55.2%.
For
fiscal 2009, our tax expense was $7.3 million on a pre-tax loss of $93.4 million for an effective tax rate of (7.9)%. Our fiscal 2009 tax expense was primarily for taxes
incurred by operating subsidiaries in China and Taiwan. Our fiscal 2009 effective tax rate differed from our Luxembourg statutory rate of 28.6% primarily as a result of valuation allowances recognized
in the U.S., Luxembourg and Italy which resulted in a decrease of 37.7%.
We
recorded a valuation allowance of $107.4 million at December 31, 2011 to reduce our deferred tax assets to the amount we believe is more likely than not to be realized. We have
recorded valuation allowances on deferred tax assets in a number of tax jurisdictions, the most significant of which are the U.S., Luxembourg and Italy. The most significant tax jurisdictions with
deferred tax assets and no valuation allowances are China and Taiwan. If our assumptions change and we determine we will more likely than not be able to realize those deferred tax assets, the tax
benefits related to any reversal of the valuation allowance will be accounted for in the period in which we make such determination. Likewise, should we determine that we would be able to realize our
deferred tax assets in the future in excess of our recorded amount, an adjustment to the deferred tax assets would increase income in the period such determination was made.
The
following deferred tax assets, net of deferred tax liabilities were offset with valuation allowances (in millions):
|
|
|
|
|
|
|
|
|
|
|
|
|
Fiscal Year |
|
Jurisdiction
|
|
2011
|
|
2010
|
|
2009
|
|
| |
|
Luxembourg |
|
$ |
82.2 |
|
$ |
84.7 |
|
$ |
79.7 |
|
U.S. |
|
|
22.4 |
|
|
18.0 |
|
|
42.9 |
|
Italy |
|
|
2.8 |
|
|
2.2 |
|
|
2.0 |
|
The following deferred tax assets, net of deferred tax liabilities were recognized (in millions):
|
|
|
|
|
|
|
|
|
|
|
|
|
Fiscal Year |
|
Jurisdiction
|
|
2011
|
|
2010
|
|
2009
|
|
| |
|
China |
|
$ |
6.4 |
|
$ |
6.7 |
|
$ |
6.8 |
|
Taiwan |
|
|
2.1 |
|
|
2.7 |
|
|
3.4 |
|
Taxable income was incurred in the following significant jurisdictions during fiscal year 2011 (in millions):
|
|
|
|
|
Jurisdiction
|
|
Fiscal Year
2011
|
|
| |
|
China |
|
$ |
21.1 |
|
Taiwan |
|
|
32.3 |
|
Luxembourg |
|
|
(28.3 |
) |
United States |
|
|
(0.3 |
) |
Italy |
|
|
(2.1 |
) |
Taxable losses were incurred in the U.S., Luxembourg, and Italy during fiscal 2011.
112
Table of Contents
Management's Discussion and Analysis of Financial Condition and Results of Operations
Our
gross unrecognized tax benefits totaled $51.6 million for fiscal 2011 and $51.3 million for fiscal 2010. Of the total unrecognized tax benefits for fiscal 2011 and 2010, after
consideration of the valuation allowances recorded against deferred tax assets, $14.3 million and $26.8 million, respectively, would have a favorable impact on our effective tax rate.
The increase in the unrecognized tax benefits during fiscal 2010 relates to positions taken in the current period and a change in judgment related to positions taken in previous periods. For fiscal
2011, the unrecognized tax benefits decreased by $23.5 million related to settlements with taxing authorities and increased by $25.3 million related to positions taken in the current
period. We estimate that the possible future loss if uncertain tax positions are not settled favorably ranges from $15.3 million to $18.6 million. The impact on our cash position if
positions were resolved unfavorably ranges from $11.9 million to $15.2 million.
We
recognize the benefit of an income tax position only if it is more likely than not that the tax position will be sustained upon tax examination, based solely on the technical merits. The
recognition and measurement of tax benefits requires significant judgment that might change as new information becomes available. If our financial results or other relevant facts change, thereby
impacting the likelihood of realizing the tax benefit of an uncertain tax position, significant judgment would be applied in determining the effect of the change on our valuation allowance of the tax
position as of the
reporting date. Otherwise, no benefit can be recognized. The tax benefits recognized are measured based on the largest benefit that has a greater than 50% likelihood of being realized upon ultimate
settlement. We classify the liability for unrecognized tax benefits as current to the extent that we anticipate payment of cash within one year. Additionally, we accrue interest and penalties, if
applicable, on all tax exposures for which reserves have been established consistent with jurisdictional tax laws. Interest and penalties are classified as income tax expense in the financial
statements.
Significant
judgment is required in evaluating our uncertain tax positions and determining our provision for income taxes. Although we believe that our reserves are reasonable, no assurance can be
given that the final tax outcome of these matters will not be different from that which is reflected in our income tax provision and accruals. We adjust these reserves in light of changing facts and
circumstances, such as the closing of a tax audit or the refinement of an estimate. To the extent that the final tax outcome of these matters is different than the amounts recorded, such differences
will affect the provision for income taxes in the period in which such determination is made.
Pension and Other Post-retirement Benefits
We sponsor several pension plans for certain salaried and hourly employees, and bargaining unit pension plans covering retirees and vested former
employees of the Company. Accounting for pensions and other post-retirement benefits involves estimating the cost of future benefits and attributing the cost over the employees' expected
periods of employment with the Company. The determination of our obligation and expense for these costs requires certain assumptions (see Note 7 to the consolidated annual financial statements). These
assumptions include, among others, the discount rate, expected long-term rate of return on plan assets and health care cost trend rates, all of which are subject to change. While we
believe that the assumptions used are appropriate, significant differences in results or significant changes in our assumptions may materially affect the pension and other post-retirement
obligations and related future expense.
Changes
in key assumptions for our pension and other post-retirement benefits plans would have the following effects for the year ended December 31, 2011:
Discount Rate—Holding all other assumptions constant, a one percentage point increase or decrease in the discount rate assumption for fiscal 2011 would have decreased or increased net
periodic benefit cost in fiscal 2011 by approximately $0.9 million with no impact on post-retirement benefits. In addition, a one
113
Table of Contents
Management's Discussion and Analysis of Financial Condition and Results of Operations
percentage point increase in the discount rate would decrease the pension and other post-retirement benefits obligation recorded as of December 31, 2011 by approximately
$15.3 million, of which $0.1 million relates to post-retirement benefits, and a one percentage point decrease would increase the pension and other post-retirement
benefits obligations recorded as of December 31, 2011 by approximately $18.8 million, of which $0.1 million relates to post-retirement benefits.
Expected
Long-Term Rate of Return—A one percentage point increase or decrease in the expected long-term rate of return assumption for fiscal 2011, holding all other
assumptions constant, would increase or decrease our net periodic benefit cost for the year ended December 31, 2011 by approximately $0.6 million, with no impact on
post-retirement benefits.
Health Care Cost Trend Rates—A one percentage point increase or decrease in the initial assumed health care trend rate through ultimate assumed health care trend rates would have an
immaterial effect on the accumulated post-retirement benefit obligation as of December 31, 2011.
Stock-based Compensation Expense
Awards granted
Certain of our employees and directors have been granted awards to purchase limited partner common units in the Sponsor Limited Partnership
("partnership units"). These awards include options to purchase partnership units ("options") and restricted partnership units ("restricted units").
The
exercise prices of the options granted were established by the non-executive directors of the Sponsor Holding Company's board of managers who have historically functioned as the
Company's compensation committee.
Award valuation and recognition of compensation expense
The fair values of all option and restricted unit awards, which we refer to as stock-based payment awards, are determined as of their grant date. We
estimate the fair value of each option award using the Black-Scholes option pricing model. This model requires the use of the following assumptions: (i) expected volatility, which is based on a
peer group of publicly traded entities over a period consistent with the expected terms of the options; (ii) expected life of the option award, which is determined based on management's best
estimate of when vested awards are expected to be exercised; (iii) expected dividend yield, which is 0%, as we do not anticipate paying dividends in the foreseeable future; (iv) the
risk-free interest rate, which is based on the U.S. Treasury yield curve in effect at the time of grant consistent with the option's expected life; and (v) the fair value of the
partnership units, which is based on the determination of our enterprise value. If any of the assumptions used in the Black-Scholes model changes significantly, stock-based compensation for future
awards may differ materially from previously granted awards.
The
weighted average assumptions used in the Black-Scholes model for fiscal 2010 and fiscal 2011 are as follows:
|
|
|
|
|
|
|
|
|
|
Fiscal 2010
|
|
Fiscal 2011
|
|
| |
|
Expected volatility |
|
|
65.0 |
% |
|
80.0 |
% |
Risk-free interest rate |
|
|
1.4 |
% |
|
2.4 |
% |
Forfeiture rate |
|
|
5.0 |
% |
|
5.0 |
% |
Expected term (in years) |
|
|
6.0 |
|
|
6.0 |
|
Dividend yield |
|
|
0.0 |
% |
|
0.0 |
% |
No options were granted during fiscal 2009 or during the nine months ended September 29, 2012.
114
Table of Contents
Management's Discussion and Analysis of Financial Condition and Results of Operations
The
grant date fair value of stock-based payment awards is recognized as compensation expense using the straight line method, net of estimated forfeitures, over the vesting period. Option and
restricted unit awards vest ratably over a two- to five-year period beginning with the first anniversary of the grant date. We estimate forfeitures based on our historical
forfeiture of stock-based payment awards adjusted to reflect future changes in facts and circumstances, if any. We will revise our estimated forfeiture rate if actual forfeitures differ from our
initial estimates.
Exchange event
On October 8, 2010, certain employees and directors holding options (vested or unvested at that date) were given an offer to either retain
their existing options with the originally issued terms or surrender their options for $0.53 in cash for each vested option payable immediately as well as $0.53 in cash for each unvested option
payable upon completion of that unvested option's original service-based vesting condition.
Also
on October 8, 2010, the remaining employees and directors holding options (vested or unvested at that date) were given an offer to surrender all of their existing options (vested or
unvested at that date) in exchange for a combination of new options and new restricted units. As of October 8, 2010, 4,562,000 options were outstanding and the holders thereof elected the
following:
|
|
|
|
|
Action taken
|
|
Options
|
|
| |
|
Vested options surrendered for cash |
|
|
565,000 |
|
Unvested options surrendered for cash upon vesting |
|
|
331,000 |
|
Options exchanged for new options and restricted units |
|
|
3,630,000 |
|
Original options retained |
|
|
36,000 |
|
| |
|
|
|
Total |
|
|
4,562,000 |
|
| |
|
|
|
As a result, employees received $299,450 in cash for vested options surrendered and were entitled to $175,430 in cash for unvested options to be paid as those
options vest under their original terms. The consideration given for the vested options surrendered was in excess of the surrender date fair value by $175,610, and this amount was recognized as
compensation expense in fiscal 2010. As future service is required for payment of the options unvested as of October 8, 2010, we determined that the transaction was a modification under
ASC 718 that changes the award classification from equity to liability. Incremental compensation cost for these modified awards, measured as the excess of their fair value over the fair value
of the original awards immediately before the terms were modified, was not material.
A
total of 13,460,500 new options and 3,337,500 new restricted units were issued in connection with the exchanges. We determined the issuance of new options and new restricted units was a modification
under ASC 718 for substantially all of the exchanged options. Accordingly, we measured the incremental fair value of consideration given for these modified awards over that of the options
tendered and determined there to be $6.8 million of additional value. This additional stock-based compensation, as well as $1.6 million of unrecognized stock-based compensation related
to the options tendered in the modification, will be recognized over the vesting period of the new options and new restricted units using the straight-line method.
115
Table of Contents
Management's Discussion and Analysis of Financial Condition and Results of Operations
Options granted
During fiscal 2010 and fiscal 2011 we granted options with exercise prices as follows:
|
|
|
|
|
|
|
|
|
|
|
|
|
|
Grant date
|
|
Options granted
|
|
Exercise price
per option
|
|
Partnership unit
fair value
|
|
Option grant date
fair value
per option
|
|
| |
|
October 8, 2010 |
|
|
13,460,500 |
|
$ |
0.49 |
|
$ |
0.63 |
|
$ |
0.41 |
|
January 22, 2011 |
|
|
96,100 |
|
$ |
0.49 |
|
$ |
0.83 |
|
$ |
0.64 |
|
Restricted units granted
During fiscal 2010 and fiscal 2011, we granted restricted units as follows:
|
|
|
|
|
|
|
|
|
|
|
Grant date
|
|
Restricted units
granted
|
|
Partnership unit
fair value
|
|
Restricted unit
grant date fair
value per unit
|
|
| |
|
October 8, 2010 |
|
|
3,337,500 |
|
$ |
0.63 |
|
$ |
0.63 |
|
January 22, 2011 |
|
|
54,700 |
|
$ |
0.83 |
|
$ |
0.83 |
|
Stock-based compensation recognized
We recorded stock-based compensation expense of $1.9 million for the nine months ended September 29, 2012, and $2.7 million,
$2.2 million, and $1.8 million for fiscal 2011, 2010 and 2009, respectively.
Based
upon the assumed initial public offering price of $ per share, the aggregate intrinsic value of the 12,296,500 options outstanding as of December 31, 2011 was
$ million, of which $ million related to vested options and
$ million related to unvested options. Based upon the same assumed initial
public offering price, the aggregate intrinsic value of the 2,790,625 restricted units outstanding as of December 31, 2011 was $ million, of which
$ million related to vested restricted units and $ million related to unvested
restricted units.
Approach to valuation of partnership units
In conducting the valuation of the partnership units, we used a methodology that is consistent with the methods outlined in the AICPA Practice Aid Valuation of Privately-Held-Company Equity Securities Issued as
Compensation. These valuations were prepared
contemporaneously with the grant of stock-based payment awards. In preparing the fiscal 2010 consolidated financial statements, we determined the contemporaneous valuations did not appropriately
consider the rights and preferences of the Company's and the Sponsor Limited Partnership's share and partner unit classes, respectively. Accordingly, during fiscal 2011, we performed retrospective
valuations to estimate the fair value of the partnership units underlying the stock-based payment awards at each significant historical stock-based payment award date. The revised fair values were
utilized to prepare our financial statements for all periods affected.
The
enterprise value inputs associated with our valuations on the grant dates were derived using the income and market approaches. The fair value of our debt was then subtracted from the calculated
enterprise value. The resulting total equity value was then allocated among the instruments that comprise our capital structure based upon rights and preferences of the instruments using the
option-pricing method. As all of the allocated value associated with these instruments would be available to the Sponsor Limited Partnership, the option-pricing method was used to allocate the total
equity value of the Company among the varying partner interests of the Sponsor Limited Partnership, including the partnership units underlying our
116
Table of Contents
Management's Discussion and Analysis of Financial Condition and Results of Operations
stock-based
payment awards. The allocation was based on a series of call options using the Black-Scholes option-pricing model.
The
option-pricing method involves making estimates of the anticipated timing of a potential liquidity event and estimates of the volatility of the partnership units. The anticipated timing is based
on the plans of our board and management. Estimating the volatility of the share price of a privately held company is complex because there is no readily available market for the shares. We estimated
the volatility of the partnership units based on available information on volatility of stocks of publicly traded companies in the industry. Had we used different estimates of volatility, the
resulting value of the partnership units would have been different.
A
discussion of significant factors and assumptions in determining the estimated fair value of our stock-based payment awards granted between December 27, 2008 and December 31, 2011 is
provided below.
Valuation of partnership units as of October 8, 2010
We used both the income and market approaches to calculate the enterprise value as of October 8, 2010. We weighted the income approach 50%,
the market guideline public company approach 40% and the market guideline transaction approach 10%. The market guideline transaction approach received only a 10% weighting due to the limited number of
transactions in fiscal 2010. The resulting enterprise value was $ million. The calculated enterprise value was reduced by 28%, reflecting a discount for the lack of a market in
which to trade our securities. We subtracted our outstanding debt from the calculated enterprise value and allocated the total value to our equity instruments. This resulted in a fair value of a
partnership unit of the Sponsor Limited Partnership of $0.63 per unit.
As of October 8, 2010, the discount for lack of marketability used to value the partnership units was calculated using an estimated cost of purchasing a protective put option ("put option") as
there is no active market for their purchase or sale. In calculating the put option, we estimated a time to liquidity of 1.25 years from the valuation date, the risk free rate was 0.21% (yield
on constant-maturity Treasury securities as of the valuation date) and the volatility of the selected companies was 90%. The put option calculation resulted in an estimated discount for lack of
marketability of 28%.
The
above-calculated enterprise value as of October 8, 2010 reflected an increase compared to prior periods due to improvements in our historical financial results and a more optimistic outlook
for improved financial performance. Volatility and cost of capital inputs were similar to prior periods. Stock prices and the financial performance of the reference guideline companies continued to be
relatively low, resulting in lower market valuation multiples, but these lower multiples were offset by our improving performance and outlook compared to prior periods.
The
TEV increased compared to the prior period (fiscal 2009), while the fair value of a partnership unit of the Sponsor Limited Partnership decreased. Even though total debt increased from
December 26, 2009 to October 8, 2010, the per unit value declined, primarily due to the issuance of additional partnership units in conjunction with the financing transaction that took
place in September 2010 (see Note 5 of the annual financial statements). The total economic interests at the partnership unit level increased over 2.5 times, which diluted the per unit value.
Valuation of partnership units as of January 22, 2011
On January 22, 2011, we granted stock options and restricted units to certain key employees. The fair value of a partnership unit as of that
date was determined to be $0.83 per unit and was based upon retrospective valuations performed as of January 1, 2011 and April 2, 2011. The calculated TEV as of January 1, 2011
was $ million and as of April 2, 2011 was $ million, and the fair value of a partnership unit as of
117
Table of Contents
Management's Discussion and Analysis of Financial Condition and Results of Operations
each date was $0.77 and $1.00. The financial statement impact of these stock-based awards was not material to our financial statements, so a separate valuation was not performed. Increases in the
reference guideline public company price multiples compared to October 8, 2010 along with improvements in our projected operating financial performance resulted in an increase in the valuation
of the partnership units.
The
judgments made in determining the volatility and risk-free rate assumptions to be used in calculating the estimated grant date fair value of the stock option awards are consistent with
the judgments made in determining such inputs for the valuation of the partnership units.
As of January 1, 2011, the discount for lack of marketability used to value the partnership units was calculated using an estimated cost of purchasing a put option as there is no active market
for their purchase or sale. In calculating the put option, we estimated a time to liquidity of 1.0 year from the valuation date, the risk free rate was 0.29% (yield on constant-maturity
Treasury securities as of the valuation date) and the volatility of the selected companies was 80%. The put option calculation resulted in an estimated discount for lack of marketability of 25%.
To value the partnership units as of April 2, 2011, we applied a discount for lack of marketability which was calculated using an estimated cost of purchasing a put option as there is no active
market for their purchase or sale. In calculating the put option, we estimated a time to liquidity of 0.75 years from the valuation date, the risk free rate was 0.24% (yield on
constant-maturity Treasury securities as of the valuation date) and the volatility of the selected companies was 70%. The put option calculation resulted in an estimated discount for lack of
marketability of 15%.
The
following table summarizes the significant assumptions used in calculating the enterprise value on each of the grant dates:
|
|
|
|
|
|
|
|
|
|
|
|
|
|
October 8,
2010
|
|
January 1,
2011
|
|
April 2,
2011
|
|
| |
|
Income Approach |
|
|
|
|
|
|
|
|
|
|
| |
Long-term Expected Annual Growth |
|
|
4 |
% |
|
4 |
% |
|
4 |
% |
| |
Discount Rate/Weighted Average Cost of Capital |
|
|
19.1 |
% |
|
19.0 |
% |
|
18.6 |
% |
| |
Average Projected EBITDA Margin |
|
|
16.6 |
% |
|
16.6 |
% |
|
16.6 |
% |
Market Guideline Public Company Multiples |
|
|
|
|
|
|
|
|
|
|
| |
Last Twelve Months EBITDA |
|
|
|
|
|
|
|
|
|
|
| |
Last Twelve Months Revenue |
|
|
|
|
|
|
|
|
|
|
Market Guideline Transaction Multiples |
|
|
|
|
|
|
|
|
|
|
| |
Last Twelve Months EBITDA |
|
|
|
|
|
|
|
|
|
|
| |
Last Twelve Months Revenue |
|
|
|
|
|
|
|
|
|
|
Lack of Marketability Discount(1) |
|
|
28 |
% |
|
25 |
% |
|
15 |
% |
Weighting of Outcomes of Valuation Methods |
|
|
|
|
|
|
|
|
|
|
| |
Income Approach |
|
|
50 |
% |
|
50 |
% |
|
50 |
% |
| |
Market Approach—Guideline Companies |
|
|
40 |
% |
|
40 |
% |
|
40 |
% |
| |
Market Approach—Guideline Transactions |
|
|
10 |
% |
|
10 |
% |
|
10 |
% |
- (1)
- The lack of marketability discount was calculated using a put option calculation in which the cost of purchasing a put option to protect against downward price changes is used as a
proxy for the value of marketability. When the cost of the put option is divided by the asset price, the result is a percentage, which can then be used as an estimate for the discount for lack of
marketability. The lack of marketability discount was applied to the per share value of the partnership units on a liquid basis to reach a per share value of our partnership units for which there is
no active market for their purchase or sale.
118
Table of Contents
Management's Discussion and Analysis of Financial Condition and Results of Operations
JOBS ACT
On April 5, 2012, the JOBS Act was signed into law. The JOBS Act contains provisions that, among other things, relax certain reporting
requirements for qualifying public companies. We will qualify as an "emerging growth company" under the JOBS Act and will be allowed to comply with new or revised accounting pronouncements based on
the effective date for private (not publicly traded) companies. We are electing to delay the adoption of new or revised accounting standards, and as a result, we may not comply with new or revised
accounting standards on the relevant dates on which adoption of such standards is required for non-emerging growth companies. Since we will not be required to comply with new or revised
accounting standards on the relevant dates on which adoption of such standards is required for other public companies, our financial statements may not be comparable to the financial statements of
companies that comply with public company effective dates.
RECENT ACCOUNTING PRONOUNCEMENTS
Changes to U.S. GAAP are established by the FASB in the form of accounting standards updates ("ASUs") to the Financial Accounting Standards
Board's Accounting Standards Codification.
Management
considers the applicability and impact of all ASUs. ASUs not listed below were assessed and were either determined to be not applicable or are expected to have minimal impact on our
consolidated financial position and results of operations.
In
May 2011, the FASB issued an amendment to the existing guidance on fair value measurements. The new guidance provides a consistent definition of the fair value measurement and ensures disclosure
requirements are similar between U.S. GAAP and International Financial Reporting Standards. The amendments to the guidance change certain fair value measurement principles and enhance
disclosure requirements, particularly for Level 3 fair value measurements. This amendment must be applied prospectively. The Company adopted this amendment effective January 1, 2012. The
adoption of this amendment did not have an impact on our consolidated financial positions or results of operations.
In
June 2011, the FASB issued an amendment to the existing guidance on the presentation of comprehensive income. Under the amended guidance, entities have the option to present the components of net
income and other comprehensive income in either a single continuous statement of comprehensive income or in two separate but consecutive statements. Entities no longer have the option of presenting
the components of other comprehensive income within the statement of changes in stockholders' equity. The presentation of reclassification adjustments under this amendment has been deferred. The
adoption of this amendment resulted in a change in the current presentation of comprehensive income so that the components of net income and other comprehensive income are presented in two separate
consecutive statements. The Company retrospectively adopted this amendment effective December 28, 2008. The adoption of this amendment did not have an impact on our consolidated financial
position or results of operations. See the consolidated statement of comprehensive income.
119
Table of Contents
Business
OUR COMPANY
Isola is a leading global material sciences company that designs, develops and manufactures copper-clad laminate, or CCL, and prepreg
(collectively, "laminate materials") used to fabricate advanced multilayer printed circuit boards, or PCBs. PCBs provide the physical platform for the semiconductors, passive components and connection
circuitry that power and control virtually all modern electronics. We focus on the market for high-performance laminate materials, developing proprietary resins that are critical to the
performance of PCBs used in advanced electronic applications. We continually invest in research and development and believe that our industry-leading resin formulations, many of which are patented,
provide us with a competitive advantage. With 11 manufacturing facilities and three research centers worldwide, as well as a global sales force, we are the largest supplier of laminate materials to
PCB fabricators in the United States and Europe, and we are one of the larger suppliers in our addressable Asian market, based on revenue for fiscal year 2011.
Our
high-performance PCB laminate materials are used in a variety of advanced electronics, including network and communications equipment and high-end consumer electronics, as
well as advanced automotive, aerospace, military and medical applications. Demand in these markets is driven by the rapid growth of bandwidth-intensive high-speed data transmission, the
expansion of the Internet, the emergence of cloud computing and the evolution of increasingly complex communications technology. This has led to an urgent need for the development of the underlying
infrastructure to support this growth, including faster and more efficient
semiconductor technology. In addition, increasingly pervasive environmental regulations are driving a need for lead-free compatible, high-performance laminate materials.
We
sell our products globally to leading PCB fabricators, including Ruwel, Sanmina, TTM Technologies, Viasystems and WUS Printed Circuit. These fabricators produce PCBs incorporating our laminate
materials for electronic equipment designed or produced by a broad group of major original equipment manufacturers, or OEMs, including Alcatel-Lucent, Brocade, Cisco, Dell, Ericsson, Google,
Hewlett-Packard, Huawei, IBM and Sun Microsystems (now Oracle). We work closely with these leading PCB fabricators and major OEMs to ensure that our high-performance laminate
materials, which incorporate our proprietary resins, meet the thermal, electrical and physical performance criteria of each new generation of electronic equipment.
We
were acquired in 2004 by a group of investors led by TPG, a global private equity firm, and Redfern Partners, a strategic partner and an investor in the laminate materials industry. Under the
direction of TPG and our management, we have undertaken a number of operational changes designed to increase manufacturing efficiencies and improve business processes. We believe that these measures,
together with our focus on higher margin high-performance products, provide us with the operating leverage to take advantage of improving economic conditions.
Our
history dates back 100 years to the founding of Isola Werke AG in Germany in 1912. Isola Werke AG manufactured insulators utilizing the then-revolutionary Bakelite plastic
technology, which provided superior insulating and heat resistance properties. We began production of copper-clad epoxy laminates, the direct predecessors of today's
high-performance PCB laminate products, in the 1960s. In 2006, we acquired the assets of Polyclad Laminates, Inc., which extended our product portfolio and expanded our business in
the growing Asian markets.
For the nine months ended September 29, 2012, our revenue was $437.8 million, our net loss was $64.5 million, and our Adjusted EBITDA was $78.4 million, as compared to
revenue of $459.4 million, net income of $7.1 million, and Adjusted EBITDA of $68.6 million for the nine months ended October 1, 2011. For fiscal 2011, our revenue
was $597.0 million, our net income was $10.0 million, and our Adjusted
120
Table of Contents
Business
EBITDA was $86.2 million, as compared to revenue of $612.0 million, net income of $1.2 million, and Adjusted EBITDA of $92.4 million in fiscal 2010. In fiscal 2009, our revenue
was $424.2 million, our net loss was $100.7 million, and our Adjusted EBITDA was $31.6 million. For a discussion of our primary non-GAAP metric, Adjusted EBITDA,
including reconciliation to net income, see our discussion of non-GAAP financial measures in "Selected Historical Consolidated Financial and Other Data", included elsewhere in this
prospectus.
INDUSTRY OVERVIEW AND MARKET OPPORTUNITY
High-performance laminate materials are used in a variety of advanced electronics, including network and communications equipment,
high-end consumer electronics, as well as advanced automotive, aerospace, military and medical applications. The increasingly complex performance and environmental requirements of advanced
electronics are driving greater demand for higher performance PCBs, which require laminate materials with resins specifically formulated to satisfy demanding performance criteria.
According
to a report prepared by Prismark, the total market for laminate materials, excluding the internal Japanese market, was $9.1 billion in 2011, and our addressable market for PCB
laminate materials was $4.8 billion in 2011, as illustrated in the following chart. Prismark prepared this analysis at our request, and we paid a customary fee for its services.
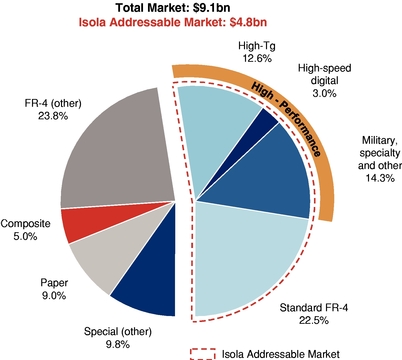
Note: Military, specialty and other includes FR-4 halogen-free
A majority of our high-performance product sales are low-loss laminates used primarily in applications for routers and servers.
According to BPA, the markets for low-loss laminate for routers and servers are expected to grow from 2011 to 2015 at compound annual growth rates, or CAGRs, of 10% and 6%, respectively.
121
Table of Contents
Business
PCB Laminate Materials and Fabrication
Prepreg and CCL are the primary laminate materials used in the construction of multilayer PCBs, and we estimate that these materials represent
greater than 40% of the material cost required to fabricate a PCB.
Prepreg
is an industry term derived from the contraction of "previously
impregnated". Prepreg is a dielectric material that provides electrical insulation and other properties. Prepreg is
manufactured by the impregnation of fiberglass fabric with specially formulated resins. The resin confers specific electrical, thermal and physical properties to the prepreg and is critical to the
proper functioning of a PCB. Prepreg may be incorporated into a CCL or sold as a separate product.
CCL
consists of an inner layer of prepreg laminated on both sides with a thin layer of copper foil. The lamination is achieved by pressing together one or more plies of copper and prepreg under
intense heat, pressure and vacuum conditions.
PCB
fabricators use prepreg and CCL to construct multilayered PCBs in a complex process comprised of multiple operations that are often repeated. In general, the copper surfaces of the laminate are
etched to create an electronic circuit. These etched laminates are assembled into a multilayer configuration by inserting one or more plies of insulating prepreg between each etched laminate. Holes
are then drilled and plated in the PCB to establish electrical connections among the layers. The resulting multilayer PCB is an intricate interconnection device on which semiconductors and other
components are mounted, which is then incorporated into an end-market product.
Although
end-market products and PCB designs often evolve rapidly as a result of product line improvements or extensions, the lifespan of the underlying PCB laminate materials is relatively long. The
same laminate materials can be used in successive generations of PCBs within a product line or be adapted to new products having similar performance specifications.
PCB Laminate Materials Segments and Properties
PCB laminate materials can be categorized as high-performance, standard or paper-based.
High-performance PCB laminate materials are defined by their superior performance capabilities achieved primarily through the use of
advanced resin formulations and materials. These products compete primarily on their technological capabilities and secondarily on the price of PCB laminate materials with similar performance
characteristics. High-performance products are used in circuit boards that combine eight or more layers, with most applications requiring circuit boards with more than 20 layers. In the
high-performance market, the following properties are critical:
- –>
- Electrical: This
property refers to the speed with which an electric current moves through the circuit and the signal loss,
or dissipation. Signal speed of a material is a function of its dielectric constant; signal loss is a function of its dissipation factor.
- –>
- Thermal: This
property refers to the stability of the material at various temperatures. This is important for maintaining
material integrity over the expected range of temperatures that a PCB will be exposed to during its final assembly (i.e., soldering process), as well as the operating temperature of the
particular electronic device. Thermal stability of a material is measured by its glass transition temperature (expressed as "Tg"), decomposition temperature (expressed as "Td") and thermal expansion
(expressed as "CTE").
- –>
- Physical: This
property refers to a number of factors, including peel strength (a measure of copper to dielectric band
strength), flammability, moisture absorption, ease of processing, drilling and reliability.
122
Table of Contents
Business
Standard PCB laminate materials are based on proven, though relatively less sophisticated, resin chemistry. These products compete primarily on price
and are produced in high volumes and at a low cost. Standard PCB laminate materials involve minimal proprietary technology and are used in applications requiring lower layer counts and less
complexity.
Paper-based PCB laminate materials are used in very simple consumer electronics, are very low-cost and typically rely upon somewhat
rudimentary chemical formulations. Isola does not participate in this market segment.
End-market Overview
The market for high-performance PCB laminate materials is influenced by a number of factors, including developments in the markets for
servers and storage, network communications and advanced automotive electronics as discussed below.
Servers and storage. The need for additional server and data storage capacity has significantly increased due to the proliferation of digital data and the
widespread adoption of cloud computing applications. Cloud computing entails the use of virtual servers which are accessed through the internet and deliver hosted services that have traditionally been
deployed in-house, including software as a service, platform as a service and infrastructure as a service. According to IDC, a leading independent research organization, as reported in its
Digital Universe Study of June 2011 (sponsored by EMC), the amount of digital data created, replicated and stored by 2015 will reach 7.9 trillion gigabytes, which is 6.4 times the amount of data in
2010, representing a CAGR of 45%. Storing and utilizing vast amounts of data will require significant increases in server and storage capacity and capability, as well as more robust cloud computing
technology. As servers and storage equipment become more sophisticated and technically demanding, manufacturers will need more effective PCB laminate materials comprised of
high-performance resin formulations to achieve the required performance in PCBs.
Network communications. Enterprise routers and wireless infrastructure form the network foundation required for high-speed data transmission and
internet access over wired and wireless servers, including the 4G wireless services that are now being rolled out globally. Currently deployed network infrastructure will require significant
investment in more sophisticated equipment with greater speed, processing power and performance characteristics in order to provide the increased capacity needed to address increased volumes of
traffic and data driven by social networking, increased mobile internet access and increased transmission of high-bandwidth content such as high-definition videos. The Cisco
Visual Networking Index estimates that global IP traffic will grow at a CAGR of approximately 29% from 2011 to 2016.
Advanced automotive electronics. While traditional automotive electronics utilize standard PCB laminate materials, the emergence of more sophisticated features,
such as vehicle information systems, engine and power train electronics and vehicle control systems, are driving demand for more advanced automotive electronics. These electronics require
higher-performing PCBs that incorporate high-performance laminate materials. Prismark estimates that automotive electronic applications represented 5.5% of the global PCB market in 2011,
and that the
high-performance PCB market for automotive electronics is expected to grow at a 7.2% CAGR from 2011 to 2015.
Other markets. Other markets include military/aerospace equipment, advanced mobile devices and satellite television receivers. High-performance PCBs
are used in military/aerospace applications, including radar, guidance control, communications and navigation, warfare and electro-optical equipment. Advanced mobile devices such as smart phones and
tablets incorporate PCBs made with high-performance halogen-free laminate materials. Satellite receivers require advanced high frequency PCB laminate materials that efficiently
transform signals to high quality, low frequency signals suitable for transmission over indoor cables.
123
Table of Contents
Business
Trends and Drivers in the Global PCB Laminate Industry
Current trends and drivers in the global industry for PCB laminate materials include the following:
Rapidly expanding data infrastructure and increasing demand for high-performance PCB laminate materials. Higher volumes of
high-performance PCB laminate materials will be required as OEMs sell more enterprise-level servers, storage solutions, routers, switches and other high-performance
electronics. Growth in these products continues due to fast-growing applications such as cloud computing, social networking and online video streaming combined with ubiquitous internet
access. This trend is expected to continue as developed nations continually improve upon existing technologies and developing nations further adopt and rely on high-performance
electronics.
Increasing performance requirements of advanced electronics require high-performance PCB laminate materials. To meet continually increasing
performance requirements of advanced electronics, semiconductor and component manufacturers regularly introduce successive generations of higher performance microprocessors, memory and logic devices
and electronic components. High-performance multi-layer PCBs and laminate materials are required to facilitate fast interconnect speeds and deliver superior electrical properties, enabling
semiconductors and components to optimally function as a system. As a result, the PCB laminate materials industry must continually
develop better performing, more cost effective laminate and resin formulations to meet the growing requirements of new semiconductor and component technologies.
Growing demand for environmentally friendly lead-free compatible PCB laminate materials. Increased regulation applicable to electronic equipment
requires manufacturers to consider use of lead-free materials in products and manufacturing processes. While these regulatory measures do not have a direct impact on PCB laminate
materials, which do not contain lead or other prohibited chemicals, they do change the thermal requirements of the laminates used in the lead-free soldering of PCBs. Lead-free
applications have been gaining momentum globally with many companies introducing products to meet the new regulations, and some converting exclusively to lead-free compatible assemblies in
order to avoid having separate bills of material and dedicated product lines.
Greater emphasis on closer collaboration with OEMs and materials suppliers. Time-to-market for new products has become increasingly
important as the rate of technology advancement accelerates and competition increases. OEMs are more frequently working directly with laminate materials suppliers early in the product lifecycle
to qualify specific laminates to be used in the PCBs incorporated into the end-market product. This collaboration allows OEMs to accelerate the product development process and bring products to
market faster. In addition, just-in-time inventory stocking by PCB fabricators results in a need for quick-turn availability of laminate materials. Laminate
materials producers benefit from these trends, partnering closely with customers to accommodate their demands, while obtaining higher margins on quick-turn orders.
OUR COMPETITIVE STRENGTHS
We believe that we possess the following competitive strengths, which will enable us to continue to grow our business globally.
Product technology leadership. Our significant technology expertise enables us to produce market-leading high-performance PCB laminate materials. We
possess an extensive portfolio of patent and other intellectual property rights covering our proprietary resin formulations, and have pioneered the development of several product categories with "best
in class" technology. Our proprietary resin formulations are capable of supporting complex circuit boards used in the most demanding electronic equipment. We believe that our technology provides a
competitive advantage, and differentiates our
124
Table of Contents
Business
products
from commonly available, lower performance materials. We continue to devote considerable efforts to research and develop new resin formulations and other PCB laminate materials to meet
evolving market needs.
Recognized market leadership. We maintain a leading market share, based on revenues, in our high-Tg and high-speed digital addressable
markets for high-performance PCB laminate materials. According to Prismark, our market share in our high-Tg addressable market increased to 30% in 2011 from 29% in 2010; and
our market share in our high-speed digital addressable market increased to 45% in 2011 from 37% in 2010. In our military, specialty and other addressable market for
high-performance PCB laminate materials, our market share remained flat at 3% in 2011 with no change from 2010. Our market share in our standard PCB laminate materials addressable market
decreased to 5% in 2011 from 7% in 2010 as a result of our continued product mix shift toward higher margin, high-performance products. We have an established reputation as an industry
leader and product innovator with strong brand recognition. We believe that our products are known for their performance, quality and long product life cycles. We believe that our reputation and the
strength of our brand provide meaningful advantages when developing and marketing new and existing products and will play a significant role in our future growth.
Blue-chip customer base served by global strategic manufacturing locations. We have developed strong, long-term relationships with leading
global PCB fabricators and the major OEMs they serve. We believe that the collaborative relationships provide us with a competitive advantage and assist us in bringing new products to market in
a timely manner. As new products gain market acceptance, many product manufacturers will shift their manufacturing to low cost Asian facilities. Because we own
state-of-the-art equipment in manufacturing facilities that are strategically located around the world in close proximity to these key industry participants, we are
able to seamlessly move laminate production to meet our customers' needs. In addition, our global network of plants facilitates quick-turn manufacturing and delivery of product, which
reduces our customers' inventory levels and shipping costs.
Streamlined manufacturing with significant operating leverage. We seek to achieve continual improvement in our manufacturing and business processes in order to
improve quality and reduce costs. We use "six sigma" processes and "lean" best practices, and we recently completed the implementation of a sophisticated SAP-based enterprise resource
planning ("ERP") system across our global operations, which enhanced our production planning and inventory management capabilities on a worldwide basis.
Experienced management team. We have a highly experienced management team comprised of well-respected industry veterans who possess an average of over
20 years of experience in the electronics industry. Our management team has a proven track record of implementing sound business practices, which include focusing our product development on
higher margin products, improving the efficiency of our manufacturing facilities and successfully integrating acquired businesses.
OUR GROWTH STRATEGIES
We intend to extend our market leadership in the higher margin, high-performance laminate materials market through the following growth
strategies:
Leverage collaborative relationships and technology leadership to develop innovative solutions. We have implemented focused product development teams to
further expand our relationships with leading PCB fabricators and the OEMs they serve. Our product development teams include members of our research and development, technical support and OEM
marketing groups, all working under the direction of our Chief Technology Officer. Our teams actively monitor product developments for OEMs and engage in regular dialog with them and their PCB
fabricators, in order to anticipate and plan for required technical product specifications. Through this collaborative effort we seek to develop innovative laminate materials solutions that meet
future OEM product requirements.
125
Table of Contents
Business
Further penetrate the Asian market. Many OEMs and PCB fabricators are increasingly migrating the manufacturing of complex electronic equipment to Asia. In
addition, several Asian markets are simultaneously undergoing infrastructure build-outs as their economies grow and develop. To supply this market, six of our 11 manufacturing facilities
are located in Asia, and we maintain a sales force dedicated to serving this region. We will seek to capitalize on the opportunities presented by the very large and fast growing Asian markets for
high-performance PCB laminate materials based on the high quality of our products and our technology.
Extend high-performance products into new applications. We believe that other markets could benefit from our PCB laminate materials and proprietary
resin formulations, including the markets for next generation automotive equipment and consumer devices such as smart phones and tablets. In addition, we believe that environmental regulations will
become increasingly global and expand the addressable market for our high-performance, lead-free compatible and halogen-free PCB laminate materials. We intend to
devote marketing and technical resources to address these growing potential markets.
Opportunistically pursue strategic acquisitions and alliances. We have grown through select acquisitions since we were acquired in 2004. While we believe that our
future success will depend primarily on product innovation from collaborative relationships with our major customers and the OEMs they serve, we may pursue strategic acquisitions that provide
products or technology complementary to our current operations.
PRODUCT MARKETS AND PRODUCT APPLICATIONS
Product Markets. Isola focuses on the high-performance segments of the market for PCB laminate materials, which are expected to provide the greatest
growth opportunities. Currently the largest of the markets we serve include:
- –>
- High-Tg. High-Tg products exhibit superior thermal, electrical and physical
performance characteristics, including the ability to withstand
fabrication processes involving temperatures of 170°C or more. They are used in the communications, industrial, medical, automotive, military, aerospace and computing industries.
- –>
- High-Tg, lead-free. High-Tg, lead-free compatible
products incorporate resins specially formulated to withstand thermal stresses arising in higher temperature lead-free PCB fabrication. Demand for lead-free products is driven
by growing environmental concerns, including lead-free initiatives in major geographies. We maintain an extensive portfolio of proprietary technology and we believe we have significant
market share in this product segment.
- –>
- High-speed digital. High-speed digital, or high-frequency, products
provide superior electrical properties, specifically low dissipation factors and low dielectric constants. Demand for these products is driven by a need for increased circuit speeds for servers,
storage application networks, network infrastructure and military electronics. We have a leading market position and an extensive portfolio of proprietary technology addressing this market, which has
grown faster than the PCB market as a whole in recent years.
We
also participate in the following high-performance markets:
- –>
- Halogen-free. Halogen-free products satisfy consumer demand for "green" products
because they do not contain halogen-derived flame retardants. This market is currently growing primarily in the consumer electronics sector with specific applications ranging from smart phones to
tablets and LCD displays. Although the current market for these products is extremely price competitive, newer and more demanding applications are emerging. We are currently developing more advanced
halogen-free materials utilizing resin formulations with improved thermal and electrical properties to address the emerging needs of this market, and we expect that these next generation
halogen-free products are likely to command higher prices and provide improved margins.
126
Table of Contents
Business
- –>
- Military/specialty. These laminate materials find specialized uses within the military and aerospace
industries. Typically they have high glass-transition temperatures, very high decomposition temperatures and low expansion rates—all attributes required for demanding military and
aerospace applications. We work through licensed government contractors to address existing and emerging applications.
We also provide the following standard products to our customers:
- –>
- Low- and mid-Tg. These laminate materials are used in less demanding
applications within the consumer, automotive and industrial industries. Our revenues in the low- and mid-Tg markets are expected to decline as we continue to focus on the more
attractive, high-performance markets.
Product Applications. The chart below shows the characteristics and some major applications of various high-performance products and standard products
that we offer.
|
|
|
|
|
|
|
|
|
Market
|
|
Segment
|
|
Major Isola products
|
|
Characteristics
|
|
Major applications
|
| |
| High-performance |
|
High-Tg |
|
-FR406
-406HR
-370HR
-410HR
-185HR
-AutoHR |
|
- High thermal limits (170oC or higher)
- Includes lead-free variant compatible with automated lead-free
soldering |
|
- Advanced automotive applications
- Communications and computing
- Medical, military and aerospace
- Enterprise class servers
- Entry-level routers and storage solutions
- Mid-range computers
- Advanced automotive electronics |
|
|
High-speed digital |
|
-FR408
-FR408HR
-IS415
-I-Tera
-I-Speed |
|
- High thermal limits (170oC or higher)
- Better electrical properties
- Greater transmission efficiency
- More robust materials |
|
- Enterprise class servers and storage applications
- High-speed routers and communication equipment |
|
|
Halogen-free |
|
-DE156 |
|
- Do not use halogen compounds to impart fire
retardants
- "Green" alternative |
|
- Smart phones
- Tablets
- Other high-end consumer products |
|
|
Military / specialty |
|
-P95
-P96
-406N |
|
- High thermal limits
- Very low expansion |
|
- Aerospace equipment
- Military and other specialty applications |
Standard |
|
Mid-Tg |
|
-IS400 |
|
- Moderate thermal limits (under 170oC) |
|
- Automotive electronics |
|
|
Base low-Tg |
|
-DE104
-FR402 |
|
- Low thermal limits (125oC or less) |
|
- Basic automotive electronics
- Entry-level consumer devices |
We are able to customize our PCB laminate materials to meet particular customer requirements and maintain over 25,000 SKUs, or Stock Keeping Units.
127
Table of Contents
Business
CUSTOMERS AND SALES STRATEGY
Sales and Distribution
Isola's products are primarily sold through our direct sales forces located in Asia, Europe and the United States. As of September 29, 2012,
we employed approximately 77 direct sales and technical service representatives. In addition, we use third-party distribution channels in the United States, Canada and Europe, as well as in select
Asian countries, primarily to address smaller PCB fabricators.
Strategic Customer and OEM Relationships
As a global leader in the high-performance segments of the PCB laminate materials industry, we have developed long-term
customer
relationships with leading PCB fabricators such as AT&S, Gold Circuit Electronics, Hitachi, Ibiden, Multek, Ruwel, Sanmina, TTM Technologies, Unimicron, Viasystems and WUS Printed Circuit. Only one of
our customers (Viasystems and its subsidiaries) accounted for more than 10% (but less than 20%) of our revenues in each of fiscal 2011, 2010 and 2009 and the nine months ended September 29,
2012 and October 1, 2011 (approximately 15% for both the nine months ended September 29, 2012 and October 1, 2011, 16% in fiscal 2011, and 15% in both fiscal 2010 and fiscal
2009). Our ten largest customers accounted for 63% of our revenue for the nine months ended September 29, 2012, 60% of our revenue for the nine months ended October 1, 2011, 61% of our
revenue in fiscal 2011 and 60% of our revenue in both fiscal 2010 and 2009.
We
also maintain strategic relationships with the OEMs our customers serve, such as Alcatel-Lucent, Bosch, Brocade, Cisco, Dell, Ericsson, Google, Hewlett-Packard, Huawei, IBM, Motorola, Nokia,
Siemens and Sun Microsystems (now Oracle). We work with OEMs to deliver highly customized products that meet their specific performance requirements on a cost-effective basis.
We
have established industry-specific marketing teams dedicated to collaborating with key players in particular end-markets on new product introductions. These teams collaborate with major
OEMs and their PCB fabricators, as well as with our research and development personnel, to specify proprietary resins that meet the specific performance criteria of next generation products.
While OEMs do not purchase laminate materials directly from Isola, they are an important part of the design process, significantly influencing the specific performance requirements of the
laminates and prepreg to be used in new products and in some cases pre-qualifying a limited number of approved suppliers whose materials may be incorporated into the product. In cases
where materials are pre-qualified, PCB fabricators or OEMs will select a particular laminate material among the pre-qualified materials, typically based on price,
service and performance. Once a particular PCB laminate material is designed in or qualified for use in a specific product line and one or more particular laminate suppliers are selected, these
suppliers tend to remain suppliers of choice, even as the PCBs for these products change to address OEM product line improvements or extensions or next generation developments.
We
generally sell our products directly to our customers. We do limited advertising in select trade publications, and we actively participate in major trade shows as our principal form of sales
promotion.
RESEARCH AND DEVELOPMENT
Isola's business strategy depends on the continued improvement of our PCB laminate technologies. As of September 29, 2012, we had
approximately 75 employees engaged in research and development, with an additional 27 employees engaged in technical support and additional 17 employees engaged in OEM marketing activities. We
maintain a major research and development facility near our Corporate headquarters in Chandler, Arizona, as well as facilities in Germany and Singapore to serve Europe and Asia. In addition, global
teams of technical and support personnel maintain collaborative partnerships with our
128
Table of Contents
Business
customers and leading OEMs in order to help us maintain technological and product leadership. Our OEM marketing function and research and development function are tightly integrated, and both
report to our Chief Technology Officer.
Our
research and development activities are primarily focused on the following areas:
High-Speed / High-Frequency Applications—We are developing laminate materials and related resin formulations that
can support increasingly critical high-speed/high-frequency applications. Specifically, we seek to continually develop improved dielectric platforms which deliver lower
dissipation factors and lower, controlled dielectric constants, and improved performance. We are also developing PCB laminate materials that will support faster data transfer rates in order to enhance
our portfolio of materials for radio frequency ("RF") applications. As a result of these efforts, we are commercializing new products in 2012, I-Speed and I-Tera, addressing
the emerging high-speed, low-loss market for high-end servers, storage devices and RF applications. Additionally, in late 2011, we introduced three new
high-performance, high-Tg laminates. Our Auto HR product is designed especially for the increasing performance demands of automotive applications. Our 185HR and 406HR products
are specifically designed to provide increased thermal reliability and mid-range electrical loss at a lower cost of ownership, especially in the Asian market.
- –>
- High-Tg, Lead-Free Compatible and High Reliability Products—We are developing
resins, PCB laminate materials and process enhancements that can support lead-free compatible, high-performance applications that are designed to address increasingly pervasive
environmental regulations and lead-free initiatives. We are focusing on improving dielectric properties and reliability.
- –>
- Halogen-Free Platforms—We are currently developing more advanced halogen-free
materials utilizing resin formulations with improved thermal and electrical properties to address the emerging needs of this market, and expect that these next generation halogen-free
products are likely to command higher prices and provide improved margins.
In the nine months ended September 29, 2012 we spent $9.2 million on research and development activities and $1.6 million on capital expenditures related to those activities. In
fiscal 2011, we spent $10.7 million on research and development activities and $0.9 million on capital expenditures related to these activities. In fiscal 2010 we spent
$9.5 million on research and development activities and $0.7 million on capital expenditures related to these activities, and in fiscal 2009 we spent $9.2 million on research and
development activities and $0.4 million on capital expenditures related to these activities.
NOTABLE RESEARCH AND DEVELOPMENT ACCOMPLISHMENTS
We continually invest in research and development, as well as in our relationships with key customers and OEMs, in order to develop products that
address the particular needs of the OEMs served by our customers. Many of our R&D efforts result in innovative new products that enable us to gain a "first mover" advantage over our competition
and leading market share. Because many OEM products have life cycles of six to 10 years, our research and development efforts can result in long-term, sustainable benefits.
Set
forth below are two examples of our R&D efforts.
370HR (High-Tg, Lead-Free)
Over the past several years, contract manufacturers and PCB fabricators have been compelled to use lead-free soldering alloys due to
increasing consumer and regulatory pressure. These alloys require soldering temperatures significantly higher than lead-containing alloys, and thus the laminate materials industry had
developed a cured laminate capable of withstanding the process. While the cured laminate chemistry solved the higher assembly temperature problem, it also introduced new problems such as
129
Table of Contents
Business
thermal
expansion and proved harder for PCB fabricators to drill and process. It was clear that a new laminate product was needed to address these issues.
Through
a unique combination of our intellectual property and technical know-how, we developed a new, patented filler technology that significantly lowered the instance of thermal
expansion and improved the processing attributes of the laminate. This technology was introduced as our 370HR product, which we believe was the first high-Tg, lead-free product
of its kind to offer superior reliability and provide a compelling value proposition to OEMs.
Today,
we believe that the 370HR is acknowledged as the "best in class" product for high reliability applications across the telecommunications, high-end computing and high-end
automotive markets. We have a leading position in the high-Tg market segment, and enjoy numerous OEM design approvals for our products in this segment. By anticipating customer needs, we
were able to gain a "first mover" advantage over our competition, and our continuing development efforts have allowed us to maintain our leadership.
FR408HR (High-Speed Digital)
The rapid growth of smart phones, the increased use of social media and the expansion of cloud computing have pressured OEMs to develop
servers, routers and other infrastructure hardware that can operate at ever-higher speeds. Due to increasing consumer and regulatory pressure, the components of these devices have also
needed to be lead-free.
To
meet the requirements for increased speed and frequency, as well as environmental concerns, PCB fabricators needed a high-performance but cost-effective laminate that would
be compatible with existing manufacturing processes, handle the transition to lead-free soldering, and allow for low-loss signal transmission, all at a reasonable price.
In
early 2009, our research department began to address this industry-wide issue, initially using modeling and simulation programs to determine the efficacy of various potential chemical
combinations. Within three months, we had developed a potential materials solution, which was field-tested in collaboration with several PCB fabricators, presenting the successful results to
OEMs just weeks later. In total, it took us less than six months to go from concept to market introduction of our FR408HR laminate material, which we believe is the PCB industry's first and
leading lead-free compatible, high-speed and low-loss laminate.
Today,
the FR408HR is used by major high-end PCB fabricators globally and has been designed into several key OEM product lines. The FR408HR forms an important component of our
high-speed digital product portfolio, which we have been able to grow significantly over the last five years by understanding the needs of our customers and developing innovative products.
LAMINATE MANUFACTURING PROCESS
Isola maintains 11 manufacturing facilities, strategically located in the United States, Europe and Asia, including nine fully integrated laminate
facilities, one "pressing and finishing-only" facility to serve a customer in a relatively remote location in Asia and one fiberglass manufacturing facility in Italy. Our global network of
plants facilitates quick-turn manufacturing and delivery of product, and minimizes customers' shipping costs and inventory levels. We employ "six sigma" business processes to improve
working capital management and enhance factory productivity. We also employ manufacturing "best practices" throughout our 11 facilities and maintain a dedicated, internet-based private computer
network for manufacturing personnel to share information.
The
process for manufacturing our prepreg and laminates is capital intensive and requires sophisticated equipment as well as clean-room environments. The diagram below depicts the key
steps in our manufacturing process.
130
Table of Contents
Business
- 1.
- The
preparation and formulation of specially designed resin systems.
- 2.
- The
impregnation of specially designed fiberglass fabric with the resin system and partial curing of the resulting prepreg.
- 3.
- The
assembly of single or multiple plies of prepreg and copper foil in a clean-room environment, which is referred to as "lay-up".
- 4.
- The
lamination of the copper-clad assemblies under simultaneous exposure to intense heat, pressure and vacuum conditions, which is referred to as
"pressing".
- 5.
- The
sizing and packaging of the laminates to customer specifications.
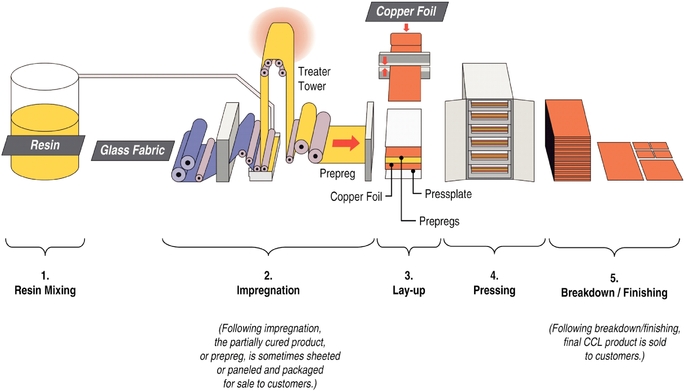
Prepreg
is manufactured in a treater at the impregnation stage of the manufacturing process. A treater is a continually operating roll-to-roll machine that impregnates the
fiberglass or other reinforcement fabric with a resin formulation and then sequences the resin-impregnated fabric through a series of ovens which partially cure the resin-fiberglass.
We
manufacture CCL by assembling in a clean room one or more plies of prepreg stacked between sheets of specially manufactured copper foil purchased from outside vendors. Similar such assemblies are
then inserted into a large, multiple-opening vacuum lamination press, which subjects the assemblies to intense heat, pressure and vacuum conditions. After the press cycle is completed, the laminates
are removed from the press and sheeted, paneled and finished to customers' specifications. The CCL is then inspected and packaged for shipment to customers.
ENTERPRISE SOFTWARE
In 2010, Isola completed a long-term project to consolidate its laminate manufacturing facilities on a single ERP platform. Utilizing SAP
ERP software, this system established a common template across all of our laminate operations for the finance/accounting, manufacturing and sales and service functions.
131
Table of Contents
Business
The global ERP template enables centralized financial planning and reporting and facilitates a fast and efficient financial closing process at the end of each fiscal period.
This template provides a flexible and standardized methodology to support our anticipated growth. By eliminating older legacy systems and adopting this new system, we believe we have reduced business
risk and achieved a high level of system and data integrity.
Our
SAP ERP platform is tightly integrated with our global business intelligence system. This analytical environment provides our management with rapid insight into changing operational conditions.
The business intelligence system offers a single source of information from multiple disciplines, including sales and marketing, supply chain logistics, and financial planning and analysis. It also
provides specific, periodic operational scorecards to guide the management team's ongoing business improvement efforts.
SOURCES OF RAW MATERIALS
Materials costs comprised approximately 66% and 69% of Isola's total cost of goods sold for the nine months ended September 29, 2012 and
fiscal 2011, respectively. Copper, resin and fiberglass are the principal raw materials used in the manufacture of our advanced PCB laminate materials.
We
have developed close working relationships with multiple suppliers for each of our three key raw materials. Our suppliers are required to comply with our stringent specifications and technical
requirements. In addition to copper, resin and fiberglass, we use certain specialty materials for which we rely on a limited number of suppliers or a sole supplier. To date, we have not experienced
any major supply disruptions. Our diversified global supply base for copper foil and fiberglass, and our long-standing relationships with our suppliers for each of our raw materials, has
been key to preventing any major supply disruptions to date, even when industry-wide shortages have occurred.
Prices
of raw materials, especially copper, are subject to price fluctuations. Historically, we have been able to pass through raw material price increases more readily in the
high-performance segment of the market than for our mid- or low-Tg materials.
INTELLECTUAL PROPERTY
We hold a position of technology leadership within the laminate industry, providing our customers with innovative solutions to meet their application
needs. This is a result of our significant investment in research and development, particularly with respect to innovative proprietary resin formulations and our comprehensive patent portfolio. As of
September 29, 2012, we held approximately 185 patents (including foreign counterparts) in the United States, Europe and Asia. While these patents are primarily directed to our resin
formulations, we also hold patents related to our thin-glass style and copper foil manufacturing processes. We continue to file new patent applications, for which terms extend up to
20 years from the filing date in the United States. Our key patents include:
- –>
- Drum
Side Treated Foil, or DSTF, which enables the use of reverse treat copper technology widely used by the copper foil manufacturers;
- –>
- Styrene
Maleic Anhydride, or SMA, which we have used to formulate many products providing us with a leading edge in high-speed and
high-frequency markets; and
- –>
- two
patents related to our proprietary Talc mineral-based fillers used in our lead-free compatible PCB laminate materials.
Our
key U.S. patents described above have expiration dates ranging from 2015 to 2017.
Most
of our intellectual property, including formulations and manufacturing processes, is created and maintained in the United States. In order to protect our intellectual property rights, we rely on
a
132
Table of Contents
Business
combination
of patent, trade secret, copyright and trademark laws, as well as employee and third-party nondisclosure agreements. Because of the differences in foreign trademark, patent and other laws
concerning proprietary rights, our intellectual property rights may not receive the same degree of
protection in foreign countries as they would in the United States. In order to protect our resin formulations, which are among our most valuable trade secrets, we generally do not disclose these
formulations to our foreign manufacturing facilities. For critical formulations, we mix the key ingredients in the United States and provide them to our foreign manufacturing facilities in order to
limit dissemination of the ingredient list. We believe that while the protection afforded by patent, trademark and trade secret laws may provide some advantages, the competitive position of
participants in our industry is principally determined by such factors as the technical and creative skills of their personnel, the frequency of their new product developments and their ability to
anticipate and rapidly respond to evolving market requirements. Therefore, we have focused our efforts on developing substantial expertise and know-how in our industry, and protecting that
know-how with confidentiality agreements and trade secrets.
In
addition to confidentiality agreements, we rely on a variety of methods to protect unpatented proprietary technology and trade secrets. To protect our proprietary materials formulae, only a select
few of our senior research and development employees have access to key resin formulations. In addition, we ship the ingredients for some of our resins to our offshore facilities in containers which
do not identify by name the components of the resin.
We
rely on our trademarks, trade names and brand names to distinguish our products and services from the products and services of our competitors, and have registered or applied to register many of
these trademarks.
We
also license certain of our manufacturing processes to PCB fabricators and copper foil suppliers, from which we derive limited income.
We
periodically evaluate our competitors' product offerings in order to identify potential infringements of our intellectual property rights. When deemed appropriate, we have aggressively defended our
intellectual property rights through legal action.
COMPETITION
Isola has many competitors, ranging in size from large, international corporations, some of which are vertically integrated, to small regional
producers. Some of our competitors are well-established and have a larger share of the overall laminate market, as well as greater manufacturing, financial, research and development and
marketing resources than we do. We compete for business in the PCB materials industry primarily on the basis of technology, product performance, innovative new product development, product
qualification, price and customer responsiveness and service. Our primary global competitors in the high-performance market, which we consider to be our core competency, include Guangdong
Shengyi Sci. Tech. Co.,
ITEQ, Panasonic, Park Electrochemical, Rogers Corp. and Taiwan Union Technology Corporation. Unlike many of our competitors, we are focused solely on the design, development and manufacturing of PCB
laminate materials.
For
a more complete description of the risks we face related to competition, see "Risk Factors—Risks Related to Our Industry and Business". We face intense competition within the PCB
materials industry, including from diversified manufacturers and suppliers, which could negatively impact our results of operations and cause or market share to decline".
133
Table of Contents
Business
LEGAL PROCEEDINGS
On June 25, 2012, Isola USA, our wholly-owned subsidiary, filed a civil action against TUC in the United States District Court for the
District of Arizona, alleging infringement by TUC of certain patents owned by us that provide enhanced thermal electrical properties in laminate materials used to fabricate PCBs. We are seeking:
(i) an injunction to enjoin TUC from infringement of the applicable patents; (ii) monetary damages to compensate us for TUC's infringement of the patents in an amount to be proven at
trial; (iii) treble or enhanced damages under 35 U.S.C. § 284; and (iv) the attorneys' fees, costs and expenses that we incur prosecuting this action.
On June 25, 2012, Isola USA filed a civil action against Park in the United States District Court for the District of Arizona, alleging infringement by Park of certain patents owned by us that
provide enhanced thermal electrical properties in laminate materials used to fabricate PCBs. We are seeking: (i) an injunction to enjoin Park from infringement of applicable patents;
(ii) monetary damages to compensate us for Park's infringement of the patents in an amount to be proven at trial; (iii) treble or enhanced damages under 35 U.S.C.
§ 284; and (iv) attorneys' fees, costs and expenses that we incur prosecuting this action.
On August 14, 2012, we amended our complaints against Park and TUC to include a third patent, United States Patent No. 8,022,140 (titled "Epoxy Resin, Styrene-Maleic Anhydride Copolymer and
Crosslinking Agent"), which we allege is being infringed by Park and TUC.
On August 17, 2012, Isola USA filed an enforcement complaint against TUC with the United States International Trade Commission (USITC). The complaint alleges that TUC has violated a
March 12, 2009 Order ("consent order") entered by the USITC that bars TUC from importing and/or selling for importation any products that infringe certain claims of two Isola patents, United
States Patent No. 6,187,852 (titled "Fillers for Improved Epoxy Laminates") and certain claims of United States Patent No. 6,322,885 (titled "Talc Particles as Fillers for Improved Epoxy
Laminates"), through TUC's importing and selling its laminate and prepreg products in the United States. Specifically, the complaint alleges that TUC has violated the consent order by importing and/or
selling for importation its TU-862 HF and TU-86P HF products. The complaint requests that the USITC institute enforcement proceedings, issue a cease and desist order against TUC and those acting in
concert with TUC from importing and/or selling for importation the infringing products in the United States, and impose sanctions against TUC in an amount of no less than $100,000 per day for each day
the consent order was violated. On October 3, 2012, Isola USA was informed that the USITC has instituted an enforcement proceeding to determine whether TUC is in violation of the previously
issued consent order and what, if any, enforcement measures are appropriate.
From
time to time, we are subject to various legal proceedings that arise in the normal course of our business activities. In addition, from time to time, third parties may assert intellectual
property infringement claims against us. As of the date of this prospectus, we are not a party to any litigation the outcome of which, if determined adversely to us, would individually or in the
aggregate be reasonably expected to have a material adverse effect on our results of operations or financial position.
REGULATION
Our operations are subject to various environmental laws and regulations that limit discharges into the environment, establish standards for the
handling, generation, use, emission, release, discharge, treatment, storage and disposal of, or exposure to, hazardous materials, substances and waste, and require cleanup of contaminated soil and
groundwater. These laws and regulations are complex, change frequently and have tended to become more stringent over time. Although the Company did not incur any material environmental costs or
changes in fiscal 2011, 2010 or 2009, failure to comply with these laws and regulations could have a material adverse effect on our operations, including the temporary or permanent shut down of our
facilities. Many of these laws and regulations provide for substantial fines and penalties
134
Table of Contents
Business
and,
in some cases, criminal sanctions for violations. Some of these laws and regulations may also impose liability for property damage and personal injury stemming from the presence of, or exposure
to, hazardous substances. For example, under the Superfund Act and similar state laws in the United States, or under comparable laws in foreign jurisdictions, if one of our manufacturing facilities
were to be identified by the applicable governmental authority as a hazardous waste disposal site or contaminated area, all parties who may have contributed to any waste, including us, could be
jointly
and severally liable for the cost of cleanup. Generally, these sites are locations at which numerous persons disposed of hazardous waste.
We
are required to certify compliance with various material content restrictions in our products based on laws of various jurisdictions or territories, such as the Restriction of Hazardous Substances
directives in the European Union, and comparable directives in China, which restrict the use of various hazardous materials, including lead, in the manufacture of certain types of electronic and
electrical equipment. The European Union's Registration, Evaluation, Authorization and Restriction of Chemicals regulations require companies manufacturing or importing certain chemical substances
into the European Union to register those substances. Disclosure by manufacturers that they use such materials could result in pressure from customers and other constituencies. We do not believe that
these laws or regulations currently apply to our operations, although we continually monitor changes in interpretations of these laws, and regulations adopted under them, for potential application to
our operations. These laws and regulations provide for substantial fines and penalties for violations and, if applicable, could require the change or discontinuation of certain operations, any of
which could have a material adverse effect on us.
Our
operations are also governed by laws and regulations relating to workplace safety and worker health. We believe we are in material compliance with these laws and regulations. We also believe that
we are in material compliance with applicable labor and employment laws and regulations.
EMPLOYEES
As of September 29, 2012, Isola had approximately 2,009 employees worldwide. Of these employees, 1,009 were engaged in manufacturing
operations and 1,000 were employed in engineering, sales or administrative positions. We consider our employee relations to be good.
As of September 29, 2012, approximately 128 of our employees (or 6.4% overall) were members of one of the following unions: in Singapore, the United Workers of Electronic and Electrical
Industries; in Germany, IG Metall; and in Italy, FEMCA CISL and FILTEA CGIL. Our relationship with these unions generally has been satisfactory. Within the last five years, we have not experienced any
work stoppages at any of our facilities.
PROPERTIES AND FACILITIES
Our Corporate headquarters are in leased office space located in Chandler, Arizona. We maintain manufacturing facilities and research and development
laboratories globally. We believe that our facilities are adequate for our current and projected needs.
135
Table of Contents
Business
The
following table sets forth information concerning our principal facilities owned or leased by us.
|
|
|
|
|
|
|
|
|
|
|
Location
|
|
Owned /
leased / land
use rights
|
|
Approximate
square
footage
|
|
Expiration of
lease or land
use rights
|
|
Type of facility
|
| |
Elk Grove, California |
|
Owned |
|
|
44,000 |
|
N/A |
|
Manufacturing |
Chandler, Arizona
(3100 W. Ray Road) |
|
Leased |
|
|
18,500 |
|
May 31, 2013 |
|
Corporate and regional offices |
Chandler, Arizona
(165 S. Price Road) |
|
Owned |
|
|
97,000 |
|
N/A |
|
Manufacturing; research and development |
Franklin, New Hampshire(1) |
|
Owned |
|
|
99,700 |
|
N/A |
|
Manufacturing |
Ridgeway, South Carolina |
|
Owned |
|
|
110,000 |
|
N/A |
|
Manufacturing |
| |
|
|
|
|
|
|
|
|
| |
Total in North America |
|
|
|
|
369,200 |
|
|
|
|
Hong Kong |
|
Leased |
|
|
11,400 |
|
May 31, 2015 |
|
Regional offices |
Taoyuan, Taiwan |
|
Owned |
|
|
138,600 |
|
N/A |
|
Manufacturing |
Yangmei, Taiwan |
|
Owned |
|
|
90,700 |
|
N/A |
|
Manufacturing |
Huizhou, China(2) |
|
Land Use Right |
|
|
220,500 |
|
January 1, 2048 |
|
Manufacturing |
Suzhou, China(2) |
|
Land Use Right |
|
|
146,500 |
|
December 31, 2046 |
|
Manufacturing |
Kuching, Malaysia |
|
Leased |
|
|
39,200 |
|
April 30, 2015 |
|
Manufacturing |
Singapore |
|
Leased |
|
|
134,200 |
|
December 31, 2019 |
|
Manufacturing; research and development |
| |
|
|
|
|
|
|
|
|
| |
Total in Asia |
|
|
|
|
781,100 |
|
|
|
|
Duren, Germany |
|
Owned |
|
|
826,300 |
|
N/A |
|
Manufacturing; regional offices; research and development |
Brugherio, Italy (glass fabric) |
|
Leased |
|
|
252,000 |
|
March 9, 2023 |
|
Manufacturing |
| |
|
|
|
|
|
|
|
|
| |
Total in Europe |
|
|
|
|
1,078,300 |
|
|
|
|
TOTAL WORLDWIDE |
|
|
|
|
2,228,600 |
|
|
|
|
- (1)
- This facility has been closed and is currently being marketed for sale.
- (2)
- There is no private land ownership in China. Land in China is owned by the government and cannot be sold to any individual or entity. Instead, the government grants
or allocates
landholders a "land use right", which is sometimes referred to informally as land ownership. Land use rights are granted for specific purposes and for limited periods. Each period may be renewed at
the expiration of the initial and any subsequent terms. Granted land use rights are transferable and may be used as security for borrowings and other obligations. We have been issued land use right
certificates for our property located in Huizhou, China until 2048 by the municipal government of Boluo and for our property located in Suzhou, China until 2046 by the municipal government of Suzhou
Industrial Park. Such certificates may be renewed upon our application and the municipal governments' approval.
136
Table of Contents
Business
FINANCIAL INFORMATION FOR SEGMENTS AND GEOGRAPHICAL AREAS
For information regarding revenues from external customers by segment and geographic area, measures of profit or loss and total assets by segment and
long-lived assets by geographic area, see Note 14 to our consolidated annual financial statements and Note 12 to our unaudited interim financial statements, included
elsewhere in this prospectus.
137
Table of Contents
Management
Prior to this offering, we were a private company controlled by our Sponsors. The following table sets forth certain information
regarding our executive officers, other key employees and directors.
|
|
|
|
|
|
Name
|
|
Age
|
|
Position
|
| |
Raymond Sharpe |
|
|
63 |
|
President, Chief Executive Officer and Director |
F. Gordon Bitter |
|
|
69 |
|
Executive Vice President and Chief Financial Officer |
Tarun Amla |
|
|
47 |
|
Executive Vice President and Chief Technology Officer |
Mathew LaRont |
|
|
48 |
|
President, Asia and Global Supply Chain Officer |
Robert Chaney |
|
|
52 |
|
President, Americas |
Karl Stollenwerk |
|
|
54 |
|
President, Europe |
Kevin Burns |
|
|
48 |
|
Director |
Donald Colvin |
|
|
59 |
|
Director |
H. McIntyre Gardner |
|
|
51 |
|
Director |
Jordon Kruse |
|
|
41 |
|
Director |
Jeffrey McCreary |
|
|
55 |
|
Director |
Timothy Millikin |
|
|
29 |
|
Director |
Cassidy Traub |
|
|
31 |
|
Director |
EXECUTIVE OFFICERS AND KEY EMPLOYEES
Raymond Sharpe is the President and Chief Executive Officer of Isola, a position that he has held
since he joined us in June 2004. Mr. Sharpe has also served as a member of our board of directors since September 2011, and served as a member of the board of directors of the Sponsor Holding
Company since June 2004. Prior to joining Isola, Mr. Sharpe was the Chief Executive Officer of Cookson Electronics and a member of the board of directors of Cookson Group Plc, a position
he held for over ten years. Mr. Sharpe helped build Cookson Electronics into a leading global supplier of materials and equipment servicing the PCB, PCB assembly and semiconductor packaging
markets. In addition, Mr. Sharpe served for ten years as a director for SPS Technologies, Inc., a NYSE-listed manufacturer of specialty materials for the aerospace industry.
He also currently serves as a director of Cytec Industries Inc., a NYSE-listed specialty chemicals company. Mr. Sharpe received a bachelor of arts degree from East Carolina
University and has over thirty years of experience in the electronics industry. In April 2011, Mr. Sharpe was elected to serve on the board of IPC, the industry association for printed circuit
board and electronics manufacturing service companies. Mr. Sharpe was selected to serve as a member of our board of directors because of his extensive leadership experience in the electronics
industry, his intimate knowledge of Isola's business and operations, and his deep understanding of both our markets and our competitors.
F. Gordon Bitter is the Executive Vice President and Chief Financial Officer of Isola, a position that he has held since he joined us in 2008. Prior to
joining Isola, Mr. Bitter was the Senior Vice President and Chief Financial Officer of Plexus, a Nasdaq-listed contract manufacturer of high-end technology products servicing the
wireless infrastructure, networking, medical and aerospace markets. Prior to his five year tenure at Plexus, Mr. Bitter was the Senior Vice President and Chief Financial Officer of Hadco
Corporation, a NYSE-listed PCB manufacturer. Mr. Bitter received a
bachelor of science degree in mathematics from Bucknell University and an M.B.A. from the Wharton School of the University of Pennsylvania.
Tarun Amla is the Executive Vice President and Chief Technology Officer of Isola, and is responsible for our global research and technology and global
OEM marketing programs with a focus on new product development. Prior to his current role, Mr. Amla served in various leadership capacities, including as Vice
138
Table of Contents
Management
President
of Operations and Technology and Vice President of Marketing and Technology. Prior to joining Isola, Mr. Amla was the Director of Operations for AlliedSignal Laminate Systems in
Singapore. During his more than twenty years in the electronics industry, Mr. Amla has gained extensive experience in general management, manufacturing operations, engineering, product
technology, marketing and sales. Mr. Amla received a bachelor of science degree in mechanical engineering from the National Institute of Technology Calicut in India, a master of science degree
in engineering from Arizona State University with an emphasis on modeling and simulation, a master of science degree in mechanical engineering with a concentration in computational mechanics from
Purdue University, and an M.B.A. from the Kellogg School of Management at Northwestern University.
Mathew LaRont is the President, Asia, a position he has held since June 2011. In July 2009, Mr. LaRont assumed additional responsibility as
Isola's Global Supply Chain Officer, a position that he still holds. In his current roles, Mr. LaRont is responsible for all aspects of our Asian operations and oversees our strategic global
supply chain, managing supply contracts and supplier licensing. Prior to his current position, Mr. LaRont served as the President, Americas and prior to that, Vice President, Sales and
Marketing—Asia. Mr. LaRont joined Isola in 2004. Prior to joining Isola, Mr. LaRont held various positions with Solectron Corporation, a global electronics manufacturing
company, including Director of Global Materials and General Manager in Taiwan. Prior to his tenure at Solectron Corporation, Mr. LaRont served as the Director of Sales and Operations for
Sanmina-SCI Corporation, a Nasdaq-listed integrated electronics manufacturing service provider, and held various managerial positions with Praegitzer Industries, Inc., including
Financial Controller and Regional Sales Manager for the West Coast. With over twenty years of electronics industry experience, Mr. LaRont brings a broad range of expertise to Isola.
Robert Chaney is the President, Americas, a position he has held since joining us in August 2011. In his current role, Mr. Chaney is responsible
for all sales, customer service and manufacturing operations in the Americas. Prior to joining Isola, Mr. Chaney was President of the PCB Interconnect Technologies division at
Sanmina-SCI Corporation, a position he held from June 2010 to December 2010. Prior to Sanmina-SCI, Mr. Chaney was President of First Mile Technologies, a provider of
Internet, security monitoring, fiber connectivity, phone, and cable television services, a position he held from January 2004 to June 2010. Mr. Chaney has held senior-level positions with a
number of other high-technology companies, including ATMI, Nanovation Technologies, AT&T and IBM. Mr. Chaney is a graduate of Purdue University and has more than twenty years of
experience in the electronics industry.
Karl Stollenwerk is the President, Europe, a position he has held since May 2009. In his current role, Mr. Stollenwerk is responsible for
managing all operations for the Isola and Isola Fabrics business in Europe. Before assuming his current position, Mr. Stollenwerk was Director of Sales, General Manager and Managing Director of
our Isola Dueren operation. Mr. Stollenwerk joined Isola in October 1987 and, during his more than twenty years with Isola, he has acquired extensive experience in marketing and sales in the
electronics industry. He has a broad knowledge of all customer-related aspects of the European PCB industry.
NONEMPLOYEE DIRECTORS
Kevin Burns has served as a member of our board of directors since September 2011, and served as a
member of the board of directors of the Sponsor Holding Company since June 2004. Mr. Burns has been a TPG Partner in the Operations Group since 2003, and was nominated to serve as our director
by TPG. In March 2008 he became the Partner in Charge of TPG's Manufacturing/Industry Sector. Prior to joining TPG, he served as Executive Vice President and Chief Materials Officer of Solectron
Corporation, an electronics manufacturing services provider. Prior to joining Solectron, Mr. Burns served as Vice President of Worldwide Operations of the Power Generation Business Unit of
Westinghouse Corporation, and President of Westinghouse Security Systems. Prior to Westinghouse, he was a consultant at McKinsey &
139
Table of Contents
Management
Company, Inc.
and spent three years at the General Electric Corporation in various operating roles. Mr. Burns received a bachelor of science degree in mechanical and metallurgical
engineering (cum laude) from the University of Connecticut and received an M.B.A. from the Wharton School of the University of Pennsylvania. He currently serves on the boards of directors of Armstrong
World Industries, Graphic Packaging Holding Co. and American Tire Distributors. From 2008 to 2011, Mr. Burns also served on the board of directors of Freescale Semiconductor Holdings
I, Ltd. Mr. Burns was selected to serve as a member of our board of directors because of his extensive management expertise and his knowledge of both our Company and industry.
Donald Colvin has served as a member of our board of directors since September 2011. Mr. Colvin joined ON Semiconductor and SCI LLC as
Senior Financial Director in March 2003 and served as Executive Vice President and Chief Financial Officer until August 2012. Before joining ON Semiconductor, beginning in 1998,
Mr. Colvin served as Vice President of Finance and Chief Financial Officer at Atmel Corporation, a manufacturer of advanced semiconductors. Mr. Colvin served as Chief Financial Officer
of a subsidiary of Atmel from 1995 to 1998. From 1985 to 1995, he held various positions with European Silicon Structures, most recently as Chief Financial Officer. Mr. Colvin also held various
financial positions with Motorola Semiconductors Europe from 1977 to 1985. Mr. Colvin holds a bachelor of arts degree in economics and an M.B.A. from the University of Strathclyde, Scotland.
From May 2007 to August 2011, Mr. Colvin served as a member of the board of directors of Applied Micro Circuits Corporation, a Nasdaq-listed provider of integrated circuits for processing,
transporting and storing information. Mr. Colvin was selected to serve as a member of our board of directors because of his finance and accounting expertise, managerial experience and knowledge
of our industry.
H. McIntyre Gardner has served as a member of our board of directors since September 2011. Mr. Gardner retired in 2008 from Merrill
Lynch & Co., Inc. as the Head of Americas Region and Global Bank Group, Global Private Client. Prior to joining Merrill Lynch in July 2000, Mr. Gardner was the President
and Chief Operating Officer of Helen of Troy Limited, a Nasdaq-listed personal care products manufacturer. Mr. Gardner has also been a member of the board of directors of Spirit Airlines, a
Nasdaq-listed provider of passenger airline services, since 2010. Mr. Gardner received a bachelor of arts degree from Dartmouth College. Mr. Gardner was selected to serve as a member of
our board of directors because of his financial management expertise, qualifications as a business executive and his prior experience as a director of both public and private companies.
Jordon Kruse has served as a member of our board of directors since September 2011, and served as a member of the board of directors of the Sponsor
Holding Company since October 2010. Mr. Kruse is a Managing Director at Oaktree Capital Management, LP, a Los Angeles based institutional money manager, and was nominated to serve as our
director by Oaktree Capital. He is a member of Oaktree's Principal Fund, which focuses on investments in private equity and distressed debt for control and is responsible for the aviation, packaging,
chemicals, building products and consumer apparel sectors. Prior to joining Oaktree in 2001, Mr. Kruse was an attorney at the law firm of Kirkland & Ellis LLP, which he joined in
1997. Mr. Kruse serves on the board of directors of Spirit Airlines, Inc., a Nasdaq-listed provider of passenger airline services, Dayton Superior Corporation, a manufacturer and
distributor of products used in concrete construction, Chesapeake UK Holding Ltd, a supplier of specialty paperboard packaging products in Europe, Nordenia International AG, a manufacturer of
plastic films and flexible packaging, BP Clothing LLC, an apparel company, Cyanco Corporation, a manufacturer of sodium cyanide used in the gold mining industry, and CF Group Inc., a
commercial furniture company. Mr. Kruse received a bachelor of arts degree from the University of Virginia and a J.D. from Northwestern University. Mr. Kruse was selected to serve as a
member of our board of directors because of his financial expertise, knowledge of our Company and his general business experience.
140
Table of Contents
Management
Jeffrey McCreary has served as a member of our board of directors since September 2011, and served as a member of the board of directors of the Sponsor
Holding Company since January 2006. Mr. McCreary is an independent management consultant who retired in 2005 as a Senior Vice President for Texas Instruments. In this capacity he was
responsible for Texas Instruments' sales and account management, field technical support and channel marketing strategies around the globe. Prior to joining Texas Instruments, Mr. McCreary held
engineering and strategic marketing positions within the Bell System. Mr. McCreary received a bachelor of science degree in electrical engineering and an honorary doctorate of engineering from
the Rose-Hulman Institute of Technology. Mr. McCreary served on the board of Gennum Corporation, a Toronto Stock Exchange-listed provider
of semiconductor products and intellectual property cores for consumer connectivity, enterprise, video broadcast and data communications applications, until Gennum was acquired by Semtech Corporation
in March 2012. Mr. McCreary was selected to serve as a member of our board of directors because of his international experience in business, his background in engineering, and his extensive
experience in the technology industry.
Timothy Millikin has served as a member of our board of directors and as a member of the board of directors of the Sponsor Holding Company since July
2012. Mr. Millikin was nominated to serve as our director by TPG. Mr. Millikin is a TPG Vice President in the Technology, Media and Telecom group. Mr. Millikin has been in his
present role at TPG since August 2011 and previously worked at TPG as an Associate from 2007 to 2009. Prior to joining TPG in 2007, Mr. Millikin worked in the Technology Mergers and
Acquisitions group at Morgan Stanley. Mr. Millikin holds a bachelor of arts degree in Economics from Dartmouth College and an M.B.A. from the Stanford Graduate School of Business, where he was
an Arjay Miller Scholar. Mr. Millikin was selected to serve as a member of our board of directors because of his finance and banking background and experience in the technology industry.
Cassidy Traub has served as a member of our board of directors since September 2011. Mr. Traub is a Vice President at Oaktree Capital
Management, LP, a Los Angeles based institutional money manager, and was nominated to serve as our director by Oaktree Capital. He is a member of Oaktree's Principal Fund, which focuses on
investments in private equity and distressed debt for control, and is responsible for the packaging, chemicals, technology and business services sectors. Prior to joining Oaktree in 2005,
Mr. Traub was an investment banker at UBS Investment Bank, which he joined in 2003. Mr. Traub serves on the board of directors of Crimson Exploration Inc., a Nasdaq-listed energy
company, Chesapeake UK Holding Ltd, a supplier of specialty paperboard packaging, and Cyanco Corporation, a manufacturer of sodium cyanide used in the gold mining industry. Mr. Traub
received a bachelor of arts degree in economics from Princeton University. Mr. Traub was selected to serve as a member of our board of directors because of his financial expertise, knowledge of
our Company and his general business experience.
COMPOSITION OF THE BOARD OF DIRECTORS
Controlled Company Exemption. After the completion of this offering, the Sponsors and their affiliates will control a majority of the voting power of our
outstanding ordinary shares (approximately % if the underwriters do not exercise their option to purchase additional shares). In addition, at the completion of this offering, we will
enter into a shareholders' agreement with our Sponsors that will give each of TPG and Oaktree the right to nominate representatives to our board of directors, and require all of our Sponsors to vote
for the election of these nominees to our board of directors, so long as TPG and Oaktree own specified percentages of our outstanding voting securities. See "Certain Relationships and Related Party
Transactions—Agreements with Our Sponsors—Shareholders and Registration Rights Agreement". As a result, we are a "controlled company" within the meaning of the Nasdaq corporate
governance standards. Under the Nasdaq rules, if more than 50% of the voting power of a listed company is held by an individual,
141
Table of Contents
Management
group
or another company, the listed company is a "controlled company" and may elect not to comply with certain Nasdaq corporate governance standards, including:
- –>
- the
requirement that a majority of our board of directors consist of independent directors;
- –>
- the
requirement that we have a nominating and corporate governance committee that is composed entirely of independent directors with a written charter addressing the
committee's purpose and responsibilities;
- –>
- the
requirement that we have a compensation committee that is composed entirely of independent directors with a written charter addressing the committee's purpose
and responsibilities; and
- –>
- the
requirement for an annual performance evaluation of the nominating and corporate governance and compensation committees.
We
have adopted charters for our audit, nominating and corporate governance and compensation committees, intend to conduct annual performance evaluations for these committees, and initially expect all
of our committee members and a majority of our board of directors to be considered independent directors under the independence criteria of Nasdaq. All of our directors, except
Mr. Sharpe, are considered independent directors. Although we intend to comply with these listing requirements whether or not we are a controlled company, there is no guarantee that we will not
take advantage of the controlled company exemptions in the future. Accordingly, you may not have the same protections afforded to shareholders of companies that are subject to all of the corporate
governance requirements of Nasdaq.
Any
director may be removed from office by our shareholders. Our Principal Sponsors are together the beneficial owners of a majority of our ordinary shares and will be able to unilaterally remove
directors.
BOARD COMMITTEES
Our board of directors has established an audit committee, a compensation committee and a corporate governance and nominating committee, as discussed
below.
Audit Committee. Our audit committee is responsible for, among other things, making recommendations concerning the engagement of our independent public
accountants, reviewing with the independent public accountants the plans and results of the audit engagement, approving professional services provided by the independent public accountants, reviewing
the independence of the independent public accountants, considering the range of audit and non-audit fees and reviewing the adequacy of our internal accounting controls. Our audit
committee is comprised of Messrs. Colvin (chairman), Gardner and McCreary, each of whom is a financial expert for purposes of the Nasdaq rules.
Compensation Committee. The compensation committee is primarily concerned with administering programs and policies regarding the compensation of executive officers
and employee benefit plans. The committee is responsible for determining compensation of our executive officers and other employees and overseeing the administration of all employee benefit plans and
programs. Our compensation committee is comprised of Messrs. Gardner (chairman), Burns and Kruse.
Corporate Governance and Nominating Committee. The corporate governance and nominating committee is primarily concerned with identifying individuals qualified to
become members of our board of directors, selecting the director nominees for the next annual meeting of the shareholders and
reviewing our corporate governance policies. The committee is responsible for reviewing director compensation and benefits, overseeing the annual self-evaluations of our board of directors
and making recommendations to the board concerning the structure and membership of the other board committees. Our corporate governance and nominating committee is comprised of Messrs. McCreary
(chairman), Millikin and Traub.
142
Table of Contents
Management
For
so long as we are a controlled company within the meaning of the Nasdaq listing standards, each of TPG and Oaktree have the right to designate one member to our compensation committee, and one
member to our corporate governance and nominating committee. See "Certain Relationships and Related Party Transactions—Agreements with Our Sponsors-Shareholders and Registration Rights
Agreement".
COMPENSATION COMMITTEE INTERLOCKS AND INSIDER PARTICIPATION
There are no compensation committee interlocks; no executive officer of ours serves as a member of the board of directors or the compensation
committee of another entity that has an executive officer serving on our board of directors.
143
Table of Contents
Executive Compensation
SUMMARY COMPENSATION TABLE
The following table sets forth information regarding the compensation of our named executive officers for fiscal 2010 and fiscal 2011:
|
|
|
|
|
|
|
|
|
|
|
|
|
|
|
|
|
|
|
|
|
|
|
|
|
|
|
Name and principal position
|
|
Year(1)
|
|
Salary ($)
|
|
Non-Equity
incentive plan
compensation(2)
($)
|
|
Stock
awards(3)(5) ($)
|
|
Option
awards(4)(5) ($)
|
|
All other
compensation(6) ($)
|
|
Change in
pension
value and
non-qualified
deferred
compensation
earnings
($)
|
|
Total
($)
|
|
| |
|
|
Raymond Sharpe |
|
|
2011 |
|
$ |
595,874 |
|
|
486,000 |
|
|
— |
|
|
— |
|
|
363,568 |
|
|
— |
|
$ |
1,445,442 |
|
| |
President and Chief
Executive Officer |
|
|
2010 |
|
$ |
556,871 |
|
|
983,455 |
|
|
689,409 |
|
|
2,028,431 |
|
|
45,882 |
|
|
— |
|
$ |
4,304,048 |
|
F. Gordon Bitter |
|
|
2011 |
|
$ |
339,231 |
|
|
198,900 |
|
|
— |
|
|
— |
|
|
— |
|
|
— |
|
$ |
538,131 |
|
| |
Executive Vice
President and Chief
Financial Officer |
|
|
2010 |
|
$ |
336,346 |
|
|
429,000 |
|
|
293,013 |
|
|
510,539 |
|
|
— |
|
|
— |
|
$ |
1,568,898 |
|
Mathew LaRont(7) |
|
|
2011 |
|
$ |
289,615 |
|
|
123,750 |
|
|
— |
|
|
— |
|
|
390,408 |
|
|
— |
|
$ |
803,773 |
|
| |
President, Asia and
Global Supply Chain
Officer; former
President, North
America |
|
|
2010 |
|
$ |
269,115 |
|
|
265,000 |
|
|
252,000 |
|
|
434,900 |
|
|
5,504 |
|
|
— |
|
$ |
1,226,519 |
|
- (1)
- The base salary amounts and Mr. Sharpe's stipend reflect the fact that fiscal 2010 had 53 weeks. Fiscal 2011 was a 52-week year.
- (2)
- Represents cash bonuses paid under our Bonus Plans.
- (3)
- Represents restricted limited partner common units in the Sponsor Limited Partnership.
- (4)
- Represents options to purchase limited partner common units in the Sponsor Limited Partnership.
- (5)
- The amounts shown reflect the incremental fair value of each new award granted to our named executive officers in the fourth quarter of 2010 under the Sponsor
Limited Partnership's
2010 Option Plan in exchange for the cancellation of each existing award held by our named executive officers in the fourth quarter of 2010 granted under the Sponsor Limited Partnership's 2004 Option
Plan, computed in accordance with the provisions of FASB ASC Topic 718. Assumptions used in the calculation of these amounts are included in Note 9 to our consolidated annual financial
statements included in this prospectus. As required by SEC rules, the amounts shown exclude the impact of estimated forfeitures related to service-based vesting conditions.
144
Table of Contents
Executive Compensation
- (6)
- Components of the All Other Compensation column for 2010 and 2011 include life insurance premiums paid by the Company for the benefit of named executive officers, matching
contributions made by the Company to the named executive officers' 401(k) Plan accounts, perquisites, and the repurchase of profits interest units.
|
|
|
|
|
|
|
|
|
|
|
|
|
|
|
|
|
|
|
|
Name
|
|
Year
|
|
Life Insurance
Premium
($)
|
|
401(k)
Plan match
($)
|
|
Perquisites
($)
|
|
Profits Interest
Unit Repurchase
($)
|
|
Total
($)
|
|
| |
|
Raymond Sharpe |
|
|
2011 |
|
$ |
7,057 |
|
|
8,184 |
|
|
35,000 |
(a) |
|
313,327 |
|
$ |
363,568 |
|
|
|
|
2010 |
|
$ |
7,057 |
|
|
3,152 |
|
|
35,673 |
(b) |
|
— |
|
$ |
45,882 |
|
Mathew LaRont |
|
|
2011 |
|
$ |
— |
|
|
7,304 |
|
|
383,104 |
(c) |
|
— |
|
$ |
390,408 |
|
|
|
|
2010 |
|
$ |
— |
|
|
5,504 |
|
|
— |
|
|
— |
|
$ |
5,504 |
|
- (a)
- Under the terms of Mr. Sharpe's employment agreement, in 2011 he received an annual stipend of $35,000, which was paid in monthly installments, for a country club membership
and a car allowance.
- (b)
- Under the terms of Mr. Sharpe's employment agreement, in 2010 he received an annual stipend of $35,673, which was paid in monthly installments, for a country
club membership
and a car allowance.
- (c)
- Represents the aggregate value during 2011 of all perquisites provided to Mr. LaRont, including: (i) $12,128 for a club membership; (ii) $119,633 for
rent,
utilities and other housing-related expenses; (iii) overseas allowance of $6,154; (iv) a $50,000 relocation bonus; (v) $24,485 for reimbursement for school tuition;
(vi) $72,586 for relocation expenses; and (vii) $98,118 of income tax paid by the Company for the prerequisites excluding overseas allowances.
- (7)
- Mr. LaRont served as President, North America and Global Supply Chain Officer during 2010. He currently serves as President, Asia and Global Supply Chain Officer.
Narrative Explanation of Certain Aspects of Summary Compensation Table
Sponsor Limited Partnership Equity Compensation Awards
Historically, our equity compensation awards granted to executive officers and other employees have been made through awards to purchase limited
partnership units in the Sponsor Limited Partnership. Prior to completion of this offering, the Sponsor Limited Partnership owns 100% of our current Luxembourg Holding Company, and is wholly-owned by
the Sponsor Holding Company. In connection with the completion of this offering, our new Cayman Islands company, Isola Group Ltd., has established a new equity incentive plan that will allow
our executive management to receive equity awards, such as stock options, restricted stock and restricted stock units for ordinary shares of Isola Group Ltd. All of the existing ownership
interests and equity awards of executive management and other employees in the Sponsor Limited Partnership, including the options and restricted units, will, concurrent with this offering, be
converted into equivalent ordinary shares and awards for ordinary shares, respectively, of Isola Group Ltd., which will be publicly traded.
Bonus Plans
Prior to this offering, the members of the Sponsor Holding Company's board of managers, which we refer to in this section as our board of directors,
established a Bonus Plan for each of fiscal 2010 and fiscal 2011, in which our named executive officers and other executives participated. The award opportunities for each participant are expressed as
a percentage of base salary. We chose Consolidated Adjusted EBITDA (as defined under our senior secured credit agreement) as the sole criterion to determine awards because of its emphasis on
operational earnings and its ability to serve as a proxy for "cash flow". Achieving a certain level of Consolidated Adjusted
EBITDA is also an element of a key covenant of our principal credit agreements, so its use as the criterion for the 2010 Bonus Plan and 2011 Bonus Plan aligned the interest of our executives with the
corporate objective of ensuring compliance with these agreements.
145
Table of Contents
Executive Compensation
Consolidated
Adjusted EBITDA (as defined under our senior secured credit agreement) is different than Adjusted EBITDA used elsewhere in this prospectus. "Consolidated Adjusted EBITDA" is
defined as our net income / (loss) plus (i) interest expense and interest income, net, (ii) provision for income taxes, (iii) depreciation and amortization, (iv) certain
adjustments for stock-based compensation, restructuring charges, foreign exchange gain / (loss)—net, goodwill impairment, management fees paid to TPG, embedded derivatives gain /
(loss)—net, gain related to a settlement of a patent infringement matter and pre-IPO expenses and (v) certain additional adjustments for pension expense, other taxes
(such as property and withholding taxes on cash remittances from our foreign subsidiaries), certain non-recurring losses as defined by the credit agreement and certain transaction costs.
The
2010 Bonus Plan had three target levels of Consolidated Adjusted EBITDA for determining bonus awards:
- •
- a "threshold" level of Consolidated Adjusted EBITDA of $40.0 million, below which no bonus could be earned;
- •
- a "target" level of Consolidated Adjusted EBITDA of $53.0 million, above which a bonus could be earned; and
- •
- a "maximum" level of Consolidated Adjusted EBITDA of $65.0 million, beyond which no additional bonus could
be earned.
Each
target level of Consolidated Adjusted EBITDA for fiscal 2010 was tied to our fiscal 2010 financial plan. Awards for attainment of Consolidated Adjusted EBITDA between the threshold and the target
would have been determined by straight line interpolation, as would have been awards for attainment of Consolidated Adjusted EBITDA between target and maximum.
At
the time that bonuses were awarded, Consolidated Adjusted EBITDA for fiscal 2010 was estimated to be $101.8 million, well in excess of the $65.0 million maximum credited level of
Consolidated Adjusted EBITDA achievement, so our named executive officers received the maximum bonuses achievable under the 2010 Bonus Plan in fiscal 2010.
The
2011 Bonus Plan had three target levels of Consolidated Adjusted EBITDA for determining bonus awards:
- •
- a "threshold" level of Consolidated Adjusted EBITDA of $83.0 million, below which no bonus could be earned;
- •
- a "target" level of Consolidated Adjusted EBITDA of $110.7 million, above which a bonus could be earned; and
- •
- a "maximum" level of Consolidated Adjusted EBITDA of $127.3 million, beyond which no additional bonus could
be earned.
Each
target level of Consolidated Adjusted EBITDA for fiscal 2011 was tied to our fiscal 2011 financial plan. Awards for attainment of Consolidated Adjusted EBITDA between the threshold and the target
would have been determined by straight line interpolation, as would have awards for attainment of Consolidated Adjusted EBITDA between target and maximum.
At
the time that bonuses were awarded, Consolidated Adjusted EBITDA for fiscal 2011 was estimated to be $98.4 million, which was above the "threshold" level but below the "target" level for
awards under the bonus plan. Accordingly, the executive officers received bonus awards, which were determined by a straight-line interpolation between the "Threshold" level and the
"Target" level of Consolidated Adjusted EBITDA.
146
Table of Contents
Executive Compensation
Employee Benefit Plans
Our named executive officers are eligible to participate in our employee benefit plans on the same terms as our other employees. These benefits
include a 401(k) plan, group health insurance and short- and long-term disability insurance. We do not have an active defined benefit retirement plan.
OUTSTANDING EQUITY AWARDS AS OF THE END OF FISCAL 2011
The following table provides information concerning unexercised option awards and stock awards that have not vested for each of our named executive
officers as of December 31, 2011:
|
|
|
|
|
|
|
|
|
|
|
|
|
|
|
|
|
|
Option awards(1) |
|
|
|
|
|
|
|
Number of
securities
underlying
unexercised
options (#)
exercisable
|
|
|
|
|
|
|
|
Stock awards(2) |
|
Name
|
|
Unexercisable (#)
|
|
Option exercise
price ($)
|
|
Option expiration
date
|
|
Number of
stock awards
held that have
not vested (#)
|
|
Market value of
stock awards
held that have
not yet vested ($)(3)
|
|
| |
|
Raymond Sharpe |
|
1,922,367 |
|
3,844,733 |
|
$ |
0.49 |
|
10/8/2020 |
|
1,094,300 |
|
$ |
733,181 |
|
F. Gordon Bitter |
|
512,633 |
|
1,025,267 |
|
|
0.49 |
|
10/8/2020 |
|
465,100 |
|
|
311,617 |
|
Mathew LaRont |
|
400,000 |
|
800,000 |
|
|
0.49 |
|
10/8/2020 |
|
400,000 |
|
|
268,000 |
|
- (1)
- Represents options to purchase limited partner common units in the Sponsor Limited Partnership. Each of the option grants shown in the table vests over a period of three years in
equal installments on the anniversary date of the grant (i.e., the first third of the grant vested on October 8, 2011, the second third of the grant vests on October 8, 2012 and
the remaining third of the grant vests on October 8, 2013).
- (2)
- Represents restricted limited partner common units in the Sponsor Limited Partnership. Each of the restricted unit grants shown in the table vests over a period of
three years in
equal installments on the anniversary date of the grant (i.e., the first third of the grant vests on October 8, 2011, the second third of the grant vests on October 8, 2012 and
the remaining third of the grant vests on October 8, 2013), provided that there has been either (i) a change in control or (ii) an initial public offering of equity securities of
the Company and that the participant may sell such securities in a public market free of any "market stand-off" or "lock-up" restrictions.
- (3)
- Represents the estimated market value of the restricted limited partner common units in the Sponsor Limited Partnership as of December 31, 2011.
147
Table of Contents
Executive Compensation
EMPLOYMENT AGREEMENTS AND CHANGE IN CONTROL ARRANGEMENTS
Raymond Sharpe. We entered into an employment agreement with Raymond Sharpe, our President and Chief Executive Officer, on June 2, 2004, which was amended
and restated as of August 11, 2008 and amended on December 19, 2011 and April 1, 2012. If we terminate Mr. Sharpe's employment without cause, he is entitled to receive his
base salary at the monthly rate in effect as of the date of termination for a period of eighteen months. If we terminate Mr. Sharpe's employment without cause or he resigns for good reason
within two years following a change in control, then Mr. Sharpe is entitled to a lump sum payment equal to 1.5 times his annual base salary at the date of termination plus his target bonus. In
addition, for the eighteen month period following the date of termination, he is entitled to continued medical benefits that he was receiving at the date of termination. We pay Mr. Sharpe an
annual stipend of $35,000 for a country club membership and a car allowance. Mr. Sharpe's employment agreement also includes non-competition and non-solicitation
covenants by Mr. Sharpe for a one-year period following termination of his employment with us for any reason.
F. Gordon Bitter. We entered into an employment agreement with F. Gordon Bitter, our Executive Vice President and Chief Financial Officer, on June 30, 2009,
which was amended on December 16, 2011. If we terminate Mr. Bitter's employment without cause or he resigns for good reason following a change in control, Mr. Bitter is entitled
to receive his current monthly base salary for a period of 12 months in accordance with our normal payroll practices. During the period in which he is receiving severance benefits from us,
Mr. Bitter is eligible to continue to participate in the health and benefit coverage that is available to our employees. Mr. Bitter's employment agreement also includes
non-competition and non-solicitation covenants by Mr. Bitter for a one-year period following termination of his employment with us for any reason.
Mathew LaRont. We entered into an employment agreement with Mathew LaRont, our President, Asia and Global Supply Chain Officer on April 30, 2007, which was
amended on December 20, 2011. If we terminate Mr. LaRont's employment without cause, Mr. LaRont is entitled to receive his current monthly base salary for a period of
12 months in accordance with our normal payroll procedures. During the period in which he is receiving severance benefits from us, Mr. LaRont is eligible to continue to participate in
the health and benefit coverage that is available to our employees. Mr. LaRont's employment agreement also includes non-competition and non-solicitation covenants by
Mr. LaRont for a one-year period following termination of his employment with us for any reason.
EQUITY INCENTIVE PLANS
Our 2012 Equity Incentive Plan, or the 2012 Plan, was approved by the new board of directors in October 2011. It is intended to make available
incentives that will assist us to attract, retain and motivate employees, including officers, consultants and directors. We may provide these incentives through the grant of share options, share
appreciation rights, restricted shares, restricted share units, performance shares and units, and other cash-based or share-based awards.
A
total of ordinary shares will be initially authorized and reserved for issuance under the
2012 Plan. This reserve will automatically increase on January 1, 2013 and each
subsequent anniversary through 2021, by an amount equal to the smaller of (i) 3.0% of the number of ordinary shares issued and outstanding on the immediately preceding December 31, or
(ii) a lesser amount determined by the board.
Appropriate
adjustments will be made in the number of authorized shares and other numerical limits in the 2012 Plan and in outstanding awards to prevent dilution or enlargement of participants' rights
in the event of a share split or other change in our capital structure. Shares subject to awards which expire or are cancelled or forfeited will again become available for issuance under the 2012
Plan. The shares available will not be reduced by awards settled in cash or by shares withheld to satisfy tax withholding obligations.
148
Table of Contents
Executive Compensation
Only
the net number of shares issued upon the exercise of share appreciation rights or options exercised by means of a net exercise or by tender of previously owned shares will be deducted from the
shares available under the 2012 Plan.
The
2012 Plan is generally administered by the compensation committee of our board of directors. Subject to the provisions of the 2012 Plan, the compensation committee determines in its discretion the
persons to whom and the times at which awards are granted, the sizes of such awards, and all of their terms and conditions. The compensation committee has the authority to construe and interpret the
terms of the 2012 Plan and awards granted under it. The 2012 Plan provides, subject to certain limitations, for indemnification by the Company of any director, officer or employee against all
reasonable expenses, including attorneys' fees, incurred in connection with any legal action arising from such person's action or failure to act in administering the 2012 Plan.
The
2012 Plan authorizes the compensation committee, without further shareholder approval, to provide for the cancellation of underwater share options or share appreciation rights in exchange for new
at-the-money options or other equity awards or a cash payment.
Awards
may be granted under the 2012 Plan to our employees, including officers, directors, or consultants or those of any present or future parent or subsidiary corporation or other affiliated entity.
All awards are evidenced by a written agreement between us and the holder of the award and may include any of the following:
- –>
- Share Options. We may grant nonstatutory share options or incentive share options (as described in Section 422
of the United Stated Internal Revenue Code), each of which gives its holder the right, during a specified term (not exceeding 10 years) and subject to any specified vesting or other conditions,
to purchase a number of ordinary shares at an exercise price per share determined by the administrator, which may not be less than the fair market value of an ordinary share on the date of grant.
- –>
- Share Appreciation Rights. A share appreciation right gives its holder the right, during a specified term (not
exceeding 10 years) and subject to any specified vesting or other conditions, to receive the appreciation in the fair market value of our ordinary shares between the date of grant of the award
and the date of its exercise. We may pay the appreciation in ordinary shares or in cash.
- –>
- Restricted Shares. The administrator may grant restricted share awards either as a bonus or as a purchase right at
such price as the administrator determines. Restricted shares remain subject to forfeiture until vested, based on such terms and conditions as the administrator specifies. Holders of restricted shares
will have the right to vote the shares and to receive any dividends paid, except that the dividends may be subject to the same vesting conditions as the related shares.
- –>
- Restricted Share Units. Restricted share units represent rights to receive ordinary shares (or their value in cash)
at a future date without payment of a purchase price, subject to vesting or other conditions specified by the administrator. Holders of restricted share units have no voting rights or rights to
receive cash dividends unless and until ordinary shares are issued in settlement of such awards. However, the administrator may grant restricted share units that entitle their holders to dividend
equivalent rights.
- –>
- Performance Shares and Performance Units. Performance shares and performance units are awards that will result in a payment to their holder only if specified performance goals are achieved during a specified performance period. Performance share awards are rights
denominated in ordinary shares, while performance unit awards are rights denominated in currency. The administrator establishes the applicable performance goals based on one or more measures of
business performance enumerated in the 2012 Plan, such as revenue, gross margin, net income or total shareholder return. To the extent earned, performance share and unit awards may be settled in cash
or in ordinary shares. Holders of
149
Table of Contents
Executive Compensation
performance
shares or performance units have no voting rights or rights to receive cash dividends unless and until ordinary shares are issued in settlement of such awards.
- –>
- Cash-based Awards and Other Share-based Awards. The administrator may grant cash-based awards
that specify a monetary payment or range of payments or other share-based awards that specify a number or range of shares or units that, in either case, are subject to vesting or other conditions
specified by the administrator. Settlement of these awards may be in cash or ordinary shares, as determined by the administrator. Their holder will have no voting rights or right to receive cash
dividends unless and until our ordinary shares are issued pursuant to the award. The administrator may grant dividend equivalent rights with respect to other share-based awards.
In
the event of a change in control as described in the 2012 Plan, the acquiring or successor entity may assume or continue all or any awards outstanding under the 2012 Plan or substitute
substantially equivalent awards. Any awards that are not assumed or continued in connection with a change in control or are not exercised or settled prior to the change in control will immediately
vest and become exercisable in full as of, and if applicable shall be settled upon, the day immediately prior to the change in control, subject to additional terms and conditions for compensation
provided pursuant to an award that constitutes nonqualified deferred compensation within the meaning of Section 409A of the Internal Revenue Code. The compensation committee may provide for the
acceleration of vesting of any or all outstanding awards upon such terms and to such extent as it determines, except that the vesting of all awards held by members of the board of directors who are
not employees will automatically be accelerated in full. The 2012 Plan also authorizes the compensation committee, in its discretion and without the consent of any participant, to cancel each or any
outstanding award
denominated in shares upon a change in control in exchange for a payment to the participant with respect to each share subject to the canceled award of an amount equal to the excess of the
consideration to be paid per ordinary share in the change in control transaction over the exercise price per share, if any, under the award. In the event of the involuntary termination upon or within
12 months following a change of control of a participant who holds an award that has been assumed, continued or substituted by an acquirer or that remains subject to vesting under the vesting
schedule applicable to such award, such award shall become immediately vested and exercisable in full as of the date on which the participant's service terminated, and may be exercised or shall be
settled during the period applicable to such award under the terms of the 2012 Plan and the applicable award agreement.
The
2012 Plan will continue in effect until it is terminated by the administrator, provided, however, that all awards will be granted, if at all, within 10 years of its effective date. The
administrator may amend, suspend or terminate the 2012 Plan at any time, provided that without shareholder approval, the plan cannot be amended to increase the number of shares authorized, change the
class of persons eligible to receive incentive share options or effect any other change that would require shareholder approval under any applicable law or listing rule.
DIRECTOR COMPENSATION
Historically, other than Jeffrey McCreary, we have not compensated our non-employee directors for their service on our board of
directors. Upon his appointment to our board of directors in 2006, Mr. McCreary received 15,000 fully-vested partnership units. In addition, from January 2006 through September 2010,
Mr. McCreary received an annual cash retainer of $16,000 and received a meeting fee of $4,000 for each board meeting that he attended and, effective October 2010, Mr. McCreary began
receiving an annual cash retainer of $75,000, which is paid in quarterly installments, and stopped receiving a separate meeting fee. In 2011, as part of our efforts to attract and retain additional
highly qualified individuals to our new board of directors, we adopted a director compensation policy that provides for cash and equity compensation to our non-employee directors.
150
Table of Contents
Executive Compensation
The
purpose of our non-employee director compensation policy is to provide a total compensation package that enables us to attract and retain, on a long-term basis, high
caliber directors who are not employees or officers. Under our policy, our non-employee
directors who are not associated with our Sponsors were entitled to cash compensation as set forth below for 2011:
|
|
|
|
Board of directors
|
|
Annual cash
retainer
|
|
| |
|
Directors |
|
$75,000 |
|
| |
|
|
|
|
|
|
|
|
Board committees
|
|
Annual cash
retainer
|
|
| |
|
Audit Committee Chairperson |
|
$ |
15,000 |
|
Compensation Committee Chairperson |
|
|
15,000 |
|
Nominating and Corporate Governance Committee Chairperson |
|
|
5,000 |
|
Other Audit, Compensation and Nominating and Corporate Governance Committee Members |
|
|
0 |
|
|
|
|
|
|
Meetings
|
|
Per meeting
attendance fee
|
|
| |
|
Board Meetings |
|
$ |
0 |
|
Board Committee Meetings |
|
|
0 |
|
In addition, each unaffiliated non-employee director is also entitled to annual compensation of $25,000 in restricted shares, with the first share
grant effective at the close of market on the day this offering is completed. These awards vest in equal installments on the first three anniversaries of the date of grant provided the director
remains on our board of directors at such time, and are subject to the terms and conditions of our 2012 Equity Incentive Plan.
We
also reimburse all non-employee directors for their reasonable out-of-pocket expenses incurred in attending meetings of our board of directors or any committees
thereof.
We
do not pay any compensation for serving on our board of directors to any employee directors or any director that is employed by one of our Sponsors. Accordingly, Mr. Sharpe does not receive
additional compensation for his services as a member of our board of directors.
151
Table of Contents
Executive Compensation
The
following table sets forth a summary of the compensation we paid to our non-employee directors in 2011:
Non-employee Director Compensation Table—2011
|
|
|
|
|
|
|
|
Name
|
|
Fees earned or
paid in cash(1)
|
|
Total
|
|
| |
|
Kevin Burns |
|
|
— |
|
|
— |
|
Donald Colvin |
|
$ |
37,500 |
|
$ |
37,500 |
|
H. McIntyre Gardner |
|
$ |
37,500 |
|
$ |
37,500 |
|
Jordon Kruse |
|
|
— |
|
|
— |
|
Jeffrey McCreary |
|
$ |
75,000 |
|
$ |
75,000 |
|
Timothy Millikin |
|
|
— |
|
|
— |
|
Cassidy Traub |
|
|
— |
|
|
— |
|
- (1)
- Represents the annual retainer earned by the respective director in 2011. The fees earned by Messrs. Gardner and Colvin reflect that their service as directors began in July
2011. No committee fees were paid in 2011 because the committees did not meet.
DIRECTOR LIMITATION OF LIABILITY AND INDEMNIFICATION ARRANGEMENTS
Our articles of association provide for, in the absence of knowing or reckless breach of duty or fraud, the indemnification of our directors and
officers against liabilities, actions, proceedings, claims, damages, costs or expenses incurred by reason of any act or failure to act in the discharge of such directors' or officers' duties.
We
have also entered into indemnification agreements with each of our directors. These agreements provide that we will indemnify each of our directors to the fullest extent permitted by the laws of
the Cayman Islands and advance expenses to each indemnitee in connection with any proceeding in which indemnification is available.
We
also maintain general liability insurance to provide insurance coverage to our directors and officers for losses arising out of claims based on acts or omissions in their capacities as directors or
officers, including liabilities under the Securities Act of 1933, as amended (the "Securities Act"). Insofar as indemnification for liabilities arising under the Securities Act may be permitted to
directors, officers, or persons controlling the registrant pursuant to the foregoing provisions, we have been informed that in the opinion of the SEC such indemnification is against public policy as
expressed in the Securities Act and is therefore unenforceable.
These
provisions may discourage shareholders from bringing a lawsuit against our directors in the future for any breach of their fiduciary duty. These provisions may also have the effect of reducing
the likelihood of derivative litigation against directors and officers, even though such an action, if successful, might otherwise benefit us and our shareholders. Furthermore, a shareholder's
investment may be adversely affected to the extent we pay the costs of settlement and damage awards against directors and officers pursuant to these indemnification provisions. We believe that these
provisions, the indemnification agreements and the insurance are necessary to attract and retain talented and experienced directors and officers.
At
present, there is no pending litigation or proceeding involving any of our directors or officers in which indemnification will be required or permitted. We are not aware of any threatened
litigation or proceeding that might result in a claim for such indemnification.
152
Table of Contents
Principal Shareholders
Prior to this offering, a substantial amount of the investment in Isola is represented by convertible preferred certificates issued
by Isola's current Luxembourg Holding Company to the Sponsor Limited Partnership, which is controlled by our Sponsors. Immediately prior to this offering, we will reorganize as Isola
Group Ltd., a Cayman Islands company, and all of the outstanding securities of the Luxembourg Holding Company, including the common shares and these convertible preferred certificates will be
effectively converted into ordinary shares of Isola Group Ltd., as described in "Prospectus Summary—Concurrent Transactions—Corporate Reorganization" (the "Corporate
Reorganization and Conversion").
The
following table provides information concerning beneficial ownership of our ordinary shares after giving effect to the Corporate Reorganization and Conversion (i) as of immediately prior to
the consummation of this offering, and (ii) as adjusted to reflect the sale of ordinary shares in this offering, by:
- –>
- each
shareholder, or group of affiliated shareholders, that owns more than 5% of the outstanding ordinary shares;
- –>
- each
of our named executive officers;
- –>
- each
of our directors; and
- –>
- all
of our directors and executive officers as a group.
The
following table lists the number of shares and percentage of shares beneficially owned after giving effect to the Corporate Reorganization and Conversion based on (i)
ordinary shares outstanding immediately prior to the consummation of this offering and (ii) ordinary shares outstanding upon the completion of this offering.
Beneficial
ownership is determined in accordance with the rules of the SEC, and generally includes voting power and/or investment power with respect to the securities held. Ordinary shares subject to
options or other awards that are currently exercisable or exercisable within 60 days
of , 2012 are deemed outstanding and beneficially owned by the person holding those
options
or other awards for purposes of computing the number of shares and percentage of shares beneficially owned by that person, but are not deemed outstanding for purposes of computing the percentage
beneficially owned by any other person. Except as indicated in the footnotes to this table, and subject to applicable community property laws, the persons or entities named have sole voting and
investment power with respect to all of our ordinary shares shown as beneficially owned by them.
|
|
|
|
|
|
|
|
|
|
|
|
Ordinary shares beneficially owned |
|
|
|
|
|
Percent |
|
Name
|
|
Number
|
|
Before
offering(1)
|
|
After
offering(1)(2)
|
|
| |
|
5% Shareholders |
|
|
|
|
|
|
|
|
|
TPG Funds(3)
c/o TPG Global, LLC
301 Commerce Street, Suite 3300
Fort Worth, Texas 71602 |
|
|
|
|
|
% |
|
|
% |
OCM PF Laminates, L.P.(5)
333 S. Grand Ave., 28th Floor
Los Angeles, CA90071 |
|
|
|
|
|
|
|
|
|
153
Table of Contents
Principal Shareholders
|
|
|
|
|
|
|
|
|
|
|
|
Ordinary shares beneficially owned |
|
|
|
|
|
Percent |
|
Name
|
|
Number
|
|
Before
offering(1)
|
|
After
offering(1)(2)
|
|
| |
|
Directors and Named Executive Officers |
|
|
|
|
|
|
|
|
|
Raymond Sharpe(6) |
|
|
|
|
* |
|
|
* |
|
F. Gordon Bitter(7) |
|
|
— |
|
* |
|
|
* |
|
Mathew LaRont(8) |
|
|
— |
|
* |
|
|
* |
|
Kevin Burns(4) |
|
|
|
|
|
|
|
|
|
Timothy Millikin(4) |
|
|
|
|
|
|
|
|
|
Jordon Kruse(5) |
|
|
|
|
|
|
|
|
|
Cass Traub(5) |
|
|
— |
|
|
|
|
|
|
Jeff McCreary(9) |
|
|
— |
|
* |
|
|
* |
|
Donald Colvin |
|
|
— |
|
— |
|
|
— |
|
McIntyre Gardner |
|
|
— |
|
— |
|
|
— |
|
All current directors and executive officers as a group (12 persons) |
|
|
|
|
|
% |
|
|
% |
- *
- Denotes beneficial ownership of less than 1%.
- (1)
- Except as otherwise indicated herein, the address for each of the named beneficial owners is c/o Isola Group Ltd. 3100 W. Ray Road, Suite 301, Chandler,
Arizona 85226.
- (2)
- Assumes that the underwriters' option to purchase additional shares has not been exercised.
- (3)
- Includes (i)
ordinary shares of the Company held by TPG IV Hattrick AIV, L.P., a Cayman
Islands exempted limited partnership ("Hattrick IV"),
(ii) ordinary shares of the Company held by TPG Partners IV, L.P., a Delaware
limited partnership ("Partners IV"), (iii) ordinary shares of the
Company held by TPG FOF IV, L.P., a Delaware limited partnership ("FOF IV"), (iv)
ordinary shares of the Company held by T3 Partners II, L.P., a
Delaware limited partnership ("Partners II"), (v) ordinary shares of the Company
held by T3 II Hattrick AIV, L.P., a Cayman Islands exempted limited
partnership ("Hattrick II"), and (vi) ordinary shares of the Company held by
T3 Parallel II, L.P., a Delaware limited partnership, ("Parallel II" and,
together with Hattrick IV, Partners IV, FOF IV, Partners II and Hattrick II, the "TPG Funds") (such shares, collectively, the "TPG Shares"). The general partner of Hattrick IV is TPG GenPar IV
Cayman, L.P., a Cayman Islands exempted limited partnership, whose general partner is TPG GenPar IV-AIV Advisors, Inc., a Cayman Islands exempted company, whose sole
shareholder is TPG Holdings I, L.P., a Delaware limited partnership ("Holdings I"), whose general partner is TPG Holdings I-A, LLC, a Delaware limited liability company,
whose sole member is TPG Group Holdings (SBS), L.P., a Delaware limited partnership, whose general partner is TPG Group Holdings (SBS) Advisors, Inc. ("Group Advisors"). The general
partner of each of Partners IV and FOF IV is TPG GenPar IV, L.P., a Delaware limited partnership, whose general partner is TPG GenPar IV Advisors, LLC, a Delaware limited liability
company, whose sole member is Holdings I. The general partner of each of Partners II, Hattrick II and Parallel II is T3 GenPar II, L.P., a Delaware limited partnership, whose
general partner is T3 Advisors II, Inc., a Delaware corporation ("Advisors II"). David Bonderman and James G. Coulter are directors, officers and sole shareholders of Group
Advisors and Advisors II and may therefore be deemed to be beneficial owners of the TPG Shares. Messrs. Bonderman and Coulter disclaim beneficial ownership of the TPG Shares except to the
extent of their pecuniary interest therein. The address of Group Advisors, Advisors II and Messrs. Bonderman and Coulter is c/o TPG Global, LLC, 301 Commerce Street, Suite 3300,
Fort Worth, TX 76102.
- (4)
- Kevin Burns is a TPG Partner and Timothy Millikin is a TPG Vice President. Neither Mr. Burns nor Mr. Millikin has voting or investment power over, and each
disclaims
beneficial ownership of, the TPG Shares. The address of each of Messrs. Burns and Millikin is c/o TPG Global, LLC, 301 Commerce Street, Suite 3300, Fort Worth, TX 76102.
- (5)
- Includes ordinary shares held directly by OCM PF Laminates, L.P., Howard S. Marks,
Bruce A. Karsh, Sheldon M. Stone, Larry W. Keele, Stephen A. Kaplan, John B.
Frank, David M. Kirchheimer and Kevin L. Clayton, whom we refer to collectively as the "Oaktree Management Group" because they are members of the executive committee of Oaktree Capital Group
Holdings GP, LLC. Oaktree Capital Group Holdings GP, LLC is the general partner of Oaktree Capital Group Holdings, L.P. Oaktree Capital Group Holdings, L.P.
is the holder of the majority of the voting units of Oaktree Capital Group, LLC. Oaktree Capital Group, LLC is the managing member of Oaktree Holdings, LLC. Oaktree
Holdings, LLC is the managing member of OCM Holdings I, LLC. OCM Holdings I, LLC is the general partner of Oaktree Capital I, L.P. Oaktree Capital I, L.P. is the
154
Table of Contents
Principal Shareholders
general partner of Oaktree Fund GP I, L.P. Oaktree Fund GP I, L.P. is the managing member of Oaktree Fund GP, LLC. Oaktree Fund GP, LLC is the
general partner of OCM PF Laminates, L.P. As such, each such entity and each member of the Oaktree Management Group may be deemed to have voting and dispositive power over the ordinary shares
held by OCM PF Laminates, L.P. Each such entity and each member of the Oaktree Management Group disclaims beneficial ownership of the ordinary shares of the Company except to the extent of any
pecuniary interest therein.
Each entity listed herein whose shares are beneficially owned by the Oaktree Management Group has a principal business address of: c/o Oaktree Capital Management, 333 S. Grand Avenue, Los Angeles,
California 90071.
- (6)
- Includes ordinary shares.
- (7)
- Includes ordinary shares
and ordinary shares that may be acquired upon the exercise of options exercisable within 60 days
after ,
2012.
- (8)
-
Includes ordinary shares
and ordinary shares that may be acquired upon the exercise of options exercisable within 60 days
after ,
2012.
- (9)
- Includes ordinary shares
and ordinary shares that may be acquired upon the exercise of options exercisable within 60 days
after ,
2012.
155
Table of Contents
Certain Relationships and Related Party Transactions
Since December 28, 2008, there has not been any transaction, nor is there any proposed transaction to which we were or will be
a party in which the amount involved exceeded or will exceed $120,000 and in which any director, executive officer, holder of more than 5% of any class of our voting securities, or any member of the
immediate family of any of the foregoing persons had or will have a direct or indirect material interest, other than (i) as set forth below or (ii) the compensation, employment and other
agreements and transactions, which are described in "Management" and "Executive Compensation" elsewhere in this prospectus.
AGREEMENTS WITH OUR SPONSORS
TPG Management Agreement
In January 2005, we entered into a management agreement with TPG, pursuant to which TPG provides financial, advisory and consulting services to us
(the "TPG Management Agreement"). These services include executive and management services; the design of our equity capital structure and assistance with analysis of our structure for tax purposes;
identification, support and analysis of acquisitions and dispositions; support and analysis of financing alternatives; finance functions, including assistance in the preparation of financial
projections, and monitoring of compliance with financing agreements; and various human resource functions, including
the identification and hiring of directors and executive officers. There are no minimum levels of service required to be provided pursuant to the TPG Management Agreement.
The
TPG Management Agreement also includes customary indemnification provisions in favor of TPG, and customary limitations of TPG's liability for services rendered under the TPG Management Agreement
provided TPG is not grossly negligent or engages in willful misconduct.
Pursuant to the TPG Management Agreement we are required to pay TPG an aggregate annual monitoring fee of $2.0 million, plus reasonable out-of-pocket expenses of up to
$50,000 per year. These fees and expenses are payable on a quarterly basis. We recorded $2.1 million of fees and expenses in each of 2009 and 2010 all of which were paid in full by 2011. We
recorded $2.0 million of fees in fiscal 2011 and $1.5 million of fees for the nine months ended September 29, 2012. As of September 29, 2012, the unpaid fees under this agreement were
$0.6 million. Concurrently with the closing of this offering, the TPG Management Agreement will be terminated, but we will remain obligated to pay TPG an $8.0 million transaction fee
plus any accrued but unpaid management fees and related expenses through such date.
Insulectro Distributor Agreement and Redfern Partners, LLC Option Agreement
On June 1, 2004, we entered into an exclusive distributor agreement with Insulectro, a privately held company based in California. Insulectro
is owned, controlled and managed by Timothy and Donald Redfern, who are affiliated with Redfern Partners, LLC, one of our Sponsors.
Pursuant
to this distributor agreement, Insulectro serves as our exclusive distributor across the United States and British Columbia, serving PCB fabricators in these regions. Under the distributor
agreement, we reserve the right to provide direct sales coverage to certain customers, and may provide direct sales coverage to other customers serviced by Insulectro, provided that we give
60 days notice to Insulectro and pay a commission to Insulectro to compensate Insulectro for lost sales to such customers. Such commission decreases by 50% after 30 days and ceases
entirely after 60 days. We are required to allocate capacity for Insulectro up to Insulectro's weekly purchase volume for the last three months or based on Insulectro's monthly forecast volume,
whichever is less. Increases over capacity allocation will be jointly agreed upon by the parties. We may set and change prices by giving Insulectro 40 days' prior notice. In certain situations,
such as when new territories arise, we are required to invite all interested potential distributors to present
156
Table of Contents
Certain Relationships and Related Party Transactions
proposals
and evaluate such proposals on criteria that shall be shared with all interested parties prior to review of such proposals. The current term of the distributor agreement ends in June 2014.
Either party may terminate the agreement if the other party is in uncured material breach upon 90 days prior written notice.
Insulectro was the Company's seventh largest customer for the nine months ended September 29, 2012 and fiscal 2011, and the fifth largest customer for fiscal 2010, 2009 and 2008. Receivables
from Insulectro totaled $3.6 million as of September 29, 2012, $3.8 million as of December 31, 2011, $4.4 million as of January 1, 2011, and $4.1 million as
of December 26, 2009.
Also
on June 1, 2004, the Sponsor Holding Company granted Redfern Partners, LLC an option to purchase 1,500,000 units of the Sponsor Holding Company at an exercise price equal to the
U.S. dollar equivalent of €2 per unit using the spot price for the euro at the close of business for the Federal Reserve Bank of New York on May 31, 2004 (the "Original
Option"). In connection with the liquidation of the Sponsor Holding Company as part of the corporate reorganization occurring concurrently with this offering, the Original Option will be terminated
and substituted with a fully-vested option to purchase ordinary shares at an exercise price of
$ per share.
Sponsor Limited Partnership Notes
As of December 29, 2007, we had two notes receivable due from and three notes payable due to the Sponsor Limited Partnership for funds
associated with the purchase of the Company. The notes receivable totaled $7.5 million and the notes payable amounted to $5.4 million as of December 29, 2007. All of the notes
bore interest at a rate of the annual average of the six-month EURIBOR plus 5% (9.7% as of December 29, 2007). On December 27, 2008, we entered into an arrangement to net the
five notes together, which resulted in an amount due from the Sponsor Limited Partner of $2.3 million. The note receivable was due on May 31, 2009 and bore an
interest rate of the annual average of the six-month EURIBOR plus 5%. The note receivable was paid in full to us by the Sponsor Limited Partnership on May 29, 2009.
Loan Agreement and Private Placements of Securities
On September 30, 2010, we entered into a senior secured credit agreement and a mezzanine credit agreement with various lenders, including
certain of the Sponsors, and issued voting and non-voting units of the Sponsor Holding Company to certain of the Sponsors. For a description of the senior secured credit agreement and
mezzanine credit agreement, and equity interests issued to the Sponsors, see "Management's Discussion and Analysis—Liquidity and Capital Resources". In addition, proceeds from this
offering, together with the proceeds from the concurrent new senior secured notes offering, will be used to retire all amounts outstanding under the senior secured credit agreement and mezzanine
credit agreement. For more information, see "Use of Proceeds".
For fiscal 2010 and fiscal 2011, we had not made any principal payments under either the senior secured credit agreement or the mezzanine credit agreement. For fiscal 2010, we had made interest
payments totaling $5.4 million under the senior secured credit agreement and $3.5 million under the mezzanine credit agreement. For fiscal 2011, we had made interest payments totaling
$21.2 million under the senior secured credit agreement and $14.7 million under the mezzanine credit agreement. For the nine months ended September 29, 2012, we made interest payments
totaling $15.9 million under the senior secured credit agreement and $11.8 million under the mezzanine credit agreement.
Shareholders and Registration Rights Agreement
We and certain of our Sponsors and shareholders will become parties to a shareholders and registration rights agreement that will become effective
shortly before this offering. The shareholders and registration rights agreement covers matters of corporate governance and registration rights.
157
Table of Contents
Certain Relationships and Related Party Transactions
Corporate Governance
The shareholders and registration rights agreement provides that so long as they hold at least 20% of our outstanding voting securities, each of TPG
and Oaktree may nominate two members of our board of directors; so long as they hold at least 10% of our outstanding voting securities, each of TPG and Oaktree may nominate one member of our board of
directors; and the parties to the shareholders and registration rights agreement will vote their ordinary shares to elect the persons so nominated to our board of directors. Messrs. Burns and
Millikin were nominated by TPG and Messrs. Kruse and Traub were nominated by Oaktree. The shareholders and registration rights agreement also provides that our board of directors shall consist
of eight members including, in addition to the TPG and Oaktree nominees, our CEO and three nominees who are not affiliated with TPG or Oaktree and who meet the independence requirements of the
Exchange Act and the national securities exchange on which our ordinary shares are listed. The number of independent directors shall be increased accordingly should there by a reduction in the number
of nominees TPG or Oaktree are entitled to pursuant to the shareholders and registration rights agreement.
Registration Rights
Subject to the terms and conditions of the shareholders and registration rights agreement, TPG and Oaktree will have the right to request two
long-form demand registrations, arising after the expiration of a 180-day lock-up period but prior to the time when the Company becomes eligible to use a
registration statement on Form S-3, and two additional demand registrations on Form S-3 once the Company becomes eligible to use a registration statement on
Form S-3. The other shareholders party to the shareholders and registration rights agreement may elect to participate in such registrations.
In
addition to our obligations with respect to demand registrations, if we propose to register any of our securities, other than a registration on Form S-8 or S-4 or
successor forms, for our own account, the parties to the shareholders and registration rights agreement, including TPG and Oaktree, will have the opportunity to participate in such registrations.
Expenses relating to these "incidental registrations" are required to be paid by us.
If
an incidental registration is underwritten and the managing underwriter advises us that the number of securities offered to the public needs to be reduced, priority of inclusion shall be such that
first priority shall be given to us, second priority shall be given to the shareholders party to the shareholders and registration rights agreement who elect to participate in such registration, and
third priority shall be given to all other of our ordinary shares requested to be sold by such shareholders.
Corporate Reorganization
Prior to the completion of this offering, we intend to undertake a corporate restructuring that will create a new holding company in the Cayman
Islands that will wholly own our current Luxembourg Holding Company, and therefore indirectly own the various subsidiaries of Isola. In connection with this corporate restructuring, both the Sponsor
Limited Partnership and the Sponsor Holding Company will be liquidated. This will result in each of the Sponsors separately owning a number of our Cayman ordinary shares equivalent to their pro rata
investments in Isola. Please see "Prospectus Summary—Concurrent Transactions—Corporate Reorganization" for more information on our corporate restructuring.
TRANSACTIONS WITH EXECUTIVE OFFICERS AND DIRECTORS
Equity Interests in the Sponsor Holding Company and Sponsor Limited Partnership
Please see "Executive Compensation" and "Prospectus Summary—Concurrent Transactions" for information on equity interests held by current
and former members of management.
158
Table of Contents
Certain Relationships and Related Party Transactions
Indemnification Arrangements
Please see "Executive Compensation—Director Limitation of Liability and Indemnification Arrangements" for information on our
indemnification arrangements with our directors.
Executive Compensation and Employment Arrangements
Please see "Executive Compensation—Outstanding Equity Awards as of the End of Fiscal 2011" and "Executive
Compensation—Employment Agreements and Change in Control Agreements" for information on compensation arrangements with our executive officers, including option grants and agreements with
executive officers.
POLICIES AND PROCEDURES FOR RELATED PARTY TRANSACTIONS
As provided by our Audit Committee charter to be effective upon completion of this offering, our Audit Committee will be responsible for reviewing
and approving related party transactions, after reviewing each such transaction for potential conflicts of interests and other improprieties. We do not currently have a written policy for the review
and approval of transactions with related parties.
159
Table of Contents
Shares Eligible for Future Sale
Prior to this offering, there has been no public market for our ordinary shares. Based on the number of shares outstanding at
, 2012, upon completion of this offering, we will have an aggregate
of million ordinary shares outstanding on a fully-diluted basis. All of the shares that we sell
in this offering will be freely tradable without restriction or further registration under the Securities Act, except that any shares purchased by our affiliates, as that term is defined in
Rule 144, may generally only be sold in compliance with the limitations of Rule 144, which is summarized below. The remaining million of our ordinary shares that
are outstanding after this offering, or % of our ordinary shares, assuming the underwriters exercise their option to purchase additional shares in full, will be restricted shares under
the terms of the Securities Act. All of these shares are subject to lock-up agreements as described in "Underwriting". Restricted shares may be sold in the public market only if registered
or if they qualify for an exemption from registration under Rule 144 promulgated under the Securities Act, which rules are summarized below.
SALES OF RESTRICTED SECURITIES
In general, under Rule 144 as currently in effect on the date of this prospectus, persons who became the beneficial owner of our ordinary
shares prior to the completion of this offering may not sell their shares until the earlier of (i) the expiration of a six-month holding period, if we have been subject to the
reporting requirements of the Exchange Act and have filed all required reports for at least 90 days prior to the date of the sale; or (ii) a one-year holding period.
If
the six-month holding period applies, then at its expiration, a person who was not one of our affiliates at any time during the three months preceding a sale would be entitled to sell
an
unlimited number of our ordinary shares provided current public information about us is available, and a person who was one of our affiliates at any time during the three months preceding a sale would
be entitled to sell within any three-month period only a number of ordinary shares that does not exceed the greater of either of the following:
- –>
- 1%
of the number of our ordinary shares then outstanding, which will equal approximately shares immediately after this offering, based on the
number
of our ordinary shares outstanding as of ; or
- –>
- the
average weekly trading volume of our ordinary shares on the Nasdaq Global Market during the four calendar weeks preceding the filing of a notice on
Form 144 with respect to the sale.
If
the one-year holding period applies, then at its expiration, a person who was not one of our affiliates at any time during the three months preceding a sale would be entitled to sell an
unlimited number of our ordinary shares without restriction. A person who was one of our affiliates at any time during the three months preceding a sale would remain subject to the volume restrictions
described above. Sales under Rule 144 by our affiliates or persons selling shares on behalf of our affiliates are also subject to certain manner of sale provisions and notice requirements and
to the availability of current public information about us.
EFFECTS OF SALES OF SHARES
No predictions can be made as to the effect, if any, that sales of our ordinary shares from time to time, or the availability of our ordinary shares
for future sale, may have on the market price for our ordinary shares. Sales of substantial amounts of ordinary shares, or the perception that such sales could occur, could adversely affect prevailing
market prices for our ordinary shares and could impair our future ability to obtain capital through an offering of equity securities.
160
Table of Contents
Shares Eligible for Future Sale
REGISTRATION RIGHTS
Upon the closing of this offering, the Sponsors and their affiliates, which will indirectly hold an aggregate of our ordinary
shares,
will have the right to require us to register their shares under the Securities Act under specified circumstances. After registration and sale pursuant to these rights, these shares will become freely
tradable without restriction under the Securities Act. Please see "Certain Relationships and Related Party Transactions—Shareholders and Registration Rights Agreement" for additional
information regarding these registration rights.
161
Table of Contents
Description of Share Capital
As of the date of this offering, our authorized share capital will consist of 100,000,000 ordinary shares, par value $0.0001 per
share, and 25,000,000 undesignated preferred shares, par value $0.0001 per share. As of ,
2012, ordinary shares were issued and outstanding, held of record by
shareholders, and no shares of undesignated preferred shares were outstanding. An
additional ordinary shares may be issued upon exercise of options under our stock
option plan. The following summary description relating to our share capital does not purport to be complete and is qualified in its entirety by our memorandum and articles of association, copies of
which are available as set forth in the section captioned "Where You Can Find More Information".
ORDINARY SHARES
Holders of ordinary shares are entitled to cast one vote for each share on all matters submitted to a vote of shareholders, including the election of
directors. The holders of ordinary shares are entitled to receive ratably such dividends, if any, as may be declared by our directors out of funds legally available therefor. We have not in the past
paid and do not expect for the foreseeable future to pay, dividends on our ordinary shares. Instead, we anticipate that all of our earnings, if any, in the foreseeable future will be used for working
capital and other general corporate purposes. Any future determination to pay dividends will be at the discretion of our board of directors and will depend upon, among other factors, our results of
operations, financial condition, capital requirements and contractual restrictions. Such holders do not have any preemptive or other rights to subscribe for additional shares. All holders of ordinary
shares are entitled to share ratably in any assets for distribution to shareholders upon our liquidation, dissolution or winding up.
There
are no conversion, redemption or sinking fund provisions applicable to the ordinary shares. All outstanding ordinary shares are fully paid and nonassessable.
PREFERRED SHARES
Pursuant to our articles of association to be in effect upon the completion of this offering, our board of directors will be authorized, without any
action by our shareholders, to designate and issue preferred shares in one or more series and to designate the powers, preferences and rights of each series, which may be greater than the rights of
our ordinary shares. It is not possible to state the actual effect of the issuance of any shares of preferred shares upon the rights of holders of our ordinary shares until the board of directors
determines the specific rights of the holders of such preferred shares. However, the effects might include, among other things:
- –>
- impairing
dividend rights of our ordinary shares;
- –>
- diluting
the voting power of our ordinary shares;
- –>
- impairing
the liquidation rights of our ordinary shares; and
- –>
- delaying
or preventing a change of control of us without further action by our shareholders.
Upon
the completion of this offering, no shares of our preferred shares will be outstanding, and we have no present plan to issue any of our preferred shares following this offering.
LIMITATIONS ON THE RIGHT TO OWN OR VOTE SHARES
As a Cayman Islands company, we may not hold our own shares as a shareholder, save for shares that are acquired and held as treasury shares. We may
not exercise any voting or other rights in respect of treasury shares nor may any dividend be declared or paid or other distribution be made in respect of treasury shares.
162
Table of Contents
Description of Share Capital
However,
bonus shares may be issued in respect of treasury shares although they will, in turn, be treated as treasury shares.
LIMITATIONS ON TRANSFER OF SHARES
Our articles of association give our directors, at their discretion, the right to decline to register any transfers of shares that are not fully
paid-up shares.
DISCLOSURE OF SHAREHOLDER OWNERSHIP
There are no provisions in our memorandum of association or articles of association governing the ownership threshold above which shareholder
ownership must be disclosed by any shareholder.
CHANGES IN SHARE CAPITAL
We may, from time to time, by ordinary resolution passed by a majority of the votes cast by shareholders present at a shareholder meeting entitled to
vote on such resolution, or passed by a written consent of shareholders holding not less than a majority of our shares outstanding for so long as we are a controlled company, increase our share
capital by such sum, to be allocated among shares of such par value, as the resolution shall prescribe. The new shares shall be subject to the same provisions with reference to the payment of calls,
liens, transfers, transmissions, forfeitures and otherwise as the shares in the original share capital. We may by ordinary resolution passed at a shareholder meeting by a majority of the votes cast by
shareholders present at such meeting and entitled to vote on such resolution, or passed by a written consent of shareholders holding not less than a majority of our shares outstanding for so long as
we are a controlled company:
- –>
- consolidate
our share capital into shares of larger par value than our existing shares;
- –>
- sub-divide
our share capital into shares of smaller par value;
- –>
- divide
our shares into multiple classes; and
- –>
- cancel
any shares which, at the date of the passing of the resolution, have not been issued and diminish the amount of the shares so cancelled.
We
may by special resolution passed by at least two-thirds of the votes cast by shareholders present at a shareholder meeting and entitled to vote on such resolution, or passed by a
unanimous written consent of such persons, reduce our share capital or any capital redemption reserve fund or other undistributable reserve in any manner authorized by law.
163
Table of Contents
Description of Share Capital
DIFFERENCES IN CORPORATE LAW
The Cayman Islands Companies Law is modeled after the corporate legislation of the United Kingdom but does not follow recent United Kingdom statutory
enactments, and differs from laws applicable to United States corporations and their shareholders. Set forth below is a summary of the significant differences between the provisions of the Companies
Law applicable to us and the laws applicable to companies incorporated in the United States (particularly Delaware) and their shareholders.
|
|
|
|
|
|
|
Delaware |
|
Cayman Islands |
Title of Organizational
Documents |
|
Certificate of incorporation
Bylaws |
|
Memorandum of association
Articles of association |
Duties of Directors |
|
Under Delaware law, the business and affairs of a corporation are managed by or under the direction of its board of directors. In
exercising their powers, directors are charged with a fiduciary duty of care to protect the interests of the corporation and a fiduciary duty of loyalty to act in the best interests of its shareholders. The duty of care requires that directors act in
an informed and deliberative manner and inform themselves, prior to making a business decision, of all material information reasonably available to them. The duty of care also requires that directors exercise care in overseeing and investigating the
conduct of the corporation's employees. The duty of loyalty may be summarized as the duty to act in good faith, not out of self-interest, and in a manner which the director reasonably believes to be in the best interests of the
shareholders. |
|
As a matter of Cayman Islands law, directors of Cayman Islands companies owe a fiduciary duty to the their respective companies
to act in good faith in their dealings with or on behalf of the company and exercise their powers and fulfill the duties of their office honestly. This duty has four essential elements:
-->a duty to act in good faith in the best interests of the company;
-->a duty not to personally profit from opportunities that arise from the office of director;
-->a duty to avoid conflicts of interest; and
-->a duty to exercise powers for the purpose for which such powers were intended.
A director of a Cayman Islands company also owes the company a duty to act with skill and care. A director need not exhibit in the performance of his or her duties a greater degree of skill than may reasonably be expected from a person of his or her
knowledge and experience. |
164
Table of Contents
Description of Share Capital
|
|
|
|
|
|
|
Delaware |
|
Cayman Islands |
Limitations on Personal
Liability of Directors |
|
Subject to the limitations described below, a certificate of incorporation may provide for the elimination or limitation of the personal liability of a director to the corporation or its shareholders for monetary damages for a breach of fiduciary
duty as a director.
Such provision cannot limit liability for breach of loyalty, bad faith, intentional misconduct, unlawful payment of dividends or unlawful share purchase or redemption. In addition, the certificate of incorporation cannot limit liability for any act
or omission occurring prior to the date when such provision becomes effective. |
|
The Companies Law of the Cayman Islands has no equivalent provision to Delaware law regarding the limitation of director's liability. However, as a matter of public policy, Cayman Islands law will not allow the limitation of a director's liability to
the extent that the liability is a consequence of the director committing a crime or of the director's own fraud or dishonesty. |
Indemnification of
Directors, Officers, Agents, and Others |
|
A corporation has the power to indemnify any director, officer, employee, or agent of corporation who was, is, or is threatened to be made a party who acted in good faith and in a manner he believed to be in the best interests of the corporation, and
if with respect to a criminal proceeding, had no reasonable cause to believe his conduct would be unlawful, against amounts actually and reasonably incurred. |
|
Cayman Islands law does not limit the extent to which a company's articles of association may provide for indemnification of directors and officers, except to the extent any such provision may be held by the Cayman Islands courts to be contrary to
public policy, such as to provide indemnification against the consequences of committing a crime, or against the indemnified person's own fraud or dishonesty. |
165
Table of Contents
Description of Share Capital
|
|
|
|
|
|
|
Delaware |
|
Cayman Islands |
Interested Directors |
|
Under Delaware law, a transaction in which a director who has an interest in such transaction would not be voidable if (i) the material
facts as to such interested director's relationship or interests are disclosed or are known to the board of directors and the board in good faith authorizes the transaction by the affirmative vote of a majority of the disinterested directors, even
though the disinterested directors are less than a quorum, (ii) such material facts are disclosed or are known to the shareholders entitled to vote on such transaction and the transaction is specifically approved in good faith by vote of the
shareholders, or (iii) the transaction is fair as to the corporation as of the time it is authorized, approved or ratified. Under Delaware law, a director could be held liable for any transaction in which such director derived an improper
personal benefit. |
|
Our articles of association contain provisions that permit a director to vote on a transaction in which he or she is interested provided he or
she discloses such interest to the board of directors. As under Delaware law, a director could be held liable for any transaction in which such director derived an improper personal benefit. |
Voting Requirements |
|
The certificate of incorporation may include a provision requiring supermajority approval by the directors or shareholders for
any corporate action.
In addition, under Delaware law, certain business combinations involving interested shareholders require approval by a supermajority of the non-interested shareholders. |
|
For the protection of shareholders, certain matters must be approved by special resolution of the shareholders, including
alteration of the memorandum or articles of association, appointment of inspectors to examine company affairs, reduction of share capital, change of name, authorization of a plan of merger or consolidation or voluntary winding up the
company. |
166
Table of Contents
Description of Share Capital
|
|
|
|
|
|
|
Delaware |
|
Cayman Islands |
|
|
|
|
The Companies Law of the Cayman Islands requires that a special resolution be passed by a majority of two-thirds (66.66%) or such higher majority
as set forth in the articles of association, of shareholders voting at a general meeting, or by unanimous written consent of shareholders.
Under our articles of association, certain business combinations involving interested shareholders require approval by a supermajority of the non-interested shareholders. |
Voting for Directors |
|
Under Delaware law, unless otherwise specified in the certificate of incorporation or bylaws of the corporation, directors shall
be elected by a plurality of the votes of the shares present in person or represented by proxy at the meeting and entitled to vote on the election of directors. |
|
The Companies Law of the Cayman Islands defines "special resolutions" only. A company's articles of association can therefore
tailor the definition of "ordinary resolutions" as a whole, or with respect to specific provisions. Our articles of association provide that with respect to the election of directors, an ordinary resolution shall be passed by a plurality
vote. |
Cumulative Voting |
|
No cumulative voting for the election of directors unless so provided in the certificate of incorporation. |
|
No cumulative voting for the election of directors unless so provided in the articles of association. |
Directors' Powers
Regarding Bylaws |
|
The certificate of incorporation may grant the directors the power to adopt, amend or repeal bylaws. |
|
The memorandum and articles of association may only be amended by a special resolution of the shareholders. |
167
Table of Contents
Description of Share Capital
|
|
|
|
|
|
|
Delaware |
|
Cayman Islands |
Nomination and Removal of Directors and Filling Vacancies on Board |
|
Shareholders may generally nominate directors if they comply with advance notice provisions and other procedural requirements in company bylaws. Holders of a majority of the shares may remove a director with or without cause, except in certain cases
involving a classified board or if the company uses cumulative voting. Unless otherwise provided for in the certificate of incorporation, directorship vacancies are filled by a majority of the directors elected or then in office. |
|
Nomination and removal of directors and filling of board vacancies are governed by the terms of the articles of association. Our articles of association provide that only shareholders that beneficially own more than 15% of our outstanding ordinary
shares (unless the Exchange Act and proxy rules provide otherwise) and comply with our advance notice provisions may nominate directors. Our articles of association also provide that shareholders may only remove directors for cause and with a
supermajority of two-thirds. This right to remove directors may not be used to remove directors nominated by our Principal Sponsors. Under our articles of association, vacancies on the board are generally filled by the vote of a majority of the
directors elected or then in office, subject to the rights of our Principal Sponsors. |
Mergers and Similar
Arrangements |
|
Under Delaware law, with certain exceptions, a merger, consolidation, exchange or sale of all or substantially all the assets of a corporation must be approved by the board of directors and a majority of the outstanding shares entitled to vote
thereon. Under Delaware law, a shareholder of a corporation participating in certain major corporate transactions may, under certain circumstances, be entitled to appraisal rights pursuant to which such shareholder may receive cash in the amount of
the fair value of the shares held by such shareholder (as determined by a court) in lieu of the consideration such shareholder would otherwise receive in the transaction. |
|
Cayman Islands companies law has recently been amended to simplify mergers and consolidations where two or more companies are being formed into a single entity. The new legislation makes a distinction between a "consolidation" and a "merger". In a
consolidation, a new entity is formed from the combination of each participating company, and the separate consolidating parties, as a consequence, cease to exist and are each stricken by the Registrar of Companies. In a merger, one company remains
as the surviving entity, having in effect absorbed the other merging parties that are then stricken and cease to exist. |
168
Table of Contents
Description of Share Capital
|
|
|
|
|
|
|
Delaware |
|
Cayman Islands |
|
|
Delaware law also provides that a parent corporation, by resolution of its board of directors, may merge with any subsidiary, of
which it owns at least 90% of each class of capital stock without a vote by shareholders of such subsidiary. Upon any such merger, dissenting shareholders of the subsidiary would have appraisal rights. |
|
Two or more Cayman-registered companies may merge or consolidate. Cayman-registered companies may also merge or consolidate with
foreign companies provided that the laws of the foreign jurisdiction permit such merger or consolidation.
Under the new rules, a plan of merger or consolidation shall be authorized by each constituent company by way of (i) a special resolution of the members of each such constituent company; and (ii) such other authorization, if any, as may be
specified in such constituent company's articles of association. |
|
|
|
|
Shareholder approval is not required where a parent company registered in the Cayman Islands seeks to merge with one or more of
its subsidiaries registered in the Cayman Islands ("vertical amalgamation") and a copy of the plan of merger is given to every member of each subsidiary company to be merged unless that member agrees otherwise. |
169
Table of Contents
Description of Share Capital
|
|
|
|
|
|
|
Delaware |
|
Cayman Islands |
|
|
|
|
Creditors must be asked approve the merger although application can be made to the Grand Court of the Cayman Islands to proceed
notwithstanding a dissenting creditor. Where a foreign company wishes to combine with a Cayman company, consent or approval to the transfer of any security interest granted by the foreign company to the resulting Cayman entity in the transaction is
required, unless otherwise released or waived by the secured party. If the merger plan is approved, it is then filed with the Cayman Islands General Registry along with a declaration by a director of each company. The Registrar of Companies will then
issue a certificate formalizing the merger or consolidation. The surviving entity remains active while the other company or companies are automatically dissolved. Unless the shares of such shareholder are publicly listed or quoted, dissenting
shareholders in a merger or consolidation of this type are entitled to payment of the fair value of their shares if such shareholder provides a written objection before the vote. |
170
Table of Contents
Description of Share Capital
|
|
|
|
|
|
|
Delaware |
|
Cayman Islands |
|
|
|
|
Cayman companies may also be restructured or amalgamated under supervision of the Grand Court of the Cayman Islands by way of a
"scheme of arrangement". This option is not used with any frequency because a business transaction can be achieved through other means, such as a share capital exchange, merger (as described above), asset acquisition or control, through contractual
arrangements, of an operating business. In the event that a business transaction is sought pursuant to a scheme of arrangement it would require the approval of a majority, in number, of each class of shareholders and creditors with whom the
arrangement is to be made and who must in addition represent three-fourths in value of each such class of shareholders or creditors, as the case may be, that are present and voting either in person or by proxy at a meeting, or meeting summoned for
that purpose. The convening of the meetings and subsequently the terms of the arrangement must be sanctioned by the Grand Court of the Cayman Islands. While a dissenting shareholder would have the right to express to the Court the view that the
transaction ought not be approved, the Court can be expected to approve the arrangement if it satisfies itself that:
-->the company is not proposing to act illegally or beyond the scope of its authority and the statutory provisions as to majority vote have been complied with;
-->the shareholders have been fairly represented at the meeting in question;
|
171
Table of Contents
Description of Share Capital
|
|
|
|
|
|
|
Delaware |
|
Cayman Islands |
|
|
|
|
-->the arrangement is such as a businessman would reasonably approve; and the arrangement is not one that would more properly be sanctioned
under some other provision of the Companies Law of the Cayman Islands or that would amount to a "fraud on the minority" (a legal concept, different than "fraud" in the sense of dishonesty).
When a takeover offer is made and accepted by holders of 90% of the shares within four months, the offeror may, within a two-month period, require the holders of the remaining shares to transfer such shares on the terms of the offer. An objection may
be made to the Grand Court of the Cayman Islands but is unlikely to succeed unless there is evidence of fraud, bad faith or collusion.
If the arrangement and reconstruction are thus approved, any dissenting shareholders would have no rights comparable to appraisal rights, which would otherwise ordinarily be available to dissenting shareholders of United States corporations,
providing rights to receive payment in cash for the judicially determined value of the shares. |
172
Table of Contents
Description of Share Capital
|
|
|
|
|
|
|
Delaware |
|
Cayman Islands |
Shareholder Suits |
|
Class actions and derivative actions generally are available to shareholders under Delaware law for, among other things, breach
of fiduciary duty, corporate waste and actions not taken in accordance with applicable law. In such actions, the court generally has discretion to permit the winning party to recover attorneys' fees incurred in connection with such
action. |
|
The rights of shareholders under Cayman Islands law are not as extensive as those under Delaware law. Class actions and
derivative actions are generally not available to shareholders under Cayman Islands laws and our Cayman Islands counsel is not aware of a significant number of such reported actions having been brought in Cayman Islands courts. In principle, we will
normally be the proper plaintiff and a derivative action may not be brought by a minority shareholder. However, the Cayman Islands courts would ordinarily be expected to follow English case law precedent, which would permit a shareholder to commence
an action in the company's name to remedy a wrong done to it where the act complained of is alleged to be beyond the company's corporate power or is illegal or would result in the violation of its memorandum of association or articles of association
or where the individual rights of the plaintiff shareholder have been infringed or are about to be infringed. Furthermore, consideration would be given by the court to acts that are alleged to constitute a "fraud on the minority" or where an act
requires the approval of a greater percentage of shareholders than actually approved it. The winning party in such an action generally would be able to recover a portion of attorney's fees incurred in connection with such action. |
173
Table of Contents
Description of Share Capital
|
|
|
|
|
|
|
Delaware |
|
Cayman Islands |
Inspection of Corporate
Records |
|
Under Delaware law, shareholders of a Delaware corporation have the right during normal business hours to inspect for any proper purpose, and to obtain copies of list(s) of shareholders and other books and records of the corporation and its
subsidiaries, if any, to the extent the books and records of such subsidiaries are available to the corporation. |
|
Shareholders of a Cayman Islands company have no general right under Cayman Islands law to inspect or obtain copies of a list of shareholders or other corporate records of the company. However, these rights may be provided in the company's articles
of association. |
Shareholder Proposals |
|
Unless provided in the corporation's certificate of incorporation or bylaws, Delaware law does not include a provision
restricting the manner in which shareholders may bring business before a meeting. |
|
The Companies Law of the Cayman Islands does not provide shareholders any right to bring business before a meeting or requisition
a general meeting. However, these rights may be provided in the company's articles of association. |
Approval of Corporate
Matters by Written
Consent |
|
Delaware law permits shareholders to take action by written consent signed by the holders of outstanding shares having not less than the minimum number of votes that would be necessary to authorize or take such action at a meeting of
shareholders. |
|
The Companies Law of the Cayman Islands allows a special resolution to be passed in writing if signed by all the shareholders and authorized by the articles of association. |
|
|
|
|
Our articles of association authorize such written consents while we are a "controlled company", but we believe that the
unanimity requirement will make this option impractical after the consummation of this offering. Written consents are not authorized if we are not a "controlled company". |
174
Table of Contents
Description of Share Capital
|
|
|
|
|
|
|
Delaware |
|
Cayman Islands |
Calling of Special
Shareholders Meetings |
|
Delaware law permits the board of directors or any person who is authorized under a corporation's certificate of incorporation or bylaws to call a special meeting of shareholders. |
|
The Companies Law of the Cayman Islands does not have provisions governing the proceedings of shareholders meetings which are usually provided in the articles of association.
Our articles of association allow shareholders holding a majority of our stock to call special meetings while we are a "controlled company"; thereafter, shareholders will be precluded from calling special meetings. |
STOCK OPTION PLAN
For information on our 2012 Equity Incentive Plan, please see "Executive Compensation".
REGISTRATION RIGHTS
For information on our Sponsors' registration rights, please see "Certain Relationships and Related Party Transactions—Agreements with
Our Sponsors".
CERTAIN EFFECTS OF AUTHORIZED BUT UNISSUED STOCK
Upon completion of this offering, we will have ordinary shares remaining
authorized but unissued. Authorized but unissued ordinary
shares are available for future issuance without shareholder approval. Issuance of these shares will dilute your percentage ownership in us.
LISTING
We have applied for the listing of our ordinary shares on the Nasdaq Global Market under the symbol "ISLA".
TRANSFER AGENT AND REGISTRAR
We intend to engage Computershare Trust Company, N.A. to serve as the transfer agent and registrar for our ordinary shares.
175
Table of Contents
Description of Indebtedness
OUR NEW SENIOR SECURED NOTES
Concurrently with the consummation of this offering, Isola USA Corp., our primary U.S.-based operating company and our
wholly-owned subsidiary, will issue $ million of senior secured notes due 2019.
The
proceeds of the senior secured notes offering will be used to repay the outstanding balances under the existing senior secured credit agreement and mezzanine credit agreement that are not repaid
from the proceeds of this offering. The senior secured notes will be guaranteed, on a joint and several basis by selected other companies in the Isola group. The senior secured notes will be offered
in a private transaction that is not registered under the Securities Act of 1933, as amended, and the senior secured notes may not be offered or sold in the United States absent an applicable
exemption from the registration requirements. Holders of the senior secured notes will not be entitled to any registration rights.
The
senior secured notes and guarantees thereon will be secured by a pledge of certain equity interests and a security interest in certain assets, in each case subject to certain exceptions and
limitations as set forth in the indenture governing the notes, a copy of which is filed as an exhibit to the registration statement of which this prospectus forms a part.
The
indenture pursuant to which the senior secured notes will be issued contains covenants that, among other things, limit our and our restricted subsidiaries' ability to:
- –>
- incur
or guarantee additional indebtedness or issue preferred stock;
- –>
- pay
dividends or distributions on, or redeem or repurchase, our capital stock;
- –>
- make
certain investments;
- –>
- make
certain payments to Isola Group Ltd. and its restricted subsidiaries;
- –>
- create
liens on our assets;
- –>
- consummate
certain asset sales;
- –>
- consolidate,
merge, sell or otherwise dispose of all or substantially all our assets or Isola USA Corp.'s assets;
- –>
- engage
in transactions with affiliates; and
- –>
- designate
restricted subsidiaries as unrestricted subsidiaries.
Interest
on the senior secured notes accrues at a rate of % per annum and is payable
on and
of each year, commencing on , 2012. We may
redeem all or a part of the senior secured notes at any time
prior to , 2015 at a redemption price equal to 100% of the principal amount of the senior secured notes redeemed plus
any accrued and unpaid interest to the redemption date plus a
"make-whole" premium. In addition, after , 2013 and prior
to , 2015, but not more than once in any twelve-month period, we may redeem up
to % of
the aggregate principal amount of senior secured notes at a redemption price of % of the principal amount of the senior secured notes redeemed, plus any accrued and unpaid interest to
the redemption date.
Until ,
2015, we may redeem up to % of the aggregate principal amount of the senior secured notes issued at a redemption price equal to % of the
aggregate
principal amount thereof plus accrued and unpaid interest and any additional interest with the net cash proceeds of certain equity offerings, provided that (i) each such redemption occurs
within days of the date of closing of each such equity offering and (ii) at least % of the aggregate principal amount of the senior
secured notes remains
outstanding afterwards.
176
Table of Contents
Description of Indebtedness
Upon
a change of control, we will be required to make an offer to purchase the senior secured notes at a purchase price equal to % of their principal amount, plus accrued interest. If we
or our restricted subsidiaries engage in asset sales, we generally must either prepay our secured debt in the case of sales of collateral or prepay senior debt in the case of sales of
non-collateral or make an offer to purchase a principal amount of the senior secured notes with the excess net cash proceeds, subject to certain exceptions. The purchase price of the
senior secured notes will be % of their principal amount plus accrued and unpaid interest, if any.
SENIOR SECURED REVOLVING CREDIT AGREEMENT
Our senior secured revolving credit agreement which we expect to become effective concurrently with the consummation of this offering and the
offering of our new senior secured notes, will consist of revolving loan commitments in an aggregate amount of $ million. The credit agreement will also contain a
letter of
credit sub-facility in the amount of $ million. Loans under the credit agreement will bear interest, at our option, at a rate per annum equal either to a base rate
plus % or an adjusted Eurodollar rate plus %. The revolving commitments under the credit agreement will terminate five years after the closing
date of the credit agreement.
The borrower under this agreement will be Isola USA Corp., our primary U.S.-based operating company and our wholly-owned subsidiary, and loans and letters of credit under the
credit agreement will be guaranteed by selected other companies in the Isola group. The proceeds of the loans and letters of credit under the credit agreement will be used to provide for our ongoing
working capital and other general corporate purposes.
The
credit agreement will require us to maintain certain covenants that restrict our ability to operate our business, including, but not limited to, restrictions substantially similar to the covenants
in the indenture that governs the senior secured notes and otherwise customary for credit facilities of this type.
The
credit agreement will also contain a financial covenant that requires us to meet a senior secured leverage ratio. Specifically, the maximum permitted senior secured leverage ratio decreases from
:1.00,
effective ,
to :1.00,
effective . The definition of EBITDA under the senior secured revolving credit agreement
differs from Adjusted
EBITDA used elsewhere in this prospectus. Under our senior secured revolving credit agreement, EBITDA includes additional add-backs to net income for certain costs, fees, taxes, losses,
charges, write-offs, write-downs and expenses.
This
offering, the senior secured notes offering and the closing of the senior secured revolving credit facility are each conditional upon the closing of the other transactions.
OUR EXISTING CREDIT AGREEMENTS
Prior to the offering, our primary lending arrangements consist of a senior secured credit agreement and a mezzanine credit agreement, each entered
into on September 30, 2010, with a syndicate of lenders, including certain of our Sponsors. The principal terms of each are described below.
Senior Secured Credit Agreement
Our senior secured credit agreement consists of a senior secured term loan of $210.0 million, the full amount of which was drawn at closing on
September 30, 2010. The proceeds were used to refinance part of our then-existing first- and second-lien term loans and to provide for the ongoing working capital and
other general corporate purposes of the Company. Loans under the senior secured agreement bear interest, at our option, at a rate per annum equal either to a base rate (that can be no less than 3%)
plus 7%, or an adjusted Eurodollar rate (that can be no less than 2%) plus 8%. The term loan under the senior secured credit agreement was issued at a discount of $28.5 million on
September 30, 2010. As of September 29, 2012, we had $210.0 million outstanding under the senior secured credit agreement, bearing interest at 10% per
177
Table of Contents
Description of Indebtedness
annum. The unamortized discount was $19.3 million, resulting in a net balance of $190.7 million. Loans under this agreement mature on September 30, 2015. The borrower under this
agreement is our wholly-owned subsidiary, Isola USA Corp., and loans under the agreement are guaranteed by various Isola group subsidiaries.
The
senior secured credit agreement requires us to maintain certain covenants that restrict our ability to operate our business, including, but not limited to, restrictions on the ability of the
borrower and certain Isola group subsidiaries to (i) dispose of assets or stock; (ii) incur additional indebtedness and guarantee obligations; (iii) pay certain dividends;
(iv) create liens on assets; (v) make investments, loans or advances; (vi) restrict distributions to the borrowers or guarantors from their subsidiaries; (vii) engage in
mergers or consolidations; (viii) engage in certain transactions with affiliates; (ix) incur additional negative pledges; (x) incur capital expenditures; (xi) change our
fiscal year or accounting practices or the lines of business in which we and our subsidiaries are involved; (xii) enter into sale-leaseback transactions; (xiii) prepay
principal of, premium, or interest on, or redeem, purchase, retire, defease, or create a sinking fund or make a similar payment with respect to, any subordinated indebtedness and certain other debt;
(xiv) change the conduct of business; (xv) conduct activities of any parent holding company; (xvi) amend our organizational documents; (xvii) cease to keep in full force
and effect our corporate existence and all rights, franchises, licenses and permits material to our business; (xviii) not pay our taxes or certain claims when they are due; or
(xix) allow insurance to expire.
Our
senior secured credit agreement also requires us to meet certain financial covenants that change over time. Specifically, we are required to comply with an interest coverage ratio and a leverage
ratio.
The interest coverage ratio is the ratio of Consolidated Adjusted EBITDA to consolidated interest expense for a rolling four-fiscal quarter period. As of September 29, 2012 the
required interest coverage ratio was at 2.00:1.00, and our actual ratio was 2.77:1.00. The required interest coverage ratio increases over time to 2.25:1:00 effective December 28, 2013.
The leverage ratio is the ratio of consolidated total secured debt to Consolidated Adjusted EBITDA for a rolling four-fiscal quarter period. As of September 29, 2012, the maximum
allowed leverage ratio was at 3.00:1.00, and our actual leverage ratio was 2.12:1.00. The maximum leverage ratio decreases over time to 2.25:1.00 effective June 28, 2014.
The
definition of Consolidated Adjusted EBITDA under the senior secured credit agreement differs from Adjusted EBITDA used elsewhere in the prospectus. Under our senior secured credit agreement,
Consolidated Adjusted EBITDA includes additional add-backs to net income for certain pension costs and other costs, fees, taxes, losses, charges, write-offs, write-downs and
expenses.
Mezzanine Credit Agreement
On September 30, 2010, we issued an initial principal amount of $175.0 million in unsecured term loans pursuant to our mezzanine credit
agreement. The proceeds were used in part to refinance our then-existing first- and second-lien term debt, as well as to pay other fees and expenses related to the mezzanine
credit agreement. The unsecured term loans issued pursuant to the mezzanine credit agreement are subordinate and junior to the prior payment in full of all principal, interest and other obligations
owed under the secured term loans issued under our senior secured credit agreement. The unsecured term loans issued pursuant to the mezzanine credit agreement bear interest at a rate of 16% per annum,
payable quarterly each March 31, June 30, September 30 and December 31 of each year until maturity, with half (8% per annum) payable in cash and the other half (8% per
annum) payable by accreting such amount to the outstanding principal amount of the unsecured term loans. The unsecured term loans under the mezzanine credit agreement were issued at a discount of
$70.4 million on September 30, 2010. As of September 29, 2012, we had principal of $201.0 million outstanding under the mezzanine credit agreement, which included
$26.0 million of
178
Table of Contents
Description of Indebtedness
accreted PIK interest. We also had an additional $4.1 million of accrued PIK interest that had not been accreted to the principal balance as of September 29, 2012. The unamortized
discount was $56.8 million resulting in a net balance of $148.3 million. Loans under this agreement mature on March 24, 2016. The borrower under the mezzanine credit agreement is
our wholly-owned subsidiary Isola USA Corp., and its obligations are guaranteed by various Isola Group subsidiaries.
Our
mezzanine credit agreement requires us to maintain certain financial and operating covenants that are substantially similar to the covenants governing our senior secured credit agreement.
Mandatory Prepayments. We are required to pay down the loans under our senior credit agreement under certain circumstances, such as upon the sale of the Company,
issuance of equity securities by the Luxembourg Holding Company or the issuance of debt, the sale of assets or, commencing with the fiscal year ending December 31, 2011, upon the accumulation
of "excess cash flow" as defined in the agreements, with 75% of the proceeds going to pay down the loans under our senior secured credit agreement. We are required to pay down all amounts outstanding
under our mezzanine credit agreement upon the occurrence of a change in control. We intend to use the net proceeds from this offering and a portion of the proceeds from the issuance of the new senior
secured notes described above under "Our New Senior Secured Notes" and "Our New Senior Revolving Credit Facility" to repay loans under these credit agreements in their entirety.
Concurrent Equity Issuance. In connection with the unsecured term loans, the mezzanine lenders purchased equity interests in the Sponsor Holding Company for an
aggregate purchase price of $57.7 million approximately equal to of our ordinary shares, and our Luxembourg Holding Company issued
Class C convertible preferred
certificates with an aggregate par value of 43.5 million euros. These Class C convertible preferred certificates were issued at an aggregate discount of 25.3 million euros.
As of September 29, 2012, these Class C convertible preferred certificates had $56.2 million in outstanding principal and an unamortized discount balance of
$32.7 million, resulting in a net balance of $23.5 million.
179
Table of Contents
Taxation
CAYMAN ISLANDS TAXATION
The Cayman Islands currently levies no taxes on individuals or corporations based upon profits, income, gains or appreciation and there is no
taxation in the nature of inheritance tax or estate duty. There are no other taxes levied by the Government of the Cayman Islands that are likely to be material to holders of ordinary shares. Even
though the Cayman Islands has no direct taxation, it has entered into some limited tax treaties with certain countries. There are no exchange control regulations or currency restrictions in the Cayman
Islands.
Pursuant
to Section 6 of the Tax Concessions Law (1999 Revision) of the Cayman Islands, we have obtained an undertaking from the Governor-in-Council:
(1) that
no law which is enacted in the Cayman Islands imposing any tax to be levied on profits or income or gains or appreciation shall apply to us or our operations; and
(2) that
the aforesaid tax or any tax in the nature of estate duty or inheritance tax shall not be payable on our shares, debentures or other obligations.
The
undertaking for us is for a period of twenty years
from .
MATERIAL UNITED STATES FEDERAL INCOME TAX CONSEQUENCES
The following is a discussion of the material U.S. federal income tax consequences of owning and disposing of ordinary shares issued pursuant to this
offering, but does not purport to be a complete analysis of all the potential tax considerations relating thereto. The discussion applies to U.S. Holders (as defined below) who hold our ordinary
shares as capital assets for tax purposes and it does not describe all of the tax consequences that may be relevant to holders subject to special rules, such as:
- –>
- certain
financial institutions;
- –>
- insurance
companies;
- –>
- dealers
and traders in securities or foreign currencies;
- –>
- persons
holding ordinary shares as part of a hedge, straddle, conversion transaction or other integrated transaction;
- –>
- persons
whose functional currency for U.S. federal income tax purposes is not the U.S. dollar;
- –>
- regulated
investment companies;
- –>
- real
estate investment trusts;
- –>
- tax-exempt
organizations; or
- –>
- persons
holding ordinary shares that own or are deemed to own ten percent or more of our stock as measured by vote or value.
This
summary is based upon the provisions of the Internal Revenue Code, Treasury regulations promulgated thereunder, administrative rulings and judicial decisions, all as of the date hereof. These
authorities may be changed, possibly retroactively, so as to result in U.S. federal income tax consequences different from those set forth below. No ruling has been or will be sought from the Internal
Revenue Service, or the IRS, with respect to the statements made and the conclusions reached in the following summary, and there can be no assurance that the IRS will agree with such statements and
conclusions. Please consult your
180
Table of Contents
Taxation
own
tax advisers concerning the U.S. federal, state, local and foreign tax consequences of owning and disposing of ordinary shares in your particular circumstances.
In
addition, if a partnership or entity classified as a partnership for U.S. federal income tax purposes holds our ordinary shares, the tax treatment of a partner in the partnership or other entity
taxed as a partnership generally will depend on the status of the equity owner of such partnership or other entity taxed as a partnership and upon the activities of the partnership or other entity
taxed as a partnership. Accordingly, if you are a partnership or other entity taxed as a partnership that holds our ordinary shares, or if you are an owner in such partnership or other entity taxed as
a partnership, you are urged to consult your tax advisors regarding the specific U.S. federal income tax consequences of the ownership and disposition of our ordinary shares.
A
U.S. Holder is a beneficial owner of ordinary shares that is, for U.S. federal tax purposes:
- –>
- an
individual citizen or resident of the United States;
- –>
- a
corporation, or other entity taxable as a corporation, created or organized in or under the laws of the United States or any state thereof or the District of
Columbia;
- –>
- an
estate whose income is subject to U.S. federal income taxation regardless of its source; or
- –>
- a
trust (x) whose administration is subject to the primary supervision of a U.S. court and which has one or more U.S. persons who have the authority to
control all substantial decisions of the trust or (y) which has made an election to be treated as a U.S. person.
TAXATION OF DISTRIBUTIONS
Subject to the passive foreign investment company rules described below, distributions paid on ordinary shares will be treated as dividends to the
extent paid out of current or accumulated earnings and profits (as determined under U.S. federal income tax principles). Because we do not maintain calculations of our earnings and profits under U.S.
federal income tax principles, it is expected that distributions generally will be reported to you as dividends. Subject to applicable limitations, dividends received by non-corporate U.S.
Holders in taxable years beginning before January 1, 2013 will be taxable at a maximum rate of 15% provided that the U.S. Holder has held the shares for the required holding period set forth
under the Internal Revenue Code. U.S. Holders should consult their own tax advisors regarding the implications of these rules in their particular circumstances. Distributions in excess of current and
accumulated earnings and profits generally will be applied against and reduce your basis in our ordinary shares (but not below zero) and, to the extent in excess of such basis, will be treated as gain
from the sale or exchange of such ordinary shares as described below under the heading "Sale and Other Disposition of Ordinary Shares".
In
general, dividends will not be eligible for the dividends received deduction generally allowed to U.S. corporations under the Internal Revenue Code. Any dividends received will generally be treated
as foreign-source dividend income to you.
SALE AND OTHER DISPOSITION OF ORDINARY SHARES
Subject to the passive foreign investment company rules described below, for U.S. federal income tax purposes, gain or loss you realize on the sale
or other disposition of ordinary shares will be capital gain or loss, and will be long-term capital gain or loss if you have held the ordinary shares for more than one year. The amount of
your gain or loss will be equal to the difference between your tax basis in the ordinary shares disposed of and the amount realized on the disposition. The deductibility of capital losses is subject
to limitations. Such gain or loss will generally be U.S.-source gain or loss for foreign tax credit purposes.
181
Table of Contents
Taxation
PASSIVE FOREIGN INVESTMENT COMPANY RULES
We believe that we are not currently, and will not be considered in the future, a "passive foreign investment company" ("PFIC") for U.S. federal
income tax purposes. However, since PFIC status depends upon the composition of a company's income and assets and the market value of its assets (including, among others, less than 25 percent
owned equity investments) from time to time, there can be no assurance that we will not be considered a PFIC for any taxable year. If we were treated as a PFIC for any taxable year during which you
held our ordinary shares, certain adverse consequences could apply to you.
If
we are treated as a PFIC for any taxable year, gain recognized by you on a sale or other disposition of an ordinary share would be allocated ratably over your holding period for the ordinary share.
The amounts allocated to the taxable year of the sale or other exchange and to any year before we became a PFIC would be taxed as ordinary income. The amount allocated to each other taxable year would
be subject to tax at the highest rate in effect for individuals or corporations, as appropriate, and an interest charge would be imposed on the amount allocated to such taxable year. Further, to the
extent that any distribution received by you in a taxable year exceeds 125% of the average of the annual distributions on the ordinary shares received during the preceding three years or your holding
period, whichever is shorter, that distribution would be subject to taxation in the same manner as gain, described immediately above. In addition, if we were to be treated as a PFIC for a taxable year
in which we pay a dividend or for the prior taxable year, the 15% dividend rate discussed above with respect to dividends paid to non-corporate holders would not apply. Certain elections
may be available (described below) to U.S. Holders that may mitigate the adverse consequences resulting from PFIC status.
A
U.S. Holder of "marketable stock" in a PFIC may make a mark-to-market election, provided that the ordinary shares are actively traded. We anticipate that the ordinary shares
should qualify as being actively traded, but no assurances may be given in this regard. If a U.S. Holder of ordinary shares makes this election, the U.S. Holder of ordinary shares will generally
(i) include as income for each taxable year the excess, if any, of the fair market value of ordinary shares held at the end of the taxable year over the adjusted tax basis of such ordinary
shares and (ii) deduct as a loss the excess, if any, of the adjusted tax basis of the ordinary shares over the fair market value of such ordinary shares held at the end of the taxable year, but
only to the extent of the amount previously included in income as a result of the mark-to-market election. The U.S. Holder's adjusted tax basis in the ordinary shares would be
adjusted to reflect any income or loss resulting from the mark-to-market election. If a U.S. holder makes a mark-to-market election in respect of a
corporation classified as a PFIC and such corporation ceases to be classified as a PFIC, the U.S. holder will not be required to take into account the gain or loss described above during any period
that such corporation is not classified as a PFIC.
A
qualified electing fund election (a "QEF election") could also alleviate certain of the tax consequences referred to above. However, it is expected that the conditions necessary for making a QEF
election will not apply in the case of our ordinary shares, because we do not expect to make available the information necessary for U.S. Holders to report income and certain losses in a manner
consistent with the requirements for such elections.
If
a U.S. Holder owns our ordinary shares during any taxable year that we are a PFIC, such U.S. Holder may be subject to certain reporting obligations with respect to our ordinary shares, including
reporting on IRS Form 8621. In the case of a U.S. Holder that has held ordinary shares during any taxable year in respect of which we were classified as a PFIC and continued to hold such
ordinary shares (or any portion thereof), and has not previously made a mark-to-market election, and that is now considering making a mark-to-market
election for the first time, special tax rules may apply relating to purging the PFIC taint of such ordinary shares. Each U.S. Holder is urged to consult its tax advisor concerning the United States
federal income tax
182
Table of Contents
Taxation
consequences
of purchasing, holding, and disposing ordinary shares if we are or become classified as a PFIC, including the possibility of making a mark-to-market election.
INFORMATION REPORTING AND BACKUP WITHHOLDING
Payment of dividends and sales proceeds that are made within the United States or through certain U.S.-related financial intermediaries generally are
subject to information reporting and to backup withholding unless (i) you are a corporation or other exempt recipient or (ii) in the case of backup withholding, you provide a correct
taxpayer identification number and certify that you are not subject to backup withholding.
The
amount of any backup withholding from a payment to you will be allowed as a credit against your U.S. federal income tax liability and may entitle you to a refund, provided that the required
information is furnished to the IRS.
For
taxable years beginning after March 18, 2010, new legislation requires certain U.S. Holders who are individuals to report information relating to stock of a non-U.S. person,
subject to certain exceptions (including an exception for stock held in custodial accounts maintained by a U.S. financial institution). U.S. Holders are urged to consult their tax advisors concerning
the effect, if any, of this legislation on their ownership and disposition of ordinary shares.
183
Table of Contents
Underwriting
We are offering the shares of our ordinary shares described in this prospectus and the accompanying prospectus through the
underwriters named below. UBS Securities LLC and Piper Jaffray & Co. are the joint book-running managers of this offering and the representatives of the underwriters.
We have entered into an underwriting agreement with the representatives. Subject to the terms and conditions of the underwriting agreement to be dated on or
about , 2012, each of the
underwriters has severally agreed to purchase and we have agreed to sell to the underwriters, the number of ordinary shares listed next to its name in the following table.
|
|
|
|
|
|
|
Underwriters
|
|
Number of
shares
|
|
| |
|
UBS Securities LLC |
|
|
|
|
Piper Jaffray & Co. |
|
|
|
|
Needham & Company, LLC |
|
|
|
|
Oppenheimer & Co. Inc. |
|
|
|
|
| |
|
|
|
| |
|
Total |
|
|
|
|
| |
|
|
|
The underwriting agreement provides that the underwriters must buy all of the shares if they buy any of them. However, the underwriters are not required to take
or pay for the shares covered by the underwriters' over-allotment option described below.
Our
ordinary shares are offered subject to a number of conditions, including:
- –>
- the
closing of each of the senior secured notes offering and the senior secured revolving credit facility,
- –>
- receipt
and acceptance of our ordinary shares by the underwriters, and
- –>
- the
underwriters' right to reject orders in whole or in part.
In
connection with this offering, certain of the underwriters or securities dealers may distribute prospectuses electronically.
OVER-ALLOTMENT OPTION
We have granted the underwriters an option to buy up to an aggregate
of additional ordinary shares. If the underwriters exercise
their option in full, we will issue and sell up to ordinary shares. The underwriters may
exercise this option solely for the purpose of covering over-allotments, if any,
made in connection with this offering. The underwriters have 30 days from the date of this prospectus to exercise this option. If the underwriters exercise this option, they will each purchase
additional shares approximately in proportion to the amounts specified in the table above.
COMMISSIONS AND DISCOUNTS
Shares sold by the underwriters to the public will initially be offered at the public offering price set forth on the cover of this prospectus. Any
shares sold by the underwriters to securities dealers may be sold at a discount of up to $ per share from the public offering price. Sales of shares made outside the United
States may
be made by affiliates of the underwriters. If all the shares are not sold at the public offering price, the representatives may change the offering price and the other selling terms. Upon execution of
the underwriting agreement, the underwriters will be obligated to purchase the shares at the prices and upon the terms stated therein.
184
Table of Contents
Underwriting
The
following table shows the per share and total underwriting discounts and commissions we will pay to the underwriters assuming both no exercise and full exercise of the underwriters' option to
purchase additional ordinary shares from us.
|
|
|
|
|
|
|
|
|
|
|
|
No exercise
|
|
Full exercise
|
|
| |
|
Per share |
|
$ |
|
|
$ |
|
|
| |
|
Total |
|
$ |
|
|
$ |
|
|
We estimate that the total expenses of this offering payable by us, not including the underwriting discounts and commissions, will be approximately
$ .
NO SALES OF SIMILAR SECURITIES
We, our executive officers and directors and certain holders of our outstanding ordinary shares, stock options and other equity awards that together
hold at least % of our outstanding ordinary shares have entered into lock-up agreements with the underwriters. Under these agreements, subject to certain exceptions, we and
each of these persons may not, without the prior written approval of UBS Securities LLC, offer, sell, contract to sell or otherwise dispose of, directly or indirectly, or hedge our ordinary
shares or securities convertible into or exchangeable or exercisable for our ordinary shares. These restrictions will be in effect for a period of 180 days after the date of this prospectus. At
any time and without public notice, UBS Securities LLC, may, in its sole discretion, release some or all of the securities from these lock-up agreements.
INDEMNIFICATION
We have agreed to indemnify the underwriters against certain liabilities, including certain liabilities under the Securities Act. If we are unable to
provide this indemnification, we have agreed to contribute to payments the underwriters may be required to make in respect of those liabilities.
NASDAQ GLOBAL MARKET LISTING
We have applied to have our ordinary shares listed on the Nasdaq Global Market under the symbol "ISLA".
PRICE STABILIZATION, SHORT POSITIONS
In connection with this offering, the underwriters may engage in activities that stabilize, maintain or otherwise affect the price of our ordinary
shares, including:
- –>
- stabilizing
transactions;
- –>
- short
sales;
- –>
- purchases
to cover positions created by short sales;
- –>
- imposition
of penalty bids; and
- –>
- syndicate
covering transactions.
Stabilizing
transactions consist of bids or purchases made for the purpose of preventing or retarding a decline in the market price of our ordinary shares while this offering is in progress. These
transactions may also include making short sales of our ordinary shares, which involve the sale by the underwriters of a greater number of ordinary shares than they are required to purchase in this
offering, and purchasing ordinary shares on the open market to cover positions created by short sales. Short sales may be "covered
185
Table of Contents
Underwriting
short
sales", which are short positions in an amount not greater than the underwriters' over-allotment option referred to above, or may be "naked short sales", which are short positions in
excess of that amount.
The
underwriters may close out any covered short position by either exercising their over-allotment option, in whole or in part, or by purchasing shares in the open market. In making this
determination, the underwriters will consider, among other things, the price of shares available for purchase in the open market as compared to the price at which they may purchase shares through the
over-allotment option.
Naked
short sales are short sales made in excess of the over-allotment option. The underwriters must close out any naked short position by purchasing shares in the open market. A naked
short position is more likely to be created if the underwriters are concerned that there may be downward pressure on the price of the ordinary shares in the open market that could adversely affect
investors who purchased in this offering.
The
underwriters also may impose a penalty bid. This occurs when a particular underwriter repays to the underwriters a portion of the underwriting discount received by it because the representatives
have repurchased shares sold by or for the account of that underwriter in stabilizing or short covering transactions.
As
a result of these activities, the price of our ordinary shares may be higher than the price that otherwise might exist in the open market. If these activities are commenced, they may be
discontinued
by the underwriters at any time. The underwriters may carry out these transactions on Nasdaq, in the over-the-counter market or otherwise.
DETERMINATION OF OFFERING PRICE
Prior to this offering, there was no public market for our ordinary shares. The initial public offering price will be determined by negotiation by us
and the representatives of the underwriters. The principal factors to be considered in determining the initial public offering price include:
- –>
- the
information set forth in this prospectus and otherwise available to representatives;
- –>
- our
history and prospects and the history and prospects for the industry in which we compete;
- –>
- our
past and present financial performance and an assessment of our management;
- –>
- our
prospects for future earnings and the present state of our development;
- –>
- the
general condition of the securities market at the time of this offering;
- –>
- the
recent market prices of, and demand for, publicly traded common stock of generally comparable companies; and
- –>
- other
factors deemed relevant by the underwriters and us.
AFFILIATIONS
Certain of the underwriters and their affiliates have in the past provided, are currently providing and may in the future from time to time provide,
investment banking and other financing, trading, banking, research, transfer agent and trustee services to the Company or its subsidiaries, for which they have in the past received, and may currently
or in the future receive, customary fees and expenses.
In
connection with the issuance of our new senior secured notes, UBS Securities LLC is acting as an initial purchaser. In connection with our new senior secured revolving credit facility, UBS
Securities LLC and its affiliates are acting as joint lead arranger, documentation agent, joint lead bookrunner, issuing bank, administrative agent, collateral agent, swingline lender and
lender.
186
Table of Contents
Underwriting
NOTICE TO INVESTORS
Notice to Prospective Investors in the European Economic Area. In relation to each member state of the European Economic Area that has implemented the Prospectus
Directive (each, a relevant member state), other than Germany, with effect from and including the date on which the Prospectus Directive is implemented in that relevant member state (the relevant
implementation date), an offer of securities described in this prospectus may not be made to the public in that relevant member state other than:
- –>
- to
any legal entity which is a qualified investor as defined in the Prospectus Directive;
- –>
- by
the Bookrunners to fewer than 100, or, if the Relevant Member State has implemented the relevant provisions of the 2010 PD Amending Directive, 150, natural or
legal persons (other than qualified investors as defined in the Prospectus Directive), as permitted under the Prospectus Directive, subject to obtaining the prior consent of the Bookrunners for any
such offer; or
- –>
- in
any other circumstances falling within Article 3(2) of the Prospectus Directive,
provided
that no such offer of securities shall require us or any underwriter to publish a prospectus pursuant to Article 3 of the Prospectus Directive.
For
purposes of this provision, the expression an "offer of securities to the public" in any relevant member state means the communication in any form and by any means of sufficient information on the
terms of the offer and the securities to be offered so as to enable an investor to decide to purchase or subscribe for the securities, as the expression may be varied in that member state by any
measure implementing the Prospectus Directive in that member state, and the expression "Prospectus Directive" means Directive 2003/71/EC (and amendments thereto, including the 2010 PD Amending
Directive, to the extent implemented in the Relevant Member State), and includes any relevant implementing measure in the Relevant Member State, and includes any relevant implementing measure in each
relevant member state. The expression 2010 PD Amending Directive means Directive 2010/73/EU.
We
have not authorized and do not authorize the making of any offer of securities through any financial intermediary on their behalf, other than offers made by the underwriters with a view to the
final placement of the securities as contemplated in this prospectus. Accordingly, no purchaser of the securities, other than the underwriters, is authorized to make any further offer of the
securities on behalf of us or the underwriters.
The
EEA selling restriction is in addition to any other selling restrictions set out in this prospectus.
Notice to Prospective Investors in Australia. This offering memorandum is not a formal disclosure
document and has not been, nor will be, lodged with the Australian Securities and Investments Commission. It does not purport to contain all information that an investor or their professional advisers
would expect to find in a prospectus or other disclosure document (as defined in the Corporations Act 2001 (Australia)) for the purposes of Part 6D.2 of the Corporations Act 2001 (Australia) or
in a product disclosure statement for the purposes of Part 7.9 of the Corporations Act 2001 (Australia), in either case, in relation to the securities.
The
securities are not being offered in Australia to "retail clients" as defined in sections 761G and 761GA of the Corporations Act 2001 (Australia). This offering is being made in Australia
solely to "wholesale clients" for the purposes of section 761G of the Corporations Act 2001 (Australia) and, as such, no prospectus, product disclosure statement or other disclosure document in
relation to the securities has been, or will be, prepared.
This
offering memorandum does not constitute an offer in Australia other than to wholesale clients. By submitting an application for our securities, you represent and warrant to us that you are a
wholesale client for the purposes of section 761G of the Corporations Act 2001 (Australia). If any recipient of this offering
187
Table of Contents
Underwriting
memorandum
is not a wholesale client, no offer of, or invitation to apply for, our securities shall be deemed to be made to such recipient and no applications for our securities will be accepted from
such recipient. Any offer to a recipient in Australia, and any agreement arising from acceptance of such offer, is personal and may only be accepted by the recipient. In addition, by applying for our
securities you undertake to us that, for a period of 12 months from the date of issue of the securities, you will not transfer any interest in the securities to any person in Australia other
than to a wholesale client.
Notice to Prospective Investors in Hong Kong. Our securities may not be offered or sold in Hong Kong, by means of this prospectus or any document other than
(i) to "professional investors" within the meaning of the Securities and Futures Ordinance (Cap.571, Laws of Hong Kong) and any rules made thereunder, or (ii) in circumstances which do
not constitute an offer to the public within the meaning of the Companies Ordinance (Cap.32, Laws of Hong Kong), or (iii) in other circumstances which do not result in the document being a
"prospectus" within the meaning of the Companies Ordinance (Cap.32, Laws of Hong Kong). No advertisement, invitation or document relating to our securities may be issued or may be in the possession of
any person for the purpose of issue (in each case whether in Hong Kong or elsewhere) which is directed at, or the contents of which are likely to be accessed or read by, the public in Hong Kong
(except if permitted to do so under the securities laws of Hong Kong) other than with respect to the securities which are or are intended to be disposed of only to persons outside Hong Kong or only to
"professional investors" within the meaning of the Securities and Futures Ordinance (Cap. 571, Laws of Hong Kong) and any rules made thereunder.
Notice to Prospective Investors in Japan. Our securities have not been and will not be registered under the Financial Instruments and Exchange Law of Japan ("the
Financial Instruments and Exchange Law") and our securities will not be offered or sold, directly or indirectly, in Japan, or to, or for the benefit of, any resident of Japan (which term as used
herein means any person resident in Japan, including any corporation or other entity organized under the laws of Japan), or to others for re-offering or resale, directly or indirectly, in
Japan, or to a resident of Japan, except pursuant to an exemption from the registration requirements of, and otherwise in compliance with, the Financial Instruments and Exchange Law and any other
applicable laws, regulations and ministerial guidelines of Japan.
Notice to Prospective Investors in Singapore. This document has not been registered as a prospectus with the Monetary Authority of Singapore and in Singapore, the
offer and sale of our securities is made pursuant to exemptions provided in sections 274 and 275 of the Securities and Futures Act, Chapter 289 of Singapore ("SFA"). Accordingly, this
prospectus and any other document or material in connection with the offer or sale, or invitation for subscription or purchase, of our securities may not be circulated or distributed, nor may our
securities be offered or sold, or be made the subject of an invitation for subscription or purchase, whether directly or indirectly, to persons in Singapore other than (i) to an institutional
investor as defined in Section 4A of the SFA pursuant to Section 274 of the SFA, (ii) to a relevant person as defined in section 275(2) of the SFA pursuant to
Section 275(1) of the SFA, or any person pursuant to Section 275(1A) of the SFA, and in accordance with the conditions specified in Section 275 of the SFA or
(iii) otherwise pursuant to, and in accordance with the conditions of, any other applicable provision of the SFA, in each case subject to compliance with the conditions (if any) set forth in
the SFA. Moreover, this document is not a prospectus as defined in the SFA. Accordingly, statutory liability under the SFA in relation to the content of prospectuses would not apply. Prospective
investors in Singapore should consider carefully whether an investment in our securities is suitable for them.
188
Table of Contents
Underwriting
Where
our securities are subscribed or purchased under Section 275 of the SFA by a relevant person which is:
- –>
- by
a corporation (which is not an accredited investor as defined in Section 4A of the SFA) the sole business of which is to hold investments and the entire
share capital of which is owned by one or more individuals, each of whom is an accredited investor; or
- –>
- for
a trust (where the trustee is not an accredited investor) whose sole purpose is to hold investments and each beneficiary of the trust is an individual who is an
accredited investor,
- –>
- for
a trust (where the trustee is not an accredited investor) whose sole purpose is to hold investments and each beneficiary of the trust is an individual who is an
accredited investor,
shares
of that corporation or the beneficiaries' rights and interest (howsoever described) in that trust shall not be transferable for six months after that corporation or that trust has acquired the
shares under Section 275 of the SFA, except:
- –>
- to
an institutional investor (for corporations under Section 274 of the SFA) or to a relevant person defined in Section 275(2) of the SFA, or any
person pursuant to an offer that is made on terms that such shares of that corporation or such rights and interest in that trust are acquired at a consideration of not less than S$200,000 (or its
equivalent in a foreign currency) for each transaction, whether such amount is to be paid for in cash or by exchange of securities or other assets, and further for corporations, in accordance with the
conditions, specified in Section 275 of the SFA;
- –>
- where
no consideration is given for the transfer; or
- –>
- where
the transfer is by operation of law.
In
addition, investors in Singapore should note that the securities acquired by them are subject to resale and transfer restrictions specified under Section 276 of the SFA, and they, therefore,
should seek their own legal advice before effecting any resale or transfer of their securities.
Notice to Prospective Investors in Switzerland. The Prospectus does not constitute an issue prospectus pursuant to Article 652a or Article 1156 of
the Swiss Code of Obligations ("CO") and the shares will not be listed on the SIX Swiss Exchange. Therefore, the Prospectus may not comply with the disclosure
standards of the CO and/or the listing rules (including any prospectus schemes) of the SIX Swiss Exchange. Accordingly, the shares may not be offered to the public in or from Switzerland, but only to
a selected and limited circle of investors, which do not subscribe to the shares with a view to distribution.
Notice to Prospective Investors in the United Kingdom. This prospectus is only being distributed to and is only directed at: (1) persons who are outside the
United Kingdom; (2) investment professionals falling within Article 19(5) of the Financial Services and Markets Act 2000 (Financial Promotion) Order 2005 (the "Order"); or
(3) high net worth companies, and other persons to whom it may lawfully be communicated, falling within Article 49(2)(a) to (d) of the Order (all such persons falling within
(1)–(3) together being referred to as "relevant persons"). The shares are only available to, and any invitation, offer or agreement to subscribe, purchase or otherwise acquire such shares
will be engaged in only with, relevant persons. Any person who is not a relevant person should not act or rely on this prospectus or any of its contents.
189
Table of Contents
Validity of Ordinary Shares
Certain legal matters as to U.S. law in connection with this offering will be passed upon for us by DLA Piper LLP (US),
Phoenix, Arizona. The validity of the ordinary shares offered hereby and certain other matters will be passed upon for us by Appleby, Cayman Islands. Certain legal matters relating to the offering
will be passed upon for the underwriters by Davis Polk & Wardwell LLP, Menlo Park, California.
Experts
The consolidated financial statements of Isola Group S.à r.l. and Subsidiaries as of December 31, 2011, and
January 1, 2011 and for each of the three years in the period ended December 31, 2011 included in this prospectus and the related financial statement schedules included elsewhere in the
registration statement have been audited by Deloitte & Touche LLP, an independent registered public accounting firm, as stated in their reports appearing herein and elsewhere in the
registration statement. Such financial statements and financial statement schedules are included in reliance upon the reports of such firm given upon their authority as experts in accounting and
auditing.
The
balance sheet of Isola Group Ltd. as of December 31, 2011 included in this prospectus has been audited by Deloitte & Touche LLP, an independent registered public
accounting firm, as stated in their report appearing herein. Such balance sheet is included in reliance upon the report of such firm given upon their authority as experts in accounting and auditing.
Additional Information
We have filed with the SEC a registration statement on Form S-1 under the Securities Act to register our ordinary
shares being offered in this prospectus. This prospectus, which forms part of the registration statement, does not contain all of the information included in the registration statement and the
exhibits and schedules thereto. You will find additional information about us and our ordinary shares in the registration statement. You may read and copy the registration statement and the exhibits
and schedules thereto, as well as other information that we file with the SEC, at the public reference facilities maintained by the SEC at 100 F Street, N.E., Washington, DC 20549. You may
obtain information on the operation of the Public Reference Room by calling the SEC at 1-800-SEC-0330. The SEC also maintains a website (http://www.sec.gov) that
contains information that registrants, including us, file electronically with the SEC. Statements made in this prospectus about legal documents may not necessarily be complete and you should read the
documents, which are filed as exhibits to the registration statement or otherwise filed with the SEC. Our website address is www.isola-group.com. The contents of our website are not part of this
prospectus.
190
Table of Contents
ISOLA GROUP S.À R.L. AND SUBSIDIARIES,
A WHOLLY OWNED SUBSIDIARY OF TPG HATTRICK PARTNERS, L.P.
INDEX TO CONSOLIDATED FINANCIAL STATEMENTS
|
|
|
|
Consolidated Financial Statements of Isola Group S.à r.l. and subsidiaries as of December 31, 2011 and January 1, 2011,
and for the fiscal years ended December 31, 2011, January 1, 2011, and December 26, 2009 |
| |
Report of Independent Registered Public Accounting Firm |
|
F-2 |
| |
Consolidated Balance Sheets |
|
F-3 |
| |
Consolidated Statements of Operations |
|
F-4 |
| |
Consolidated Statements of Comprehensive Loss |
|
F-5 |
| |
Consolidated Statements of Stockholder's Deficiency |
|
F-6 |
| |
Consolidated Statements of Cash Flows |
|
F-7 |
| |
Notes to Consolidated Financial Statements |
|
F-8 |
Consolidated Financial Statements of Isola Group S.à r.l. and subsidiaries as of September 29, 2012 and for the Nine Months
Ended September 29, 2012 and October 1, 2011 |
|
|
| |
Consolidated Balance Sheets (Unaudited) |
|
F-55 |
| |
Consolidated Statements of Operations (Unaudited) |
|
F-56 |
| |
Consolidated Statements of Comprehensive Loss (Unaudited) |
|
F-57 |
| |
Consolidated Statement of Stockholder's Deficiency (Unaudited) |
|
F-58 |
| |
Consolidated Statements of Cash Flows (Unaudited) |
|
F-59 |
| |
Notes to Consolidated Financial Statements (Unaudited) |
|
F-60 |
Balance Sheet of Isola Group Ltd. as of December 31, 2011 |
|
|
| |
Report of Independent Registered Public Accounting Firm |
|
F-84 |
| |
Balance Sheet |
|
F-85 |
| |
Notes to Balance Sheet |
|
F-86 |
Balance Sheet of Isola Group Ltd. as of September 29, 2012 |
|
|
| |
Balance Sheet (Unaudited) |
|
F-87 |
| |
Notes to Balance Sheet (Unaudited) |
|
F-88 |
F-1
Table of Contents
ISOLA GROUP S.À R.L. AND SUBSIDIARIES,
A WHOLLY OWNED SUBSIDIARY OF TPG HATTRICK PARTNERS, L.P.
REPORT OF INDEPENDENT REGISTERED PUBLIC ACCOUNTING FIRM
To the Board of Directors of
Isola Group S.à r.l. and subsidiaries
Chandler, Arizona
We have audited the accompanying consolidated balance sheets of Isola Group S.à r.l. and subsidiaries (the "Company") as of December 31, 2011 and January 1, 2011,
and the related consolidated statements of operations, comprehensive loss, stockholder's deficiency, and cash flows for the years ended December 31, 2011, January 1, 2011, and
December 26, 2009. These financial statements are the responsibility of the Company's management. Our responsibility is to express an opinion on these financial statements based on our audits.
We
conducted our audits in accordance with the standards of the Public Company Accounting Oversight Board (United States). Those standards require that we plan and perform the audit to obtain
reasonable assurance about whether the financial statements are free of material misstatement. The Company is not required to have, nor were we engaged to perform, an audit of its internal control
over financial reporting. Our audits included consideration of internal control over financial reporting as a basis for designing audit procedures that are appropriate in the circumstances, but not
for the purpose of expressing an opinion on the effectiveness of the Company's internal control over financial reporting. Accordingly, we express no such opinion. An audit also includes examining, on
a test basis, evidence supporting the amounts and disclosures in the financial statements, assessing the accounting principles used and significant estimates made by management, as well as evaluating
the overall financial statement presentation. We believe that our audits provide a reasonable basis for our opinion.
In our opinion, such consolidated financial statements present fairly, in all material respects, the financial position of Isola Group S.à r.l. and subsidiaries as of
December 31, 2011 and January 1, 2011, and the results of their operations and their cash flows for the years ended December 31, 2011, January 1, 2011, and
December 26, 2009, in conformity with accounting principles generally accepted in the United States of America.
As
discussed in Note 1 to the consolidated financial statements, the accompanying consolidated financial statements have been retrospectively adjusted for the presentation of separate
consolidated statements of comprehensive loss.
/s/
DELOITTE & TOUCHE LLP
Phoenix, Arizona
March 15, 2012 (May 11, 2012 as to the effects of the retrospective presentation of separate
consolidated statements of comprehensive loss, discussed in Note 1)
F-2
Table of Contents
ISOLA GROUP S.À R.L. AND SUBSIDIARIES,
A WHOLLY OWNED SUBSIDIARY OF TPG HATTRICK PARTNERS, L.P.
CONSOLIDATED BALANCE SHEETS
As of December 31, 2011 and January 1, 2011
|
|
|
|
|
|
|
|
|
|
|
|
December 31,
2011
|
|
January 1,
2011
|
|
| |
|
|
|
(In thousands, except for
share data)
|
|
ASSETS |
|
|
|
|
|
|
|
CURRENT ASSETS: |
|
|
|
|
|
|
|
| |
Cash |
|
$ |
47,481 |
|
$ |
36,733 |
|
| |
Restricted cash |
|
|
— |
|
|
5,461 |
|
| |
Accounts receivable—net of allowance for doubtful accounts of $1,825 and $3,896 at December 31, 2011 and January 1, 2011,
respectively |
|
|
108,589 |
|
|
103,489 |
|
| |
Other receivables |
|
|
3,046 |
|
|
2,739 |
|
| |
Inventories |
|
|
36,660 |
|
|
45,066 |
|
| |
Deferred tax assets |
|
|
1,937 |
|
|
2,697 |
|
| |
Prepaid expenses and other current assets |
|
|
9,196 |
|
|
5,023 |
|
| |
|
|
|
|
|
| |
|
Total current assets |
|
|
206,909 |
|
|
201,208 |
|
RESTRICTED CASH |
|
|
1,544 |
|
|
1,886 |
|
PROPERTY, PLANT, AND EQUIPMENT—Net |
|
|
131,818 |
|
|
139,597 |
|
INTANGIBLE ASSETS—Net |
|
|
6,172 |
|
|
7,421 |
|
DEFERRED TAX ASSETS |
|
|
7,485 |
|
|
7,747 |
|
DEBT ISSUANCE COSTS AND OTHER ASSETS |
|
|
14,246 |
|
|
19,335 |
|
| |
|
|
|
|
|
TOTAL ASSETS |
|
$ |
368,174 |
|
$ |
377,194 |
|
| |
|
|
|
|
|
LIABILITIES AND STOCKHOLDER'S DEFICIENCY |
|
|
|
|
|
|
|
CURRENT LIABILITIES: |
|
|
|
|
|
|
|
| |
Accounts payable |
|
$ |
66,631 |
|
$ |
70,156 |
|
| |
Short-term debt and current portion—long-term debt |
|
|
15,090 |
|
|
21,084 |
|
| |
Accrued liabilities |
|
|
47,583 |
|
|
38,964 |
|
| |
Deferred tax liabilities |
|
|
72 |
|
|
277 |
|
| |
Other current liabilities |
|
|
1,102 |
|
|
1,122 |
|
| |
|
|
|
|
|
| |
|
Total current liabilities |
|
|
130,478 |
|
|
131,603 |
|
LONG-TERM DEBT—Net of current portion |
|
|
317,368 |
|
|
292,079 |
|
CONVERTIBLE PREFERRED CERTIFICATES |
|
|
208,009 |
|
|
199,136 |
|
CAPITAL LEASE OBLIGATIONS—Net of current portion |
|
|
14,224 |
|
|
14,468 |
|
EMBEDDED DERIVATIVES |
|
|
28,924 |
|
|
70,260 |
|
PENSION AND OTHER RETIREMENT BENEFITS |
|
|
55,477 |
|
|
42,532 |
|
UNCERTAIN TAX POSITIONS AND OTHER LIABILITIES |
|
|
15,121 |
|
|
23,446 |
|
DEFERRED TAX LIABILITIES |
|
|
3,351 |
|
|
5,099 |
|
| |
|
|
|
|
|
| |
|
Total liabilities |
|
|
772,952 |
|
|
778,623 |
|
| |
|
|
|
|
|
COMMITMENTS AND CONTINGENCIES (Note 8) |
|
|
|
|
|
|
|
STOCKHOLDER'S DEFICIENCY: |
|
|
|
|
|
|
|
| |
Common stock, 25 euro par value ($31)—500 shares authorized, issued, and outstanding |
|
|
15 |
|
|
15 |
|
| |
Additional paid-in capital |
|
|
33,269 |
|
|
30,652 |
|
| |
Accumulated deficit |
|
|
(388,494 |
) |
|
(398,467 |
) |
| |
Accumulated other comprehensive loss |
|
|
(49,568 |
) |
|
(33,629 |
) |
| |
|
|
|
|
|
| |
|
Total stockholder's deficiency |
|
|
(404,778 |
) |
|
(401,429 |
) |
| |
|
|
|
|
|
TOTAL LIABILITIES AND STOCKHOLDER'S DEFICIENCY |
|
$ |
368,174 |
|
$ |
377,194 |
|
| |
|
|
|
|
|
See notes to consolidated financial statements.
F-3
Table of Contents
ISOLA GROUP S.À R.L. AND SUBSIDIARIES,
A WHOLLY OWNED SUBSIDIARY OF TPG HATTRICK PARTNERS, L.P.
CONSOLIDATED STATEMENTS OF OPERATIONS
For the fiscal years ended December 31, 2011, January 1, 2011, and December 26, 2009
|
|
|
|
|
|
|
|
|
|
|
|
|
|
|
December 31,
2011
|
|
January 1,
2011
|
|
December 26,
2009
|
|
| |
|
|
|
(In thousands, except for share data)
|
|
REVENUES |
|
$ |
596,989 |
|
$ |
611,987 |
|
$ |
424,199 |
|
COST OF GOODS SOLD |
|
|
455,404 |
|
|
467,751 |
|
|
342,832 |
|
| |
|
|
|
|
|
|
|
GROSS PROFIT |
|
|
141,585 |
|
|
144,236 |
|
|
81,367 |
|
| |
|
|
|
|
|
|
|
OPERATING EXPENSES |
|
|
|
|
|
|
|
|
|
|
| |
Sales, general, and administrative |
|
|
77,545 |
|
|
65,271 |
|
|
61,816 |
|
| |
Research and development |
|
|
10,653 |
|
|
9,532 |
|
|
9,239 |
|
| |
Restructuring |
|
|
1,250 |
|
|
4,782 |
|
|
17,497 |
|
| |
Loss on liquidation of subsidiary |
|
|
— |
|
|
— |
|
|
3,548 |
|
| |
|
|
|
|
|
|
|
| |
|
Total operating expenses |
|
|
89,448 |
|
|
79,585 |
|
|
92,100 |
|
OPERATING INCOME / (LOSS)—Net |
|
|
52,137 |
|
|
64,651 |
|
|
(10,733 |
) |
OTHER INCOME—Net |
|
|
1,629 |
|
|
4,758 |
|
|
1,268 |
|
EMBEDDED DERIVATIVE GAIN / (LOSS)—Net |
|
|
42,256 |
|
|
21,165 |
|
|
(27,513 |
) |
INTEREST EXPENSE |
|
|
(80,210 |
) |
|
(72,134 |
) |
|
(54,893 |
) |
INTEREST INCOME |
|
|
221 |
|
|
339 |
|
|
567 |
|
FOREIGN EXCHANGE GAIN / (LOSS)—Net |
|
|
4,833 |
|
|
9,596 |
|
|
(2,083 |
) |
| |
|
|
|
|
|
|
|
INCOME / (LOSS) BEFORE TAXES |
|
|
20,866 |
|
|
28,375 |
|
|
(93,387 |
) |
PROVISION FOR INCOME TAXES |
|
|
(10,893 |
) |
|
(27,158 |
) |
|
(7,339 |
) |
| |
|
|
|
|
|
|
|
NET INCOME / (LOSS) |
|
$ |
9,973 |
|
$ |
1,217 |
|
$ |
(100,726 |
) |
| |
|
|
|
|
|
|
|
NET INCOME / (LOSS) PER COMMON SHARE |
|
$ |
19.95 |
|
$ |
2.43 |
|
$ |
(201.45 |
) |
| |
|
|
|
|
|
|
|
WEIGHTED AVERAGE NUMBER OF COMMON AND POTENTIAL COMMON SHARES OUTSTANDING |
|
|
|
|
|
|
|
|
|
|
| |
Basic |
|
|
500 |
|
|
500 |
|
|
500 |
|
| |
|
|
|
|
|
|
|
| |
Diluted |
|
|
500 |
|
|
500 |
|
|
500 |
|
| |
|
|
|
|
|
|
|
PRO FORMA NET INCOME PER COMMON SHARE (unaudited) |
|
|
|
|
|
|
|
|
|
|
| |
Basic |
|
$ |
|
|
|
|
|
|
|
|
| |
|
|
|
|
|
|
|
|
|
| |
Diluted |
|
$ |
|
|
|
|
|
|
|
|
| |
|
|
|
|
|
|
|
|
|
WEIGHTED AVERAGE NUMBER OF COMMON AND POTENTIAL COMMON SHARES USED IN COMPUTING PRO FORMA NET INCOME PER SHARE (unaudited) |
|
|
|
|
|
|
|
|
|
|
| |
Basic |
|
|
|
|
|
|
|
|
|
|
| |
|
|
|
|
|
|
|
|
|
| |
Diluted |
|
|
|
|
|
|
|
|
|
|
| |
|
|
|
|
|
|
|
|
|
See notes to consolidated financial statements.
F-4
Table of Contents
ISOLA GROUP S.À R.L. AND SUBSIDIARIES,
A WHOLLY OWNED SUBSIDIARY OF TPG HATTRICK PARTNERS, L.P.
CONSOLIDATED STATEMENTS OF COMPREHENSIVE LOSS
For the fiscal years ended December 31, 2011, January 1, 2011 and December 26, 2009
|
|
|
|
|
|
|
|
|
|
|
|
|
|
|
|
December 31,
2011
|
|
January 1,
2011
|
|
December 26,
2009
|
|
| |
|
|
|
(In thousands)
|
|
Net income (loss) |
|
$ |
9,973 |
|
$ |
1,217 |
|
$ |
(100,726 |
) |
| |
Other comprehensive income (loss), net of tax: |
|
|
|
|
|
|
|
|
|
|
| |
|
Foreign currency translation adjustment |
|
|
(91 |
) |
|
1,804 |
|
|
(2,827 |
) |
| |
|
Pension and other postretirement plans: |
|
|
|
|
|
|
|
|
|
|
| |
|
|
Amortization of net prior service cost included in net income |
|
|
(469 |
) |
|
(426 |
) |
|
(503 |
) |
| |
|
|
Amortization of net actuarial gain (loss) included in net income (net of tax of $66, $77 and $476 for the fiscal years ended December 31, 2011,
January 1, 2011 and December 26, 2009, respectively) |
|
|
(15,379 |
) |
|
(8,158 |
) |
|
6,499 |
|
| |
|
|
|
|
|
|
|
| |
|
Total pension and other postretirement plans |
|
|
(15,848 |
) |
|
(8,584 |
) |
|
5,996 |
|
| |
Total other comprehensive income (loss), net of tax |
|
|
(15,939 |
) |
|
(6,780 |
) |
|
3,169 |
|
| |
|
|
|
|
|
|
|
Comprehensive loss |
|
$ |
(5,966 |
) |
$ |
(5,563 |
) |
$ |
(97,557 |
) |
| |
|
|
|
|
|
|
|
See notes to consolidated financial statements.
F-5
Table of Contents
ISOLA GROUP S.À R.L. AND SUBSIDIARIES,
A WHOLLY OWNED SUBSIDIARY OF TPG HATTRICK PARTNERS, L.P.
CONSOLIDATED STATEMENTS OF STOCKHOLDER'S DEFICIENCY
For the fiscal years ended December 31, 2011, January 1, 2011 and December 26, 2009
|
|
|
|
|
|
|
|
|
|
|
|
|
|
|
|
|
|
|
|
|
Common stock |
|
|
|
|
|
Accumulated
other
comprehensive
loss
|
|
Total
stockholder's
deficiency
|
|
|
|
Additional
paid-in capital
|
|
Accumulated
deficit
|
|
|
|
Shares
|
|
Amount
|
|
| |
|
|
|
(In thousands, except for share data)
|
|
BALANCE—December 27, 2008 |
|
500 |
|
$ |
15 |
|
$ |
26,403 |
|
$ |
(298,958 |
) |
$ |
(30,018 |
) |
$ |
(302,558 |
) |
Stock-based compensation |
|
|
|
|
|
|
|
1,757 |
|
|
|
|
|
|
|
|
1,757 |
|
Net loss |
|
|
|
|
|
|
|
|
|
|
(100,726 |
) |
|
|
|
|
(100,726 |
) |
Total other comprehensive income |
|
|
|
|
|
|
|
|
|
|
|
|
|
3,169 |
|
|
3,169 |
|
| |
|
|
|
|
|
|
|
|
|
|
|
|
|
BALANCE—December 26, 2009 |
|
500 |
|
$ |
15 |
|
$ |
28,160 |
|
$ |
(399,684 |
) |
$ |
(26,849 |
) |
$ |
(398,358 |
) |
| |
|
|
|
|
|
|
|
|
|
|
|
|
|
Capital contribution |
|
|
|
|
|
|
|
577 |
|
|
|
|
|
|
|
|
577 |
|
Stock-based compensation |
|
|
|
|
|
|
|
1,915 |
|
|
|
|
|
|
|
|
1,915 |
|
Net income |
|
|
|
|
|
|
|
|
|
|
1,217 |
|
|
|
|
|
1,217 |
|
Total other comprehensive loss |
|
|
|
|
|
|
|
|
|
|
|
|
|
(6,780 |
) |
|
(6,780 |
) |
| |
|
|
|
|
|
|
|
|
|
|
|
|
|
BALANCE—January 1, 2011 |
|
500 |
|
$ |
15 |
|
$ |
30,652 |
|
$ |
(398,467 |
) |
$ |
(33,629 |
) |
$ |
(401,429 |
) |
| |
|
|
|
|
|
|
|
|
|
|
|
|
|
Stock-based compensation |
|
|
|
|
|
|
|
2,617 |
|
|
|
|
|
|
|
|
2,617 |
|
Net income |
|
|
|
|
|
|
|
|
|
|
9,973 |
|
|
|
|
|
9,973 |
|
Total other comprehensive loss |
|
|
|
|
|
|
|
|
|
|
|
|
|
(15,939 |
) |
|
(15,939 |
) |
| |
|
|
|
|
|
|
|
|
|
|
|
|
|
BALANCE—December 31, 2011 |
|
500 |
|
$ |
15 |
|
$ |
33,269 |
|
$ |
(388,494 |
) |
$ |
(49,568 |
) |
$ |
(404,778 |
) |
| |
|
|
|
|
|
|
|
|
|
|
|
|
|
See notes to consolidated financial statements.
F-6
Table of Contents
ISOLA GROUP S.À R.L. AND SUBSIDIARIES,
A WHOLLY OWNED SUBSIDIARY OF TPG HATTRICK PARTNERS, L.P.
CONSOLIDATED STATEMENTS OF CASH FLOWS
For the fiscal years ended December 31, 2011, January 1, 2011, and December 26, 2009
|
|
|
|
|
|
|
|
|
|
|
|
|
|
|
|
|
December 31,
2011
|
|
January 1,
2011
|
|
December 26,
2009
|
|
| |
|
|
|
(In thousands)
|
|
CASH FLOWS FROM OPERATING ACTIVITIES: |
|
|
|
|
|
|
|
|
|
|
| |
Net income / (loss) |
|
$ |
9,973 |
|
$ |
1,217 |
|
$ |
(100,726 |
) |
| |
Adjustments to reconcile net income / (loss) to cash provided by / (used in) operating activities: |
|
|
|
|
|
|
|
|
|
|
| |
|
Depreciation and amortization |
|
|
17,260 |
|
|
16,937 |
|
|
19,837 |
|
| |
|
Provision for doubtful accounts |
|
|
(683 |
) |
|
87 |
|
|
588 |
|
| |
|
Change in fair value of derivatives |
|
|
(42,366 |
) |
|
(21,226 |
) |
|
26,392 |
|
| |
|
Foreign currency translation |
|
|
(7,147 |
) |
|
(12,087 |
) |
|
717 |
|
| |
|
Impairment of property, plant and equipment |
|
|
994 |
|
|
— |
|
|
4,122 |
|
| |
|
Deferred income taxes |
|
|
(914 |
) |
|
4,896 |
|
|
(1,416 |
) |
| |
|
Amortization and write-off of debt issuance costs |
|
|
2,435 |
|
|
4,629 |
|
|
— |
|
| |
|
Accreted interest on debt, note to stockholder and amortization of discount |
|
|
25,332 |
|
|
5,900 |
|
|
(68 |
) |
| |
|
Accreted interest on Convertible Preferred Certificates and amortization of discount |
|
|
15,846 |
|
|
10,636 |
|
|
10,454 |
|
| |
|
Stock-based compensation expense |
|
|
2,650 |
|
|
2,219 |
|
|
1,757 |
|
| |
|
Loss from liquidation of subsidiary |
|
|
— |
|
|
— |
|
|
3,548 |
|
| |
|
Gain on dispositions |
|
|
(17 |
) |
|
(484 |
) |
|
(224 |
) |
| |
|
Change in operating assets and liabilities: |
|
|
|
|
|
|
|
|
|
|
| |
|
|
Accounts receivable |
|
|
(4,774 |
) |
|
(6,702 |
) |
|
(8,081 |
) |
| |
|
|
Other receivables |
|
|
(299 |
) |
|
44 |
|
|
13 |
|
| |
|
|
Inventories |
|
|
8,231 |
|
|
(9,006 |
) |
|
(1,099 |
) |
| |
|
|
Prepaid expenses and other current assets |
|
|
(2,035 |
) |
|
(450 |
) |
|
130 |
|
| |
|
|
Debt issuance costs and other assets |
|
|
2,609 |
|
|
(1,434 |
) |
|
1,390 |
|
| |
|
|
Accounts payable |
|
|
(2,966 |
) |
|
(3,711 |
) |
|
(17,254 |
) |
| |
|
|
Accrued liabilities |
|
|
9,298 |
|
|
(44,770 |
) |
|
42,688 |
|
| |
|
|
Other current liabilities |
|
|
155 |
|
|
56 |
|
|
5,384 |
|
| |
|
|
Pension and other postretirement employee benefits |
|
|
(2,546 |
) |
|
(1,122 |
) |
|
1,077 |
|
| |
|
|
Uncertain tax positions and other liabilities |
|
|
(8,023 |
) |
|
(977 |
) |
|
(4,328 |
) |
| |
|
|
|
|
|
|
|
| |
|
|
|
Net cash provided by / (used) in operating activities |
|
|
23,013 |
|
|
(55,348 |
) |
|
(15,099 |
) |
| |
|
|
|
|
|
|
|
CASH FLOWS FROM INVESTING ACTIVITIES: |
|
|
|
|
|
|
|
|
|
|
| |
Proceeds from release of restricted cash—entrustment loan |
|
|
5,461 |
|
|
(190 |
) |
|
2,184 |
|
| |
Decrease (increase) in restricted cash—other |
|
|
339 |
|
|
2,197 |
|
|
(3,308 |
) |
| |
Payments for acquisition of property, plant, and equipment |
|
|
(12,933 |
) |
|
(15,681 |
) |
|
(6,200 |
) |
| |
Proceeds from dispositions |
|
|
121 |
|
|
4,396 |
|
|
350 |
|
| |
|
|
|
|
|
|
|
| |
|
|
|
Net cash used in investing activities |
|
|
(7,012 |
) |
|
(9,278 |
) |
|
(6,974 |
) |
| |
|
|
|
|
|
|
|
CASH FLOWS FROM FINANCING ACTIVITIES: |
|
|
|
|
|
|
|
|
|
|
| |
Proceeds from financing transactions (Note 4) |
|
|
— |
|
|
376,393 |
|
|
— |
|
| |
Proceeds from debt |
|
|
17,250 |
|
|
16,951 |
|
|
30,703 |
|
| |
Payments of debt |
|
|
(23,965 |
) |
|
(312,926 |
) |
|
(45,092 |
) |
| |
Payments of debt issuance costs |
|
|
— |
|
|
(19,215 |
) |
|
— |
|
| |
Proceeds from capital contributions |
|
|
— |
|
|
577 |
|
|
— |
|
| |
Proceeds from note receivable—stockholder |
|
|
— |
|
|
— |
|
|
2,349 |
|
| |
Payments of capital leases |
|
|
(325 |
) |
|
(839 |
) |
|
(1,032 |
) |
| |
Payments for surrendered options |
|
|
— |
|
|
(299 |
) |
|
— |
|
| |
|
|
|
|
|
|
|
| |
|
|
|
Net cash provided by / (used in) financing activities |
|
|
(7,040 |
) |
|
60,642 |
|
|
(13,072 |
) |
| |
|
|
|
|
|
|
|
EFFECT OF EXCHANGE RATES ON CASH |
|
|
1,787 |
|
|
1,785 |
|
|
(7 |
) |
| |
|
|
|
|
|
|
|
NET INCREASE/(DECREASE) IN CASH |
|
|
10,748 |
|
|
(2,199 |
) |
|
(35,152 |
) |
CASH—Beginning of year |
|
|
36,733 |
|
|
38,932 |
|
|
74,084 |
|
| |
|
|
|
|
|
|
|
CASH—End of year |
|
$ |
47,481 |
|
$ |
36,733 |
|
$ |
38,932 |
|
| |
|
|
|
|
|
|
|
SUPPLEMENTAL DISCLOSURE OF CASH FLOW INFORMATION— |
|
|
|
|
|
|
|
|
|
|
| |
Cash payments during the year for: |
|
|
|
|
|
|
|
|
|
|
| |
|
Interest |
|
$ |
37,439 |
|
$ |
94,999 |
|
$ |
7,493 |
|
| |
|
|
|
|
|
|
|
| |
|
Income taxes |
|
$ |
10,354 |
|
$ |
10,936 |
|
$ |
8,378 |
|
| |
|
|
|
|
|
|
|
SUPPLEMENTAL SCHEDULE OF NONCASH INVESTING AND FINANCING TRANSACTIONS—Acquisition of fixed assets with a corresponding increase in accounts
payable |
|
$ |
865 |
|
$ |
1,270 |
|
$ |
598 |
|
| |
|
|
|
|
|
|
|
Acquisition of fixed assets through capital lease |
|
$ |
363 |
|
|
— |
|
|
— |
|
| |
|
|
|
|
|
|
|
See notes to consolidated financial statements.
F-7
Table of Contents
ISOLA GROUP S.À R.L. AND SUBSIDIARIES,
A WHOLLY OWNED SUBSIDIARY OF TPG HATTRICK PARTNERS, L.P.
NOTES TO CONSOLIDATED FINANCIAL STATEMENTS
As of December 31, 2011 and January 1, 2011, and for the fiscal years ended
December 31, 2011, January 1, 2011 and
December 26, 2009
1. ORGANIZATION AND SUMMARY OF SIGNIFICANT ACCOUNTING POLICIES
Nature of business—Isola Group, S.à r.l. (the "Company") is a holding company incorporated in Luxembourg whose subsidiaries manufacture
and sell laminate products across Europe, Asia, and the Americas. Corporate headquarters are located in Chandler, Arizona. The Company is a wholly owned subsidiary of TPG Hattrick
Partners, L.P. ("TPG" or the "sole stockholder").
The
Company and certain of its subsidiaries were incorporated by TPG. TPG is a U.S. based limited partnership that was originally funded through the cash investments of two private equity funds
affiliated with TPG Global, LLC and Redfern Partners, which is an affiliate of Insulectro, one of the Company's largest customers (see Note 13).
Reorganization—On September 20, 2011, TPG formed a new company, Isola Group Ltd., in the Cayman Islands. Isola Group Ltd. has been authorized
by its board of directors to file a registration statement with the Securities and Exchange Commission ("SEC") permitting it to sell its ordinary shares in an initial public offering ("IPO").
Prior to the IPO the Company will undergo a corporate reorganization that will include the following steps:
- –>
- all
of the outstanding securities of the Company, including common shares and convertible preferred certificates ("CPCs"), will be contributed by TPG to Isola Group
Ltd., which will result in Isola Group Ltd. becoming our new holding company and the Company becoming a subsidiary of Isola Group Ltd.;
- –>
- TPG
, and TPG's general partner, TPG Hattrick Holdco, LLC, will be liquidated and the ordinary shares of Isola Group Ltd. will be distributed to the
equity holders of TPG and TPG Hattrick Holdco, LLC; and
- –>
- all
outstanding stock-based awards associated with TPG will be terminated and replaced with new awards for ordinary shares of Isola Group Ltd.
that have substantially the same value and the same terms.
Collectively
we refer to the above transactions as the "Reorganization". The pro forma impact of the Reorganization is discussed further in Note 15 to the consolidated financial statements.
Basis of Presentation and Consolidation—The consolidated financial statements consist of the accounts of the Company and subsidiaries and reflect the Company's
financial position as of December 31, 2011 and January 1, 2011, and results of operations and cash flows for the fiscal years ended December 31, 2011, January 1, 2011, and
December 26, 2009. The consolidated financial statements have been prepared in accordance with U.S. generally accepted accounting principles ("U.S. GAAP"). All intercompany balances and
transactions have been eliminated.
The
Company operates and reports financial results on a fiscal year of 52 or 53 weeks. The 2011 fiscal year consisted of 52 weeks and ended on December 31, 2011. The 2010 fiscal
year consisted of 53 weeks and ended on January 1, 2011. The 2009 fiscal year consisted of 52 weeks and ended on December 26, 2009.
Events
that occurred after December 31, 2011, and through March 15, 2012, the date the consolidated financial statements were available to be issued, were considered in the preparation
of these consolidated financial statements.
Use of Estimates and Assumptions—The preparation of financial statements in conformity with U.S. GAAP requires management to make estimates and assumptions
that affect the reported amounts of assets and
F-8
Table of Contents
ISOLA GROUP S.À R.L. AND SUBSIDIARIES,
A WHOLLY OWNED SUBSIDIARY OF TPG HATTRICK PARTNERS, L.P.
NOTES TO CONSOLIDATED FINANCIAL STATEMENTS (Continued)
As of December 31, 2011 and January 1, 2011, and for the fiscal years ended
December 31, 2011, January 1, 2011 and December 26, 2009
liabilities
and disclosure of contingent assets and liabilities at the date of the financial statements and the reported amounts of revenues and expenses during the reporting year. Significant items
subject to such estimates and assumptions include, but are not limited to, (i) the useful lives of fixed assets and definite lived intangible assets, (ii) allowances for doubtful accounts, (iii) the
valuation of derivative instruments, (iv) the valuation of deferred tax assets, (v) stock-based compensation, (vi) accruals for employee benefit obligations, (vii) income tax uncertainties and (viii)
other contingencies. current
events and actions management may take in the future, actual results could differ from these estimates under different assumptions or conditions.
Foreign Currency Transactions and Translation—The Company's functional currency and reporting currency is the U.S. dollar. All subsidiaries of the Company with the
exception of the subsidiaries in Germany, Italy, the United Kingdom and Malaysia have a functional currency of the U.S. dollar. Gains and losses arising from transactions denominated in a currency
other than the functional currency of the entity involved in the transaction, including unrealized translation gains and losses on short-term receivables and payables, are included in
foreign exchange gains and losses in the consolidated statement of operations in the period in which they occur.
For
the Company's foreign subsidiaries that use a currency other than the U.S. dollar as their functional currency, assets and liabilities are translated at exchange rates in effect at the balance
sheet date, and revenues and expenses are translated at the average exchange rate for the period. The effects of these translation adjustments are reported as foreign currency translation gains and
losses in other comprehensive loss on the consolidated balance sheet.
Certain
of the Company's foreign subsidiaries maintain their books of record in a currency other than their functional currency, the U.S. dollar. Assets and liabilities for these subsidiaries are
remeasured to U.S. dollars at current exchange rates except for nonmonetary items such as inventory and property, plant and equipment which are remeasured to U.S. dollars at historical exchange rates.
Foreign currency remeasurement gains and losses are included in foreign exchange gains and losses in the consolidated statement of operations in the period in which they occur.
Cash and Cash Equivalents—The Company considers all highly liquid debt investments with a maturity of three months or less when purchased to be cash equivalents.
These investments are stated at cost, which approximates market value.
Restricted Cash—Restricted cash represents bank balances pledged as collateral. In fiscal 2010, restricted cash was primarily for an entrustment loan, denominated
in Chinese Renminbi, held by the Company's subsidiary in Dalian, China, as well as worldwide letters of credit and retirement obligations in Germany. In fiscal 2011, restricted cash is only related to
the letters of credit and retirement obligations.
Accounts Receivable and Allowance for Doubtful Accounts—The Company's accounts receivable are recorded at cost on the consolidated balance sheet, net of allowance
for doubtful accounts. Credit is extended based on an evaluation of the customer's financial condition and, generally, collateral is not required.
Management
estimates uncollectible accounts related to current period sales to establish the allowance for doubtful accounts. In making these estimates, management analyzes the credit worthiness of
the Company's customers, past experience, changes in customer demand and the overall economic climate. Past due balances meeting certain criteria are reviewed individually for collectability. All
other balances are reviewed
F-9
Table of Contents
ISOLA GROUP S.À R.L. AND SUBSIDIARIES,
A WHOLLY OWNED SUBSIDIARY OF TPG HATTRICK PARTNERS, L.P.
NOTES TO CONSOLIDATED FINANCIAL STATEMENTS (Continued)
As of December 31, 2011 and January 1, 2011, and for the fiscal years ended
December 31, 2011, January 1, 2011 and December 26, 2009
on
a pooled basis. Account balances are charged off against the allowance after all means of collection have been exhausted and the potential for recovery is considered remote.
Credit
risk associated with the Company's accounts receivable is mitigated by (i) ongoing credit evaluations of customers, (ii) frequent contact with customers, especially the most
significant, which enables the Company to monitor changes in its customers' business operations and respond accordingly, and (iii) a significant portion of sales to well-established
companies.
The
Company does not have any off-balance-sheet credit exposure related to its customers.
Inventories—Inventories include the cost of materials, direct labor, and related manufacturing overhead. Inventories are stated at the lower of cost (computed using
the first-in, first-out method) or market. The Company adjusts inventory for estimated obsolescence or excess quantities based upon assumptions about future demand and market
conditions.
Assets Held for Sale—In accordance with Accounting Standards Codification ("ASC") 360, Property, Plant, and Equipment ("ASC 360"), the Company classifies
long-lived assets as held for sale when (i) management, having the authority to approve the action, commits to a plan to
sell the asset, (ii) the asset is available for immediate sale in its present condition subject only to terms that are usual and customary for sales of such assets, (iii) an active
program to locate a buyer and other actions required to complete the plan to sell the asset have been initiated, (iv) the sale of the asset is probable, and (v) transfer of the asset is
expected to qualify for recognition as a completed sale within one year. The carrying value of the assets held for sale are then recorded at the lower of their
carrying value or fair value, less costs to sell, and are not depreciated. During the year ended December 31, 2011, the Company transferred $2.3 million of assets from property, plant
and equipment to assets held for sale. These assets consisted of land and buildings in Fremont, California and Franklin, New Hampshire. Assets held for sale are included in prepaid expenses and other
current assets in the consolidated balance sheet.
Property, Plant, and Equipment—Property, plant, and equipment are recorded at cost, or in the case of property, plant and equipment acquired through acquisitions,
at fair value as of the acquisition date. Provisions for depreciation are calculated using the straight-line method over the following estimated useful lives of the assets:
|
|
|
|
|
|
|
Years
|
|
| |
|
Buildings and improvements |
|
|
15-40 |
|
Machinery and equipment |
|
|
2-15 |
|
Assets held under capital leases are depreciated on a straight-line basis over the estimated useful life of the asset. If there is not reasonable
certainty that the Company will obtain ownership by the end of the lease term, the asset is depreciated over the shorter of the lease term or estimated useful life of the asset. Leasehold improvements
are depreciated on a straight-line basis over the shorter of the lease term or estimated useful life of the asset.
The
Company reviews property, plant and equipment for impairment whenever events and circumstances indicate that the carrying amount may not be recoverable. For purposes of evaluating and measuring
impairment, the Company groups long-lived assets with other assets and liabilities at the lowest level for which identifiable cash flows are largely independent of the cash flows for other
groups of assets, which is
F-10
Table of Contents
ISOLA GROUP S.À R.L. AND SUBSIDIARIES,
A WHOLLY OWNED SUBSIDIARY OF TPG HATTRICK PARTNERS, L.P.
NOTES TO CONSOLIDATED FINANCIAL STATEMENTS (Continued)
As of December 31, 2011 and January 1, 2011, and for the fiscal years ended
December 31, 2011, January 1, 2011 and December 26, 2009
generally
at the site or factory level. An asset or group of assets is considered impaired if its carrying amount exceeds the undiscounted future net cash flows the asset or asset group is expected to
generate. If an asset or asset group is considered to be impaired, the impairment loss would be calculated based on the excess of the carrying amount over the estimated fair value in the period
identified. Fair value is determined through various valuation techniques including discounted cash flow models, market comparables and other information, as considered necessary.
During
fiscal 2011, the Company recorded $1.0 million in asset impairments. The Company recorded $0.6 million in asset impairments in fiscal 2011 associated with its land and buildings
in Fremont, California, which is included in restructuring expense in the consolidated statement of operations. The Company also recorded $0.4 million in asset impairments in fiscal 2011
associated with its land and buildings in Franklin, New Hampshire, which is included in selling, general and administrative expenses in the consolidated statement of operations.
During
fiscal 2009, the Company recorded $4.1 million in asset impairments associated with the closure of manufacturing facilities, primarily in Dalian China, which is included in restructuring
expense in the consolidated statement of operations.
Identifiable Intangible Assets—The Company has certain identifiable intangible assets that are subject to amortization. These assets consist primarily of patented
technology, customer relationships and trademarks obtained through acquisitions. These assets are carried at cost less accumulated amortization. Amortization is recorded on a straight-line
basis over the estimated useful lives of the assets which range from 10 to 11 years.
The
Company reviews identifiable intangible assets for impairment whenever events and circumstances indicate that the carrying amount may not be recoverable. An asset is considered impaired if its
carrying amount exceeds the undiscounted future net cash flows the asset or asset group is expected to generate. If an asset or asset group is considered to be impaired, the impairment loss would be
calculated based on the excess of the carrying amount over the estimated fair value in the period identified. Fair value is determined primarily based on projected discounted future net cash flows.
Debt Issuance Costs and Discounts—Debt issuance costs and discounts are capitalized and amortized over the term of the related debt using the effective interest
method. Upon the extinguishment of the related debt, any unamortized debt issuance costs and discounts are immediately expensed. Unamortized debt issuance costs are included in prepaid and other
current assets and debt issuance costs and other assets in the consolidated balance sheets and totaled $15.9 million and $18.3 million at December 31, 2011 and January 1,
2011, respectively.
In
fiscal 2010 the Company wrote off $2.8 million of previously recorded deferred financing costs.
Debt
discounts are further discussed in Note 4.
Fair Value Measurements—The Company applies fair value accounting for all financial assets and liabilities that are recognized or disclosed at fair value in the
financial statements on a recurring or nonrecurring basis. Fair value is defined as the amount that would be received from selling an asset or the amount that would be paid to settle a liability in an
orderly transaction between willing market participants in the primary or most advantageous market for that asset or liability.
F-11
Table of Contents
ISOLA GROUP S.À R.L. AND SUBSIDIARIES,
A WHOLLY OWNED SUBSIDIARY OF TPG HATTRICK PARTNERS, L.P.
NOTES TO CONSOLIDATED FINANCIAL STATEMENTS (Continued)
As of December 31, 2011 and January 1, 2011, and for the fiscal years ended
December 31, 2011, January 1, 2011 and December 26, 2009
The
Company's financial instruments that are recognized and disclosed at fair value on a recurring basis are comprised primarily of derivative instruments, which include interest rate swaps and
embedded derivative instruments. The Company accounts for derivative instruments in accordance with the provisions of ASC 815, Derivative Instruments and Hedging
Activities ("ASC 815"). ASC 815 establishes accounting and reporting standards for derivative instruments, including certain derivative instruments embedded in other contracts
and hedging activities. ASC 815 requires the Company to record derivatives at their fair value on the balance sheet. At December 31, 2011 and January 1, 2011, the Company had embedded
derivatives in its Convertible Preferred Certificates (see Note 5) and in its senior secured credit agreement and mezzanine credit agreement (see Note 4). Changes in the fair value of these embedded
derivatives are recorded in the consolidated statements of operations.
Certain
nonfinancial assets and liabilities are measured at fair value on a nonrecurring basis, including property, plant, and equipment and intangibles assets. These assets are subject to fair value
adjustments in certain circumstances, such as when there is evidence of impairment.
A
description of the valuation methodologies used for assets and liabilities measured at fair value, including the general classification of such assets and liabilities pursuant to the valuation
hierarchy, is included in each footnote with fair value measurement present.
The
Company's principal financial instruments are cash, trade receivables, bank lines of credit, short-term bank debt, trade payables and other accrued liabilities, long-term
debt, including Convertible Preferred Certificates, and derivative instruments. With the exception of the Company's derivative instruments, which are recorded at fair value, and the Company's
long-term debt and Convertible Preferred Certificates, the carrying value of these financial instruments approximates fair value either because of the short maturities of these
instruments, or because the interest rates are based upon variable reference rates.
The
fair value of the Company's long-term debt is computed based upon interest rates of similar debt instruments. The Company engaged a third-party consultant to assist in the
determination of the estimated fair value of the Company's long-term debt and Convertible Preferred Certificates. See Note 5, Convertible Preferred Certificates, for a further
discussion regarding the Company's process for estimating fair value with respect to the Convertible Preferred Certificates. The carrying amount and the fair value of the Company's
long-term debt and Convertible Preferred Certificates are as follows (in millions):
|
|
|
|
|
|
|
|
|
|
|
December 31, 2011
|
|
January 1, 2011
|
|
| |
|
Long-term debt: |
|
|
|
|
|
|
|
| |
Carrying amount |
|
$ |
317.4 |
|
$ |
292.1 |
|
| |
|
|
|
|
|
| |
Fair value |
|
$ |
349.5 |
|
$ |
331.8 |
|
| |
|
|
|
|
|
Convertible Preferred Certificates: |
|
|
|
|
|
|
|
| |
Carrying amount |
|
$ |
208.0 |
|
$ |
199.1 |
|
| |
|
|
|
|
|
| |
Fair value |
|
$ |
142.5 |
|
$ |
161.2 |
|
| |
|
|
|
|
|
Accounting for Income Taxes—The Company accounts for income taxes using the asset and liability method under ASC 740, Income
Taxes ("ASC 740"), which requires the recognition of deferred tax assets and liabilities for the expected future tax consequences of events that have been included in the
financial
F-12
Table of Contents
ISOLA GROUP S.À R.L. AND SUBSIDIARIES,
A WHOLLY OWNED SUBSIDIARY OF TPG HATTRICK PARTNERS, L.P.
NOTES TO CONSOLIDATED FINANCIAL STATEMENTS (Continued)
As of December 31, 2011 and January 1, 2011, and for the fiscal years ended
December 31, 2011, January 1, 2011 and December 26, 2009
statements.
Under this method, deferred tax assets and liabilities are determined based on differences between financial reporting and tax basis of assets and liabilities and are measured using the
enacted tax rates and laws that are expected to be in effect when the differences are expected to reverse. The Company is required to adjust its deferred tax assets and liabilities in the period when
tax rates or the provisions of the income tax laws are enacted.
Deferred
tax assets are recorded to the extent these assets are more likely than not to be realized. In making such determination, the Company considers all available positive and negative evidence,
including future reversals of existing taxable temporary differences, projected future taxable income, tax planning strategies and recent financial operations. Valuation allowances are recognized to
reduce deferred tax assets if it is determined to be more likely than not that all or some of the potential deferred assets will not be realized.
The
Company follows ASC 740-10, Income Taxes ("ASC 740-10"), which clarifies the accounting for uncertainty in income taxes
recognized in the financial statements. ASC 740-10 provides that a tax benefit from an uncertain tax position may be recognized based on the technical merits when it is more likely than
not that the position will be sustained upon examination, including resolutions of any related appeals or litigation processes. Income tax positions must meet a more likely than not recognition
threshold at the effective date to be recognized upon the adoption of ASC 740-10 and in subsequent periods. This standard also provides guidance on measurement, derecognition,
classification, interest and penalties, accounting in interim periods, disclosure and transition.
The
Company recognizes interest and penalties related to unrecognized tax benefits as a component of income tax expense.
Pension Plans—The Company sponsors several pension plans that include qualified, noncontributory nonunion pension plans for certain salaried and hourly employees,
and bargaining unit pension plans covering retirees and vested former employees of the Company. The Company uses a December 31 measurement date for its pension and other postretirement employee
benefit plans. The U.S. pension plans were frozen and curtailed prior to the 2004 acquisition of the Company.
Revenue Recognition—Revenue is recognized and earned when all of the following criteria are satisfied: (i) persuasive evidence of a sales arrangement exists; (ii)
price is fixed or determinable; (iii) collectibility is reasonably assured; and (iv) title and the risks and rewards of ownership have substantially transferred to the customer. For a majority of the
Company's sales transactions, revenue is recognized upon shipment of the finished product. Some shipping terms require the goods to be received by the customer before title passes. In those instances,
revenues are not recognized until the customer has received the goods. The Company's sales arrangements do not provide for post-shipment obligations.
Amounts
billed to customers for shipping and handling costs are included in revenues and shipping and handling costs incurred by the Company are included in cost of goods sold.
Stock-based Compensation—Effective January 1, 2006, the Company prospectively adopted the fair value method of accounting for stock-based compensation to
employees in accordance with ASC 718, Compensation—Stock Compensation ("ASC 718") which recognizes stock-based compensation expense, net of
estimated forfeitures, over the requisite service period of the award for stock-based awards issued on and after the adoption date. The fair value method requires companies to estimate the fair value
of stock-based payment awards on the grant date using an option-pricing model.
F-13
Table of Contents
ISOLA GROUP S.À R.L. AND SUBSIDIARIES,
A WHOLLY OWNED SUBSIDIARY OF TPG HATTRICK PARTNERS, L.P.
NOTES TO CONSOLIDATED FINANCIAL STATEMENTS (Continued)
As of December 31, 2011 and January 1, 2011, and for the fiscal years ended
December 31, 2011, January 1, 2011 and December 26, 2009
Prior
to the adoption of the fair value method, the Company accounted for stock-based compensation using the minimum-value method for financial statement recognition purposes. For awards that have not
yet vested but were granted prior to the adoption of the fair value method, the Company continues to recognize stock-based compensation expense under the minimum value method. In addition, the Company
continues to amortize any stock-based compensation from awards granted prior to January 1, 2006 and stock-based compensation from awards granted or modified after January 1, 2006 on a
straight-line basis over the service period. The Company has elected to use the "with and without" approach in determining the order in which tax attributes are utilized. As a result, the
Company will only recognize a tax benefit from stock-based awards in additional paid-in capital if an incremental tax benefit is realized after all other tax attributes currently available
to the Company have been utilized.
For
the fiscal years ended December 31, 2011, January 1, 2011 and December 26, 2009, the Company incurred stock-based compensation expense of $2.7 million,
$2.2 million and $1.8 million, respectively. The Company's stock-based compensation awards are more fully described in Note 9.
Accumulated Other Comprehensive Loss—The following table presents the components of the Company's accumulated other comprehensive loss (in
millions):
|
|
|
|
|
|
|
|
|
|
December 31, 2011
|
|
January 1, 2011
|
|
| |
|
Foreign currency translation loss |
|
$ |
13.3 |
|
$ |
13.1 |
|
Unamortized plan benefits obligations, net of tax of $0.5 and $0.4 at December 31, 2011 and January 1, 2011, respectively |
|
|
36.3 |
|
|
20.5 |
|
| |
|
|
|
|
|
Total |
|
$ |
49.6 |
|
$ |
33.6 |
|
| |
|
|
|
|
|
Certain Risks and Concentrations—Cash is maintained with several financial institutions. Deposits held with banks can exceed the amount of insurance provided on
such deposits. Generally, these deposits may be redeemed upon demand and are maintained with financial institutions of reputable credit and, therefore, bear minimal credit risk. The majority of the
Company's cash deposits were not insured as of December 31, 2011.
The
Company sells a significant amount of its products through intermediaries, such as distributors. Revenue from sales to distributors represented 8.6%, 10.4%, and 9.7% of total revenues for the
fiscal years ended December 31, 2011, January 1, 2011, and December 26, 2009, respectively. If one of the Company's significant distributors terminates its distribution agreement,
the Company could experience a significant interruption in the distribution of its products.
Concentration
of credit risk with respect to the Company's trade receivables is limited by an ongoing credit evaluation process and the geographical dispersion of sales transactions. Collateral is
generally not required from the Company's customers. The allowance for doubtful accounts is based upon the expected collectability of all trade receivables. The Company had three customers that
accounted for 42.9% of the outstanding receivables at December 31, 2011 and two customers that accounted for 27.6% of the outstanding receivables at January 1, 2011. The Company also had
one customer that accounted for 14.0%, 12.8% and 12.1% of revenues for the fiscal years ended December 31, 2011, January 1, 2011 and December 26, 2009, respectively.
F-14
Table of Contents
ISOLA GROUP S.À R.L. AND SUBSIDIARIES,
A WHOLLY OWNED SUBSIDIARY OF TPG HATTRICK PARTNERS, L.P.
NOTES TO CONSOLIDATED FINANCIAL STATEMENTS (Continued)
As of December 31, 2011 and January 1, 2011, and for the fiscal years ended
December 31, 2011, January 1, 2011 and December 26, 2009
Contingencies—The Company is subject to a range of claims, lawsuits and administrative proceedings that arise in the ordinary course of business. The Company
accrues a liability and charges expense on the consolidated statement of operations for such matters when it is probable that a liability has been incurred and the amount can be reasonably estimated,
in accordance with the recognition criteria of ASC Topic 450, Contingencies ("ASC 450"). Estimating liabilities and costs associated with these matters
requires significant judgment and assessment based upon the professional knowledge and experience of management and its legal counsel.
Recent Accounting Pronouncements—Changes to generally accepted accounting principles are established by the Financial Accounting Standards Board ("FASB") in the
form of accounting standards updates ("ASU") to the FASB's Accounting Standards Codification.
The
Company considers the applicability and impact of all ASUs. ASUs not listed below were assessed and determined to be either not applicable or not expected to have a material impact on the
Company's consolidated financial position or results of operations.
In
May 2011, the FASB issued an amendment to the existing guidance on fair value measurements. The new guidance provides a consistent definition of the fair value measurement and ensures disclosure
requirements are similar between U.S. GAAP and International Financial Reporting Standards. The amendments to the guidance change certain fair value measurement principles and enhance
disclosure requirements, particularly for Level 3 fair value measurements. This amendment is effective for interim and annual reporting periods beginning after December 15, 2011, which
for the Company is the first quarter of 2012, and must be applied prospectively. The Company is currently assessing what impact, if any, the revised guidance will have on its consolidated financial
position or results of operations.
In
June 2011, the FASB issued an amendment to the existing guidance on the presentation of comprehensive income. Under the amended guidance, entities have the option to present the components
of net income and other comprehensive income in either a single continuous statement of comprehensive income or in two separate but consecutive statements. Entities no longer have the option of
presenting the components of other comprehensive income within the statement of changes in stockholders' equity. This amendment is effective on a retrospective basis for interim and annual periods
beginning after December 15, 2011; however, presentation of reclassification adjustments has been deferred. The Company retrospectively adopted this amendment effective December 28,
2008. The adoption of this amendment resulted in the Company changing its current presentation of
comprehensive income so that the components of net income and other comprehensive income are presented in two separate consecutive statements. The adoption of this amendment did not have any impact on
the Company's consolidated financial position or results of operations.
Standards Issued but Not Yet Effective—Other new pronouncements issued but not effective until after December 31, 2011 are not expected to have a material
impact on the Company's consolidated financial statements.
F-15
Table of Contents
ISOLA GROUP S.À R.L. AND SUBSIDIARIES,
A WHOLLY OWNED SUBSIDIARY OF TPG HATTRICK PARTNERS, L.P.
NOTES TO CONSOLIDATED FINANCIAL STATEMENTS (Continued)
As of December 31, 2011 and January 1, 2011, and for the fiscal years ended
December 31, 2011, January 1, 2011 and December 26, 2009
2. SELECTED CONSOLIDATED BALANCE SHEET DISCLOSURES
The following tables provide details of selected consolidated balance sheet items at December 31, 2011 and January 1, 2011 (in
millions):
|
|
|
|
|
|
|
|
|
|
|
|
December 31,
2011
|
|
January 1,
2011
|
|
| |
|
Inventories: |
|
|
|
|
|
|
|
| |
Raw materials |
|
$ |
18.5 |
|
$ |
24.5 |
|
| |
Work in process |
|
|
7.9 |
|
|
6.7 |
|
| |
Finished goods |
|
|
10.3 |
|
|
13.9 |
|
| |
|
|
|
|
|
Total inventories |
|
$ |
36.7 |
|
$ |
45.1 |
|
| |
|
|
|
|
|
Property, plant, and equipment: |
|
|
|
|
|
|
|
| |
Land |
|
$ |
26.4 |
|
$ |
28.8 |
|
| |
Buildings and improvements |
|
|
49.6 |
|
|
49.8 |
|
| |
Machinery and equipment |
|
|
154.3 |
|
|
143.8 |
|
| |
Construction in progress |
|
|
6.7 |
|
|
8.6 |
|
| |
|
|
|
|
|
| |
|
Total property, plant, and equipment |
|
|
237.0 |
|
|
231.0 |
|
| |
Less accumulated depreciation |
|
|
105.2 |
|
|
91.4 |
|
| |
|
|
|
|
|
Total property, plant, and equipment—net |
|
$ |
131.8 |
|
$ |
139.6 |
|
| |
|
|
|
|
|
Accrued liabilities: |
|
|
|
|
|
|
|
| |
Personnel related |
|
$ |
16.3 |
|
$ |
15.3 |
|
| |
Operating expenses |
|
|
10.4 |
|
|
8.4 |
|
| |
Income tax |
|
|
11.0 |
|
|
8.6 |
|
| |
Other taxes |
|
|
5.7 |
|
|
1.1 |
|
| |
Management fees |
|
|
0.6 |
|
|
1.0 |
|
| |
Interest |
|
|
0.2 |
|
|
0.5 |
|
| |
Other |
|
|
3.4 |
|
|
4.1 |
|
| |
|
|
|
|
|
Total accrued liabilities |
|
$ |
47.6 |
|
$ |
39.0 |
|
| |
|
|
|
|
|
The Company capitalized interest expense incurred during the construction period for capital projects, primarily new machinery and equipment. Capitalized
interest was $0.7 and $0.8 million for the fiscal years ended December 31, 2011 and January 1, 2011, respectively. Capitalized interest is included in property, plant, and
equipment in the consolidated balance sheets.
Depreciation
expense for the fiscal years ended December 31, 2011, January 1, 2011 and December 26, 2009 was $16.1 million, $15.6 million and $18.2 million,
respectively.
F-16
Table of Contents
ISOLA GROUP S.À R.L. AND SUBSIDIARIES,
A WHOLLY OWNED SUBSIDIARY OF TPG HATTRICK PARTNERS, L.P.
NOTES TO CONSOLIDATED FINANCIAL STATEMENTS (Continued)
As of December 31, 2011 and January 1, 2011, and for the fiscal years ended
December 31, 2011, January 1, 2011 and December 26, 2009
3. INTANGIBLE ASSETS
Intangible assets consist of the following (in millions):
|
|
|
|
|
|
|
|
|
|
|
|
|
|
|
|
|
|
|
|
|
|
December 31, 2011 |
|
January 1, 2011 |
|
|
|
Gross
amount
|
|
Accumulated
amortization
|
|
Net
amount
|
|
Gross
amount
|
|
Accumulated
amortization
|
|
Net
amount
|
|
| |
|
Patented Technology |
|
$ |
9.9 |
|
$ |
(5.8 |
) |
$ |
4.1 |
|
$ |
9.9 |
|
$ |
(5.0 |
) |
$ |
4.9 |
|
Customer Relationship |
|
|
6.9 |
|
|
(5.0 |
) |
|
1.9 |
|
|
6.9 |
|
|
(4.7 |
) |
|
2.2 |
|
Trade Name |
|
|
0.9 |
|
|
(0.7 |
) |
|
0.2 |
|
|
0.9 |
|
|
(0.6 |
) |
|
0.3 |
|
| |
|
|
|
|
|
|
|
|
|
|
|
|
|
|
|
$ |
17.7 |
|
$ |
(11.5 |
) |
$ |
6.2 |
|
$ |
17.7 |
|
$ |
(10.3 |
) |
$ |
7.4 |
|
| |
|
|
|
|
|
|
|
|
|
|
|
|
|
The following is an expected amortization schedule for the intangible assets for fiscal year 2012 through fiscal year 2016 (in millions):
|
|
|
|
|
Fiscal years
|
|
|
|
| |
|
2012 |
|
$ |
1.2 |
|
2013 |
|
|
1.2 |
|
2014 |
|
|
1.2 |
|
2015 |
|
|
0.8 |
|
2016 |
|
|
0.8 |
|
Amortization expense attributed to intangible assets was $1.2 million, $1.3 million and $1.6 million for the fiscal years ended
December 31, 2011, January 1, 2011 and December 26, 2009, respectively. Amortization is included in sales, general, and administrative expense on the consolidated statements of
operations. The Company found no indication of impairment of its intangible assets in fiscal years 2011, 2010 or 2009.
4. DEBT
Debt at December 31, 2011 and January 1, 2011 consisted of the following (in millions):
|
|
|
|
|
|
|
|
|
|
|
December 31,
2011
|
|
January 1,
2011
|
|
| |
|
Senior loans payable under senior secured credit agreement—secured, related party—net of unamortized discount of $23.0 million and
$27.5 million |
|
$ |
187.0 |
|
$ |
182.5 |
|
Subordinated loans payable under mezzanine credit agreement—unsecured, related party—net of unamortized discount of $62.8 million and
$69.0 million |
|
|
130.4 |
|
|
109.6 |
|
Other debt—unsecured |
|
|
15.1 |
|
|
15.6 |
|
Entrustment loan |
|
|
— |
|
|
5.5 |
|
| |
|
|
|
|
|
| |
Total debt outstanding |
|
|
332.5 |
|
|
313.2 |
|
Current portion of long-term debt |
|
|
(15.1 |
) |
|
(21.1 |
) |
| |
|
|
|
|
|
Total long-term debt |
|
$ |
317.4 |
|
$ |
292.1 |
|
| |
|
|
|
|
|
F-17
Table of Contents
ISOLA GROUP S.À R.L. AND SUBSIDIARIES,
A WHOLLY OWNED SUBSIDIARY OF TPG HATTRICK PARTNERS, L.P.
NOTES TO CONSOLIDATED FINANCIAL STATEMENTS (Continued)
As of December 31, 2011 and January 1, 2011, and for the fiscal years ended
December 31, 2011, January 1, 2011 and December 26, 2009
The Company is required to make debt service payments under the terms of its debt arrangements. The obligated debt principal payments for the next five years
are $15.1 million in 2012, $210.0 million in 2015 and $193.2 million in 2016.
On
September 30, 2010, the Company entered into a series of financing transactions including a senior secured credit agreement and a mezzanine credit agreement, each entered into with a
syndicate of lenders, the majority of which are partial owners in an entity that is the Company's sole stockholder (collectively "the Credit Arrangements"), as well as the issuance of 43,500,666
Class C Convertible Preferred Certificates issued to the Company's sole stockholder (collectively "the Financing Transaction"). The Company received $376.4 million in aggregate proceeds
in connection with the Financing Transaction. The total proceeds were allocated among the instruments issued based upon the relative fair value of each instrument at the time of issuance, as follows:
|
|
|
|
|
|
|
As of
September 30,
2010
|
|
| |
|
Senior loans payable |
|
$ |
181.5 |
|
Embedded derivative—senior loans payable |
|
|
1.1 |
|
Subordinated loans payable |
|
|
104.6 |
|
Embedded derivative—subordinated loans payable |
|
|
8.1 |
|
Convertible preferred certificates—Class C (Note 5) |
|
|
24.8 |
|
Embedded derivative—convertible preferred certificates—Class C (Note 5) |
|
|
56.3 |
|
| |
|
|
|
Total allocated value |
|
$ |
376.4 |
|
| |
|
|
|
The borrower under the New Credit Arrangements is the Company's wholly owned subsidiary, Isola USA Corp. The principal terms of each credit arrangement are
described below. The Class C Convertible Preferred Certificates are discussed in Note 5.
Senior Secured Credit Agreement—The senior secured credit agreement consists of $210.0 million senior loans ("Senior Loans"), the full amount of which was
drawn at closing on September 30, 2010. The proceeds were used to refinance part of the then-existing first-and second-lien credit facilities, as well as to pay other
fees and expenses related to the new Senior Loans. The Senior Loans are secured by a first priority lien on substantially all of the assets of the Company, including a pledge of all of the equity
interests of each domestic subsidiary and 65% of the equity interests of the first-tier foreign subsidiaries. The Company's other secured and unsecured obligations are subordinated in
priority to payment of loans under the senior secured credit agreement.
The
Company makes elections as to the interest period term which can be one, two, three, or six months in length. The Company also makes elections as to the loan type on which the interest is based.
The Company can elect a Eurodollar Loan or an ABR Loan or a combination of the two. Eurodollar Loans accrue interest at a rate of LIBOR (with a minimum base rate of 2.0%) plus 8.0%. Eurodollar loan
interest is payable on the last day of the period term elected, provided, in the case of an interest period longer than three months, payments shall be due no more than three months after the
commencement of the interest period term. ABR Loans accrue interest at a base rate plus 7%. The base rate is defined as the greater of the Prime Rate as identified and published in the Wall Street
Journal or the Federal Funds Effective Rate as published by the
F-18
Table of Contents
ISOLA GROUP S.À R.L. AND SUBSIDIARIES,
A WHOLLY OWNED SUBSIDIARY OF TPG HATTRICK PARTNERS, L.P.
NOTES TO CONSOLIDATED FINANCIAL STATEMENTS (Continued)
As of December 31, 2011 and January 1, 2011, and for the fiscal years ended
December 31, 2011, January 1, 2011 and December 26, 2009
Federal
Reserve Bank of New York, on the date of election plus 1/2 of 1%. The base rate is to be a minimum of 3.0%. ABR loan interest is payable March 31, June 30,
September 30, and December 31 of each year. As of December 31, 2011, the Company had elected Eurodollar loans for all Senior Loans, which were accruing interest at the rate of
10.0%, which is equal to the minimum LIBOR rate of 2.0% plus 8.0%.
The
Senior Notes are due in full on September 30, 2015. Voluntary early payments are allowed but payments made subsequent to the first anniversary date but prior to the second anniversary date
are required to be made at 101% of the principal amount. Payments made subsequent to the second anniversary date shall be made at par value of the outstanding debt. The Company is obligated to make
prepayments against the Senior Loans resulting from the following transactions or events as defined in the Senior Loans agreements:
- –>
- 100%
of proceeds from the sale of assets not reinvested in long-term productive assets within one year of the receipt of the sale proceeds, not to exceed
$5.5 million in any fiscal year;
- –>
- 100%
of net insurance/condemnation proceeds in excess of $0.1 million for any casualty event and in excess of $1.0 million for all casualty events in
any fiscal year which are not reinvested in long-term productive assets or used to repair, restore, or replace the assets subject to the applicable casualty event or events within one year
of the receipt of the net proceeds;
- –>
- net
proceeds of equity issuances by Isola Group S.à r.l. in an aggregate amount of 75% of such proceeds provided that if, as of the last day of
the most recently ended fiscal quarter, the senior secured leverage ratio shall be 2.50:1.00 or less but greater than 2.00:1.00, the amount shall be reduced to an aggregate amount equal to 50% of such
proceeds, and provided that if, as of the last day of the most recently ended fiscal quarter, the senior secured leverage ratio shall be 2.00:1.00 or less, the amount shall be reduced to an aggregate
amount equal to 25% of such proceeds;
- –>
- 100%
of net proceeds from the incurrence of any indebtedness by Isola Group S.à r.l. or its subsidiaries not otherwise permitted by the Senior
Loans agreements; and
- –>
- 75%
of consolidated excess cash flow, provided, that if, as of the last day of the most recently ended fiscal year, the senior secured leverage ratio shall be
2.00:1.00 or less, the amount shall be reduced to 50% of consolidated excess cash flow.
The
Senior Loans were issued at a discount of $28.5 million on September 30, 2010. As of December 31, 2011 and January 1, 2011, there was $210.0 million of
outstanding principal. The unamortized discount was $23.0 million and $27.5 million at December 31, 2011 and January 1, 2011, respectively, resulting in a net balance of
$187.0 and $182.5 million in the consolidated balance sheets at December 31, 2011 and January 1, 2011, respectively.
Mezzanine Credit Agreement—The mezzanine credit agreement consists of $175.0 million unsecured notes ("Subordinated Loans"), the full amount of which was
drawn at closing on September 30, 2010. The proceeds were used to refinance part of the then-existing first-and second-lien credit facilities, as well as to pay other
fees and expenses related to the new Subordinated Loans. The unsecured term loans issued pursuant to the mezzanine credit agreement are subordinate and junior to the obligations owed under the senior
secured credit agreement. Obligations under the mezzanine credit agreement rank pari passu with the Company's other unsecured and unsubordinated obligations.
F-19
Table of Contents
ISOLA GROUP S.À R.L. AND SUBSIDIARIES,
A WHOLLY OWNED SUBSIDIARY OF TPG HATTRICK PARTNERS, L.P.
NOTES TO CONSOLIDATED FINANCIAL STATEMENTS (Continued)
As of December 31, 2011 and January 1, 2011, and for the fiscal years ended
December 31, 2011, January 1, 2011 and December 26, 2009
The
unsecured term loans under the mezzanine credit agreement bear interest at a rate of 16.0% per annum, with half (8.0% per annum) payable in cash on March 31, June 30,
September 30, and December 31, of each year until maturity and half (8.0% per annum) accreting on the outstanding principal amount of the unsecured term loans, due at maturity. The
Subordinated Loans are due in full on March 24, 2016. Voluntary early payments are allowed subject to the prior discharge of the senior secured credit agreement obligations (except as otherwise
permitted pursuant to the applicable senior secured credit agreement). The Company is obligated to repay the Subordinated Loans in full along with any unpaid interest upon the occurrence of a "Change
in Control", as defined by the mezzanine credit agreement.
The
Subordinated Loans were issued at a discount of $70.4 million on September 30, 2010. As of December 31, 2011 and January 1, 2011, there was $193.2 million and
$178.6 million of outstanding principal, which consisted of $175.0 million in term loans and $18.2 million and $3.6 million of accreted interest at December 31, 2011
and January 1, 2011, respectively. The unamortized discount was $62.8 million and $69.0 million at December 31, 2011 and January 1, 2011, respectively, resulting in
a net balance of $130.4 million and $109.6 million, respectively, in the consolidated balance sheets.
Embedded Derivative Liability—The Senior and Subordinated Loans contain provisions that require prepayment (payment prior to the stated maturity date) of principal
(which principal is not reduced by unamortized original issue discount), plus accrued and unpaid interest, upon the occurrence of certain events, including a change of control, as further defined
under the senior secured credit and mezzanine credit agreements. Events that trigger a change of control include, among others, a reduction in the percentage ownership of our common stock held by
certain entities affiliated with TPG Global, LLC and their controlled investment affiliates other than the Company or its subsidiaries (collectively, the "Sponsor") to below 35% or the accumulation of
an ownership interest in our common stock above 35% by a third-party, other than our Sponsor.
In
accordance with ASC 815, the above mandatory prepayment feature associated with a change of control represents an embedded derivative liability, which requires bifurcation from the related debt
instruments and separate accounting as the condition requiring mandatory prepayment, the change of control, is not credit-related. The related embedded derivative liability is recognized at fair value
in the consolidated balance sheet at each reporting period. At September 30, 2010 (issuance date) and January 1, 2011, the fair value of the embedded derivative liabilities was
$9.2 million and $9.8 million, respectively. At December 31, 2011, the fair value of the embedded derivative liabilities was $10.8 million.
Any
change in fair value of the embedded derivative liability is reflected in the consolidated statements of operations. For the fiscal years ended December 31, 2011 and January 1, 2011,
the change in the fair value of the embedded derivative liability related to the credit agreements resulted in expense of $1.0 million and $0.6 million, respectively.
Had
a prepayment event occurred as of December 31, 2011, the amount to be repaid for both the Senior and Subordinated Loans would have been $405.5 million, which represents the unpaid principal
of the senior secured credit agreement at 101%, unpaid principal of the mezzanine credit agreement and accrued interest payable as of that date, excluding the unamortized original issuance discount.
Covenants—The Company's senior secured and mezzanine credit agreements require it to maintain certain financial and operating covenants. The financial covenants
include separate ratios measuring both interest and secured debt against EBITDA, as defined in the Credit Arrangements, as well as a limit on capital
F-20
Table of Contents
ISOLA GROUP S.À R.L. AND SUBSIDIARIES,
A WHOLLY OWNED SUBSIDIARY OF TPG HATTRICK PARTNERS, L.P.
NOTES TO CONSOLIDATED FINANCIAL STATEMENTS (Continued)
As of December 31, 2011 and January 1, 2011, and for the fiscal years ended
December 31, 2011, January 1, 2011 and December 26, 2009
expenditures.
The operating covenants impose limitations on business decisions, including, but not limited to, the ability to (i) dispose of assets or stock; (ii) incur additional
indebtedness and guarantee obligations; (iii) pay certain dividends; (iv) create liens on assets; (v) make investments, loans or advances; (vi) restrict distributions to
the borrowers or guarantors from its subsidiaries; (vii) engage in mergers or consolidations; (viii) engage in certain transactions with affiliates; (ix) incur additional negative
pledges; (x) incur capital expenditures; (xi) change its fiscal year or accounting practices or the lines of business in which it and its subsidiaries are involved; (xii) enter
into sale-leaseback transactions; (xiii) prepay principal of, premium, or interest on, or redeem, purchase, retire, defease, or create a sinking fund or make a similar payment with
respect to, any subordinated indebtedness and certain other debt; (xiv) change the conduct of business; (xv) conduct activities of any parent holding company or (xvi) amend its
organizational documents. The Company was in compliance with these covenants as of December 31, 2011.
Other Unsecured Debt—The Company has two unsecured loan agreements from lenders in China that provide for a series of draw-downs
as funds are required at the stated rate ranging from 4.26% to 6.98 % per annum. Each draw-down has a one year maturity and is renewable on an annual basis. The Company made draws and
repayments on these facilities and had combined outstanding balances of $15.1 million at both December 31, 2011 and January 1, 2011.
The
Company had an entrustment loan with $5.5 million outstanding at January 1, 2011. An entrustment loan is a means for one subsidiary to loan cash to another subsidiary with a bank
acting as the intermediary. This is accomplished by a lending subsidiary depositing cash into a bank (which is shown as restricted cash on the consolidated balance sheets) and then requesting the bank
to on-loan the cash to another subsidiary with the terms being specified by the subsidiary depositing the cash. The bank charges a minimal processing fee of 0.15% per annum of the
outstanding balance to provide the service. In fiscal 2011, the restricted cash was used to settle the entrustment loan.
A
subsidiary of the Company had unsecured short-term loan arrangements totaling $0.5 million at January 1, 2011. This loan was paid off during fiscal 2011.
Several
of the Company's subsidiaries have entered into lines of credit agreements. The lines of credit include capacity for letters of credit up to $8.0 million at December 31, 2011.
There was no balance outstanding under these lines of credit at December 31, 2011 or January 1, 2011. As of December 31,
2011, the Company's subsidiaries had outstanding letters of credit of $1.6 million under the lines of credit and had pledged an additional $1.1 million as guarantees leaving
$5.3 million remaining available under the lines of credit as of December 31, 2011.
5. CONVERTIBLE PREFERRED CERTIFICATES
The Company has issued and outstanding three different classes of Convertible Preferred Certificates ("CPCs") as of January 1, 2011. The CPCs
have characteristics of both debt and equity, but are considered to be legal form debt instruments in Luxembourg, and thus are accounted for as debt.
The
Company originally issued 85,823,449 shares of CPCs, comprised of 752,575 Class A CPCs and 85,070,874 Class B CPCs to the sole stockholder in fiscal 2004. As part of the April 2006
acquisition of Polyclad, the Company issued an additional 32,130,514 shares of Class B CPCs to the sole stockholder for $39.7 million in cash. As part of the December 2006 debt
refinancing, the Company redeemed 332,120 Class A CPCs, 21,412,988 Class B CPCs and accumulated preferred interest which together totaled
F-21
Table of Contents
ISOLA GROUP S.À R.L. AND SUBSIDIARIES,
A WHOLLY OWNED SUBSIDIARY OF TPG HATTRICK PARTNERS, L.P.
NOTES TO CONSOLIDATED FINANCIAL STATEMENTS (Continued)
As of December 31, 2011 and January 1, 2011, and for the fiscal years ended
December 31, 2011, January 1, 2011 and December 26, 2009
$53.6 million
and paid dividends of $117.2 million, for a total cash payment of $170.8 million. Total Class A and B CPCs issued and outstanding at both December 31,
2011 and January 1, 2011 were 96,208,855, consisting of 420,455 Class A CPCs and 95,788,400 Class B CPCs.
On
September 30, 2010, the Company entered into the Financing Transaction consisting of the issuance of 43,500,666 Class C CPCs, and the senior secured and mezzanine credit agreements
(see Note 4). The Company received gross proceeds of $376.4 million in connection the financing transactions which was allocated among the instruments issued based upon the relative fair value
of each at the time of issuance. In preparing the 2010 consolidated financial statements, the Company determined that historic valuations for the Class A and B contingent conversion feature
discussed below did not appropriately consider the rights and preferences of the various instruments comprising the Company's capital structure. Accordingly, during 2011, the Company engaged a
third-party consultant to assist in the determination of the estimated fair value of the Class C CPCs and to perform retrospective valuations with respect to the Class A and B CPCs and
to assist in the determination of the fair value of the Class A and B contingent conversion feature. These retrospective valuations resulted in new estimates of fair value for the
Class A and B contingent conversion feature. The revised fair values were utilized to prepare the Company's consolidated financial statements for all periods presented.
In
conducting the valuations, the Company used a methodology that is consistent with the methods outlined in the AICPA Practice Aid Valuation of
Privately-Held-Company Equity Securities Issued as Compensation. The enterprise value inputs associated with the Company's valuations were derived using
the income and market approaches. The income approach estimates the enterprise value of the Company by discounting the expected future cash flows of the Company to present value. Under the market
approach, the total enterprise value of the Company is estimated by comparing the Company's business to similar businesses whose securities are actively traded in public markets, or businesses that
are involved in a public or private transaction. The Company has selected valuation multiples derived from trading multiples of public companies that participate in the Company's industry. These
valuation multiples were then applied to the equivalent financial metric of the Company's business, giving consideration to differences between the Company and similar companies for such factors as
company size, leverage, and growth prospects.
The
Company prepared financial forecasts to be used in the computation of the enterprise value for the income approach. The financial forecasts took into account the Company's past experience and
future expectations. There is inherent uncertainty in these estimates. The risks associated with achieving the Company's forecasts were assessed in selecting the appropriate discount rates. If
different discount rates had been used, the valuations would have been different.
The
Company allocated the resulting enterprise value less the fair value of the Company's debt among the instruments that comprise the Company's capital structure based upon rights and preferences of
the instruments using the Option-Pricing Method ("OPM"). Under the OPM, the Company allocated the value of the CPCs and common stock of the Company based on a series of call options, representing the
present value of the expected future returns for each instrument. The value of these options was estimated using the Black-Scholes option-pricing model. The assumptions utilized in the model,
including assumptions associated with volatility, were consistent with those selected to value the options to purchase partnership units, as discussed in Note 9, as the Company's operations represent
substantially all of the net assets of the sole stockholder.
F-22
Table of Contents
ISOLA GROUP S.À R.L. AND SUBSIDIARIES,
A WHOLLY OWNED SUBSIDIARY OF TPG HATTRICK PARTNERS, L.P.
NOTES TO CONSOLIDATED FINANCIAL STATEMENTS (Continued)
As of December 31, 2011 and January 1, 2011, and for the fiscal years ended
December 31, 2011, January 1, 2011 and December 26, 2009
The
OPM involves making estimates of the anticipated timing of a potential liquidity event, such as a sale of the Company, and estimates of the volatility of the Company's equity securities. The
anticipated timing is based on the plans of the board and management. Estimating the volatility of the share price of a privately held company is complex because there is no readily available market
for the shares. The Company estimated the volatility of the stock based on available information on volatility of stocks of publicly traded companies in the industry. Had the Company used different
estimates of volatility, the allocations between common stock and CPCs would have been different.
The
43,500,666 certificates of Class C CPCs carry an aggregate par value of 43.5 million euros. There were no other CPC transactions during the years ended December 31, 2011 or
January 1, 2011.
Proceeds
of $24.8 million received in connection with the September 30, 2010 financing transactions were allocated to the Class C CPCs, resulting in a discount of
$34.5 million which will be amortized over the remaining life of the Class C CPCs which mature on September 30, 2050.
Convertible
Preferred Certificates liability at December 31, 2011 and January 1, 2011 consisted of the following (in millions):
|
|
|
|
|
|
|
|
|
|
|
December 31,
2011
|
|
January 1,
2011
|
|
| |
|
Issued and outstanding Class A CPCs(1) |
|
$ |
0.5 |
|
$ |
0.6 |
|
Issued and outstanding Class B CPCs(2) |
|
|
124.0 |
|
|
127.7 |
|
Issued and outstanding Class C CPCs(3), net of unamortized discount of $32.7 million and $33.8 million as of December 31,
2011 and January 1, 2011 |
|
|
23.6 |
|
|
24.3 |
|
Accrued interest payable |
|
|
|
|
|
|
|
| |
Class A CPCs |
|
|
0.2 |
|
|
0.2 |
|
| |
Class B CPCs |
|
|
55.0 |
|
|
45.4 |
|
| |
Class C CPCs |
|
|
4.7 |
|
|
0.9 |
|
| |
|
|
|
|
|
Total Convertible Preferred Certificates liability |
|
$ |
208.0 |
|
$ |
199.1 |
|
| |
|
|
|
|
|
- (1)
- Par value €0.4 million
- (2)
- Par value €95.8 million
- (3)
- Par value €43.5 million
The following is a summary of the rights, preferences and terms of the Company's outstanding series of CPCs:
Redemption and Optional Redemption
Class A and Class B CPCs mature on June 2, 2044, and Class C CPCs mature on September 30, 2050. The CPCs are
mandatorily redeemable at these maturity dates at a price equivalent to par plus accrued and unpaid interest (the "Redemption Price"). The Company, within 15 days of a conversion event, as
further discussed below, may elect an earlier redemption of any or all of the CPCs at the greater of the Redemption Price or a formula indexed to the adjusted net asset value of the Company, as
further defined in the CPC agreements (the "Optional Redemption Price"). The Redemption Price of the Class A, B, and C CPCs
F-23
Table of Contents
ISOLA GROUP S.À R.L. AND SUBSIDIARIES,
A WHOLLY OWNED SUBSIDIARY OF TPG HATTRICK PARTNERS, L.P.
NOTES TO CONSOLIDATED FINANCIAL STATEMENTS (Continued)
As of December 31, 2011 and January 1, 2011, and for the fiscal years ended
December 31, 2011, January 1, 2011 and December 26, 2009
totaled
$240.7 million and $232.9 million as of December 31, 2011 and January 1, 2011, respectively. The Company may only elect optional redemption to the extent sufficient
funds are available subsequent to redemption to satisfy all of the Company's other obligations, whether senior or pari passu to the CPCs.
Preferred Interest
Class A and Class B CPCs carry a par value of one euro and earn preferred interest based on the six-month EURIBOR plus
4.875% (6.6% and 6.1% as of December 31, 2011 and January 1, 2011, respectively). Class C CPCs carry a par value of one euro and earn preferred interest based on the
six-month EURIBOR plus 5.0% (6.7% and 6.3% as of December 31, 2011 and January 1, 2011). The preferred interest is payable upon declaration by the Board of Directors and to
the extent the Company possesses sufficient funds. Cumulative preferred interest of $59.9 million and $46.5 million has been recorded within Convertible Preferred Certificates on the consolidated
balance sheets as of December 31, 2011 and January 1, 2011, respectively.
Liquidation
In the event of liquidation, Class A, B, and C CPCs are redeemable at par value plus any accrued but unpaid interest. In liquidation, the CPCs
rank pari passu among each class, rank senior in priority of payment to the Company's common stock and subordinate to all other obligations. After the payment of the applicable liquidation preference
to the holders of the CPCs, the residual, if any, will be distributed pro rata among the common stockholders.
Voting and Dividend Rights
The CPCs do not include voting or dividend rights unless converted into common shares.
Contingent Conversion Feature
The CPC agreements provide both the Company and the holders certain rights to convert some or all of the CPCs into the Company's common shares upon
the occurrence of certain events. A conversion event is defined as "after payment of or provision for other obligations, the Issuer has funds resulting, among others, from (i) dividend payments
made by the subsidiaries or (ii) a sale of one of the subsidiaries by the Issuer to an affiliated or nonaffiliated party or (iii) any recapitalization or refinancing of any TPG Isola
group of companies". During a 15-day period subsequent to the occurrence of a conversion event, the Company shall have the right but not the obligation to convert any or all CPCs into
common shares of the Company by requiring the holder to exchange CPCs for shares. Upon expiration of the Company's conversion rights, and for the following 30-day period, each holder shall
have the right (subject to certain limitations) but not the obligation to have any or all of its CPCs converted into common shares of the Company. Any conversions will take place at a price equal to
the conversion price defined in the CPC agreements. The number of common shares into which each CPC is convertible will be determined at the time of conversion as the conversion price is indexed to
the greater of par value plus accrued and unpaid interest or the adjusted net asset value of the Company. Adjusted net asset value is most commonly indexed to the fair value of the Company's net
assets and is therefore, determinable upon the occurrence of a conversion event. As of December 31, 2011, based solely upon the par value plus accrued and unpaid interest feature of the
F-24
Table of Contents
ISOLA GROUP S.À R.L. AND SUBSIDIARIES,
A WHOLLY OWNED SUBSIDIARY OF TPG HATTRICK PARTNERS, L.P.
NOTES TO CONSOLIDATED FINANCIAL STATEMENTS (Continued)
As of December 31, 2011 and January 1, 2011, and for the fiscal years ended
December 31, 2011, January 1, 2011 and December 26, 2009
conversion
price, the Class A, B, and C CPCs were convertible into 606,835, 138,249,636 and 47,106,460 shares, respectively, of the Company's common stock.
Embedded Derivative Feature
In accordance with ASC 815, Accounting for Derivative Instruments and Hedging Activities, the
conversion features that are included in the CPC agreements and are discussed above are considered an embedded derivative liability. At December 31, 2011 and January 1, 2011, the fair
value of the embedded derivative liability was determined to be $18.1 million, and $60.5 million, respectively, which was bifurcated from the CPCs and is stated separately on the consolidated balance
sheets. The value related to the embedded derivative liability is recognized at fair value at each reporting period and any change in fair value is reflected in the consolidated statements of
operations. The initial value of the Class C CPC's embedded derivative on September 30, 2010 was $56.3 million. For the fiscal years ended December 31, 2011,
January 1, 2011 and December 26, 2009, the change in fair value of the embedded derivative liability related to the CPCs resulted in income of $43.3 million, income of
$21.8 million and expense of $27.5 million, respectively. Management determined the fair
value of the embedded derivative liability with the assistance of a third-party consultant. While these valuations were prepared beginning in 2005, contemporaneous with the Company's fiscal
year-ends through 2010, the Company subsequently determined the historic valuations did not appropriately consider the rights and preferences of the various instruments comprising the
Company's capital structure. Accordingly, during 2011 retrospective valuations were performed as of December 31, 2005, December 30, 2006, December 29, 2007, December 27,
2008, December 26, 2009, March 31, 2010, June 30, 2010, September 25, 2010, October 8, 2010, and January 1, 2011. The retrospective valuations resulted in new
estimates of fair value at each respective period. The revised fair values were utilized to prepare the Company's consolidated financial statements for all periods presented.
6. INTEREST RATE SWAPS
In December 2010, a subsidiary of the Company entered into an interest rate swap with a notional amount of $25.0 million, which expires on
December 31, 2013. The Company did not designate this swap agreement as a hedge and therefore, any change in fair value are recorded in the consolidated statement of operations as interest
expense. The Company recorded interest expense of $0.1 million due to the change in fair value for the fiscal year ended December 31, 2011. There was no change in fair value for the
fiscal year ended January 1, 2011. The Company pays a fixed rate amount of 2.8% per annum and receives a variable rate based on the greater of 2.0% or the three-month LIBOR. Interest incurred
or earned from this agreement is settled quarterly on the last day of March, June, September, and December and commenced on March 31, 2011. The swap agreement is required under the terms of the
Company's Senior Loans agreements, which require that a minimum of 50.0% of the principal of the Company's aggregate indebtedness bears interest at a fixed rate or is protected by an agreement to
provide the same effect. The fair value of this interest rate swap was a liability of $0.1 million at December 31, 2011.
In
May 2007, a subsidiary entered into two interest rate swaps with a combined notional amount of $14.1 million in order to mitigate the risks associated with fluctuations of the interest rate
on a capital lease contract. One of the swaps expires in June 2012 and bears an interest rate of the three-month EURIBOR plus 0.52%. The Company pays a variable rate based on the three-month EURIBOR
plus 0.52% with a maximum of 5.02% and receives a variable rate based on the three-month EURIBOR. The second swap
F-25
Table of Contents
ISOLA GROUP S.À R.L. AND SUBSIDIARIES,
A WHOLLY OWNED SUBSIDIARY OF TPG HATTRICK PARTNERS, L.P.
NOTES TO CONSOLIDATED FINANCIAL STATEMENTS (Continued)
As of December 31, 2011 and January 1, 2011, and for the fiscal years ended
December 31, 2011, January 1, 2011 and December 26, 2009
expires
in June 2014 and bears a fixed interest rate of 4.65%. The Company pays a fixed rate of 4.65% and receives a variable rate based on the three-month EURIBOR. Settlement dates occur quarterly on
both swaps. The Company did not designate these swap agreements as hedges and therefore, any change in fair value is recorded in the consolidated statement of operations as interest expense. Due to
the change in fair value of these interest rate swaps, the Company recorded interest income of $0.2 million, interest income of $0.1 million and interest expense of $0.1 million and are
reflected as part of interest expense in the consolidated statement of operations for the fiscal years
ended December 31, 2011, January 1, 2011 and December 26, 2009, respectively. The combined fair value of these interest rate swaps was a liability of $0.6 million at both
December 31, 2011 and January 1, 2011.
7. PENSION AND OTHER RETIREMENT BENEFITS
The Company sponsors a number of defined benefit pension plans covering certain U.S. employees as well as certain non-U.S. employees of
certain subsidiaries. A defined benefit plan specifies the amount of benefits a plan participant is to receive. Plans covering U.S. employees provide benefits of stated amounts generally based on
years of service and compensation history. The qualified U.S. plans had been previously frozen and curtailed prior to the original Isola acquisition in 2004, such that no new participants were
admitted into the plans and no additional benefits were accrued for participants already in the plans. Employees do not contribute to the plans.
In
addition, the Company sponsors a Supplemental Employee Retirement Plan ("SERP"), which covers certain officers and highly compensated employees of the Company designated for participation by the
plan document. In order to comply with changes required by Section 409A of the Internal Revenue Code of 1986, effective January 1, 2008, the Company amended the SERP to require that
retirement benefits be paid in a single lump sum within 30 days following the participant's separation from service. Benefits for previously terminated employees were paid in January 2009.
Also, effective February 1, 2009, participants of the SERP no longer accrue additional benefits. Benefits accrued through February 1, 2009 were not impacted.
The
Company also provides postretirement benefits for certain employees of the Company and its subsidiaries, which include medical and life insurance. For the medical insurance plans, retirees make
contributions to cover a portion of the plan costs. Effective March 1, 2009, the Company amended the medical insurance plan to increase the portion of the premiums paid by the retirees to 100%.
This change took effect during 2009, but was prospectively accounted for during 2008 as a plan amendment. The plan is not eligible for the government subsidy under the Medicare
Prescription Drug, Improvement and Modernization Act of 2003 (the "Act") and the Company does not recognize any reduction in the benefit obligation. The medical insurance
benefits are paid as incurred. For the life insurance plan, retirees do not make contributions. The Company retains the right to change or eliminate these benefits.
F-26
Table of Contents
ISOLA GROUP S.À R.L. AND SUBSIDIARIES,
A WHOLLY OWNED SUBSIDIARY OF TPG HATTRICK PARTNERS, L.P.
NOTES TO CONSOLIDATED FINANCIAL STATEMENTS (Continued)
As of December 31, 2011 and January 1, 2011, and for the fiscal years ended
December 31, 2011, January 1, 2011 and December 26, 2009
The
components of net periodic benefit cost for the fiscal years ended December 31, 2011, January 1, 2011, and December 26, 2009, are shown in the table below (in millions):
|
|
|
|
|
|
|
|
|
|
|
|
|
|
Pension benefits |
|
|
|
|
|
U.S.
plans
|
|
Non-U.S.
plans
|
|
Other
benefits
|
|
| |
|
For year ended December 31, 2011: |
|
|
|
|
|
|
|
|
|
|
| |
Service cost |
|
$ |
0.3 |
|
$ |
0.6 |
|
$ |
— |
|
| |
Interest cost |
|
|
4.3 |
|
|
0.8 |
|
|
0.1 |
|
| |
Past service |
|
|
— |
|
|
— |
|
|
(0.4 |
) |
| |
Amortization of net (gain) / loss |
|
|
1.4 |
|
|
0.2 |
|
|
(0.1 |
) |
| |
Expected return on plan assets |
|
|
(4.2 |
) |
|
(0.4 |
) |
|
— |
|
| |
Settlement / curtailment |
|
|
— |
|
|
(0.1 |
) |
|
— |
|
| |
|
|
|
|
|
|
|
Net periodic (benefit) / cost |
|
$ |
1.8 |
|
$ |
1.1 |
|
$ |
(0.4 |
) |
| |
|
|
|
|
|
|
|
For year ended January 1, 2011: |
|
|
|
|
|
|
|
|
|
|
| |
Service cost |
|
$ |
0.3 |
|
$ |
0.6 |
|
$ |
— |
|
| |
Interest cost |
|
|
4.4 |
|
|
0.8 |
|
|
0.1 |
|
| |
Past service |
|
|
— |
|
|
— |
|
|
(0.4 |
) |
| |
Amortization of net (gain) / loss |
|
|
0.8 |
|
|
0.1 |
|
|
(0.1 |
) |
| |
Expected return on plan assets |
|
|
(3.9 |
) |
|
(0.3 |
) |
|
— |
|
| |
|
|
|
|
|
|
|
Net periodic (benefit) / cost |
|
$ |
1.6 |
|
$ |
1.2 |
|
$ |
(0.4 |
) |
| |
|
|
|
|
|
|
|
For year ended December 26, 2009: |
|
|
|
|
|
|
|
|
|
|
| |
Service cost |
|
$ |
0.3 |
|
$ |
0.6 |
|
$ |
— |
|
| |
Interest cost |
|
|
4.4 |
|
|
0.7 |
|
|
0.1 |
|
| |
Past service |
|
|
— |
|
|
— |
|
|
(0.4 |
) |
| |
Amortization of net (gain) / loss |
|
|
1.5 |
|
|
(0.1 |
) |
|
(0.1 |
) |
| |
Expected return on plan assets |
|
|
(3.2 |
) |
|
(0.4 |
) |
|
— |
|
| |
Settlement / curtailment |
|
|
0.2 |
|
|
0.4 |
|
|
— |
|
| |
|
|
|
|
|
|
|
Net periodic (benefit) / cost |
|
$ |
3.2 |
|
$ |
1.2 |
|
$ |
(0.4 |
) |
| |
|
|
|
|
|
|
|
The estimated net actuarial loss, prior service benefit, and transition asset for the defined benefit pension plans that will be amortized from other
comprehensive loss into net periodic benefit cost over the next fiscal year is $3.2 million, $0, and $0.1 million, respectively. The estimated net actuarial gain and prior service benefit for
the defined benefit postretirement plans that will be amortized from other comprehensive loss into net periodic benefit cost over the next fiscal year is $0.1 million and $0.4 million,
respectively.
F-27
Table of Contents
Table of Contents
ISOLA GROUP S.À R.L. AND SUBSIDIARIES,
A WHOLLY OWNED SUBSIDIARY OF TPG HATTRICK PARTNERS, L.P.
NOTES TO CONSOLIDATED FINANCIAL STATEMENTS (Continued)
As of December 31, 2011 and January 1, 2011, and for the fiscal years ended
December 31, 2011, January 1, 2011 and December 26, 2009
The following table provides details of the changes in benefit obligations for the fiscal years ended December 31, 2011 and January 1, 2011 (in millions):
|
|
|
|
|
|
|
|
|
|
|
|
|
|
Pension benefits |
|
|
|
|
|
U.S.
plans
|
|
Non-U.S.
plans
|
|
Other
benefits
|
|
| |
|
Benefit obligation—December 26, 2009 |
|
$ |
76.0 |
|
$ |
19.0 |
|
$ |
1.5 |
|
| |
Service cost |
|
|
0.3 |
|
|
0.6 |
|
|
— |
|
| |
Interest cost |
|
|
4.4 |
|
|
0.8 |
|
|
0.1 |
|
| |
Actuarial loss |
|
|
7.6 |
|
|
2.4 |
|
|
0.1 |
|
| |
Benefits paid |
|
|
(4.1 |
) |
|
(0.7 |
) |
|
(0.1 |
) |
| |
Currency translation adjustments |
|
|
— |
|
|
0.2 |
|
|
— |
|
| |
|
|
|
|
|
|
|
Benefit obligation—January 1, 2011 |
|
$ |
84.2 |
|
$ |
22.3 |
|
$ |
1.6 |
|
| |
Service cost |
|
$ |
0.3 |
|
$ |
0.6 |
|
$ |
— |
|
| |
Interest cost |
|
|
4.3 |
|
|
0.8 |
|
|
0.1 |
|
| |
Actuarial (gain) / loss |
|
|
11.6 |
|
|
(1.2 |
) |
|
(0.1 |
) |
| |
Benefits paid |
|
|
(4.2 |
) |
|
(0.2 |
) |
|
(0.1 |
) |
| |
Currency translation adjustments |
|
|
— |
|
|
(0.5 |
) |
|
— |
|
| |
|
|
|
|
|
|
|
Benefit obligation—December 31, 2011 |
|
$ |
96.2 |
|
$ |
21.8 |
|
$ |
1.5 |
|
| |
|
|
|
|
|
|
|
The following table provides details of the changes in fair value of the plan assets for the fiscal years ended December 31, 2011 and January 1,
2011 (in millions):
|
|
|
|
|
|
|
|
|
|
|
|
|
|
Pension benefits |
|
|
|
|
|
U.S.
plans
|
|
Non-U.S.
plans
|
|
Other
benefits
|
|
| |
|
Fair value of plan assets—December 26, 2009 |
|
$ |
53.1 |
|
$ |
7.9 |
|
$ |
— |
|
| |
Actual return on plan assets |
|
|
4.8 |
|
|
0.8 |
|
|
— |
|
| |
Employer contributions |
|
|
2.9 |
|
|
0.5 |
|
|
0.1 |
|
| |
Benefit payments |
|
|
(4.1 |
) |
|
(0.7 |
) |
|
(0.1 |
) |
| |
Currency translation adjustments |
|
|
— |
|
|
0.1 |
|
|
— |
|
| |
|
|
|
|
|
|
|
Fair value of plan assets—January 1, 2011 |
|
$ |
56.7 |
|
$ |
8.6 |
|
$ |
— |
|
| |
Actual return on plan assets |
|
|
(3.0 |
) |
|
0.8 |
|
|
— |
|
| |
Employer contributions |
|
|
4.5 |
|
|
0.5 |
|
|
0.3 |
|
| |
Benefit payments |
|
|
(4.2 |
) |
|
(0.2 |
) |
|
(0.3 |
) |
| |
Currency translation adjustments |
|
|
— |
|
|
(0.2 |
) |
|
— |
|
| |
|
|
|
|
|
|
|
Fair value of plan assets—December 31, 2011 |
|
$ |
54.0 |
|
$ |
9.5 |
|
$ |
— |
|
| |
|
|
|
|
|
|
|
F-28
Table of Contents
ISOLA GROUP S.À R.L. AND SUBSIDIARIES,
A WHOLLY OWNED SUBSIDIARY OF TPG HATTRICK PARTNERS, L.P.
NOTES TO CONSOLIDATED FINANCIAL STATEMENTS (Continued)
As of December 31, 2011 and January 1, 2011, and for the fiscal years ended
December 31, 2011, January 1, 2011 and December 26, 2009
As of December 31, 2011 and January 1, 2011, the following table provides a reconciliation of the funded status of the plans to the amounts
recognized on the consolidated balance sheets (in millions):
|
|
|
|
|
|
|
|
|
|
|
|
|
|
|
|
|
|
|
|
|
|
|
Pension benefits |
|
|
|
|
|
|
|
U.S. plans |
|
Non-U.S. plans |
|
Other benefits |
|
|
|
December 31, 2011
|
|
January 1, 2011
|
|
December 31, 2011
|
|
January 1, 2011
|
|
December 31, 2011
|
|
January 1, 2011
|
|
| |
|
Funded status, current liability |
|
$ |
(0.3 |
) |
$ |
— |
|
$ |
(0.1 |
) |
$ |
(0.3 |
) |
$ |
(0.1 |
) |
$ |
(0.2 |
) |
Funded status, noncurrent liability |
|
|
(41.9 |
) |
|
(27.6 |
) |
|
(12.2 |
) |
|
(13.5 |
) |
|
(1.4 |
) |
|
(1.4 |
) |
Unrecognized actuarial loss / (gain) |
|
|
40.4 |
|
|
23.0 |
|
|
2.9 |
|
|
4.7 |
|
|
(1.0 |
) |
|
(0.9 |
) |
Unrecognized transition |
|
|
— |
|
|
— |
|
|
(0.2 |
) |
|
(0.2 |
) |
|
— |
|
|
— |
|
Prior service credit |
|
|
— |
|
|
— |
|
|
— |
|
|
— |
|
|
(5.3 |
) |
|
(5.7 |
) |
| |
|
|
|
|
|
|
|
|
|
|
|
|
|
| |
Accrued pension cost |
|
|
(1.8 |
) |
|
(4.6 |
) |
|
(9.6 |
) |
|
(9.3 |
) |
|
(7.8 |
) |
|
(8.2 |
) |
Net amount recognized in accumulated other comprehensive loss |
|
|
(40.4 |
) |
|
(23.0 |
) |
|
(2.7 |
) |
|
(4.5 |
) |
|
6.3 |
|
|
6.6 |
|
| |
|
|
|
|
|
|
|
|
|
|
|
|
|
Net amount recognized |
|
$ |
(42.2 |
) |
$ |
(27.6 |
) |
$ |
(12.3 |
) |
$ |
(13.8 |
) |
$ |
(1.5 |
) |
$ |
(1.6 |
) |
| |
|
|
|
|
|
|
|
|
|
|
|
|
|
The following table presents amounts postretirement benefits and pension plans with accumulated benefit obligations in excess of fair value of plan assets (in
millions):
|
|
|
|
|
|
|
|
|
|
December 31, 2011
|
|
January 1, 2011
|
|
| |
|
Projected benefit obligation |
|
$ |
111.8 |
|
$ |
106.6 |
|
Accumulated benefit obligations |
|
|
111.7 |
|
|
106.4 |
|
Fair value of plan assets |
|
|
57.2 |
|
|
65.3 |
|
F-29
Table of Contents
ISOLA GROUP S.À R.L. AND SUBSIDIARIES,
A WHOLLY OWNED SUBSIDIARY OF TPG HATTRICK PARTNERS, L.P.
NOTES TO CONSOLIDATED FINANCIAL STATEMENTS (Continued)
As of December 31, 2011 and January 1, 2011, and for the fiscal years ended
December 31, 2011, January 1, 2011 and December 26, 2009
The following table provides details regarding the amounts recognized in consolidated accumulated other comprehensive loss:
|
|
|
|
|
|
|
|
|
|
|
|
|
|
|
|
|
Pension benefits |
|
|
|
|
|
|
|
U.S.
plans
|
|
Non-U.S.
plans
|
|
Other
benefits
|
|
Total
|
|
| |
|
As of December 31, 2011: |
|
|
|
|
|
|
|
|
|
|
|
|
|
| |
Unrecognized actuarial (gain) / loss |
|
$ |
40.4 |
|
$ |
2.9 |
|
$ |
(1.0 |
) |
$ |
42.3 |
|
| |
Unrecognized past service cost / (credit) |
|
|
— |
|
|
— |
|
|
(5.3 |
) |
|
(5.3 |
) |
| |
Unrecognized net transition asset or obligation |
|
|
— |
|
|
(0.2 |
) |
|
— |
|
|
(0.2 |
) |
| |
|
|
|
|
|
|
|
|
|
Net amount recognized in accumulated other comprehensive loss |
|
$ |
40.4 |
|
$ |
2.7 |
|
$ |
(6.3 |
) |
$ |
36.8 |
|
| |
|
|
|
|
|
|
|
|
|
As of January 1, 2011: |
|
|
|
|
|
|
|
|
|
|
|
|
|
| |
Unrecognized actuarial (gain) / loss |
|
$ |
23.0 |
|
$ |
4.7 |
|
$ |
(0.9 |
) |
$ |
26.8 |
|
| |
Unrecognized past service cost / (credit) |
|
|
— |
|
|
— |
|
|
(5.7 |
) |
|
(5.7 |
) |
| |
Unrecognized net transition asset or obligation |
|
|
— |
|
|
(0.2 |
) |
|
— |
|
|
(0.2 |
) |
| |
|
|
|
|
|
|
|
|
|
Net amount recognized in accumulated other comprehensive loss |
|
$ |
23.0 |
|
$ |
4.5 |
|
$ |
(6.6 |
) |
$ |
20.9 |
|
| |
|
|
|
|
|
|
|
|
|
The following table provides details regarding the weighted-average assumptions for both the pension and other benefits used to determine each respective
benefit obligation and net periodic benefit cost for the fiscal years ended December 31, 2011 and January 1, 2011:
|
|
|
|
|
|
|
|
|
|
|
|
|
|
|
|
|
|
|
|
|
|
|
Pension benefits |
|
|
|
|
|
|
|
U.S. plans |
|
Non-U.S. plans |
|
Other benefits |
|
|
|
December 31, 2011
|
|
January 1, 2011
|
|
December 31, 2011
|
|
January 1, 2011
|
|
December 31, 2011
|
|
January 1, 2011
|
|
| |
|
Weighted-average assumptions used to determine benefit obligations at year-end: |
|
|
|
|
|
|
|
|
|
|
|
|
|
|
|
|
|
|
|
| |
Discount rate |
|
|
4.21 |
% |
|
5.22 |
% |
|
3.65 |
% |
|
3.77 |
% |
|
3.75 |
% |
|
4.75 |
% |
| |
Rate of compensation increase |
|
|
N/A |
|
|
N/A |
|
|
0.66 |
% |
|
2.09 |
% |
|
N/A |
|
|
N/A |
|
Weighted-average assumptions used to determine net (benefit) / cost: |
|
|
|
|
|
|
|
|
|
|
|
|
|
|
|
|
|
|
|
| |
Discount rate |
|
|
5.24 |
% |
|
5.99 |
% |
|
3.52 |
% |
|
4.55 |
% |
|
4.75 |
% |
|
5.50 |
% |
| |
Expected return on plan assets |
|
|
7.44 |
% |
|
7.44 |
% |
|
4.19 |
% |
|
4.50 |
% |
|
N/A |
|
|
N/A |
|
| |
Rate of compensation increase |
|
|
N/A |
|
|
N/A |
|
|
1.00 |
% |
|
1.85 |
% |
|
N/A |
|
|
N/A |
|
The Company sets the discount rate assumption annually for each of its retirement-related benefit plans at their measurement dates to reflect the yield of a
portfolio of high quality, fixed-income debt instruments
F-30
Table of Contents
ISOLA GROUP S.À R.L. AND SUBSIDIARIES,
A WHOLLY OWNED SUBSIDIARY OF TPG HATTRICK PARTNERS, L.P.
NOTES TO CONSOLIDATED FINANCIAL STATEMENTS (Continued)
As of December 31, 2011 and January 1, 2011, and for the fiscal years ended
December 31, 2011, January 1, 2011 and December 26, 2009
matched
against the timing and amounts of projected future benefits. Assumptions regarding the health care cost trends and rates are as follows:
|
|
|
|
|
|
|
|
|
|
|
December 31, 2011
|
|
January 1, 2011
|
|
| |
|
Assumed health care trend rates: |
|
|
|
|
|
|
|
| |
Initial health care cost trend rate |
|
|
8.5 |
% |
|
9.0 |
% |
| |
Ultimate health care cost trend rate |
|
|
5.0 |
% |
|
5.0 |
% |
| |
Number of years to ultimate trend rate |
|
|
7 years |
|
|
8 years |
|
A one percentage point increase or decrease in the initial assumed health care trend rate through ultimate assumed health care trend rates would have an
immaterial effect on the accumulated postretirement benefit obligation at December 31, 2011.
The
Company has selected a 6.96% weighted average expected rate of return on plan assets for the fiscal year ending December 29, 2012. The Company selected the expected long-term rate of
return on plan assets by examining the past performance and the economic forecasts for the types and specific investments held by each plan on an annual basis. The Company believes a 6.96% rate of
return to be reasonable given the historical performance of the current asset allocation and the expected future performance for each plan.
The
following benefit payments and contributions are expected to be paid (in millions):
|
|
|
|
|
|
|
|
|
|
|
|
|
Pension benefits |
|
Other benefits |
|
Fiscal years ending
|
|
U.S.
plans
|
|
Non-U.S.
plans
|
|
Gross benefit
payments
|
|
| |
|
2012 |
|
$ |
4.4 |
|
$ |
0.4 |
|
$ |
0.1 |
|
2013 |
|
|
4.2 |
|
|
0.4 |
|
|
0.1 |
|
2014 |
|
|
4.3 |
|
|
0.5 |
|
|
0.1 |
|
2015 |
|
|
4.3 |
|
|
0.7 |
|
|
0.1 |
|
2016 |
|
|
4.4 |
|
|
0.8 |
|
|
0.1 |
|
2017-2021 |
|
|
24.7 |
|
|
4.1 |
|
|
0.4 |
|
The Company's overall asset investment strategy focuses on maintaining a diversified portfolio using various asset classes in order to achieve the
long-term investment objectives on a risk adjusted basis. The actual invested positions in various securities change over time based on short- and long-term investment
opportunities. The Company reviews its assets on a regular basis to ensure that they are within the targeted asset allocation ranges and, if necessary, asset balances are adjusted back within target
allocations. Target allocation percentages differ by each individual plan but are relatively consistent with the allocation percentages shown in the table below.
F-31
Table of Contents
ISOLA GROUP S.À R.L. AND SUBSIDIARIES,
A WHOLLY OWNED SUBSIDIARY OF TPG HATTRICK PARTNERS, L.P.
NOTES TO CONSOLIDATED FINANCIAL STATEMENTS (Continued)
As of December 31, 2011 and January 1, 2011, and for the fiscal years ended
December 31, 2011, January 1, 2011 and December 26, 2009
The
following table presents information about the Company's plan assets measured at fair value on a recurring basis at December 31, 2011 and January 1, 2011, and indicates the fair
value hierarchy of the valuation techniques utilized to determine such fair value:
|
|
|
|
|
|
|
|
|
|
|
|
|
|
|
|
|
|
|
|
|
Total
|
|
Quoted prices
in active
markets for
identical
assets
(Level 1)
|
|
Significant
observable
inputs
(Level 2)
|
|
Significant
unobservable
inputs
(Level 3)
|
|
Asset
allocation
percentages
|
|
| |
|
As of December 31, 2011 |
|
|
|
|
|
|
|
|
|
|
|
|
|
|
|
|
| |
Cash and deposits |
|
$ |
3.4 |
|
$ |
3.4 |
|
$ |
— |
|
$ |
— |
|
|
5 |
% |
Equity securities: |
|
|
|
|
|
|
|
|
|
|
|
|
|
|
|
|
| |
U.S. Large Cap Growth(a) |
|
|
3.5 |
|
|
— |
|
|
3.5 |
|
|
— |
|
|
6 |
% |
| |
U.S. Large Cap Value(a) |
|
|
3.6 |
|
|
— |
|
|
3.6 |
|
|
— |
|
|
6 |
% |
| |
U.S. Mid Cap Growth(a) |
|
|
2.0 |
|
|
— |
|
|
2.0 |
|
|
— |
|
|
3 |
% |
| |
U.S. Mid Cap Value(a) |
|
|
1.9 |
|
|
— |
|
|
1.9 |
|
|
— |
|
|
3 |
% |
| |
U.S. Small Cap Growth(a) |
|
|
1.0 |
|
|
— |
|
|
1.0 |
|
|
— |
|
|
2 |
% |
| |
U.S. Equity Index Fund(a) |
|
|
0.9 |
|
|
— |
|
|
0.9 |
|
|
— |
|
|
1 |
% |
| |
U.S. Natural Resources(a) |
|
|
6.5 |
|
|
— |
|
|
6.5 |
|
|
— |
|
|
10 |
% |
| |
International Blend(b) |
|
|
4.7 |
|
|
— |
|
|
4.7 |
|
|
— |
|
|
7 |
% |
| |
|
|
|
|
|
|
|
|
|
|
|
| |
|
Total equity securities |
|
|
24.1 |
|
|
— |
|
|
24.1 |
|
|
— |
|
|
38 |
% |
| |
|
|
|
|
|
|
|
|
|
|
|
Fixed income: |
|
|
|
|
|
|
|
|
|
|
|
|
|
|
|
|
| |
Guaranteed Deposit Fund(c) |
|
|
12.1 |
|
|
— |
|
|
— |
|
|
12.1 |
|
|
19 |
% |
| |
Templeton Global Bond Fund ADVI(d) |
|
|
5.3 |
|
|
— |
|
|
5.3 |
|
|
— |
|
|
8 |
% |
| |
Core Bond Enhanced Index / PIM Fund(d) |
|
|
9.6 |
|
|
— |
|
|
9.6 |
|
|
— |
|
|
15 |
% |
| |
High Yield Bond / Caywood-Scholl Fund(d) |
|
|
2.9 |
|
|
— |
|
|
2.9 |
|
|
— |
|
|
5 |
% |
| |
International Corporate Bonds |
|
|
6.1 |
|
|
— |
|
|
6.1 |
|
|
— |
|
|
10 |
% |
| |
|
|
|
|
|
|
|
|
|
|
|
| |
|
Total fixed income |
|
|
36.0 |
|
|
— |
|
|
23.9 |
|
|
12.1 |
|
|
57 |
% |
| |
|
|
|
|
|
|
|
|
|
|
|
Total |
|
$ |
63.5 |
|
$ |
3.4 |
|
$ |
48.0 |
|
$ |
12.1 |
|
|
100 |
% |
| |
|
|
|
|
|
|
|
|
|
|
|
F-32
Table of Contents
ISOLA GROUP S.À R.L. AND SUBSIDIARIES,
A WHOLLY OWNED SUBSIDIARY OF TPG HATTRICK PARTNERS, L.P.
NOTES TO CONSOLIDATED FINANCIAL STATEMENTS (Continued)
As of December 31, 2011 and January 1, 2011, and for the fiscal years ended
December 31, 2011, January 1, 2011 and December 26, 2009
|
|
|
|
|
|
|
|
|
|
|
|
|
|
|
|
|
|
|
|
|
Total
|
|
Quoted prices
in active
markets for
identical
assets
(Level 1)
|
|
Significant
observable
inputs
(Level 2)
|
|
Significant
unobservable
inputs
(Level 3)
|
|
Asset
allocation
percentages
|
|
| |
|
As of January 1, 2011 |
|
|
|
|
|
|
|
|
|
|
|
|
|
|
|
|
| |
Cash and deposits |
|
$ |
3.1 |
|
$ |
3.1 |
|
$ |
— |
|
$ |
— |
|
|
5 |
% |
Equity securities: |
|
|
|
|
|
|
|
|
|
|
|
|
|
|
|
|
| |
U.S. Large Cap Growth(a) |
|
|
3.7 |
|
|
— |
|
|
3.7 |
|
|
— |
|
|
6 |
% |
| |
U.S. Large Cap Value(a) |
|
|
3.8 |
|
|
— |
|
|
3.8 |
|
|
— |
|
|
6 |
% |
| |
U.S. Mid Cap Growth(a) |
|
|
2.2 |
|
|
— |
|
|
2.2 |
|
|
— |
|
|
3 |
% |
| |
U.S. Mid Cap Value(a) |
|
|
2.2 |
|
|
— |
|
|
2.2 |
|
|
— |
|
|
3 |
% |
| |
U.S. Small Cap Growth(a) |
|
|
1.7 |
|
|
— |
|
|
1.7 |
|
|
— |
|
|
3 |
% |
| |
U.S. Equity Index Fund(a) |
|
|
1.1 |
|
|
— |
|
|
1.1 |
|
|
— |
|
|
2 |
% |
| |
U.S. Natural Resources(a) |
|
|
2.8 |
|
|
— |
|
|
2.8 |
|
|
— |
|
|
4 |
% |
| |
International Blend(b) |
|
|
7.2 |
|
|
— |
|
|
7.2 |
|
|
— |
|
|
11 |
% |
| |
|
|
|
|
|
|
|
|
|
|
|
| |
|
Total equity securities |
|
|
24.7 |
|
|
— |
|
|
24.7 |
|
|
— |
|
|
38 |
% |
| |
|
|
|
|
|
|
|
|
|
|
|
Fixed income: |
|
|
|
|
|
|
|
|
|
|
|
|
|
|
|
|
| |
Guaranteed Deposit Fund(c) |
|
|
12.8 |
|
|
— |
|
|
— |
|
|
12.8 |
|
|
20 |
% |
| |
Templeton Global Bond Fund ADVI(d) |
|
|
7.8 |
|
|
— |
|
|
7.8 |
|
|
— |
|
|
12 |
% |
| |
Core Bond Enhanced Index / PIM Fund(d) |
|
|
8.8 |
|
|
— |
|
|
8.8 |
|
|
— |
|
|
13 |
% |
| |
High Yield Bond / Caywood-Scholl Fund(d) |
|
|
2.7 |
|
|
— |
|
|
2.7 |
|
|
— |
|
|
4 |
% |
| |
International Corporate Bonds |
|
|
5.4 |
|
|
— |
|
|
5.4 |
|
|
— |
|
|
8 |
% |
| |
|
|
|
|
|
|
|
|
|
|
|
| |
|
Total fixed income |
|
|
37.5 |
|
|
— |
|
|
24.7 |
|
|
12.8 |
|
|
57 |
% |
| |
|
|
|
|
|
|
|
|
|
|
|
Total |
|
$ |
65.3 |
|
$ |
3.1 |
|
$ |
49.4 |
|
$ |
12.8 |
|
|
100 |
% |
| |
|
|
|
|
|
|
|
|
|
|
|
- (a)
- Domestic funds that are not publically traded and are invested primarily in U.S. equity securities. Securities in these funds are typically priced using the closing price from the
applicable exchange(s).
- (b)
- International equity securities are typically priced using the closing price from the appropriate local exchange(s). Securities are evaluated by a third-party which
seeks to update
prices in the event there are material market movements between local exchange closing times and the portfolio valuation time (4pm EST each day).
- (c)
- Assets consist of investments in interest rate-based funds. The value in these assets is calculated by multiplying the balance in the account by an established
interest
rate.
- (d)
- Assets are typically comprised of U.S. fixed-income securities. Securities are priced by an outside service using inputs such as benchmark yields, reported trades,
broker/dealer
quotes, and issuer spreads. The outside service also monitors market indices and industry and economic events, including credit rating agency actions.
F-33
Table of Contents
ISOLA GROUP S.À R.L. AND SUBSIDIARIES,
A WHOLLY OWNED SUBSIDIARY OF TPG HATTRICK PARTNERS, L.P.
NOTES TO CONSOLIDATED FINANCIAL STATEMENTS (Continued)
As of December 31, 2011 and January 1, 2011, and for the fiscal years ended
December 31, 2011, January 1, 2011 and December 26, 2009
The following table presents the changes in Level 3 Plan assets measured on a recurring basis for the years ended December 31, 2011 and
January 1, 2011 (in millions):
|
|
|
|
|
|
|
|
|
|
|
Plan assets |
|
|
|
Guaranteed
deposit fund
|
|
Real
estate
|
|
| |
|
Balance—December 26, 2009 |
|
$ |
10.6 |
|
$ |
3.7 |
|
Transfers into Level 3 |
|
|
2.2 |
|
|
— |
|
Total gains or losses (realized/unrealized) included in changes in net asset |
|
|
1.5 |
|
|
0.3 |
|
Purchases, issuances, sales and settlements: |
|
|
|
|
|
|
|
| |
Purchases |
|
|
2.9 |
|
|
— |
|
| |
Sales |
|
|
(4.4 |
) |
|
(4.0 |
) |
| |
|
|
|
|
|
Balance—January 1, 2011 |
|
$ |
12.8 |
|
$ |
— |
|
Transfers into Level 3 |
|
|
0.5 |
|
|
— |
|
Transfers out of Level 3 |
|
|
(1.6 |
) |
|
— |
|
Total gains or losses (realized/unrealized) included in changes in net asset |
|
|
0.8 |
|
|
— |
|
Purchases, issuances, sales and settlements: |
|
|
|
|
|
|
|
| |
Purchases |
|
|
4.3 |
|
|
— |
|
| |
Sales |
|
|
(4.7 |
) |
|
— |
|
| |
|
|
|
|
|
Balance—December 31, 2011 |
|
$ |
12.1 |
|
$ |
— |
|
| |
|
|
|
|
|
A subsidiary of the Company also maintains a 401(k) defined contribution plan for the benefit of its U.S. employees. The Company's matching contributions for
the fiscal years ended December 31, 2011, January 1, 2011 and December 26, 2009 were $0.7 million, $0.5 million and $0.1 million, respectively. Effective
February 2009, the Company suspended the 401(k) defined contribution plan matching program in the U.S. The Company resumed the matching program in April 2010.
8. COMMITMENTS AND CONTINGENCIES
Leases—The Company's principal noncancelable, long-term, operating lease obligations are for land, manufacturing equipment, and office and warehouse
space. Rental expense for the fiscal years ended December 31, 2011, January 1, 2011 and December 26, 2009 was $3.3 million, $3.5 million and $4.3 million,
respectively.
Property,
plant, and equipment recorded under capital leases and related accumulated depreciation was $19.4 million and $3.2 million as of December 31, 2011, respectively, and
$19.6 million and $2.6 million as of January 1, 2011, respectively.
F-34
Table of Contents
ISOLA GROUP S.À R.L. AND SUBSIDIARIES,
A WHOLLY OWNED SUBSIDIARY OF TPG HATTRICK PARTNERS, L.P.
NOTES TO CONSOLIDATED FINANCIAL STATEMENTS (Continued)
As of December 31, 2011 and January 1, 2011, and for the fiscal years ended
December 31, 2011, January 1, 2011 and December 26, 2009
Future minimum lease payments under non-cancelable operating and capital leases at December 31, 2011 are as follows (in millions):
|
|
|
|
|
|
|
|
Fiscal years
|
|
Operating leases
|
|
Capital leases
|
|
| |
|
2012 |
|
$ |
0.9 |
|
$ |
1.4 |
|
2013 |
|
|
0.7 |
|
|
1.4 |
|
2014 |
|
|
0.5 |
|
|
1.4 |
|
2015 |
|
|
0.4 |
|
|
1.4 |
|
2016 |
|
|
0.4 |
|
|
1.4 |
|
Thereafter |
|
|
1.1 |
|
|
12.3 |
|
| |
|
|
|
|
|
Total minimum lease payments |
|
$ |
4.0 |
|
|
19.3 |
|
| |
|
|
|
|
|
|
Imputed interest |
|
|
|
|
|
(4.4 |
) |
| |
|
|
|
|
|
|
Present value of minimum lease payments |
|
|
|
|
|
14.9 |
|
Current portion of capital lease obligations (included in other current liabilities) |
|
|
|
|
|
(0.7 |
) |
| |
|
|
|
|
|
|
Long-term portion of capital lease obligations |
|
|
|
|
$ |
14.2 |
|
| |
|
|
|
|
|
|
The Company received $2.4 million, $2.0 million and $2.0 million of rental income from the sublease of certain office and warehouse space during
the fiscal years ended December 31, 2011, January 1, 2011, and December 26, 2009, respectively. Rental income was recorded as a reduction of cost of goods sold in the consolidated
statements of operations. The sublease is expected to provide approximately $2.2 million in rental income during fiscal year 2012, $2.1 million for fiscal year 2013 and $0.2 million for fiscal
years 2014, 2015 and 2016 and is not included in the table above.
Legal Proceedings—From time to time, the Company is involved in legal proceedings and claims that occur in the normal course of business. Although there can be no
assurance, the Company does not believe the results of these proceedings, either individually or in the aggregate, will have a material effect on its business, results of operations, financial
position, or cash flows. As of the date of these consolidated financial statements, the Company is not a party to any material litigation.
On
February 15, 2010, the Company entered into a settlement agreement with a third-party ending a dispute related to the use of patented technology. The agreement resulted in the Company
receiving a settlement from the third-party in the amount of $3.0 million which has been recorded in other income in the consolidated statement of operations during the fiscal year ended
January 1, 2011. The agreement also requires the third-party to pay royalties during the life of the patent.
9. STOCK-BASED COMPENSATION
Option Plans—Executives and other key employees have been granted options to purchase Limited Partner Common Units of the sole stockholder of the Company under
terms of the TPG Hattrick Partners, L.P. 2004 Option Plan ("2004 Plan") and the TPG Hattrick Partners, L.P. 2010 Option Plan ("2010 Plan"). The Plans were adopted in June 2004 and
September 2010, respectively, and are administered by a committee appointed by TPG (the "Committee"). The exercise price of the stock options granted are determined by the
F-35
Table of Contents
ISOLA GROUP S.À R.L. AND SUBSIDIARIES,
A WHOLLY OWNED SUBSIDIARY OF TPG HATTRICK PARTNERS, L.P.
NOTES TO CONSOLIDATED FINANCIAL STATEMENTS (Continued)
As of December 31, 2011 and January 1, 2011, and for the fiscal years ended
December 31, 2011, January 1, 2011 and December 26, 2009
Committee.
The options vest annually over a 2- to 5-year period beginning with the first anniversary of the grant date and bear a 10-year contractual life.
Restricted Unit Plan—Executives and other key employees have been granted restricted limited partner common units of the sole stockholder of the Company (the
"Limited Partner Common Units") under terms of the TPG Hattrick Partners, L.P. 2007 Restricted Unit Plan ("2007 Unit Plan") as amended and restated as of September 30, 2010. The plan was
adopted and is administered by a committee approved by the general partner of TPG (the "Committee"). The fair value of the units granted is determined by the Committee at date of issuance. The units
vest in accordance with the terms outlined in each individual restricted unit grant agreement. The restricted units or any such portion thereof that is not vested on the date the participant's
services are terminated shall expire on such date.
As
of December 31, 2011 and January 1, 2011, the Committee had authorized the issuance of an aggregate number of options and restricted units under the terms of the Plans discussed above
of 21,585,340 and 21,697,494, respectively. The Company had a combined total of 15,234,000 and 16,834,000 options and restricted units outstanding as of December 31, 2011 and January 1,
2011, respectively.
The
Company adopted the fair value method on January 1, 2006 in recognizing stock-based compensation expense. Under the fair value method, the Company estimates the fair value of each
stock-based award on the grant date using the Black-Scholes option-pricing model and certain assumptions. The weighted average assumptions utilized for options granted during the fiscal years ended
December 31, 2011 and January 1, 2011 are noted in the following table:
|
|
|
|
|
|
|
|
|
|
December 31,
2011
|
|
January 1,
2011
|
|
| |
|
Expected dividend rate |
|
|
0 |
% |
|
0 |
% |
Expected stock price volatility |
|
|
80.0 |
% |
|
65.0 |
% |
Expected forfeiture rate |
|
|
5.0 |
% |
|
5.0 |
% |
Risk free interest rate |
|
|
2.41 |
% |
|
1.43 |
% |
Expected term of options |
|
|
6.0 Years |
|
|
6.0 Years |
|
No options were granted during the fiscal year ended December 26, 2009.
The
Company based expected volatility on the historical volatility of a peer group of publicly traded entities over a period consistent with the expected terms of the options as the Company did not
have a sufficient trading history to use the volatility of the Company's common stock. The expected term of options represents the period that the options are expected to be outstanding and is based
on management's best estimate. The risk-free interest rate used is based on the United States
Treasury yield in effect at the time of grant for zero coupon United States Treasury notes with maturities approximating each grant's expected life. The Company does not have a history of issuing
dividends and does not expect to issue dividends in the foreseeable future.
The
Company calculates employee stock-based compensation expense based on awards ultimately expected to vest as reduced for estimated forfeitures. The fair value method requires forfeitures to be
estimated at the time of grant and revised, if necessary, in subsequent periods if actual forfeitures differ from those estimates. The Company estimates the forfeiture rate based on an analysis of
actual forfeitures and will continue to evaluate the adequacy of the forfeiture rate based on actual forfeiture experience, analysis of employee
F-36
Table of Contents
ISOLA GROUP S.À R.L. AND SUBSIDIARIES,
A WHOLLY OWNED SUBSIDIARY OF TPG HATTRICK PARTNERS, L.P.
NOTES TO CONSOLIDATED FINANCIAL STATEMENTS (Continued)
As of December 31, 2011 and January 1, 2011, and for the fiscal years ended
December 31, 2011, January 1, 2011 and December 26, 2009
turnover
behavior, and other factors. The impact from a forfeiture rate adjustment will be recognized in full in the period of adjustment, and if the actual number of future forfeitures differs from
that estimated, the Company may be required to record adjustments to stock-based compensation expense in future periods.
In
conducting the valuation of the partnership units, the Company used a methodology that is consistent with the methods outlined in the AICPA Practice Aid Valuation of
Privately-Held-Company Equity Securities Issued as Compensation. These valuations were prepared beginning in 2004, contemporaneous with the grant of
stock-based payment awards. In preparing the 2010 consolidated financial statements, the Company determined that these historic valuations did not appropriately consider the rights and preferences of
the Company's and the sole stockholder's share and partnership unit classes, respectively. Accordingly, during 2011, the Company engaged a third-party consultant to assist in the determination of the
estimated fair value of the partnership units underlying the stock-based awards, as described in Note 5, and performed retrospective valuations for significant historical stock-based payment award
dates. These retrospective valuations resulted in new estimates of fair value of the partnership units underlying the stock-based payment awards at each respective period. The revised fair values were
utilized to prepare the Company's consolidated financial statements for all periods presented.
All
of the allocated value associated with the Company's common stock and CPCs would be available to the Company's sole stockholder. Similar to the Company enterprise allocation described in Note 5,
the OPM was used to allocate this value among the varying partnership interests, including the partnership units underlying the Company's stock-based payment awards. The Company allocated this value
based on a series of call options using the Black- Scholes option-pricing model and assumptions consistent with those selected to value the options to purchase partnership units, previously discussed.
The estimates made with respect to the anticipated timing of a potential liquidity event and volatility were consistent with those associated with the allocation of enterprise value among the
securities that comprise the Company's capital structure.
On
October 8, 2010, certain of the Company's employees holding options (vested or unvested at that date) were given an offer to either retain their existing options with the originally issued
terms or
surrender their options for $0.53 in cash for each vested option payable immediately as well as $0.53 in cash for each unvested option payable upon completion of that unvested option's original
service-based vesting condition.
In
addition, on October 8, 2010, the remaining employees of the Company holding options (vested or unvested at that date) were given an offer to surrender all of their existing options (vested
or unvested at that date) in exchange for a combination of new options ("New Options") and new restricted partnership units ("New Restricted Units") to be granted under the 2010 Plan and 2007 Unit
Plan, respectively.
F-37
Table of Contents
ISOLA GROUP S.À R.L. AND SUBSIDIARIES,
A WHOLLY OWNED SUBSIDIARY OF TPG HATTRICK PARTNERS, L.P.
NOTES TO CONSOLIDATED FINANCIAL STATEMENTS (Continued)
As of December 31, 2011 and January 1, 2011, and for the fiscal years ended
December 31, 2011, January 1, 2011 and December 26, 2009
As
of October 8, 2010, 4,562,000 options were outstanding and the holders thereof elected the following:
|
|
|
|
|
Action taken
|
|
Options
|
|
| |
|
Vested options surrendered for cash |
|
|
565,000 |
|
Unvested options surrendered for cash upon vesting |
|
|
331,000 |
|
Options exchanged for new options and restricted units |
|
|
3,630,000 |
|
Original options retained |
|
|
36,000 |
|
| |
|
|
|
Total |
|
|
4,562,000 |
|
| |
|
|
|
As a result, employees received $299,450 in cash for vested options surrendered and were entitled to $175,430 in cash for unvested options to be earned as those
options vest under their original terms. The consideration given for the vested options surrendered was in excess of the surrender date fair value by $175,610 and was recognized as compensation
expense in 2010. As future service is required for payment of the options unvested as of October 8, 2010, the Company determined that the transaction was a modification under ASC 718 that
changes the award classification from equity to liability. Incremental compensation cost for these modified awards, measured as the excess of their fair value over the fair value of the original
awards immediately before the terms were modified, was not material.
A
total of 13,460,500 New Options and 3,337,500 New Restricted Units were issued in connection with the exchanges. Both the New Options and New Restricted Units are graded-vesting awards
(one-third per year beginning on the first anniversary of the grant) containing only service vesting conditions. On September 30, 2011, the Company amended the vesting conditions of
the New Restricted Units. The amendment added a second vesting requirement to the original service vesting condition. The vesting of the New Restricted Units is now also subject to the occurrence of a
"Liquidity Event" as defined in the amended agreements; the first to occur of either (i) the time immediately prior to the consummation of a "Change in Control" (as defined in the amended
agreements) or (ii) the "IPO Liquidity Date" (as defined in the amended agreements). Both instruments are nontransferable and contain no voting or distribution rights and unvested awards are
forfeited upon employee termination. The New Options expire 10 years after the grant date and contain no redemption rights. The New Restricted Units contain a feature whereby, upon vesting and
the holder obtaining Limited Partner Common Units pursuant to the 2007 Unit Plan, TPG has a call right on those Limited Partner Common Units during the 90-day period after the later of:
a) participant termination; or b) the date on which the participant has held Limited Partner Common Units acquired pursuant to the 2007 Unit Plan for at least 180 days, at fair
value measured as of the date such right is exercised by the TPG.
The
Company determined the issuance of New Options and New Restricted Units was a modification under ASC 718 for substantially all of the exchanged options. Accordingly, the Company measured the
incremental fair value of consideration given for these modified awards over that of the options tendered and determined there to be $6.8 million of additional value. This additional
stock-based compensation, as well as $1.6 million of unrecognized stock-based compensation related to the options tendered in the modification, will be recognized over the vesting period of the
New Options and New Restricted Units using the straight-line method.
F-38
Table of Contents
ISOLA GROUP S.À R.L. AND SUBSIDIARIES,
A WHOLLY OWNED SUBSIDIARY OF TPG HATTRICK PARTNERS, L.P.
NOTES TO CONSOLIDATED FINANCIAL STATEMENTS (Continued)
As of December 31, 2011 and January 1, 2011, and for the fiscal years ended
December 31, 2011, January 1, 2011 and December 26, 2009
A
summary of option activity as of December 31, 2011, and changes during the three years then ended is as follows:
|
|
|
|
|
|
|
|
|
|
|
|
|
|
|
|
|
Options
|
|
Weighted
average
exercise
price
|
|
Weighted
average
remaining
contractual
life
(in years)
|
|
Aggregate
intrinsic
value
|
|
| |
|
Balance outstanding—December 27, 2008 |
|
|
5,734,000 |
|
$ |
1.22 |
|
|
|
|
|
|
|
| |
Options granted |
|
|
— |
|
|
— |
|
|
|
|
|
|
|
| |
Options exercised |
|
|
— |
|
|
— |
|
|
|
|
|
|
|
| |
Options forfeited |
|
|
(550,000 |
) |
|
1.22 |
|
|
|
|
|
|
|
| |
|
|
|
|
|
|
|
|
|
|
|
|
Balance outstanding—December 26, 2009 |
|
|
5,184,000 |
|
|
1.22 |
|
|
|
|
|
|
|
| |
Options granted |
|
|
13,460,500 |
|
|
0.49 |
|
|
|
|
|
|
|
| |
Options exercised |
|
|
— |
|
|
— |
|
|
|
|
|
|
|
| |
Options exchanged for cash |
|
|
(896,000 |
) |
|
1.22 |
|
|
|
|
|
|
|
| |
Options surrendered for new options and restricted units |
|
|
(3,630,000 |
) |
|
1.22 |
|
|
|
|
|
|
|
| |
Options forfeited |
|
|
(622,000 |
) |
|
1.22 |
|
|
|
|
|
|
|
| |
|
|
|
|
|
|
|
|
|
|
|
|
Balance outstanding—January 1, 2011 |
|
|
13,496,500 |
|
|
0.49 |
|
|
|
|
|
|
|
| |
Options granted |
|
|
96,100 |
|
|
0.49 |
|
|
|
|
|
|
|
| |
Options exercised |
|
|
— |
|
|
— |
|
|
|
|
|
|
|
| |
Options forfeited |
|
|
(1,296,100 |
) |
|
0.49 |
|
|
|
|
|
|
|
| |
|
|
|
|
|
|
|
|
|
|
|
|
Balance outstanding—December 31, 2011 |
|
|
12,296,500 |
|
|
0.49 |
|
|
8.76 |
|
$ |
2,206,890 |
|
| |
|
|
|
|
|
|
|
|
|
|
|
|
Balance exercisable—December 31, 2011 |
|
|
4,082,800 |
|
$ |
0.50 |
|
|
8.74 |
|
$ |
729,864 |
|
| |
|
|
|
|
|
|
|
|
|
|
|
|
The aggregate intrinsic value represents the total pretax intrinsic value (the difference between the exercise price and the sole stockholder's determined unit
value at December 31, 2011, multiplied by the number of units whose fair value exceeded the exercise price at that date) that would have been received by the option holders if the options had
been exercised on December 31, 2011. At December 31, 2011, there were 12,260,500 units whose fair value exceeded the exercise price at that date.
The
weighted average grant date fair value of options granted during the fiscal years ended December 31, 2011 and January 1, 2011 was $0.64 and $0.41 per option, respectively. No options
were exercised during the years ended December 31, 2011, January 1, 2011 or December 26, 2009. At December 31, 2011, the Company expects approximately 7,803,015 options to
additionally vest. At December 31, 2011 these options have an aggregate intrinsic value of $1,403,175, a weighted average remaining contractual term of 8.77 years and a weighted average
exercise price of $0.49. The total grant date fair value of options vested during the years ended December 31, 2011, January 1, 2011 and December 26, 2009, was $1,666,788,
$1,614,060 and $1,981,000, respectively.
F-39
Table of Contents
ISOLA GROUP S.À R.L. AND SUBSIDIARIES,
A WHOLLY OWNED SUBSIDIARY OF TPG HATTRICK PARTNERS, L.P.
NOTES TO CONSOLIDATED FINANCIAL STATEMENTS (Continued)
As of December 31, 2011 and January 1, 2011, and for the fiscal years ended
December 31, 2011, January 1, 2011 and December 26, 2009
A
summary of restricted unit activity as of December 31, 2011, and changes during fiscal 2010 were as follows:
|
|
|
|
|
|
|
|
Restricted units
|
|
| |
|
Balance outstanding—December 26, 2009 |
|
|
— |
|
| |
Restricted units granted |
|
|
3,337,500 |
|
| |
Restricted units vested |
|
|
— |
|
| |
|
|
|
Balance outstanding—January 1, 2011 |
|
|
3,337,500 |
|
| |
|
|
|
| |
Restricted units granted |
|
|
54,700 |
|
| |
Restricted units forfeited |
|
|
(454,700 |
) |
| |
|
|
|
Balance outstanding—December 31, 2011 |
|
|
2,937,500 |
|
| |
|
|
|
The aggregate intrinsic value of restricted units outstanding at December 31, 2011 is $1,968,125.
Granted
but unvested restricted units are forfeited upon termination of employment. At December 31, 2011, the Company expects approximately 2,790,625 restricted units to vest. At
December 31, 2011, these restricted units have an aggregate intrinsic value of $1,869,719, a weighted average remaining contractual term of 1.78 years and a weighted average grant date fair
value of $0.63 per unit.
A
summary of the status of the Company's unvested options and restricted units as of December 31, 2011 and January 1, 2011, and changes during the years then ended is as follows:
|
|
|
|
|
|
|
|
|
|
Options
|
|
Weighted-
average
grant date
fair value
|
|
| |
|
Unvested at December 26, 2009 |
|
|
2,700,000 |
|
$ |
1.66 |
|
Granted |
|
|
13,460,500 |
|
|
0.41 |
|
Vested |
|
|
(854,000 |
) |
|
1.89 |
|
Forfeited |
|
|
(102,000 |
) |
|
1.57 |
|
Exchanged for cash |
|
|
(331,000 |
) |
|
1.45 |
|
Surrendered for new options and restricted units |
|
|
(1,401,000 |
) |
|
1.57 |
|
| |
|
|
|
|
|
|
Unvested at January 1, 2011 |
|
|
13,472,500 |
|
|
0.41 |
|
Granted |
|
|
96,100 |
|
|
0.64 |
|
Vested |
|
|
(4,058,800 |
) |
|
0.41 |
|
Forfeited |
|
|
(1,296,100 |
) |
|
0.41 |
|
| |
|
|
|
|
|
|
Unvested at December 31, 2011 |
|
|
8,213,700 |
|
$ |
0.41 |
|
| |
|
|
|
|
|
|
F-40
Table of Contents
ISOLA GROUP S.À R.L. AND SUBSIDIARIES,
A WHOLLY OWNED SUBSIDIARY OF TPG HATTRICK PARTNERS, L.P.
NOTES TO CONSOLIDATED FINANCIAL STATEMENTS (Continued)
As of December 31, 2011 and January 1, 2011, and for the fiscal years ended
December 31, 2011, January 1, 2011 and December 26, 2009
|
|
|
|
|
|
|
|
|
|
Restricted
units
|
|
Weighted-
average
grant date
fair value
|
|
| |
|
Unvested at December 26, 2009 |
|
|
— |
|
$ |
0.00 |
|
Granted |
|
|
3,337,500 |
|
|
0.63 |
|
Forfeited |
|
|
— |
|
|
— |
|
| |
|
|
|
|
|
Unvested at January 1, 2011 |
|
|
3,337,500 |
|
|
0.63 |
|
Granted |
|
|
54,700 |
|
|
0.83 |
|
Forfeited |
|
|
(454,700 |
) |
|
0.63 |
|
| |
|
|
|
|
|
Unvested at December 31, 2011 |
|
|
2,937,500 |
|
$ |
0.64 |
|
| |
|
|
|
|
|
As of December 31, 2011, there was $4,603,332 of total unrecognized compensation expense related to unvested stock-based compensation granted. The cost
is expected to be recognized over a weighted average period of 1.77 years. As of December 31, 2011, January 1, 2011 and December 26, 2009, 4,082,800, 24,000 and 2,484,000 options,
respectively, were vested. As of December 31, 2011, the Company has 8,213,700 options that are unvested and 2,937,500 restricted units that are unvested.
10. FAIR VALUE MEASUREMENTS
Fair Value Measurements on Recurring Basis—The Company measures the fair value of certain assets and liabilities on a recurring basis based upon a fair value
hierarchy in accordance with ASC 820, Fair Value Measurements and Disclosures, as follows:
Level 1—Observable
inputs such as quoted prices in active markets;
Level 2—Inputs,
other than the quoted prices in active markets, that are observable either directly or indirectly; and
Level 3—Unobservable
inputs in which there is little or no market data, which require the Company to develop its own assumptions.
F-41
Table of Contents
ISOLA GROUP S.À R.L. AND SUBSIDIARIES,
A WHOLLY OWNED SUBSIDIARY OF TPG HATTRICK PARTNERS, L.P.
NOTES TO CONSOLIDATED FINANCIAL STATEMENTS (Continued)
As of December 31, 2011 and January 1, 2011, and for the fiscal years ended
December 31, 2011, January 1, 2011 and December 26, 2009
Liabilities
measured at fair value on a recurring basis include interest rate swaps and embedded derivatives. The following table presents information about the Company's liabilities measured at fair
value on a recurring basis as of December 31, 2011 and January 1, 2011 (in millions):
|
|
|
|
|
|
|
|
|
|
|
|
|
|
|
|
|
|
|
Fair value measurements at
reporting date using |
|
|
|
Total
carrying
value
|
|
Quoted prices
in active
markets for
identical
assets
(Level 1)
|
|
Significant
other
observable
inputs
(Level 2)
|
|
Significant
unobservable
inputs
(Level 3)
|
|
| |
|
December 31, 2011: |
|
|
|
|
|
|
|
|
|
|
|
|
|
Liabilities: |
|
|
|
|
|
|
|
|
|
|
|
|
|
| |
Interest rate swaps(1) |
|
$ |
0.6 |
|
|
|
|
$ |
0.6 |
|
|
|
|
| |
Embedded derivative liability |
|
|
28.9 |
|
|
|
|
|
|
|
|
28.9 |
|
January 1, 2011: |
|
|
|
|
|
|
|
|
|
|
|
|
|
Liabilities: |
|
|
|
|
|
|
|
|
|
|
|
|
|
| |
Interest rate swaps(1) |
|
$ |
0.6 |
|
|
|
|
$ |
0.6 |
|
|
|
|
| |
Embedded derivative liability |
|
|
70.3 |
|
|
|
|
|
|
|
|
70.3 |
|
- (1)
- Included in other liabilities in the consolidated balance sheet.
The Company's interest rate swaps are determined based on market prices for similar instruments in active markets and are classified as Level 2. The
Company's embedded derivative liabilities are measured using Level 3 inputs. Valuations using discounted cash flows are classified within Level 3 as these valuations were determined by
valuation techniques based upon assumed conversion feature activity and discounting those cash flows at a rate reflective of current market conditions and factors specific to the Company.
The
following table presents the changes in Level 3 liabilities measured on a recurring basis for the years ended December 31, 2011 and January 1, 2011 (in millions):
|
|
|
|
|
|
|
|
|
|
|
|
|
Embedded derivative
liability |
|
|
|
CPCs
|
|
Debt
|
|
Total
|
|
| |
|
Balance—December 26, 2009 |
|
$ |
27.5 |
|
$ |
— |
|
$ |
27.5 |
|
Initial fair value of Class C CPCs |
|
|
56.3 |
|
|
— |
|
|
56.3 |
|
Initial fair value of Senior Secured and Mezzanine Debt |
|
|
— |
|
|
9.2 |
|
|
9.2 |
|
Net change in fair value included in earnings |
|
|
(21.8 |
) |
|
0.6 |
|
|
(21.2 |
) |
Translation adjustment |
|
|
(1.5 |
) |
|
— |
|
|
(1.5 |
) |
| |
|
|
|
|
|
|
|
Balance—January 1, 2011 |
|
|
60.5 |
|
|
9.8 |
|
|
70.3 |
|
Net change in fair value included in earnings |
|
|
(43.3 |
) |
|
1.0 |
|
|
(42.3 |
) |
Translation adjustment |
|
|
0.9 |
|
|
— |
|
|
0.9 |
|
| |
|
|
|
|
|
|
|
Balance—December 31, 2011 |
|
$ |
18.1 |
|
$ |
10.8 |
|
$ |
28.9 |
|
| |
|
|
|
|
|
|
|
F-42
Table of Contents
ISOLA GROUP S.À R.L. AND SUBSIDIARIES,
A WHOLLY OWNED SUBSIDIARY OF TPG HATTRICK PARTNERS, L.P.
NOTES TO CONSOLIDATED FINANCIAL STATEMENTS (Continued)
As of December 31, 2011 and January 1, 2011, and for the fiscal years ended
December 31, 2011, January 1, 2011 and December 26, 2009
Fair Value Measurements on a Nonrecurring Basis—Certain assets and liabilities are not measured at fair value but are recognized and disclosed at fair value on a
nonrecurring basis. During the fiscal years ended December 31, 2011 and December 26, 2009, measures of fair value on a nonrecurring basis related primarily to the evaluation of impairment of property,
plant and equipment associated with closed manufacturing facilities. The following table presents information about the Company's assets measured at fair value on a nonrecurring basis for the years
ended December 31, 2011 and December 26, 2009 (in millions):
|
|
|
|
|
|
|
|
|
|
|
|
|
|
|
|
|
|
|
|
|
|
Fair value measurements at
reporting date using |
|
|
|
Total
carrying
value
|
|
Quoted prices
in active
markets for
identical
assets
(Level 1)
|
|
Significant
other
observable
inputs
(Level 2)
|
|
Significant
unobservable
inputs
(Level 3)
|
|
Total
gains
(losses)
|
|
| |
|
December 31, 2011: |
|
|
|
|
|
|
|
|
|
|
|
|
|
|
|
|
Assets: |
|
|
|
|
|
|
|
|
|
|
|
|
|
|
|
|
| |
Property, plant and equipment |
|
$ |
2.3 |
|
|
|
|
$ |
2.3 |
|
|
|
|
$ |
(1.0 |
) |
December 26, 2009: |
|
|
|
|
|
|
|
|
|
|
|
|
|
|
|
|
Assets: |
|
|
|
|
|
|
|
|
|
|
|
|
|
|
|
|
| |
Property, plant and equipment |
|
$ |
— |
|
|
|
|
|
|
|
$ |
— |
|
$ |
(4.1 |
) |
As defined in the fair value hierarchy, for Level 3 inputs fair value is determined using various valuation techniques including discounted cash flow
models, and other information as considered necessary, which contain assumptions and estimates that use unobservable inputs, such as estimated cash flows.
For
the fiscal year ended December 31, 2011, in accordance with the provision of ASC 360-10, Impairment or Disposal of Long-Lived
Assets, property, plant and equipment with a carrying value of $3.3 million was determined to have a fair value of $2.3 million, resulting in a loss of
$1.0 million, which was included in the consolidated statement of operations for the period.
For
the fiscal year ended January 1, 2011, there were no impairment charges.
For
the fiscal year ended December 26, 2009, in accordance with the provision of the ASC 360-10, Impairment or Disposal of Long-Lived
Assets, property, plant and equipment with a carrying value of $4.1 million was determined to have a fair value of zero, resulting in a loss of $4.1 million,
which was included in the consolidated statement of operations for the period. For these assets valued using significant unobservable inputs, inputs utilized included the Company 's estimates, and
recent auction prices for similar equipment to be salvaged.
F-43
Table of Contents
ISOLA GROUP S.À R.L. AND SUBSIDIARIES,
A WHOLLY OWNED SUBSIDIARY OF TPG HATTRICK PARTNERS, L.P.
NOTES TO CONSOLIDATED FINANCIAL STATEMENTS (Continued)
As of December 31, 2011 and January 1, 2011, and for the fiscal years ended
December 31, 2011, January 1, 2011 and December 26, 2009
11. RESTRUCTURING COSTS
During fiscal year 2011, the Company continued restructuring activities that began in fiscal year 2008 to streamline the Company's organizational
structure reduce labor costs and improve manufacturing capacity utilization. In fiscal year 2008, the restructuring charges primarily related to the closure of its Fremont, California facility. In
fiscal year 2009, the Company incurred restructuring costs and professional fees in connection with the closure of its Dalian, China and Fremont, California facilities. In fiscal year 2010 and 2011,
restructuring costs consisted primarily of professional fees related to financial restructuring activities and some residual expenses related to the previous year's facility closures.
The
Company recorded restructuring expense of $1.3 million, $4.8 million and $17.5 million as a separate line item in the consolidated statements of operations for the fiscal
years ended December 31, 2011, January 1, 2011 and December 26, 2009, respectively. Since the inception of this restructuring initiative, the Company has incurred costs totaling
$31.8 million. As of December 31, 2011, these major restructuring activities are substantially complete and the Company expects restructuring expenses to be immaterial in fiscal year 2012.
The
following table presents restructuring expenses incurred by operating segment for the fiscal years ended December 31, 2011, January 1, 2011 and December 26, 2009 (in millions):
|
|
|
|
|
|
|
|
|
|
|
|
|
|
|
|
|
|
|
December 31,
2011
|
|
January 1,
2011
|
|
December 26,
2009
|
|
December 27,
2008
|
|
Cumulative
Total
|
|
| |
|
Asia |
|
$ |
— |
|
$ |
— |
|
$ |
5.6 |
|
$ |
0.7 |
|
$ |
6.3 |
|
Europe |
|
|
— |
|
|
— |
|
|
0.1 |
|
|
2.2 |
|
|
2.3 |
|
Americas |
|
|
0.9 |
|
|
0.7 |
|
|
1.6 |
|
|
4.7 |
|
|
7.9 |
|
Corporate |
|
|
0.4 |
|
|
4.1 |
|
|
10.2 |
|
|
0.6 |
|
|
15.3 |
|
| |
|
|
|
|
|
|
|
|
|
|
|
Total |
|
$ |
1.3 |
|
$ |
4.8 |
|
$ |
17.5 |
|
$ |
8.2 |
|
$ |
31.8 |
|
| |
|
|
|
|
|
|
|
|
|
|
|
F-44
Table of Contents
ISOLA GROUP S.À R.L. AND SUBSIDIARIES,
A WHOLLY OWNED SUBSIDIARY OF TPG HATTRICK PARTNERS, L.P.
NOTES TO CONSOLIDATED FINANCIAL STATEMENTS (Continued)
As of December 31, 2011 and January 1, 2011, and for the fiscal years ended
December 31, 2011, January 1, 2011 and December 26, 2009
A roll forward of accrued restructuring costs for the fiscal years ended December 31, 2011 and January 1, 2011 is presented as follows (in
millions):
|
|
|
|
|
|
|
|
|
|
|
|
|
|
|
|
|
Termination
benefits
|
|
Facility
closure
costs
|
|
Professional
fees
|
|
Total
|
|
| |
|
Balance at December 26, 2009 |
|
$ |
0.3 |
|
$ |
0.1 |
|
$ |
— |
|
$ |
0.4 |
|
| |
Restructuring expense |
|
|
0.3 |
|
|
1.2 |
|
|
3.3 |
|
|
4.8 |
|
| |
Cash payments |
|
|
(0.6 |
) |
|
(1.3 |
) |
|
(3.3 |
) |
|
(5.2 |
) |
| |
|
|
|
|
|
|
|
|
|
Balance at January 1, 2011 |
|
$ |
— |
|
$ |
— |
|
$ |
— |
|
$ |
— |
|
| |
|
|
|
|
|
|
|
|
|
| |
Restructuring expense |
|
$ |
— |
|
$ |
1.3 |
|
$ |
— |
|
$ |
1.3 |
|
| |
Cash payments |
|
|
— |
|
|
(0.7 |
) |
|
— |
|
|
(0.7 |
) |
| |
Noncash charges(1) |
|
|
— |
|
|
(0.6 |
) |
|
— |
|
|
(0.6 |
) |
| |
|
|
|
|
|
|
|
|
|
Balance at December 31, 2011 |
|
$ |
— |
|
$ |
— |
|
$ |
— |
|
$ |
— |
|
| |
|
|
|
|
|
|
|
|
|
- (1)
- Non-cash charges consist of the impairment of property, plant and equipment from the closure of the Fremont, California operating facility.
12. INCOME TAXES
Income before income taxes includes the following componants for the fiscal years ended December 31, 2011, January 1, 2011 and
December 26, 2009 are as follows (in millions):
|
|
|
|
|
|
|
|
|
|
|
|
|
December 31,
2011
|
|
January 1,
2011
|
|
December 26,
2009
|
|
| |
|
U.S. |
|
$ |
(61.3 |
) |
$ |
(37.0 |
) |
$ |
(34.8 |
) |
Foreign |
|
|
82.2 |
|
|
65.4 |
|
|
(58.6 |
) |
| |
|
|
|
|
|
|
|
Total |
|
$ |
20.9 |
|
$ |
28.4 |
|
$ |
(93.4 |
) |
| |
|
|
|
|
|
|
|
F-45
Table of Contents
ISOLA GROUP S.À R.L. AND SUBSIDIARIES,
A WHOLLY OWNED SUBSIDIARY OF TPG HATTRICK PARTNERS, L.P.
NOTES TO CONSOLIDATED FINANCIAL STATEMENTS (Continued)
As of December 31, 2011 and January 1, 2011, and for the fiscal years ended
December 31, 2011, January 1, 2011 and December 26, 2009
Significant components of the Company's income tax provision (benefit) for the fiscal years ended December 31, 2011, January 1, 2011 and
December 26, 2009 are as follows (in millions):
|
|
|
|
|
|
|
|
|
|
|
|
|
|
Current
|
|
Deferred
|
|
Total
|
|
| |
|
Fiscal year ended December 31, 2011 |
|
|
|
|
|
|
|
|
|
|
| |
U.S. Federal |
|
$ |
(0.5 |
) |
$ |
— |
|
$ |
(0.5 |
) |
| |
Foreign |
|
|
12.3 |
|
|
(0.9 |
) |
|
11.4 |
|
| |
U.S. State |
|
|
— |
|
|
— |
|
|
— |
|
| |
|
|
|
|
|
|
|
| |
Total |
|
$ |
11.8 |
|
$ |
(0.9 |
) |
$ |
10.9 |
|
| |
|
|
|
|
|
|
|
Fiscal year ended January 1, 2011 |
|
|
|
|
|
|
|
|
|
|
| |
U.S. Federal |
|
$ |
— |
|
$ |
— |
|
$ |
— |
|
| |
Foreign |
|
|
22.0 |
|
|
4.9 |
|
|
26.9 |
|
| |
U.S. State |
|
|
0.2 |
|
|
— |
|
|
0.2 |
|
| |
|
|
|
|
|
|
|
| |
Total |
|
$ |
22.2 |
|
$ |
4.9 |
|
$ |
27.1 |
|
| |
|
|
|
|
|
|
|
Fiscal year ended December 26, 2009 |
|
|
|
|
|
|
|
|
|
|
| |
U.S. Federal |
|
$ |
— |
|
$ |
— |
|
$ |
— |
|
| |
Foreign |
|
|
8.7 |
|
|
(1.4 |
) |
|
7.3 |
|
| |
U.S. State |
|
|
— |
|
|
— |
|
|
— |
|
| |
|
|
|
|
|
|
|
| |
Total |
|
$ |
8.7 |
|
$ |
(1.4 |
) |
$ |
7.3 |
|
| |
|
|
|
|
|
|
|
The reconciliation between the Company's effective tax rate on earnings before taxes and the statutory tax rate is as follows for fiscal years 2011, 2010 and
2009:
|
|
|
|
|
|
|
|
|
|
|
|
|
December 31,
2011
|
|
January 1,
2011
|
|
December 26,
2009
|
|
| |
|
Income taxes at Luxembourg rate |
|
|
28.8 |
% |
|
28.6 |
% |
|
28.6 |
% |
Foreign income tax rate differential |
|
|
(23.2 |
) |
|
(1.9 |
) |
|
1.0 |
|
Nondeductible expenses |
|
|
0.4 |
|
|
7.0 |
|
|
1.9 |
|
Change in uncertain tax positions |
|
|
57.8 |
|
|
119.8 |
|
|
(1.7 |
) |
Change in valuation allowance |
|
|
(9.3 |
) |
|
(57.8 |
) |
|
(37.7 |
) |
Rate change |
|
|
(2.3 |
) |
|
0.0 |
|
|
0.0 |
|
| |
|
|
|
|
|
|
|
|
|
|
52.2 |
% |
|
95.7 |
% |
|
(7.9 |
)% |
| |
|
|
|
|
|
|
|
The Company records tax expense and a tax liability on amounts that may be repatriated from its foreign subsidiaries, with the exception of the undistributed
earnings of certain foreign subsidiaries that are intended to be permanently invested. As of December 31, 2011, the undistributed earnings deemed to be permanently invested is
$5.6 million. Tax expense of $0.6 million would be incurred if the earnings were repatriated.
F-46
Table of Contents
ISOLA GROUP S.À R.L. AND SUBSIDIARIES,
A WHOLLY OWNED SUBSIDIARY OF TPG HATTRICK PARTNERS, L.P.
NOTES TO CONSOLIDATED FINANCIAL STATEMENTS (Continued)
As of December 31, 2011 and January 1, 2011, and for the fiscal years ended
December 31, 2011, January 1, 2011 and December 26, 2009
Deferred
tax assets and liabilities as of December 31, 2011 and January 1, 2011 are comprised of the following (in millions):
|
|
|
|
|
|
|
|
|
|
|
|
December 31,
2011
|
|
January 1,
2011
|
|
| |
|
Deferred tax assets: |
|
|
|
|
|
|
|
| |
Accounts receivable |
|
$ |
0.1 |
|
$ |
0.3 |
|
| |
Inventory |
|
|
0.9 |
|
|
1.1 |
|
| |
Property, plant, and equipment |
|
|
6.7 |
|
|
7.2 |
|
| |
Net operating losses |
|
|
89.7 |
|
|
79.3 |
|
| |
Accruals |
|
|
2.6 |
|
|
3.7 |
|
| |
Pensions |
|
|
17.7 |
|
|
10.9 |
|
| |
Derivatives |
|
|
5.9 |
|
|
17.4 |
|
| |
Other |
|
|
6.1 |
|
|
8.5 |
|
| |
|
|
|
|
|
| |
|
Gross deferred tax assets |
|
|
129.7 |
|
|
128.4 |
|
| |
Valuation allowance |
|
|
(107.4 |
) |
|
(104.9 |
) |
| |
|
|
|
|
|
| |
|
Total deferred tax assets |
|
|
22.3 |
|
|
23.5 |
|
| |
|
|
|
|
|
Deferred tax liabilities: |
|
|
|
|
|
|
|
| |
Property, plant, and equipment |
|
|
(4.9 |
) |
|
(5.0 |
) |
| |
Note discount |
|
|
(9.8 |
) |
|
(10.0 |
) |
| |
Intangible assets |
|
|
(0.7 |
) |
|
(0.5 |
) |
| |
Other |
|
|
(0.9 |
) |
|
(3.0 |
) |
| |
|
|
|
|
|
| |
|
Total deferred tax liabilities |
|
|
(16.3 |
) |
|
(18.5 |
) |
| |
|
|
|
|
|
Net deferred tax assets |
|
$ |
6.0 |
|
$ |
5.0 |
|
| |
|
|
|
|
|
As of December 31, 2011, the Company had, for income tax reporting purposes, net operating loss carryforwards of approximately $460.1 million in
various taxing jurisdictions, of which $159.0 million expire in varying amounts between 2013 and 2031.
Internal
Revenue Code Section 382 ("Section 382") imposes limitations on the availability of a company's net operating losses after certain ownership changes occur. The
Section 382 limitation is based upon certain conclusions pertaining to the dates of ownership changes and the value of the
Company on the dates of the ownership changes. It was determined that an ownership change occurred in September 2010. The amount of the Company's net operating losses incurred prior to the ownership
change is limited based on the value of the Company on the ownership change date. Management has determined the amount of net operating losses generated prior to the ownership change available to
offset taxable income subsequent to the ownership change to be nominal. Therefore, the Company has removed federal net operating loss carryforwards of $85.1 million and state net operating loss
carryforwards of $58.6 million generated prior to the ownership change from its deferred tax assets accompanied by a corresponding reduction of the valuation allowance.
The
Company records a valuation allowance on the deferred tax assets to reduce such assets to an amount management believes is more likely than not to be realized. The valuation allowance increased by
F-47
Table of Contents
ISOLA GROUP S.À R.L. AND SUBSIDIARIES,
A WHOLLY OWNED SUBSIDIARY OF TPG HATTRICK PARTNERS, L.P.
NOTES TO CONSOLIDATED FINANCIAL STATEMENTS (Continued)
As of December 31, 2011 and January 1, 2011, and for the fiscal years ended
December 31, 2011, January 1, 2011 and December 26, 2009
$2.5 million
during 2011. The valuation allowance as of December 31, 2011 and January 1, 2011, was principally to offset certain deferred income tax assets related to net
operating loss ("NOL") carryforwards. Net deferred tax assets have been recognized in tax jurisdictions where management believes it is more likely than not that such assets will be
realized.
A
reconciliation of the beginning and ending amount of unrecognized tax benefit is as follows (in millions):
|
|
|
|
|
|
|
|
|
|
December 31,
2011
|
|
January 1,
2011
|
|
| |
|
Beginning unrecognized tax benefit |
|
$ |
51.3 |
|
$ |
19.3 |
|
Gross increase in tax positions in prior period |
|
|
4.9 |
|
|
18.2 |
|
Gross decrease in tax positions in prior period |
|
|
(5.3 |
) |
|
(0.2 |
) |
Gross increase in tax positions in current period |
|
|
25.3 |
|
|
15.1 |
|
Lapse of statute |
|
|
|
|
|
|
|
Settlements |
|
|
(23.5 |
) |
|
(0.3 |
) |
Foreign exchange differences |
|
|
(1.1 |
) |
|
(0.8 |
) |
| |
|
|
|
|
|
Ending unrecognized tax benefit |
|
$ |
51.6 |
|
$ |
51.3 |
|
| |
|
|
|
|
|
Of the total unrecognized tax benefits for the fiscal years ended December 31, 2011 and January 1, 2011, and after consideration of the valuation
allowance recorded against deferred tax assets, $14.3 million and $26.8 million, respectively, represent the amount that, if recognized, would have a favorable effect on the Company's
effective tax rate in any future periods.
In
accordance with its accounting policy, the Company recognizes accrued interest and penalties related to unrecognized tax benefits as a component of income tax expense. The Company recorded
tax-related interest expense (benefit) of $(1.2) million, $0.9 million and $0.1 million for the years ended December 31, 2011, January 1, 2011, and
December 26, 2009, respectively. The Company recorded no tax-related penalties for the years ended December 31, 2011, January 1, 2011 and December 29, 2009. The
total gross amount of accrued interest is $0.7 million and $2.0 million as of December 31, 2011 and January 1, 2011, respectively. The gross amount of accrued penalties is
$0.2 million as of December 31, 2011 and $0.2 million as of January 1, 2011.
The
Company files income tax returns with federal, state, local, and foreign jurisdictions and is subject to reviews and U.S. audits of those returns. The Company recently closed an Internal Revenue
Service ("IRS") examination for the 2008 and 2009 years. The Company is no longer subject to IRS examination for periods prior to 2010, although carryforward attributes that were generated prior to
2010 may still be adjusted upon examination by the IRS if the attributes either have or will be used in a future period. The Company recently closed an examination with the German taxing authorities
for the years 2004 to 2007. With few exceptions, the Company is no longer subject to examination for years prior to 2004. As a result of lapse of statue, it is reasonably possible that the total
amounts of unrecognized benefits as of December 31, 2011 will decrease up to $0.1 million during the next twelve months. The amount of the reduction that would have a favorable impact on
the Company's provision for income taxes is $0.1 million.
F-48
Table of Contents
ISOLA GROUP S.À R.L. AND SUBSIDIARIES,
A WHOLLY OWNED SUBSIDIARY OF TPG HATTRICK PARTNERS, L.P.
NOTES TO CONSOLIDATED FINANCIAL STATEMENTS (Continued)
As of December 31, 2011 and January 1, 2011, and for the fiscal years ended
December 31, 2011, January 1, 2011 and December 26, 2009
13. RELATED-PARTY TRANSACTIONS
On September 30, 2010, a subsidiary of the Company entered into the Financing Transaction (see Notes 4 and 5). The Company received
$376.4 million in aggregate proceeds in connection with the Financing Transaction. A syndicate of lenders who obtained an ownership interest in the sole stockholder of the Company as part of
the Financing Transaction provided $369.4 million of the aggregate proceeds.
Certain
subsidiaries of the Company are party to a management services agreement with a related party to provide continuing business strategy, management consulting, and financial advisory services.
The Company recorded $2.0 million in fees related to this agreement during fiscal year ended December 31, 2011, and $2.1 million during fiscal years ended January 1, 2010,
and December 26, 2009, which is included in selling, general and administrative expenses in the consolidated statements of operations. Amounts payable to the related party totaled
$0.6 million and $1.0 million at December 31, 2011 and January 1, 2011, respectively.
In
conjunction with the purchase of the Company in 2004, an exclusive distributorship right for the United States was granted to a noncontrolling owner of the sole stockholder. Sales to the related
party totaled $26.4 million, $33.8 million and $23.5 million during the fiscal years ended December 31, 2011, January 1, 2011 and December 26, 2009,
respectively. Receivables from the related party totaled $3.8 million and $4.4 million at December 31, 2011 and January 1, 2011, respectively.
14. BUSINESS SEGMENTS AND GEOGRAPHIC INFORMATION
The Company manages the business through three reportable operating segments, which are defined by the geographic regions in which the Company
operates (Americas, Europe, and Asia). Each region has separate management teams and reporting structures and provides similar products to a similar set of customers. Segment information is consistent
with how the chief operating decision maker reviews the business, makes investing and resource allocation decisions and assesses overall operating performance. The Company evaluates performance based
upon several factors, of which the primary financial measure is segment operating income (loss). Segment operating income (loss) does not include certain corporate operating costs such as
administrative, legal, sales and marketing, and research and development costs. The Company believes that information about segment operating income (loss) assists all users of the Company's
consolidated financial statements by allowing them to evaluate changes in the operating results of the Company's portfolio of businesses separate from nonoperational factors that affect net income,
thus providing insight into both operations and the other factors that affect reported results. The accounting policies of the segments are the same as those described in Note 1.
F-49
Table of Contents
ISOLA GROUP S.À R.L. AND SUBSIDIARIES,
A WHOLLY OWNED SUBSIDIARY OF TPG HATTRICK PARTNERS, L.P.
NOTES TO CONSOLIDATED FINANCIAL STATEMENTS (Continued)
As of December 31, 2011 and January 1, 2011, and for the fiscal years ended
December 31, 2011, January 1, 2011 and December 26, 2009
The
following table presents certain results of operations and balance sheet information by identified segments (in thousands):
|
|
|
|
|
|
|
|
|
|
|
|
|
|
|
|
|
|
|
|
Asia
|
|
Europe
|
|
Americas
|
|
Corporate
|
|
Total
|
|
| |
|
Fiscal year ended December 31, 2011 |
|
|
|
|
|
|
|
|
|
|
|
|
|
|
|
|
| |
External revenues |
|
$ |
362,182 |
|
$ |
125,975 |
|
$ |
108,832 |
|
$ |
— |
|
$ |
596,989 |
|
| |
Operating income / (loss) |
|
|
58,506 |
|
|
6,050 |
|
|
13,566 |
|
|
(25,985 |
) |
|
52,137 |
|
| |
Depreciation and amortization |
|
|
6,191 |
|
|
4,775 |
|
|
5,590 |
|
|
704 |
|
|
17,260 |
|
| |
Long-lived assets |
|
|
56,376 |
|
|
42,172 |
|
|
28,316 |
|
|
4,954 |
|
|
131,818 |
|
| |
Segment assets |
|
|
211,518 |
|
|
68,828 |
|
|
63,797 |
|
|
24,031 |
|
|
368,174 |
|
Fiscal year ended January 1, 2011 |
|
|
|
|
|
|
|
|
|
|
|
|
|
|
|
|
| |
External revenues |
|
$ |
349,421 |
|
$ |
133,457 |
|
$ |
129,109 |
|
$ |
— |
|
$ |
611,987 |
|
| |
Operating income / (loss) |
|
|
58,777 |
|
|
3,958 |
|
|
16,900 |
|
|
(14,984 |
) |
|
64,651 |
|
| |
Depreciation and amortization |
|
|
6,603 |
|
|
4,229 |
|
|
5,564 |
|
|
541 |
|
|
16,937 |
|
| |
Long-lived assets |
|
|
57,916 |
|
|
45,258 |
|
|
32,354 |
|
|
4,069 |
|
|
139,597 |
|
| |
Segment assets |
|
|
205,792 |
|
|
73,804 |
|
|
72,580 |
|
|
25,018 |
|
|
377,194 |
|
Fiscal year ended December 26, 2009 |
|
|
|
|
|
|
|
|
|
|
|
|
|
|
|
|
| |
External revenues |
|
$ |
226,588 |
|
$ |
97,336 |
|
$ |
100,275 |
|
$ |
— |
|
$ |
424,199 |
|
| |
Operating income / (loss) |
|
|
21,755 |
|
|
(17,838 |
) |
|
2,561 |
|
|
(17,211 |
) |
|
(10,733 |
) |
| |
Depreciation and amortization |
|
|
7,754 |
|
|
5,803 |
|
|
5,833 |
|
|
447 |
|
|
19,837 |
|
| |
Long-lived assets |
|
|
57,006 |
|
|
49,142 |
|
|
33,291 |
|
|
3,501 |
|
|
142,940 |
|
Corporate expenses reflected in operating income (loss) consist primarily of administrative, legal, sales and marketing, and research and development costs.
During
fiscal years 2011 and 2009, the Company recorded $1.0 million and $4.1 million, respectively, in asset impairments related to the closure of manufacturing facilities in the
Americas and Asia, respectively. No asset impairments were recorded in fiscal year 2010.
One
customer accounted for $83.8 million, $78.0 million and $49.6 million of revenue for the fiscal years ended December 31, 2011, January 1, 2011 and
December 26, 2009, respectively. Sales to that customer in the Asia segment were $72.6 million, $63.8 million and $38.0 million for fiscal years 2011, 2010 and 2009,
respectively. Sales to that customer in the Americas segment were $11.2 million, $14.2 million and $11.6 million for fiscal years 2011, 2010 and 2009, respectively. The Europe
segment did not have any sales to the customer for the periods presented.
Revenue
is attributable to geographic regions and countries based on where the transaction was initiated.
F-50
Table of Contents
ISOLA GROUP S.À R.L. AND SUBSIDIARIES,
A WHOLLY OWNED SUBSIDIARY OF TPG HATTRICK PARTNERS, L.P.
NOTES TO CONSOLIDATED FINANCIAL STATEMENTS (Continued)
As of December 31, 2011 and January 1, 2011, and for the fiscal years ended
December 31, 2011, January 1, 2011 and December 26, 2009
The
following table presents revenues according to the country of origin (in thousands):
|
|
|
|
|
|
|
|
|
|
|
|
|
December 31,
2011
|
|
January 1,
2011
|
|
December 26,
2009
|
|
| |
|
China |
|
$ |
134,089 |
|
$ |
139,119 |
|
$ |
99,693 |
|
Germany |
|
|
121,954 |
|
|
131,509 |
|
|
87,714 |
|
Taiwan |
|
|
109,762 |
|
|
91,265 |
|
|
52,506 |
|
Hong Kong |
|
|
74,917 |
|
|
68,235 |
|
|
34,366 |
|
Other |
|
|
47,435 |
|
|
52,750 |
|
|
49,645 |
|
| |
|
|
|
|
|
|
|
Total foreign countries |
|
|
488,157 |
|
|
482,878 |
|
|
323,924 |
|
United States |
|
|
108,832 |
|
|
129,109 |
|
|
100,275 |
|
| |
|
|
|
|
|
|
|
Totals |
|
$ |
596,989 |
|
$ |
611,987 |
|
$ |
424,199 |
|
| |
|
|
|
|
|
|
|
The following table presents tangible long-lived assets based on the physical location of the asset:
|
|
|
|
|
|
|
|
|
|
|
|
|
Long-lived assets |
|
|
|
December 31,
2011
|
|
January 1,
2011
|
|
December 26,
2009
|
|
| |
|
Taiwan |
|
$ |
26,613 |
|
$ |
25,881 |
|
$ |
24,371 |
|
Germany |
|
|
24,340 |
|
|
26,088 |
|
|
28,144 |
|
China |
|
|
21,792 |
|
|
23,671 |
|
|
24,435 |
|
Italy |
|
|
17,359 |
|
|
18,813 |
|
|
20,743 |
|
Other |
|
|
8,444 |
|
|
12,790 |
|
|
7,259 |
|
| |
|
|
|
|
|
|
|
Total foreign countries |
|
|
98,548 |
|
|
107,243 |
|
|
104,952 |
|
United States |
|
|
33,270 |
|
|
32,354 |
|
|
37,988 |
|
| |
|
|
|
|
|
|
|
Totals |
|
$ |
131,818 |
|
$ |
139,597 |
|
$ |
142,940 |
|
| |
|
|
|
|
|
|
|
15. EARNINGS PER SHARE
Basic earnings per share ("EPS") is computed by dividing net income (loss) by the weighted average number of common shares outstanding during the
period. Diluted EPS is computed on the basis of the weighted average number of shares of common stock plus the effect of dilutive potential common shares outstanding during the period. The shares
underlying the CPCs were not included in the computation of diluted EPS for any periods presented as the shares were considered contingently issuable (see Note 5).
F-51
Table of Contents
ISOLA GROUP S.À R.L. AND SUBSIDIARIES,
A WHOLLY OWNED SUBSIDIARY OF TPG HATTRICK PARTNERS, L.P.
NOTES TO CONSOLIDATED FINANCIAL STATEMENTS (Continued)
As of December 31, 2011 and January 1, 2011, and for the fiscal years ended
December 31, 2011, January 1, 2011 and December 26, 2009
The
following table summarizes the computation of basic and diluted EPS for the fiscal years ended December 31, 2011, January 1, 2011 and December 26, 2009:
|
|
|
|
|
|
|
|
|
|
|
|
|
December 31,
2011
|
|
January 1,
2011
|
|
December 26,
2009
|
|
| |
|
|
|
(In thousands, except for share data)
|
|
Net income / (loss) |
|
$ |
9,973 |
|
$ |
1,217 |
|
$ |
(100,726 |
) |
| |
|
|
|
|
|
|
|
Weighted average common shares outstanding—basic |
|
|
500 |
|
|
500 |
|
|
500 |
|
| |
|
|
|
|
|
|
|
Weighted average number of common and potential common shares outstanding—diluted |
|
|
500 |
|
|
500 |
|
|
500 |
|
| |
|
|
|
|
|
|
|
Basic and diluted net income / (loss) per common share |
|
$ |
19.95 |
|
$ |
2.43 |
|
$ |
(201.45 |
) |
| |
|
|
|
|
|
|
|
Unaudited Pro Forma Net Income / (Loss) Per Share
In connection with the Reorganization, all of the outstanding securities of Isola Group S.à r.l., including the common shares
and convertible preferred certificates, will be contributed by TPG to Isola Group Ltd. As a result, Isola Group Ltd. will become our new holding company and Isola Group
S.à r.l. will become a subsidiary of Isola Group Ltd. The unaudited pro forma basic and diluted net income (loss) per share for the year ended December 31, 2011
reflects the effective conversion of all outstanding common stock and CPCs into ordinary shares of Isola Group Ltd. as though the conversion had occurred as of the beginning of the period or
the original
date of issuance, if later. In addition, the pro forma amounts give effect to the termination of all outstanding stock-based awards associated with TPG and the replacement of such awards with awards
of Isola Group Ltd., with substantially the same terms, as of the beginning of the period. The unaudited pro forma basic and diluted net income (loss) per share has been presented in accordance
with SEC Staff Accounting Bulletin Topic I.B.3. The numerator in the pro forma basic and diluted net income (loss) per share calculation has been adjusted (i) to remove gains and losses
resulting from the change in fair value of the embedded derivative liability related to the CPCs, (ii) to remove accreted interest expense related to the CPCs, and (iii) to remove
foreign exchange gains and losses related to the CPCs and the associated embedded derivative liability.
F-52
Table of Contents
ISOLA GROUP S.À R.L. AND SUBSIDIARIES,
A WHOLLY OWNED SUBSIDIARY OF TPG HATTRICK PARTNERS, L.P.
NOTES TO CONSOLIDATED FINANCIAL STATEMENTS (Continued)
As of December 31, 2011 and January 1, 2011, and for the fiscal years ended
December 31, 2011, January 1, 2011 and December 26, 2009
The
following table summarizes the computation of pro forma basic and diluted EPS for the fiscal year ended December 31, 2011:
|
|
|
|
|
|
|
|
December 31, 2011
|
|
| |
|
|
|
(In thousands, except
for share data)
|
|
Net income / (loss)—basic |
|
|
|
|
Pro forma adjustments |
|
|
|
|
| |
Accreted interest on CPCs and amortization of discount |
|
|
|
|
| |
Embedded derivative gain / (loss)—CPCs |
|
|
|
|
| |
Foreign exchange (gain) loss |
|
|
|
|
Net income / (loss) used to compute pro forma net income / (loss) per share |
|
$ |
|
|
| |
|
|
|
Weighted average ordinary shares outstanding—basic |
|
|
|
|
Pro forma adjustments—basic |
|
|
|
|
| |
Assumed weighted-average effect of conversion of CPCs |
|
|
|
|
| |
|
|
|
Pro forma weighted average ordinary shares outstanding—basic |
|
|
|
|
| |
|
|
|
Pro forma net income / (loss) per ordinary share—basic |
|
$ |
|
|
| |
|
|
|
Pro forma weighted average ordinary shares outstanding—basic |
|
|
|
|
Pro forma adjustments—diluted |
|
|
|
|
| |
Assumed issuance of stock options and restricted units in Isola Group Ltd. |
|
|
|
|
| |
|
|
|
Pro forma weighted average ordinary shares outstanding—diluted |
|
|
|
|
| |
|
|
|
Pro forma net income / (loss) per ordinary share—diluted |
|
$ |
|
|
| |
|
|
|
Pro forma net income / (loss) per share excludes stock-based awards underlying ordinary shares of
Isola Group Ltd. expected to be
outstanding subsequent to the Reorganization because their effect would have been anti-dilutive.
16. RESTRICTED NET ASSETS
As specified in the credit arrangements entered into by the Company and its wholly-owned subsidiary, Isola USA Corp, the Company is required to
maintain certain financial and operating covenants (See Note 4 to the consolidated financial statements). As a result of these covenants, the Company's subsidiaries are restricted in their ability to
provide any dividends, loans or advances to the Parent Company, with the exception of limited circumstances, such as payments of regular management fees and out-of-pocket
expenses, which are not to exceed certain dollar limits, and pursuant to a management services agreement entered into with a related party, as well as certain transactions in the ordinary course of
business and consistent with past practices. As of December 31, 2011, the balance of the Isola USA Corp's restricted net assets amounted to $142.5 million, representing 93.4% of total
consolidated net assets excluding subsidiaries with net liabilities.
In
accordance with the Company Law of the People's Republic of China, the Company's China subsidiaries may be required to appropriate a portion of net income as determined under accounting principles
generally accepted in China ("PRC GAAP") to nondistributable reserves. While the reserves restrict a portion of
F-53
Table of Contents
ISOLA GROUP S.À R.L. AND SUBSIDIARIES,
A WHOLLY OWNED SUBSIDIARY OF TPG HATTRICK PARTNERS, L.P.
NOTES TO CONSOLIDATED FINANCIAL STATEMENTS (Continued)
As of December 31, 2011 and January 1, 2011, and for the fiscal years ended
December 31, 2011, January 1, 2011 and December 26, 2009
retained
earnings from distribution to stockholders, the reserves are not withdrawn from the business and remain available for use in operations. The China subsidiaries are required to appropriate not
less than 10% of their net income determined under PRC GAAP to the reserve. Appropriations to the reserve are limited to 50% of each China subsidiary's registered capital. The total appropriations of
retained earnings to the Company's statutory reserves totaled $1.7 million at December 31, 2011.
In
addition, the Company Law of Taiwan requires the Company to reserve 10% of the current year's profit as a legal reserve, which may not be freely distributed as a dividend. While the reserves
restrict a portion of retained earnings from distribution to stockholders, the reserves are not withdrawn from the business and remain available for use in operations. The total appropriations of
retained earnings to the Company's legal reserve totaled $9.9 million at December 31, 2011.
******
F-54
Table of Contents
ISOLA GROUP S.À R.L. AND SUBSIDIARIES,
A WHOLLY OWNED SUBSIDIARY OF TPG HATTRICK PARTNERS, L.P.
CONSOLIDATED BALANCE SHEETS (UNAUDITED)
As of September 29, 2012 and December 31, 2011
|
|
|
|
|
|
|
|
|
|
|
|
|
|
|
Pro forma
September 29,
2012
|
|
September 29,
2012
|
|
December 31,
2011
|
|
| |
|
|
|
(See Note 1)
|
|
|
|
|
|
|
|
(In thousands, except share data)
|
|
ASSETS |
|
|
|
|
|
|
|
|
|
|
CURRENT ASSETS: |
|
|
|
|
|
|
|
|
|
|
| |
Cash |
|
$ |
|
|
$ |
60,171 |
|
$ |
47,481 |
|
| |
Accounts receivable—net of allowance for doubtful accounts of $1,616 and $1,825 at September 29, 2012 and December 31, 2011,
respectively |
|
|
|
|
|
112,635 |
|
|
108,589 |
|
| |
Other receivables |
|
|
|
|
|
1,922 |
|
|
3,046 |
|
| |
Inventories |
|
|
|
|
|
45,784 |
|
|
36,660 |
|
| |
Deferred tax assets |
|
|
|
|
|
1,948 |
|
|
1,937 |
|
| |
Prepaid expenses and other current assets |
|
|
|
|
|
10,269 |
|
|
9,196 |
|
| |
|
|
|
|
|
|
|
| |
|
Total current assets |
|
|
|
|
|
232,729 |
|
|
206,909 |
|
RESTRICTED CASH |
|
|
|
|
|
1,391 |
|
|
1,544 |
|
PROPERTY, PLANT, AND EQUIPMENT—Net |
|
|
|
|
|
134,117 |
|
|
131,818 |
|
INTANGIBLE ASSETS—Net |
|
|
|
|
|
5,235 |
|
|
6,172 |
|
DEFERRED TAX ASSETS |
|
|
|
|
|
7,547 |
|
|
7,485 |
|
DEBT ISSUANCE COSTS AND OTHER ASSETS |
|
|
|
|
|
11,451 |
|
|
14,246 |
|
| |
|
|
|
|
|
|
|
TOTAL ASSETS |
|
$ |
|
|
$ |
392,470 |
|
$ |
368,174 |
|
| |
|
|
|
|
|
|
|
LIABILITIES AND STOCKHOLDER'S DEFICIENCY |
|
|
|
|
|
|
|
|
|
|
CURRENT LIABILITIES: |
|
|
|
|
|
|
|
|
|
|
| |
Accounts payable |
|
$ |
|
|
$ |
73,396 |
|
$ |
66,631 |
|
| |
Short-term debt and current portion—long-term debt |
|
|
|
|
|
15,100 |
|
|
15,090 |
|
| |
Accrued liabilities |
|
|
|
|
|
55,411 |
|
|
47,583 |
|
| |
Deferred tax liabilities |
|
|
|
|
|
72 |
|
|
72 |
|
| |
Other current liabilities |
|
|
|
|
|
1,291 |
|
|
1,102 |
|
| |
|
|
|
|
|
|
|
| |
|
Total current liabilities |
|
|
|
|
|
145,270 |
|
|
130,478 |
|
LONG-TERM DEBT—Net of current portion |
|
|
|
|
|
338,993 |
|
|
317,368 |
|
CONVERTIBLE PREFERRED CERTIFICATES |
|
|
|
|
|
218,560 |
|
|
208,009 |
|
CAPITAL LEASE OBLIGATIONS—Net of current portion |
|
|
|
|
|
13,461 |
|
|
14,224 |
|
EMBEDDED DERIVATIVES |
|
|
|
|
|
74,666 |
|
|
28,924 |
|
PENSION AND OTHER RETIREMENT BENEFITS |
|
|
|
|
|
52,374 |
|
|
55,477 |
|
UNCERTAIN TAX POSITIONS AND OTHER LIABILITIES |
|
|
|
|
|
14,056 |
|
|
15,121 |
|
DEFERRED TAX LIABILITIES |
|
|
|
|
|
3,349 |
|
|
3,351 |
|
| |
|
|
|
|
|
|
|
| |
|
Total liabilities |
|
|
|
|
|
860,729 |
|
|
772,952 |
|
| |
|
|
|
|
|
|
|
COMMITMENTS AND CONTINGENCIES (Note 8) |
|
|
|
|
|
|
|
|
|
|
STOCKHOLDER'S DEFICIENCY: |
|
|
|
|
|
|
|
|
|
|
| |
Common stock, 25 euro par value ($31)—500 shares authorized, issued, and outstanding |
|
|
|
|
|
15 |
|
|
15 |
|
| |
Additional paid-in capital |
|
|
|
|
|
35,171 |
|
|
33,269 |
|
| |
Accumulated deficit |
|
|
|
|
|
(453,036 |
) |
|
(388,494 |
) |
| |
Accumulated other comprehensive loss |
|
|
|
|
|
(50,409 |
) |
|
(49,568 |
) |
| |
|
|
|
|
|
|
|
| |
|
Total stockholder's deficiency |
|
|
|
|
|
(468,259 |
) |
|
(404,778 |
) |
| |
|
|
|
|
|
|
|
TOTAL LIABILITIES AND STOCKHOLDER'S DEFICIENCY |
|
$ |
|
|
$ |
392,470 |
|
$ |
368,174 |
|
| |
|
|
|
|
|
|
|
See accompanying notes to consolidated financial statements (unaudited).
F-55
Table of Contents
ISOLA GROUP S.À R.L. AND SUBSIDIARIES,
A WHOLLY OWNED SUBSIDIARY OF TPG HATTRICK PARTNERS, L.P.
CONSOLIDATED STATEMENTS OF OPERATIONS (UNAUDITED)
For the nine months ended September 29, 2012 and October 1, 2011
|
|
|
|
|
|
|
|
|
|
|
|
Nine months ended |
|
|
|
September 29, 2012
|
|
October 1, 2011
|
|
| |
|
|
|
(In thousands, except for
share data)
|
|
REVENUES |
|
$ |
437,804 |
|
$ |
459,448 |
|
COST OF GOODS SOLD |
|
|
310,585 |
|
|
350,669 |
|
| |
|
|
|
|
|
GROSS PROFIT |
|
|
127,219 |
|
|
108,779 |
|
| |
|
|
|
|
|
OPERATING EXPENSES |
|
|
|
|
|
|
|
| |
Sales, general, and administrative |
|
|
59,647 |
|
|
57,057 |
|
| |
Research and development |
|
|
9,248 |
|
|
7,913 |
|
| |
Restructuring costs (gain) |
|
|
(76 |
) |
|
462 |
|
| |
|
|
|
|
|
| |
|
Total operating expenses |
|
|
68,819 |
|
|
65,432 |
|
| |
|
|
|
|
|
OPERATING INCOME |
|
|
58,400 |
|
|
43,347 |
|
OTHER INCOME—Net |
|
|
2,382 |
|
|
1,375 |
|
EMBEDDED DERIVATIVE GAIN (LOSS)—Net |
|
|
(45,890 |
) |
|
27,959 |
|
INTEREST EXPENSE |
|
|
(62,840 |
) |
|
(59,544 |
) |
INTEREST INCOME |
|
|
79 |
|
|
138 |
|
FOREIGN EXCHANGE GAIN (LOSS)—Net |
|
|
1,920 |
|
|
(4,132 |
) |
| |
|
|
|
|
|
INCOME (LOSS) BEFORE TAXES |
|
|
(45,949 |
) |
|
9,143 |
|
PROVISION FOR INCOME TAXES |
|
|
(18,593 |
) |
|
(2,075 |
) |
| |
|
|
|
|
|
NET INCOME (LOSS) |
|
$ |
(64,542 |
) |
$ |
7,068 |
|
| |
|
|
|
|
|
NET INCOME (LOSS) PER COMMON SHARE |
|
|
|
|
|
|
|
| |
Basic |
|
$ |
(129.08 |
) |
$ |
14.14 |
|
| |
|
|
|
|
|
| |
Diluted |
|
$ |
(129.08 |
) |
$ |
14.14 |
|
| |
|
|
|
|
|
WEIGHTED AVERAGE NUMBER OF COMMON AND POTENTIAL COMMON SHARES OUTSTANDING |
|
|
|
|
|
|
|
| |
Basic |
|
|
500 |
|
|
500 |
|
| |
|
|
|
|
|
| |
Diluted |
|
|
500 |
|
|
500 |
|
| |
|
|
|
|
|
PRO FORMA NET INCOME (LOSS) PER COMMON SHARE |
|
|
|
|
|
|
|
| |
Basic |
|
$ |
|
|
|
|
|
| |
|
|
|
|
|
|
| |
Diluted |
|
$ |
|
|
|
|
|
| |
|
|
|
|
|
|
WEIGHTED AVERAGE NUMBER OF COMMON AND POTENTIAL COMMON SHARES USED IN COMPUTING PRO FORMA NET INCOME (LOSS) PER SHARE: |
|
|
|
|
|
|
|
| |
Basic |
|
|
|
|
|
|
|
| |
|
|
|
|
|
|
| |
Diluted |
|
|
|
|
|
|
|
| |
|
|
|
|
|
|
See accompanying notes to consolidated financial statements.
F-56
Table of Contents
ISOLA GROUP S.À R.L. AND SUBSIDIARIES,
A WHOLLY OWNED SUBSIDIARY OF TPG HATTRICK PARTNERS, L.P.
CONSOLIDATED STATEMENTS OF COMPREHENSIVE LOSS (UNAUDITED)
For the nine months ended September 29, 2012 and October 1, 2011
|
|
|
|
|
|
|
|
|
|
|
|
Nine months ended |
|
|
|
September 29, 2012
|
|
October 1, 2011
|
|
| |
|
|
|
(In thousands)
|
|
Net income (loss) |
|
$ |
(64,542 |
) |
$ |
7,068 |
|
| |
Other comprehensive (loss): |
|
|
|
|
|
|
|
| |
|
Foreign currency translation adjustment |
|
|
(841 |
) |
|
(695 |
) |
| |
|
|
|
|
|
| |
Total other comprehensive (loss) |
|
|
(841 |
) |
|
(695 |
) |
| |
|
|
|
|
|
Comprehensive income (loss) |
|
$ |
(65,383 |
) |
$ |
6,373 |
|
| |
|
|
|
|
|
See accompanying notes to consolidated financial statements (unaudited).
F-57
Table of Contents
ISOLA GROUP S.À R.L. AND SUBSIDIARIES,
A WHOLLY OWNED SUBSIDIARY OF TPG HATTRICK PARTNERS, L.P.
CONSOLIDATED STATEMENT OF STOCKHOLDER'S DEFICIENCY (UNAUDITED)
For the nine months ended September 29, 2012
|
|
|
|
|
|
|
|
|
|
|
|
|
|
|
|
|
|
|
|
|
Common stock |
|
Additional
paid-in
capital
|
|
|
|
Accumulated
other
comprehensive
loss
|
|
Total
stockholder's
deficiency
|
|
|
|
Accumulated
deficit
|
|
|
|
Shares
|
|
Amount
|
|
| |
|
|
|
(In thousands, except share data)
|
|
BALANCE—December 31, 2011 |
|
500 |
|
$ |
15 |
|
$ |
33,269 |
|
$ |
(388,494 |
) |
$ |
(49,568 |
) |
$ |
(404,778 |
) |
Stock-based compensation |
|
|
|
|
|
|
|
1,902 |
|
|
|
|
|
|
|
|
1,902 |
|
Net (loss) |
|
|
|
|
|
|
|
|
|
|
(64,542 |
) |
|
|
|
|
(64,542 |
) |
Total other comprehensive (loss) |
|
|
|
|
|
|
|
|
|
|
|
|
|
(841 |
) |
|
(841 |
) |
| |
|
|
|
|
|
|
|
|
|
|
|
|
|
BALANCE—September 29, 2012 |
|
500 |
|
$ |
15 |
|
$ |
35,171 |
|
$ |
(453,036 |
) |
$ |
(50,409 |
) |
$ |
(468,259 |
) |
| |
|
|
|
|
|
|
|
|
|
|
|
|
|
See accompanying notes to consolidated financial statements (unaudited).
F-58
Table of Contents
ISOLA GROUP S.À R.L. AND SUBSIDIARIES,
A WHOLLY OWNED SUBSIDIARY OF TPG HATTRICK PARTNERS, L.P.
CONSOLIDATED STATEMENTS OF CASH FLOWS (UNAUDITED)
For the nine months ended September 29, 2012 and October 1, 2011
|
|
|
|
|
|
|
|
|
|
|
|
|
|
Nine months ended |
|
|
|
September 29, 2012
|
|
October 1, 2011
|
|
| |
|
|
|
(In thousands)
|
|
CASH FLOWS FROM OPERATING ACTIVITIES: |
|
|
|
|
|
|
|
| |
Net income (loss) |
|
$ |
(64,542 |
) |
$ |
7,068 |
|
| |
Adjustments to reconcile net income (loss) to cash provided by operating activities: |
|
|
|
|
|
|
|
| |
|
Depreciation and amortization |
|
|
12,297 |
|
|
12,921 |
|
| |
|
Recovery of doubtful accounts |
|
|
(209 |
) |
|
(686 |
) |
| |
|
Change in fair value of derivatives |
|
|
45,829 |
|
|
(27,959 |
) |
| |
|
Foreign currency translation |
|
|
836 |
|
|
2,644 |
|
| |
|
Deferred income taxes |
|
|
— |
|
|
(1,704 |
) |
| |
|
Amortization of debt issuance costs |
|
|
2,313 |
|
|
1,719 |
|
| |
|
Accreted interest on debt and amortization of discount |
|
|
21,583 |
|
|
18,651 |
|
| |
|
Accreted interest on Convertible Preferred Certificates and amortization of discount |
|
|
10,794 |
|
|
11,903 |
|
| |
|
Stock-based compensation expense |
|
|
1,925 |
|
|
1,852 |
|
| |
|
(Gain) loss on dispositions |
|
|
(1,315 |
) |
|
2 |
|
| |
|
Change in operating assets and liabilities: |
|
|
|
|
|
|
|
| |
|
|
Accounts receivable |
|
|
(2,892 |
) |
|
(7,879 |
) |
| |
|
|
Other receivables |
|
|
1,332 |
|
|
(885 |
) |
| |
|
|
Inventories |
|
|
(9,115 |
) |
|
1,754 |
|
| |
|
|
Prepaid expenses and other current assets |
|
|
(2,531 |
) |
|
(1,758 |
) |
| |
|
|
Debt issuance costs and other assets |
|
|
127 |
|
|
1,403 |
|
| |
|
|
Accounts payable |
|
|
5,816 |
|
|
7,958 |
|
| |
|
|
Accrued liabilities |
|
|
7,137 |
|
|
13,525 |
|
| |
|
|
Other current liabilities |
|
|
(7 |
) |
|
(18 |
) |
| |
|
|
Pension and other postretirement employee benefits |
|
|
(3,299 |
) |
|
(2,476 |
) |
| |
|
|
Uncertain tax positions and other liabilities |
|
|
(1,058 |
) |
|
(10,125 |
) |
| |
|
|
|
|
|
| |
|
|
|
Net cash provided by operating activities |
|
|
25,021 |
|
|
27,910 |
|
| |
|
|
|
|
|
CASH FLOWS FROM INVESTING ACTIVITIES: |
|
|
|
|
|
|
|
| |
Decrease in restricted cash—other |
|
|
151 |
|
|
207 |
|
| |
Payments for acquisition of property, plant, and equipment |
|
|
(12,222 |
) |
|
(6,989 |
) |
| |
Proceeds from dispositions |
|
|
2,942 |
|
|
114 |
|
| |
|
|
|
|
|
| |
|
|
|
Net cash used in investing activities |
|
|
(9,129 |
) |
|
(6,668 |
) |
| |
|
|
|
|
|
CASH FLOWS FROM FINANCING ACTIVITIES: |
|
|
|
|
|
|
|
| |
Proceeds from debt |
|
|
9,760 |
|
|
9,803 |
|
| |
Payments of debt |
|
|
(9,768 |
) |
|
(10,834 |
) |
| |
Payments of capital leases |
|
|
(569 |
) |
|
(347 |
) |
| |
|
|
|
|
|
| |
|
|
|
Net cash used in financing activities |
|
|
(577 |
) |
|
(1,378 |
) |
| |
|
|
|
|
|
EFFECT OF EXCHANGE RATES ON CASH |
|
|
(2,625 |
) |
|
277 |
|
| |
|
|
|
|
|
NET INCREASE IN CASH |
|
|
12,690 |
|
|
20,141 |
|
CASH—Beginning of period |
|
|
47,481 |
|
|
36,733 |
|
| |
|
|
|
|
|
CASH—End of period |
|
$ |
60,171 |
|
$ |
56,874 |
|
| |
|
|
|
|
|
SUPPLEMENTAL DISCLOSURE OF CASH FLOW INFORMATION: |
|
|
|
|
|
|
|
| |
Cash payments during the period for: |
|
|
|
|
|
|
|
| |
|
Interest |
|
$ |
28,969 |
|
$ |
27,962 |
|
| |
|
|
|
|
|
| |
|
Income taxes |
|
$ |
11,285 |
|
$ |
5,872 |
|
| |
|
|
|
|
|
SUPPLEMENTAL SCHEDULE OF NONCASH INVESTING AND FINANCING TRANSACTIONS: |
|
|
|
|
|
|
|
Acquisition of fixed assets with a corresponding increase in current liabilities |
|
$ |
1,416 |
|
$ |
1,015 |
|
| |
|
|
|
|
|
Capital lease additions |
|
$ |
19 |
|
|
— |
|
| |
|
|
|
|
|
See accompanying notes to consolidated financial statements (unaudited).
F-59
Table of Contents
ISOLA GROUP S.À R.L. AND SUBSIDIARIES,
A WHOLLY OWNED SUBSIDIARY OF TPG HATTRICK PARTNERS, L.P.
NOTES TO CONSOLIDATED FINANCIAL STATEMENTS (UNAUDITED)
As of September 29, 2012 and for the nine months ended
September 29, 2012 and October 1, 2011
1. ORGANIZATION AND SUMMARY OF SIGNIFICANT ACCOUNTING POLICIES
Nature of business—Isola Group, S.à r.l. is a holding company incorporated in Luxembourg (the "Company" or the "Luxembourg Holding
Company") whose subsidiaries manufacture and sell laminate products across Europe, Asia, and the Americas. The Company's corporate headquarters are located in Chandler, Arizona. The Company is a
wholly owned subsidiary of TPG Hattrick Partners, L.P. ("TPG" or the "sole stockholder").
The Company and certain of its subsidiaries were incorporated by TPG. TPG is a U.S. based limited partnership that was originally funded through the cash investments of two private equity funds
affiliated with TPG Global, LLC and Redfern Partners, which is an affiliate of Insulectro, one of the Company's largest customers (see Note 11).
Reorganization—On September 20, 2011, TPG formed a new company, Isola Group Ltd., in the Cayman Islands. Isola Group Ltd. has been authorized
by its board of directors to file a registration statement with the Securities and Exchange Commission ("SEC") permitting it to sell its ordinary shares in an initial public offering ("IPO").
Prior to the IPO, the Company will undergo a corporate reorganization that will include the following steps:
- –>
- all
of the outstanding securities of the Company, including common shares and convertible preferred certificates ("CPCs"), will be contributed by TPG to Isola
Group Ltd., which will result in Isola Group Ltd. becoming our new holding company and the Luxembourg Holding Company becoming a subsidiary of Isola Group Ltd.;
- –>
- TPG,
and TPG's general partner, TPG Hattrick Holdco, LLC, will be liquidated and the ordinary shares of Isola Group Ltd. will be distributed to the
equity holders of TPG and TPG Hattrick Holdco, LLC; and
- –>
- all
outstanding stock-based awards associated with TPG will be terminated and replaced with new awards for ordinary shares of Isola Group Ltd. that have
substantially the same value and the same terms.
Collectively we refer to the above transactions as the "Reorganization". The pro forma impact of the Reorganization is discussed further in Note 13 to the consolidated financial statements.
Unaudited Pro Forma Balance Sheet—The unaudited pro forma balance sheet gives effect to the Reorganization as if it had occurred on September 29, 2012.
Accordingly, it reflects the conversion of all outstanding common stock and CPCs of the Company into ordinary shares of Isola Group Ltd. Additionally, the unaudited pro forma balance sheet
reflects the elimination of the embedded derivative liability associated with the CPCs. The pro forma earnings per share impact of the Reorganization is discussed further in Note 13 to the
consolidated financial statements.
Basis of Presentation and Consolidation—The consolidated financial statements consist of the accounts of the Company and subsidiaries and reflect the Company's
financial position as of September 29, 2012 and December 31, 2011, and results of operations and cash flows for the nine months ended September 29, 2012 and October 1,
2011. The consolidated financial statements have been prepared in accordance with U.S. generally accepted accounting principles ("U.S. GAAP"). All intercompany balances and transactions have
been eliminated.
F-60
Table of Contents
ISOLA GROUP S.À R.L. AND SUBSIDIARIES,
A WHOLLY OWNED SUBSIDIARY OF TPG HATTRICK PARTNERS, L.P.
NOTES TO CONSOLIDATED FINANCIAL STATEMENTS (UNAUDITED) (Continued)
As of September 29, 2012 and for the nine months ended
September 29, 2012 and October 1, 2011
The Company operates and reports financial results on a fiscal year of 52 or 53 weeks that ends on the Saturday closest to December 31. Both the nine-month periods ended
September 29, 2012 and October 1, 2011 consist of 39 weeks.
These consolidated financial statements are unaudited and should be read in conjunction with the Company's historical annual audited consolidated financial statements and accompanying notes thereto.
In the opinion of management, all adjustments of a normal recurring nature and considered necessary for a fair presentation have been included in the consolidated financial statements.
On April 5, 2012, the Jumpstart Our Business Startups Act ("JOBS Act") was signed into law. The JOBS Act contains provisions that, among other things, relax certain reporting requirements for
qualifying public companies. The Company will qualify as an "emerging growth company" and under the JOBS Act will be allowed to comply with new or revised accounting pronouncements based on the
effective date for private (not publicly traded) companies. We are electing to delay the adoption of new or revised accounting standards, and as a result, we may not comply with new or revised
accounting standards on the relevant dates on which adoption of such standards is required for non-emerging growth companies.
The results of operations for the nine-month period ended September 29, 2012 are not necessarily indicative of the operating results that may be expected for the full fiscal year
ending December 29, 2012 or any future period. The consolidated balance sheet as of December 31, 2011 was derived from the audited consolidated financial statements at that date but does
not include all of the information and footnotes required by U.S. GAAP for complete financial statements.
Events that occurred after September 29, 2012, and through November 13, 2012, the date the consolidated financial statements were available to be issued, were considered in the
preparation of these consolidated financial statements.
Recent Accounting Pronouncements—Changes to generally accepted accounting principles are established by the Financial Accounting Standards Board ("FASB") in the
form of accounting standards updates ("ASU") to the FASB's Accounting Standards Codification.
The Company considers the applicability and impact of all ASUs. ASUs not listed below were assessed and determined to be either not applicable or not expected to have a material impact on the
Company's consolidated financial position or results of operations.
In May 2011, the FASB issued an amendment to the existing guidance on fair value measurements. The new guidance provides a consistent definition of the fair value measurement and ensures disclosure
requirements are similar between U.S. GAAP and International Financial Reporting Standards. The amendments to the guidance change certain fair value measurement principles and enhance
disclosure requirements, particularly for Level 3 fair value measurements. This amendment must be applied prospectively. The Company adopted this amendment effective January 1, 2012. The
adoption of this amendment did not have an impact on the Company's consolidated financial position or results of operations.
In June 2011, the FASB issued an amendment to the existing guidance on the presentation of comprehensive income. Under the amended guidance, entities have the option to present the components of net
income and other comprehensive income in either a single continuous statement of comprehensive income or in two separate but consecutive statements. Entities no longer have the option of presenting
the components of other comprehensive income within the statement of changes in stockholders' equity. The presentation of
F-61
Table of Contents
ISOLA GROUP S.À R.L. AND SUBSIDIARIES,
A WHOLLY OWNED SUBSIDIARY OF TPG HATTRICK PARTNERS, L.P.
NOTES TO CONSOLIDATED FINANCIAL STATEMENTS (UNAUDITED) (Continued)
As of September 29, 2012 and for the nine months ended
September 29, 2012 and October 1, 2011
reclassification adjustments under this amendment has been deferred. The adoption of this amendment resulted in the Company changing its current presentation of comprehensive income so that the
components of net income and other comprehensive income are presented in two separate consecutive statements. The Company retrospectively adopted this amendment effective December 28, 2008. The
adoption of this amendment did not have any impact on the Company's consolidated financial position or results of operations.
Standards Issued but Not Yet Effective—Other new pronouncements issued but not effective until after September 29, 2012 are not expected to have a material
impact on the Company's consolidated financial statements.
2. SELECTED CONSOLIDATED BALANCE SHEET DISCLOSURES
The following tables provide details of selected consolidated balance sheet items as of September 29, 2012 and December 31, 2011 (in
millions):
|
|
|
|
|
|
|
|
|
|
|
|
September 29,
2012
|
|
December 31,
2011
|
|
| |
|
Inventories: |
|
|
|
|
|
|
|
| |
Raw materials |
|
$ |
25.1 |
|
$ |
18.5 |
|
| |
Work in process |
|
|
10.5 |
|
|
7.9 |
|
| |
Finished goods |
|
|
10.2 |
|
|
10.3 |
|
| |
|
|
|
|
|
Total inventories |
|
$ |
45.8 |
|
$ |
36.7 |
|
| |
|
|
|
|
|
Property, plant, and equipment: |
|
|
|
|
|
|
|
| |
Land |
|
$ |
26.2 |
|
$ |
26.4 |
|
| |
Buildings and improvements |
|
|
51.6 |
|
|
49.6 |
|
| |
Machinery and equipment |
|
|
161.9 |
|
|
154.3 |
|
| |
Construction in progress |
|
|
10.6 |
|
|
6.7 |
|
| |
|
|
|
|
|
| |
|
Total property, plant, and equipment |
|
|
250.3 |
|
|
237.0 |
|
| |
Less accumulated depreciation |
|
|
116.2 |
|
|
105.2 |
|
| |
|
|
|
|
|
Total property, plant, and equipment—net |
|
$ |
134.1 |
|
$ |
131.8 |
|
| |
|
|
|
|
|
Accrued liabilities: |
|
|
|
|
|
|
|
| |
Personnel-related |
|
$ |
20.5 |
|
$ |
16.3 |
|
| |
Operating expenses |
|
|
7.8 |
|
|
10.4 |
|
| |
Income tax |
|
|
17.7 |
|
|
11.0 |
|
| |
Other taxes |
|
|
5.2 |
|
|
5.7 |
|
| |
Management fees |
|
|
0.6 |
|
|
0.6 |
|
| |
Interest |
|
|
0.1 |
|
|
0.2 |
|
| |
Other |
|
|
3.5 |
|
|
3.4 |
|
| |
|
|
|
|
|
Total accrued liabilities |
|
$ |
55.4 |
|
$ |
47.6 |
|
| |
|
|
|
|
|
The Company capitalized interest expense incurred during the construction period for capital projects, primarily for new machinery and equipment. Capitalized
interest was $0.7 million and $0.6 million for nine
F-62
Table of Contents
ISOLA GROUP S.À R.L. AND SUBSIDIARIES,
A WHOLLY OWNED SUBSIDIARY OF TPG HATTRICK PARTNERS, L.P.
NOTES TO CONSOLIDATED FINANCIAL STATEMENTS (UNAUDITED) (Continued)
As of September 29, 2012 and for the nine months ended
September 29, 2012 and October 1, 2011
months ended September 29, 2012 and October 1, 2011, respectively. Capitalized interest is included in property, plant, and equipment in the consolidated balance sheets.
Depreciation expense was $11.3 million and $12.0 million for the nine months ended September 29, 2012 and October 1, 2011, respectively.
During the year ended December 31, 2011, the Company transferred $2.3 million in carrying value of assets from property, plant and equipment to assets held for sale. These assets
consisted of land and buildings in Fremont, California and Franklin, New Hampshire. In the second quarter of fiscal 2012, the Company sold the land and building in Fremont, California with a carrying
value of $1.8 million and received net proceeds of $2.0 million, resulting in a gain of $0.2 million. The remaining balance of the assets held for sale ($0.5 million) is
included in prepaid expenses and other current assets in the consolidated balance sheet.
3. INTANGIBLE ASSETS
Intangible assets consist of the following (in millions):
|
|
|
|
|
|
|
|
|
|
|
|
|
|
|
|
|
|
|
|
|
|
September 29, 2012 |
|
December 31, 2011 |
|
|
|
Gross amount
|
|
Accumulated
amortization
|
|
Net
amount
|
|
Gross
amount
|
|
Accumulated
amortization
|
|
Net
amount
|
|
| |
|
Patented Technology |
|
$ |
9.9 |
|
$ |
(6.6 |
) |
$ |
3.3 |
|
$ |
9.9 |
|
$ |
(5.8 |
) |
$ |
4.1 |
|
Customer Relationship |
|
|
6.9 |
|
|
(5.2 |
) |
|
1.7 |
|
|
6.9 |
|
|
(5.0 |
) |
|
1.9 |
|
Trade Name |
|
|
0.9 |
|
|
(0.7 |
) |
|
0.2 |
|
|
0.9 |
|
|
(0.7 |
) |
|
0.2 |
|
| |
|
|
|
|
|
|
|
|
|
|
|
|
|
|
|
$ |
17.7 |
|
$ |
(12.5 |
) |
$ |
5.2 |
|
$ |
17.7 |
|
$ |
(11.5 |
) |
$ |
6.2 |
|
| |
|
|
|
|
|
|
|
|
|
|
|
|
|
Amortization expense attributed to intangible assets was $1.0 million and $0.9 million for the nine months ended September 29, 2012 and
October 1, 2011, respectively. Amortization is included in sales, general, and administrative expense on the consolidated statement of operations. The Company found no indication of impairment
of its intangible assets in either fiscal year 2011 or through the nine months ended September 29, 2012.
F-63
Table of Contents
ISOLA GROUP S.À R.L. AND SUBSIDIARIES,
A WHOLLY OWNED SUBSIDIARY OF TPG HATTRICK PARTNERS, L.P.
NOTES TO CONSOLIDATED FINANCIAL STATEMENTS (UNAUDITED) (Continued)
As of September 29, 2012 and for the nine months ended
September 29, 2012 and October 1, 2011
4. DEBT
Debt as of September 29, 2012 and December 31, 2011 consisted of the following (in millions):
|
|
|
|
|
|
|
|
|
|
|
September 29,
2012
|
|
December 31,
2011
|
|
| |
|
Senior loans payable under senior secured credit agreement—secured, related party—net of unamortized discount of $19.3 million and
$23.0 million |
|
$ |
190.7 |
|
$ |
187.0 |
|
Subordinated loans payable under mezzanine credit agreement—unsecured, related party—net of unamortized discount of $56.8 million and
$62.8 million |
|
|
148.3 |
|
|
130.4 |
|
Other debt—unsecured |
|
|
15.1 |
|
|
15.1 |
|
| |
|
|
|
|
|
| |
Total debt outstanding |
|
|
354.1 |
|
|
332.5 |
|
Current portion of long-term debt |
|
|
(15.1 |
) |
|
(15.1 |
) |
| |
|
|
|
|
|
Total long-term debt |
|
$ |
339.0 |
|
$ |
317.4 |
|
| |
|
|
|
|
|
The Company is required to make debt service payments under the terms of its debt arrangements. Future obligated debt principal payments, which include accreted
paid-in-kind ("PIK") interest as of September 29, 2012, are $15.1 million due within the next 12 months, $210.0 million due in 2015 and
$205.1 million due in 2016, which includes $4.1 million of accrued PIK interest that had not been accreted to the principal balance as of September 29, 2012.
Senior Secured Credit Agreement—The senior secured credit agreement consists of $210.0 million senior loans, the full amount of which was drawn at closing on
September 30, 2010. The senior secured credit agreement is secured by a first priority lien on substantially all of the assets of the Company, including a pledge of all of the equity interests
of each domestic subsidiary and 65% of the equity interests of the first-tier foreign subsidiaries. The Company's other secured and unsecured obligations are subordinated in priority to
payment of loans under the senior secured credit agreement.
The Company makes elections as to the interest period term which can be one, two, three, or six months in length. The Company also makes elections as to the loan type on which the interest is based.
The Company can elect a Eurodollar Loan or an ABR Loan or a combination of the two. Eurodollar Loans accrue interest at a rate of LIBOR (with a minimum base rate of 2.0%) plus 8.0%. Eurodollar loan
interest is payable on the last day of the period term elected, provided, in the case of an interest period longer than three months, payments shall be due no more than three months after the
commencement of the interest period term. ABR Loans accrue interest at a base rate plus 7%. The base rate is defined as the greater of the Prime Rate as identified and published in the Wall Street
Journal or the Federal Funds Effective Rate as published by the Federal Reserve Bank of New York, on the date of election, plus 1/2 of 1%. The base rate is a minimum of 3.0%. ABR loan
interest is payable March 31, June 30, September 30, and December 31 of each year. As of September 29, 2012, the Company had elected Eurodollar loans for the senior
secured credit agreement, which was accruing interest at the rate of 10.0%, which is equal to the minimum LIBOR rate of 2.0% plus 8.0%.
F-64
Table of Contents
ISOLA GROUP S.À R.L. AND SUBSIDIARIES,
A WHOLLY OWNED SUBSIDIARY OF TPG HATTRICK PARTNERS, L.P.
NOTES TO CONSOLIDATED FINANCIAL STATEMENTS (UNAUDITED) (Continued)
As of September 29, 2012 and for the nine months ended
September 29, 2012 and October 1, 2011
The senior secured credit agreement is due in full on September 30, 2015. The Company is obligated to make prepayments against the senior secured credit agreement upon the occurrence of the
following transactions or events as defined in the senior secured credit agreement:
- –>
- 100%
of proceeds from the sale of assets not reinvested in long-term productive assets within one year of the receipt of the sale proceeds, not to exceed
$5.5 million in any fiscal year;
- –>
- 100%
of net insurance/condemnation proceeds in excess of $0.1 million for any casualty event and in excess of $1.0 million for all casualty events in
any fiscal year which are not reinvested in long-term productive assets or used to repair, restore, or replace the assets subject to the applicable casualty event or events within one year
of the receipt of the net proceeds;
- –>
- net
proceeds of equity issuances by Isola Group S.à r.l. in an aggregate amount of 75% of such proceeds, provided that if, as of the last day of the
most recently ended fiscal quarter, the senior secured leverage ratio shall be 2.50:1.00 or less but greater than 2.00:1.00, the amount shall be reduced to an aggregate amount equal to 50% of such
proceeds, and provided that if, as of the last day of the most recently ended fiscal quarter, the senior secured leverage ratio shall be 2.00:1.00 or less, the amount shall be reduced to an aggregate
amount equal to 25% of such proceeds;
- –>
- 100%
of net proceeds from the incurrence of any indebtedness by Isola Group S.à r.l. or its subsidiaries not otherwise permitted by the senior secured
credit agreement; and
- –>
- 75%
of consolidated excess cash flow, provided that if, as of the last day of the most recently ended fiscal year, the senior secured leverage ratio shall be
2.00:1.00 or less, the amount shall be reduced to 50% of consolidated excess cash flow.
The senior secured credit agreement was issued at a discount of $28.5 million on September 30, 2010. As of September 29, 2012 and December 31, 2011, there was
$210.0 million of outstanding principal. The unamortized discount was $19.3 million and $23.0 million as of September 29, 2012 and December 31, 2011, respectively,
resulting in a net balance of $190.7 million and $187.0 million in the consolidated balance sheets as of September 29, 2012 and December 31, 2011, respectively.
Mezzanine Credit Agreement—The mezzanine credit agreement consists of $175.0 million unsecured notes, the full amount of which was drawn at closing on
September 30, 2010. The unsecured term loans issued pursuant to the mezzanine credit agreement are subordinate and junior to the obligations owed under the senior secured credit agreement.
Obligations under the mezzanine credit agreement rank pari passu with the Company's other unsecured and unsubordinated obligations.
The mezzanine credit agreement bears interest at a rate of 16.0% per annum, with half (8.0% per annum) payable in cash on March 31, June 30, September 30, and December 31,
of each year until maturity and half (8.0% per annum) accreting on the outstanding principal amount of the unsecured term loans, due at maturity. The mezzanine credit agreement is due in full on
March 24, 2016. Voluntary early payments are allowed subject to the prior discharge of the senior secured credit agreement (except as otherwise permitted pursuant to the applicable senior
secured credit agreement). The Company is obligated to repay the mezzanine credit agreement in full along with any unpaid interest upon the occurrence of a "Change in Control", as defined by the
mezzanine credit agreement.
The mezzanine credit agreement was issued at a discount of $70.4 million on September 30, 2010. As of September 29, 2012 and December 31, 2011, there was
$201.0 million and $193.2 million of outstanding
F-65
Table of Contents
ISOLA GROUP S.À R.L. AND SUBSIDIARIES,
A WHOLLY OWNED SUBSIDIARY OF TPG HATTRICK PARTNERS, L.P.
NOTES TO CONSOLIDATED FINANCIAL STATEMENTS (UNAUDITED) (Continued)
As of September 29, 2012 and for the nine months ended
September 29, 2012 and October 1, 2011
principal, which consisted of $175.0 million in term loans and $26.0 million and $18.2 million of accreted interest as of September 29, 2012 and December 31, 2011,
respectively. In addition, there was $4.1 million of accrued PIK interest that had not been accreted to the principal balance as of September 29, 2012. The unamortized discount was
$56.8 million and $62.8 million as of September 29, 2012 and December 31, 2011, respectively, resulting in a net balance of $148.3 million and $130.4 million,
respectively, in the consolidated balance sheets.
Embedded Derivative Liability—The senior secured and mezzanine credit agreements contain provisions that require prepayment (payment prior to the stated maturity
date) of principal (which principal is not reduced by unamortized original issue discount), plus accrued and unpaid interest, upon the occurrence of certain events, including a change of control, as
further defined under the senior secured and mezzanine credit agreements. Events that trigger a change of control include, among others, a reduction in the percentage ownership of our common stock
held by our sole shareholder to below 35% or the accumulation of an ownership interest in our common stock above 35% by a third-party, other than our sole shareholder.
In accordance with ASC 815, Derivative Instruments and Hedging Activities ("ASC 815"), the above mandatory prepayment features associated
with a change of control represents an embedded derivative liability, which requires bifurcation from the related debt instruments and separate accounting as the condition requiring mandatory
prepayment, the change of control, is not credit-related. The related embedded derivative liability is recognized at fair value in the consolidated balance sheet at each reporting period. As of
September 29, 2012 and December 31, 2011, the fair value of the embedded derivative liabilities was $1.3 million and $10.8 million, respectively.
Any change in fair value of the embedded derivative liability is reflected in the consolidated statements of operations. For the nine months ended September 29, 2012 and October 1, 2011,
the change in the fair value of the embedded derivative liability related to the credit agreements resulted in income of $9.5 million and expense of $1.5 million, respectively.
Covenants—The Company's senior secured and mezzanine credit agreements require it to maintain certain financial and operating covenants. The financial covenants
include separate ratios measuring both interest and secured debt against EBITDA, as defined in the credit agreements, as well as a limit on capital expenditures. The operating covenants impose
limitations on business decisions,
including, but not limited to, the ability to (i) dispose of assets or stock; (ii) incur additional indebtedness and guarantee obligations; (iii) pay certain dividends;
(iv) create liens on assets; (v) make investments, loans or advances; (vi) restrict distributions to the borrowers or guarantors from its subsidiaries; (vii) engage in
mergers or consolidations; (viii) engage in certain transactions with affiliates; (ix) incur additional negative pledges; (x) incur capital expenditures; (xi) change its
fiscal year or accounting practices or the lines of business in which it and its subsidiaries are involved; (xii) enter into sale-leaseback transactions; (xiii) prepay
principal of, or premium or interest on, or redeem, purchase, retire, defease, or create a sinking fund or make a similar payment with respect to, any subordinated indebtedness and certain other debt;
(xiv) change the conduct of business; (xv) conduct activities of any parent holding company or (xvi) amend its organizational documents. The Company was in compliance with these
covenants as of September 29, 2012.
Debt Issuance Costs and Discounts—Debt issuance costs and discounts are capitalized and amortized over the term of the related debt using the effective interest
method. Upon the extinguishment of the related debt, any unamortized debt issuance costs and discounts are immediately expensed. Unamortized debt issuance costs are included in prepaid and other
current assets and debt issuance costs and other assets in the
F-66
Table of Contents
ISOLA GROUP S.À R.L. AND SUBSIDIARIES,
A WHOLLY OWNED SUBSIDIARY OF TPG HATTRICK PARTNERS, L.P.
NOTES TO CONSOLIDATED FINANCIAL STATEMENTS (UNAUDITED) (Continued)
As of September 29, 2012 and for the nine months ended
September 29, 2012 and October 1, 2011
consolidated balance sheets and totaled $13.7 million and $15.9 million as of September 29, 2012 and December 31, 2011, respectively.
Other Unsecured Debt—The Company has two unsecured loan agreements from lenders in China that provide for a series of draw-downs as funds are required
at the stated rate ranging from 5.6% to 7.1% per annum. Each draw-down has a one year maturity and is renewable on an annual basis. The Company made draws and repayments on these
facilities and had combined outstanding balances of $15.1 million at both September 29, 2012 and December 31, 2011.
Several of the Company's subsidiaries have entered into lines of credit agreements. The lines of credit include capacity for letters of credit up to $4.5 million as of September 29,
2012. There were no balances or letters of credit outstanding under these lines of credit as of September 29, 2012. As of September 29, 2012, the Company's subsidiaries had pledged
$1.1 million as guarantees secured by the lines of credit, leaving $3.4 million remaining available under the lines of credit as of September 29, 2012.
5. CONVERTIBLE PREFERRED CERTIFICATES
The Company has issued and outstanding three different classes of CPCs as of September 29, 2012. The CPCs have characteristics of both debt
and equity, but are considered to be legal form debt instruments in Luxembourg, and thus are accounted for as debt. There were no CPC transactions during the periods ended September 29, 2012 or
December 31, 2011.
F-67
Table of Contents
ISOLA GROUP S.À R.L. AND SUBSIDIARIES,
A WHOLLY OWNED SUBSIDIARY OF TPG HATTRICK PARTNERS, L.P.
NOTES TO CONSOLIDATED FINANCIAL STATEMENTS (UNAUDITED) (Continued)
As of September 29, 2012 and for the nine months ended
September 29, 2012 and October 1, 2011
Convertible Preferred Certificates liability as of September 29, 2012 and December 31, 2011 consisted
of the following (in millions except share data):
|
|
|
|
|
|
|
|
|
|
|
September 29,
2012
|
|
December 31,
2011
|
|
| |
|
Class A CPCs 420,455 issued and outstanding as of September 29, 2012 and December 31, 2011(1) |
|
$ |
0.5 |
|
$ |
0.5 |
|
Class B CPCs 95,788,400 issued and outstanding as of September 29, 2012 and December 31, 2011(2) |
|
|
123.8 |
|
|
124.0 |
|
Class C CPCs 43,500,666 issued and outstanding, net of unamortized discount of $32.7 million as of both September 29, 2012 and
December 31, 2011(3) |
|
|
23.5 |
|
|
23.6 |
|
Accrued interest payable |
|
|
|
|
|
|
|
| |
Class A CPCs |
|
|
0.3 |
|
|
0.2 |
|
| |
Class B CPCs |
|
|
63.0 |
|
|
55.0 |
|
| |
Class C CPCs |
|
|
7.5 |
|
|
4.7 |
|
| |
|
|
|
|
|
Total Convertible Preferred Certificates liability |
|
$ |
218.6 |
|
$ |
208.0 |
|
| |
|
|
|
|
|
- (1)
- Par value €0.4 million
- (2)
- Par value €95.8 million
- (3)
- Par value €43.5 million
The following is a summary of the rights, preferences and terms of the Company's outstanding series of CPCs:
Redemption and Optional Redemption
Class A and Class B CPCs mature on June 2, 2044, and Class C CPCs mature on September 30, 2050. The CPCs are
mandatorily redeemable at these maturity dates at a price equivalent to par plus accrued and unpaid interest (the "Redemption Price"). The Company, within 15 days of a conversion event, as
further discussed below, may elect an earlier redemption of any or all of the CPCs at the greater of the Redemption Price or a formula indexed to the adjusted net asset value of the Company, as
further defined in the CPC agreements (the "Optional Redemption Price"). The Redemption Price of the Class A, B, and C CPCs totaled $251.3 million and $240.7 million as of
September 29, 2012 and December 31, 2011, respectively. The Company may only elect optional redemption to the extent sufficient funds are available subsequent to redemption to satisfy
all of the Company's other obligations, whether senior or pari passu to the CPCs.
Preferred Interest
Class A and Class B CPCs carry a par value of one euro and earn preferred interest based on the six-month EURIBOR plus
4.875% (5.5% and 6.6% as of September 29, 2012 and December 31, 2011, respectively). Class C CPCs carry a par value of one euro and earn preferred interest based on the
six-month EURIBOR plus 5.0% (5.6% and 6.7% as of September 29, 2012 and December 31, 2011, respectively). The preferred interest is payable upon declaration by the Board of
Directors and to the extent the Company possesses
F-68
Table of Contents
ISOLA GROUP S.À R.L. AND SUBSIDIARIES,
A WHOLLY OWNED SUBSIDIARY OF TPG HATTRICK PARTNERS, L.P.
NOTES TO CONSOLIDATED FINANCIAL STATEMENTS (UNAUDITED) (Continued)
As of September 29, 2012 and for the nine months ended
September 29, 2012 and October 1, 2011
sufficient funds. Cumulative preferred interest of $70.8 million and $59.9 million has been recorded within Convertible Preferred Certificates on the consolidated balance sheets as of
September 29, 2012 and December 31, 2011, respectively.
Liquidation
In the event of liquidation, Class A, B, and C CPCs are redeemable at par value plus any accrued but unpaid interest. In liquidation, the CPCs
rank pari passu among each class, rank senior in priority of payment to the Company's common stock and rank subordinate to all other obligations. After the payment of the applicable liquidation
preference to the holders of the CPCs, the residual, if any, will be distributed pro rata among the common stockholders.
Voting and Dividend Rights
The CPCs do not include voting or dividend rights unless converted into common shares.
Contingent Conversion Feature
The CPC agreements provide both the Company and the holders certain rights to convert some or all of the CPCs into the Company's common shares upon
the occurrence of certain events. A conversion event is defined as "after payment of or provision for other obligations, the Issuer has funds resulting, among others, from (i) dividend payments
made by the subsidiaries or (ii) a sale of one of the subsidiaries by the Issuer to an affiliated or nonaffiliated party or (iii) any recapitalization or refinancing of any TPG Isola
group of companies". During a 15-day period subsequent to the occurrence of a conversion event, the Company shall have the right but not the obligation to convert any or all CPCs into
common shares of the Company by requiring the holder to exchange CPCs for shares. Upon expiration of the Company's conversion rights, and for the following 30-day period, each holder shall
have the right (subject to certain limitations) but not the obligation to have any or all of its CPCs converted into common shares of the Company. Any conversions will take place at a price equal to
the conversion price defined in the CPC agreements. The number of common shares into which each CPC is convertible will be determined at the time of conversion as the conversion price is indexed to
the greater of par value plus accrued and unpaid interest or the adjusted net asset value of the Company. Adjusted net asset value is most commonly indexed to the fair value of the Company's net
assets and is therefore determinable upon the occurrence of a conversion event. As of September 29, 2012, based solely upon the par value plus accrued and unpaid interest feature of the
conversion price, the Class A, B, and C CPCs were convertible into 634,108, 144,463,216 and 49,268,082 shares, respectively, of the Company's common stock.
Embedded Derivative Feature
In accordance with ASC 815, Accounting for Derivative Instruments and Hedging Activities, the
conversion features that are included in the CPC agreements and are discussed above are considered an embedded derivative liability. As of September 29, 2012 and December 31, 2011, the
fair value of the embedded derivative liability was determined to be $73.4 million and $18.1 million, respectively, which was bifurcated from the CPCs and recognized at fair value in the
consolidated balance sheets at each reporting period. Any change in the fair value is reflected in the consolidated statements of operations. For the nine months ended September 29, 2012 and
October 1, 2011, the change in fair value of the embedded derivative liability
F-69
Table of Contents
ISOLA GROUP S.À R.L. AND SUBSIDIARIES,
A WHOLLY OWNED SUBSIDIARY OF TPG HATTRICK PARTNERS, L.P.
NOTES TO CONSOLIDATED FINANCIAL STATEMENTS (UNAUDITED) (Continued)
As of September 29, 2012 and for the nine months ended
September 29, 2012 and October 1, 2011
related to the CPCs resulted in expense of $55.4 million and income of $29.5 million, respectively. Management determined the fair value of the embedded derivative liability with the
assistance of a third-party consultant.
6. INTEREST RATE SWAPS
In December 2010, a subsidiary of the Company entered into an interest rate swap with a notional amount of $25.0 million, which expires on
December 31, 2013. The Company did not designate this swap agreement as a hedge and therefore, any change in fair value is recorded in the consolidated statement of operations as interest
expense. The Company pays a fixed rate amount of 2.8% per annum and receives a variable rate based on the greater of 2.0% or the three-month LIBOR. Interest incurred or earned from this agreement is
settled quarterly on the last day of March, June, September, and December and commenced on March 31, 2011. The swap agreement is required under the terms of the Company's senior secured
agreement, which requires that a minimum of 50.0% of the principal of the Company's aggregate indebtedness bears interest at a fixed rate or is protected by an agreement to provide the same effect.
The fair value of this interest rate swap was an immaterial amount at both September 29, 2012 and December 31, 2011. The Company recorded an immaterial amount of interest expense due to
the change in fair value for the nine months ended September 29, 2012 and October 1, 2011.
In May 2007, a subsidiary entered into two interest rate swaps with an initial notional amount of $14.1 million, in order to mitigate the risks associated with fluctuations of the interest rate
on a capital lease contract. The Company did not designate these swap agreements as a hedge and therefore, any changes in fair value are recorded in the consolidated statement of operations as
interest expense. One of the swaps expired in June 2012, had an initial notional amount of $7.1 million and bore an interest rate of the three-month EURIBOR plus 0.52%. The Company paid a
variable rate based on the three-month EURIBOR plus 0.52% with a maximum of 5.02% and received a variable rate based on the three-month EURIBOR. The second swap which has an initial notional amount of
$7.0 million expires in June 2014 and bears a fixed interest rate of 4.65%. The Company pays a fixed rate of 4.65% and receives a variable rate based on the three-month EURIBOR. Settlement
dates occur quarterly on both swaps. The fair value of these interest rate swaps was a liability of $0.5 million as of September 29, 2012 and $0.6 million as of
December 31, 2011. Due to the change in fair value of these interest rate swaps, the Company recorded $0.1 million of interest income for the nine months ended September 29, 2012
and for the nine months ended October 1, 2011.
7. PENSION AND OTHER RETIREMENT BENEFITS
The Company sponsors a number of defined benefit pension plans covering certain U.S. employees as well as certain non-U.S. employees of
certain subsidiaries. A defined benefit plan specifies the amount of benefits a plan participant is to receive. Plans covering U.S. employees provide benefits of stated amounts generally based on
years of service and compensation history. The qualified U.S. plans had been previously frozen and curtailed prior to
the original Isola acquisition in 2004, such that no new participants were admitted into the plans and no additional benefits were accrued for participants already in the plans. Employees do not
contribute to the plans.
In addition, the Company sponsors a Supplemental Employee Retirement Plan ("SERP"), which covers certain officers and highly compensated employees of the Company designated for participation by the
plan document. In order to comply with changes required by Section 409A of the Internal Revenue Code of
F-70
Table of Contents
ISOLA GROUP S.À R.L. AND SUBSIDIARIES,
A WHOLLY OWNED SUBSIDIARY OF TPG HATTRICK PARTNERS, L.P.
NOTES TO CONSOLIDATED FINANCIAL STATEMENTS (UNAUDITED) (Continued)
As of September 29, 2012 and for the nine months ended
September 29, 2012 and October 1, 2011
1986, effective January 1, 2008, the Company amended the SERP to require that retirement benefits be paid in a single lump sum within 30 days following the participant's separation from
service. Benefits for previously terminated employees were paid in January 2009. Also, effective February 1, 2009, participants of the SERP no longer accrue additional benefits. Benefits
accrued through February 1, 2009 were not impacted.
The Company also provides postretirement benefits for certain employees of the Company and its subsidiaries, which include medical and life insurance. For the medical insurance plans, retirees make
contributions to cover a portion of the plan costs. Effective March 1, 2009, the Company amended the medical insurance plan to increase the portion of the premiums paid by the retirees to 100%.
This change took effect during 2009, but was prospectively accounted for during 2008 as a plan amendment. The plan is not eligible for the government subsidy under the Medicare
Prescription Drug, Improvement and Modernization Act of 2003 (the "Act") and the Company does not recognize any reduction in the benefit obligation. The medical insurance
benefits are paid as incurred. For the life insurance plan, retirees do not make contributions. The Company retains the right to change or eliminate these benefits.
The components of net periodic benefit cost for the nine-month periods ended September 29, 2012 and October 1, 2011 are shown in the table below (in millions):
|
|
|
|
|
|
|
|
|
|
|
|
|
|
Pension benefits |
|
|
|
|
|
Other benefits
|
|
|
|
U.S. plans
|
|
Non-U.S. plans
|
|
| |
|
For the nine months ended September 29, 2012: |
|
|
|
|
|
|
|
|
|
|
| |
Service cost |
|
$ |
0.2 |
|
$ |
0.4 |
|
$ |
— |
|
| |
Interest cost |
|
|
3.2 |
|
|
0.6 |
|
|
— |
|
| |
Past service |
|
|
— |
|
|
— |
|
|
(0.3 |
) |
| |
Amortization of net loss |
|
|
1.0 |
|
|
0.2 |
|
|
(0.1 |
) |
| |
Expected return on plan assets |
|
|
(3.2 |
) |
|
(0.3 |
) |
|
— |
|
| |
Settlement / curtailment |
|
|
— |
|
|
(0.1 |
) |
|
— |
|
| |
|
|
|
|
|
|
|
Net periodic cost (benefit) |
|
$ |
1.2 |
|
$ |
0.8 |
|
$ |
(0.4 |
) |
| |
|
|
|
|
|
|
|
For the nine months ended October 1, 2011: |
|
|
|
|
|
|
|
|
|
|
| |
Service cost |
|
$ |
0.2 |
|
$ |
0.5 |
|
$ |
— |
|
| |
Interest cost |
|
|
3.3 |
|
|
0.6 |
|
|
0.1 |
|
| |
Past service |
|
|
— |
|
|
— |
|
|
(0.3 |
) |
| |
Amortization of net loss |
|
|
0.6 |
|
|
0.1 |
|
|
(0.1 |
) |
| |
Expected return on plan assets |
|
|
(2.9 |
) |
|
(0.2 |
) |
|
— |
|
| |
|
|
|
|
|
|
|
Net periodic cost (benefit) |
|
$ |
1.2 |
|
$ |
1.0 |
|
$ |
(0.3 |
) |
| |
|
|
|
|
|
|
|
8. COMMITMENTS AND CONTINGENCIES
Leases—The Company's principal noncancelable, long-term, operating lease obligations are for land, manufacturing equipment, and office and warehouse
space. Rental expense was $2.7 million and $2.5 million for the nine months ended September 29, 2012 and October 1, 2011, respectively.
F-71
Table of Contents
ISOLA GROUP S.À R.L. AND SUBSIDIARIES,
A WHOLLY OWNED SUBSIDIARY OF TPG HATTRICK PARTNERS, L.P.
NOTES TO CONSOLIDATED FINANCIAL STATEMENTS (UNAUDITED) (Continued)
As of September 29, 2012 and for the nine months ended
September 29, 2012 and October 1, 2011
Property, plant, and equipment recorded under capital leases and related accumulated depreciation was $19.4 million and $3.7 million, as of September 29, 2012 and
$19.4 million and $3.2 million, as of December 31, 2011.
The Company recorded $1.7 million of rental income from the sublease of certain office and warehouse space during the nine months ended both September 29, 2012 and October 1,
2011. Rental income was recorded as a reduction of cost of goods sold in the consolidated statements of operations. The sublease is expected to provide approximately $0.5 million in rental
income during the remainder of the fiscal year ending December 29, 2012.
Legal Proceedings—From time to time, the Company is involved in legal proceedings and claims that occur in the normal course of business, which in most cases
involve ordinary and routine claims incidental to our business. Although there can be no assurance, the Company does not believe the results of these proceedings, either individually or in the
aggregate, will have a material effect on its business, results of operations, financial position, or cash flows.
As of the date of these consolidated financial statements, the Company is not a party to any material litigation, other than the matters listed below. The final disposition of these matters and the
impact of such final disposition cannot be determined at this time and as such management is unable to provide a meaningful estimate of the possible outcome or range of outcomes.
On June 25, 2012, Isola USA Corp. ("Isola USA"), a wholly-owned U.S. subsidiary of the Company, filed patent infringement lawsuits against Park Electrochemical Corporation, Nelco
Products, Inc. and Neltec, Inc. (collectively, "Park") and Taiwan Union Technology Corporation ("TUC") in the United States District Court for the District of Arizona. These lawsuits
allege infringement of United States Patent Nos. 6,509,414 (titled "Epoxy Resin, Styrene-Maleic Anhydride Copolymer and Co-Crosslinking Agent") and 7,897,258 (titled "Laminate Made
from Epoxy Resin, Styrene-Maleic Anhydride Copolymer and Crosslinkers") through Park and TUC's importing, selling
and offering for sale its infringing products in the United States. The complaints seek money damages and a permanent injunction against Park and TUC from making, using, importing, offering to sell
and selling the accused products in the United States.
On August 14, 2012, the Isola USA amended its complaints against Park and TUC to include a third patent, United States Patent No. 8,022,140 (titled "Epoxy Resin, Styrene-Maleic Anhydride
Copolymer and Crosslinking Agent"), which the Company alleges is being infringed by Park and TUC.
On August 17, 2012, Isola USA filed an enforcement complaint against TUC with the United States International Trade Commission (USITC). The complaint alleges that TUC has violated a
March 12, 2009 Order ("consent order") entered by the USITC that bars TUC from importing and/or selling for importation any products that infringe certain claims of two Isola patents, United
States Patent No. 6,187,852 (titled "Fillers for Improved Epoxy Laminates") and certain claims of United States Patent No. 6,322,885 (titled "Talc Particles as Fillers for Improved Epoxy
Laminates"), through TUC's importing and selling its laminate and prepreg products in the United States. Specifically, the complaint alleges that TUC has violated the consent order by importing and/or
selling for importation its TU-862 HF and TU-86P HF products. The complaint requests that the USITC institute enforcement proceedings, issue a cease and desist order against
TUC and those acting in concert with TUC from importing and/or selling for importation the infringing products in the United States, and impose sanctions against TUC in an amount of no less than
$100,000 per day for each day the consent order was violated. On October 3, 2012, Isola USA was informed that the
F-72
Table of Contents
ISOLA GROUP S.À R.L. AND SUBSIDIARIES,
A WHOLLY OWNED SUBSIDIARY OF TPG HATTRICK PARTNERS, L.P.
NOTES TO CONSOLIDATED FINANCIAL STATEMENTS (UNAUDITED) (Continued)
As of September 29, 2012 and for the nine months ended
September 29, 2012 and October 1, 2011
USITC has instituted an enforcement proceeding to determine whether TUC is in violation of the previously issued consent order and what, if any, enforcement measures are appropriate.
9. FAIR VALUE MEASUREMENTS
The Company applies fair value accounting for all financial assets and liabilities that are recognized or disclosed at fair value in the financial
statements on a recurring or nonrecurring basis. Fair value is defined as the amount that would be received from selling an asset or the amount that would be paid to settle a liability in an orderly
transaction between willing market participants in the primary or most advantageous market for that asset or liability.
The Company's principal financial instruments are cash, trade receivables, bank lines of credit, short-term bank debt, trade payables and other accrued liabilities which are recorded at
fair value either because of the short maturities of these instruments or because the interest rates are based upon variable reference rates. Financial instruments also include long-term
debt,
including CPCs, and derivative instruments. Our long-term debt and CPCs are recorded at their carrying value. The embedded derivative liabilities are recorded at fair value.
The Company's derivative instruments, which include interest rate swaps and embedded derivative instruments, are disclosed at fair value on a recurring basis. The Company accounts for derivative
instruments in accordance with the provisions of ASC 815, Derivative Instruments and Hedging Activities ("ASC 815"). ASC 815 establishes accounting and
reporting standards for derivative instruments, including certain derivative instruments embedded in other contracts and hedging activities. ASC 815 requires the Company to record derivatives at their
fair value on the balance sheet. As of September 29, 2012 and December 31, 2011, the Company had embedded derivatives in its CPCs (see Note 5) and in its senior secured credit and
mezzanine credit agreements (see Note 4). Changes in the fair value of these embedded derivatives are recorded in the consolidated statements of operations.
Certain nonfinancial assets and liabilities are measured at fair value on a nonrecurring basis, including property, plant, and equipment and intangibles assets. These assets are subject to fair value
adjustments in certain circumstances, such as when there is evidence of impairment.
The Company's long-term debt and CPCs are recorded at their carrying value and the fair value is disclosed below. To calculate the fair value of the CPCs, the Company used a methodology
that is consistent with the methods outlined in the AICPA Practice Aid Valuation of Privately-Held-Company Equity Securities Issued as
Compensation. The enterprise value inputs associated with the Company's valuations were derived using the income and market approaches discussed further below.
The Company allocated the resulting enterprise value less the fair value of the Company's debt among the instruments that comprise the Company's capital structure based upon rights and preferences of
the instruments using the Option-Pricing Method ("OPM"). Under the OPM, the Company allocated the value of the CPCs and common stock of the Company based on a series of call options, representing the
present value of the expected future returns for each instrument. The value of these options was estimated using the Black-Scholes option-pricing model.
The fair value of the Company's debt is computed based upon interest rates of similar debt instruments using the income approach as discussed further below.
F-73
Table of Contents
ISOLA GROUP S.À R.L. AND SUBSIDIARIES,
A WHOLLY OWNED SUBSIDIARY OF TPG HATTRICK PARTNERS, L.P.
NOTES TO CONSOLIDATED FINANCIAL STATEMENTS (UNAUDITED) (Continued)
As of September 29, 2012 and for the nine months ended
September 29, 2012 and October 1, 2011
The carrying amount and the fair value of the Company's long-term debt and CPCs are as follows (in millions):
|
|
|
|
|
|
|
|
|
|
|
September 29,
2012
|
|
December 31,
2011
|
|
| |
|
Long-term debt: |
|
|
|
|
|
|
|
| |
Carrying amount |
|
$ |
339.0 |
|
$ |
317.4 |
|
| |
|
|
|
|
|
| |
Fair value |
|
$ |
388.6 |
|
$ |
349.5 |
|
| |
|
|
|
|
|
Convertible Preferred Certificates: |
|
|
|
|
|
|
|
| |
Carrying amount |
|
$ |
218.6 |
|
$ |
208.0 |
|
| |
|
|
|
|
|
| |
Fair value |
|
$ |
214.7 |
|
$ |
142.5 |
|
| |
|
|
|
|
|
Fair Value Measurements on Recurring Basis
The Company measures the fair value of certain assets and liabilities on a recurring basis based upon a fair value hierarchy in accordance with ASC
820, Fair Value Measurements and Disclosures, as follows:
Level 1—Observable inputs such as quoted prices in active markets;
Level 2—Inputs, other than the quoted prices in active markets, that are observable either directly or indirectly; and
Level 3—Unobservable inputs in which there is little or no market data, which require the Company to develop its own assumptions.
F-74
Table of Contents
ISOLA GROUP S.À R.L. AND SUBSIDIARIES,
A WHOLLY OWNED SUBSIDIARY OF TPG HATTRICK PARTNERS, L.P.
NOTES TO CONSOLIDATED FINANCIAL STATEMENTS (UNAUDITED) (Continued)
As of September 29, 2012 and for the nine months ended
September 29, 2012 and October 1, 2011
Liabilities measured at fair value on a recurring basis include interest rate swaps and embedded derivatives. The following table presents information about the Company's liabilities measured at fair
value on a recurring basis as of September 29, 2012 and December 31, 2011 (in millions):
|
|
|
|
|
|
|
|
|
|
|
|
|
|
|
|
|
|
|
Fair value measurements at reporting date using |
|
|
|
Total
fair
value
|
|
Quoted prices
in active
markets for
identical
assets
(Level 1)
|
|
Significant
other
observable
inputs
(Level 2)
|
|
Significant
unobservable
inputs
(Level 3)
|
|
| |
|
September 29, 2012: |
|
|
|
|
|
|
|
|
|
|
|
|
|
Liabilities: |
|
|
|
|
|
|
|
|
|
|
|
|
|
| |
Interest rate swaps(1) |
|
$ |
0.5 |
|
|
|
|
$ |
0.5 |
|
|
|
|
| |
Embedded derivative liability |
|
$ |
74.7 |
|
|
|
|
|
|
|
$ |
74.7 |
|
December 31, 2011: |
|
|
|
|
|
|
|
|
|
|
|
|
|
Liabilities: |
|
|
|
|
|
|
|
|
|
|
|
|
|
| |
Interest rate swaps(1) |
|
$ |
0.6 |
|
|
|
|
$ |
0.6 |
|
|
|
|
| |
Embedded derivative liability |
|
$ |
28.9 |
|
|
|
|
|
|
|
$ |
28.9 |
|
- (1)
- Included in other liabilities in the consolidated balance sheet.
The Company's interest rate swaps are determined based on market prices for similar instruments in active markets and are classified as Level 2. The
Company's embedded derivative liabilities are measured using Level 3 inputs. Valuations using discounted cash flows are classified within Level 3 as these valuations were determined by
valuation techniques based upon assumed conversion feature activity and discounting those cash flows at a rate reflective of current market conditions and factors specific to the Company.
Changes in Level 3 Fair Value Measurements
The following table presents the changes in Level 3 liabilities measured on a recurring basis for the nine months ended September 29,
2012 and the year ended December 31, 2011 (in millions):
|
|
|
|
|
|
|
|
|
|
|
|
|
Embedded derivative liability |
|
|
|
CPCs
|
|
Debt
|
|
Total
|
|
| |
|
Balance—January 1, 2011 |
|
$ |
60.5 |
|
$ |
9.8 |
|
$ |
70.3 |
|
Net change in fair value included in earnings |
|
|
(43.3 |
) |
|
1.0 |
|
|
(42.3 |
) |
Translation adjustment |
|
|
0.9 |
|
|
— |
|
|
0.9 |
|
| |
|
|
|
|
|
|
|
Balance—December 31, 2011 |
|
|
18.1 |
|
|
10.8 |
|
|
28.9 |
|
Net change in fair value included in earnings |
|
|
55.4 |
|
|
(9.5 |
) |
|
45.9 |
|
Translation adjustment |
|
|
(0.1 |
) |
|
— |
|
|
(0.1 |
) |
| |
|
|
|
|
|
|
|
Balance—September 29, 2012 |
|
$ |
73.4 |
|
$ |
1.3 |
|
$ |
74.7 |
|
| |
|
|
|
|
|
|
|
F-75
Table of Contents
ISOLA GROUP S.À R.L. AND SUBSIDIARIES,
A WHOLLY OWNED SUBSIDIARY OF TPG HATTRICK PARTNERS, L.P.
NOTES TO CONSOLIDATED FINANCIAL STATEMENTS (UNAUDITED) (Continued)
As of September 29, 2012 and for the nine months ended
September 29, 2012 and October 1, 2011
Significant Unobservable Inputs—Convertible Preferred Certificates
As noted above, the embedded derivative liabilities use significant unobservable inputs that are classified as Level 3 inputs per the fair
value hierarchy. Under the Level 3 hierarchy, valuations are based on models where significant inputs reflect assumptions about the inputs that market participants would use. The embedded
derivative liabilities have been disaggregated into two components: CPCs (see Note 5) and long-term debt related to the senior secured and mezzanine credit agreements (see
Note 4).
The fair value ascribed to the embedded derivative liabilities associated with the CPCs depends on the Company's total equity value, which is the total enterprise value ("TEV") less the fair value of
the Company's debt. The TEV is estimated using both income and market approaches. The market approaches utilized are the guideline public company and guideline transaction approach. For the nine
months ended September 29, 2012, the income approach was weighted 50%, the guideline public company approach was weighted 40% and the guideline transactions approach was weighted 10%.
The income approach estimates the TEV by discounting projected cash flows to a net present value using a risk-adjusted discount rate. There are three significant unobservable inputs that
impact the TEV under the income approach: (1) the long-term expected annual growth rate, (2) the weighted average cost of capital ("WACC") and (3) the average
projected EBITDA margin. An increase in each of these unobservable inputs would result in an overall increase, decrease and increase, respectively, in the TEV, holding the other inputs constant. Any
changes in TEV determined by the income approach will depend on our internally projected cash flows and our estimated WACC.
Management prepares long-term financial forecasts needed for the computation of the TEV under the income approach. These financial forecasts take into account the Company's recent
experience, and are based on future expectations for the industry and, more specifically, management's expectations for the Company's revenue, operating income and cash flows. There are inherent
uncertainties in these financial forecasts. In estimating the TEV under the income approach, long-term expected annual revenue growth rates by operating segment are utilized, and from
these revenue projections management develops projections for earnings and cash flows, including average projected EBITDA margin, based on historical relationships between fixed and variable
expenses and anticipated working capital and fixed capital requirements. The assumed long-term expected annual revenue growth rates are based on long-term projections provided
by third party industry consultants, as well as management's assessment of, among other things, the Company's marketing strategies, the anticipated success of new product introductions in expanding
market share in certain key product lines and anticipated declines of certain maturing or declining product lines. These assumed revenue growth rates are inherently subject to uncertainties and cannot
be relied upon as a prediction of future results.
The rate used to discount projected cash flows is the Company's WACC, which is the estimated after-tax weighted average cost of the debt and equity that finances the Company's assets. The
WACC is calculated by taking into account the relative weights of each component of the Company's capital structure (debt and equity) using market inputs.
The market approaches estimate the TEV by comparing the Company's business to similar publicly traded companies or to transactions involving public companies, such as acquisitions or divestures, for
which data are available. There are two significant unobservable inputs that impact the TEV under both the market guideline public company approach and guideline transactions approach: (1) the
last twelve months
F-76
Table of Contents
ISOLA GROUP S.À R.L. AND SUBSIDIARIES,
A WHOLLY OWNED SUBSIDIARY OF TPG HATTRICK PARTNERS, L.P.
NOTES TO CONSOLIDATED FINANCIAL STATEMENTS (UNAUDITED) (Continued)
As of September 29, 2012 and for the nine months ended
September 29, 2012 and October 1, 2011
EBITDA multiple and (2) the last twelve months revenue multiple. An increase in each of these unobservable inputs would result in an overall increase in the TEV holding the other inputs
constant under both approaches.
Management selected valuation multiples from publicly traded companies in the Company's industry that are most comparable to the Company. In estimating the TEV using the market guideline public
company approach, a combination of comparable company multiples were used, including the last twelve months EBITDA and the last twelve months revenue. Valuation multiples derived from the market
approaches are then applied to the equivalent financial metrics of the Company's business, giving consideration to differences between the Company and the comparable public companies for factors such
as company size, liquidity, financial leverage, profitability and growth prospects.
In estimating the TEV using the market guideline transaction approach, management used multiples for the last twelve months EBITDA and the last twelve months revenue of selected companies that were
involved in market transactions over the three year period preceding the valuation date. Management focused on transaction multiples that were relevant given changing market dynamics. Adjustments were
made to the calculated metrics of the subject transactions due to a number of factors which include, but are not limited to, business models, margins, financial structure and liquidity.
When the estimated total equity value (TEV less fair value of debt) increases, the value of the embedded derivative liabilities associated with the CPCs increases and an embedded derivative loss is
recorded. Conversely, when the total equity value decreases, the value of the embedded derivative liabilities decreases and an embedded derivative gain is recorded.
F-77
Table of Contents
ISOLA GROUP S.À R.L. AND SUBSIDIARIES,
A WHOLLY OWNED SUBSIDIARY OF TPG HATTRICK PARTNERS, L.P.
NOTES TO CONSOLIDATED FINANCIAL STATEMENTS (UNAUDITED) (Continued)
As of September 29, 2012 and for the nine months ended
September 29, 2012 and October 1, 2011
The following table summarizes the significant inputs used to value the embedded derivative liability related to CPCs, which are considered to be Level 3 inputs per the fair value hierarchy as
of September 29, 2012 (in millions):
|
|
|
|
|
|
|
|
|
|
|
|
Embedded
Derivative
Liability
associated
with:
|
|
Fair
Value at
September 29,
2012
|
|
Valuation Technique
|
|
Unobservable Input
|
|
Value
|
|
| |
|
CPCs |
|
$ |
73.4 |
|
Income Approach |
|
Long-term Expected Annual Growth Rate |
|
|
4.0 |
% |
|
|
|
|
|
|
|
Discount Rate/Weighted Average Cost of Capital |
|
|
16.8 |
% |
|
|
|
|
|
|
|
Average Projected EBITDA Margin |
|
|
18.8 |
% |
| |
|
|
|
|
|
|
|
|
|
|
|
Market Guideline Public Company |
|
Last Twelve Months EBITDA Multiple |
|
|
7.2 |
x |
|
|
|
|
|
|
|
Last Twelve Months Revenue Multiple |
|
|
1.1 |
x |
| |
|
|
|
|
|
|
|
|
|
|
|
Market Guideline Transaction |
|
Last Twelve Months EBITDA Multiple |
|
|
6.7 |
x |
|
|
|
|
|
|
|
Last Twelve Months Revenue Multiple |
|
|
1.0 |
x |
| |
|
|
|
|
|
|
Significant Unobservable Inputs—Debt
The fair value of the embedded derivative liabilities associated with our senior secured and mezzanine credit agreements is determined using the
income approach. There are three significant unobservable inputs used in the calculation: (1) probability of the occurrence of a change in control event, (2) estimated date of change in
control event and (3) discount rate. An increase in each of these unobservable inputs would result in an overall increase, decrease, and increase, respectively, in fair value of the embedded
derivatives associated with our senior secured and mezzanine credit agreements.
The significant unobservable inputs noted above were determined as follows: (1) probability of a change in control is the likelihood that the Company will go through a change in control event
(e.g., merger, acquisition, etc.), which is based on certain factors such as market conditions or current business opportunities, (2) the estimated date of change in control is derived
by estimating the amount of time it would take to complete a change in control event and (3) the discount rate is derived by taking the implied interest rate based on recent comparable debt
transactions.
F-78
Table of Contents
ISOLA GROUP S.À R.L. AND SUBSIDIARIES,
A WHOLLY OWNED SUBSIDIARY OF TPG HATTRICK PARTNERS, L.P.
NOTES TO CONSOLIDATED FINANCIAL STATEMENTS (UNAUDITED) (Continued)
As of September 29, 2012 and for the nine months ended
September 29, 2012 and October 1, 2011
The following table summarizes the significant inputs used to value the embedded derivative liability related to our senior secured and mezzanine credit agreements, which are considered to be
Level 3 inputs per the fair value hierarchy as of September 29, 2012 (in millions):
|
|
|
|
|
|
|
|
|
|
|
|
Embedded
Derivative
Liability
associated
with:
|
|
Fair
Value at
September 29,
2012
|
|
Valuation Technique
|
|
Unobservable Input
|
|
Value
|
|
| |
|
Debt |
|
$ |
1.3 |
|
Income Approach |
|
Probability of a change in control event |
|
|
5.0 |
% |
|
|
|
|
|
|
|
Discount Rate for Mezzanine Credit Agreement |
|
|
22.0 |
% |
|
|
|
|
|
|
|
Discount Rate for Senior Secured Credit Agreement |
|
|
8.5 |
% |
|
|
|
|
|
|
|
Estimated date of change in control event occurring |
|
|
March 2013 |
|
| |
|
|
|
|
|
|
10. INCOME TAXES
Income tax expense for the nine months ended September 29, 2012 and October 1, 2011 was $18.6 million and $2.1 million,
respectively. The Company's effective annualized tax rate, after consideration of discrete items, for the nine months ended September 29, 2012 and October 1, 2011 was (40.5)% and 22.7%,
respectively. The Company's interim income tax provision is calculated based on an estimated annual effective tax rate applied to pre-tax net income, adjusted for discrete items that
occurred within the period. Discrete items related primarily to settlements with tax authorities and resulted in a reduction to income tax expense of $0.4 million and $13.7 million for
the nine months ended September 29, 2012 and October 1, 2011, respectively.
In accordance with our accounting policy, the Company recognizes accrued interest and penalties related to unrecognized tax benefits as a component of income tax expense. A nominal amount of interest
related to unrecognized tax benefits was recorded to income tax expense for the nine months ended September 29, 2012. The total amount of accrued interest and accrued penalties was
$0.7 million and $0.2 million, respectively, as of both September 29, 2012 and December 31, 2011.
As a result of lapse of statute, it is reasonably possible that the total amounts of unrecognized benefits will decrease by $1.7 million during the next twelve months and would have a favorable
impact on the Company's provision for income taxes.
F-79
Table of Contents
ISOLA GROUP S.À R.L. AND SUBSIDIARIES,
A WHOLLY OWNED SUBSIDIARY OF TPG HATTRICK PARTNERS, L.P.
NOTES TO CONSOLIDATED FINANCIAL STATEMENTS (UNAUDITED) (Continued)
As of September 29, 2012 and for the nine months ended
September 29, 2012 and October 1, 2011
11. RELATED-PARTY TRANSACTIONS
Certain subsidiaries of the Company are party to a management services agreement with a related party to provide continuing business strategy,
management consulting, and financial advisory services. The Company recorded $1.5 million in fees related to this agreement during the nine months ended both September 29, 2012 and
October 1, 2011, which are included in selling, general and administrative expenses in the consolidated statements of operations. Amounts payable to the related party totaled
$0.6 million at both September 29, 2012 and December 31, 2011.
In conjunction with the purchase of the Company in 2004, an exclusive distributorship right for the United States was granted to a noncontrolling owner of the sole stockholder. Sales to the related
party totaled $20.1 million and $20.3 million during the nine months ended September 29, 2012 and October 1, 2011, respectively. Receivables from the related party totaled
$3.6 million and $3.8 million as of September 29, 2012 and December 31, 2011, respectively.
12. BUSINESS SEGMENTS AND GEOGRAPHIC INFORMATION
The Company manages the business through three reportable operating segments, which are defined by the geographic regions in which the Company
operates (Asia, Americas and Europe). Each region has separate management teams and reporting structures and provides similar products to a similar set of customers. Segment information is consistent
with how the chief operating decision maker reviews the business, makes investing and resource allocation decisions and assesses overall operating performance. The Company evaluates performance based
upon several factors, of which the primary financial measure is segment operating income (loss). Segment operating income (loss) does not include certain corporate operating costs, such as
administrative, legal, sales and marketing, and research and development costs. The Company believes that information about segment operating income (loss) assists all users of the Company's
consolidated financial statements by allowing them to evaluate changes in the operating results of the Company's portfolio of businesses separate from nonoperational factors that affect net income,
thus providing insight into both operations and the other factors that affect reported results.
The following table presents certain results of operations information by identified segments (in thousands):
|
|
|
|
|
|
|
|
|
|
|
|
|
|
|
|
|
|
|
|
Asia
|
|
Americas
|
|
Europe
|
|
Corporate
|
|
Total
|
|
| |
|
Nine months ended September 29, 2012 |
|
|
|
|
|
|
|
|
|
|
|
|
|
|
|
|
| |
External revenues |
|
$ |
283,561 |
|
$ |
79,556 |
|
$ |
74,687 |
|
$ |
— |
|
$ |
437,804 |
|
| |
Operating income (loss) |
|
|
61,337 |
|
|
17,206 |
|
|
(232 |
) |
|
(19,911 |
) |
|
58,400 |
|
| |
Depreciation and amortization |
|
|
4,523 |
|
|
3,714 |
|
|
3,386 |
|
|
674 |
|
|
12,297 |
|
Nine months ended October 1, 2011 |
|
|
|
|
|
|
|
|
|
|
|
|
|
|
|
|
| |
External revenues |
|
$ |
271,959 |
|
$ |
83,293 |
|
$ |
104,196 |
|
$ |
— |
|
$ |
459,448 |
|
| |
Operating income (loss) |
|
|
45,580 |
|
|
11,125 |
|
|
7,980 |
|
|
(21,338 |
) |
|
43,347 |
|
| |
Depreciation and amortization |
|
|
4,659 |
|
|
3,576 |
|
|
4,185 |
|
|
501 |
|
|
12,921 |
|
F-80
Table of Contents
ISOLA GROUP S.À R.L. AND SUBSIDIARIES,
A WHOLLY OWNED SUBSIDIARY OF TPG HATTRICK PARTNERS, L.P.
NOTES TO CONSOLIDATED FINANCIAL STATEMENTS (UNAUDITED) (Continued)
As of September 29, 2012 and for the nine months ended
September 29, 2012 and October 1, 2011
The following table presents segments assets by identified segments (in thousands):
|
|
|
|
|
|
|
|
|
|
Segment assets |
|
|
|
September 29,
2012
|
|
October 1,
2011
|
|
| |
|
Asia |
|
$ |
234,138 |
|
$ |
223,199 |
|
Americas |
|
|
61,302 |
|
|
68,566 |
|
Europe |
|
|
74,384 |
|
|
83,469 |
|
Corporate |
|
|
22,646 |
|
|
23,137 |
|
| |
|
|
|
|
|
Totals |
|
$ |
392,470 |
|
$ |
398,371 |
|
| |
|
|
|
|
|
Corporate expenses reflected in operating income (loss) consist primarily of administrative, legal, sales and marketing, and research and development costs.
One customer accounted for $65.3 million and $70.2 million of revenue for the nine months ended September 29, 2012 and October 1, 2011, respectively. Sales to that customer
in the Asia segment were $51.0 million and $54.3 million for the nine months ended September 29, 2012 and October 1, 2011, respectively. Sales to that customer in the
Americas segment were $14.3 million and $15.9 million for the nine months ended September 29, 2012 and October 1, 2011, respectively. The Europe segment did not have any
sales to the customer for the periods presented.
Revenue is attributable to geographic regions and countries based on where the transaction was initiated.
The following table presents revenues according to the country of origin (in thousands):
|
|
|
|
|
|
|
|
|
|
Nine months ended |
|
|
|
September 29,
2012
|
|
October 1,
2011
|
|
| |
|
China |
|
$ |
106,174 |
|
$ |
100,546 |
|
Germany |
|
|
71,245 |
|
|
101,297 |
|
Taiwan |
|
|
84,306 |
|
|
80,618 |
|
Hong Kong |
|
|
65,954 |
|
|
55,951 |
|
Other |
|
|
30,569 |
|
|
37,743 |
|
| |
|
|
|
|
|
Total foreign countries |
|
|
358,248 |
|
|
376,155 |
|
United States |
|
|
79,556 |
|
|
83,293 |
|
| |
|
|
|
|
|
Totals |
|
$ |
437,804 |
|
$ |
459,448 |
|
| |
|
|
|
|
|
F-81
Table of Contents
ISOLA GROUP S.À R.L. AND SUBSIDIARIES,
A WHOLLY OWNED SUBSIDIARY OF TPG HATTRICK PARTNERS, L.P.
NOTES TO CONSOLIDATED FINANCIAL STATEMENTS (UNAUDITED) (Continued)
As of September 29, 2012 and for the nine months ended
September 29, 2012 and October 1, 2011
The following table presents tangible long-lived assets based on the physical location of the asset (in thousands):
|
|
|
|
|
|
|
|
|
|
Long-lived assets |
|
|
|
September 29,
2012
|
|
December 31
2011
|
|
| |
|
Taiwan |
|
$ |
27,322 |
|
$ |
26,613 |
|
Germany |
|
|
23,654 |
|
|
24,340 |
|
China |
|
|
21,826 |
|
|
21,792 |
|
Italy |
|
|
16,730 |
|
|
17,359 |
|
Other |
|
|
9,698 |
|
|
8,444 |
|
| |
|
|
|
|
|
Total foreign countries |
|
|
99,230 |
|
|
98,548 |
|
United States |
|
|
34,887 |
|
|
33,270 |
|
| |
|
|
|
|
|
Totals |
|
$ |
134,117 |
|
$ |
131,818 |
|
| |
|
|
|
|
|
13. EARNINGS PER SHARE
Basic earnings per share ("EPS") is computed by dividing net income (loss) by the weighted average number of common shares outstanding during the
period. Diluted EPS is computed on the basis of the weighted average number of shares of common stock plus the effect of dilutive potential common shares outstanding during the period. The shares
underlying the CPCs were not included in the computation of diluted EPS for any periods presented as the shares were considered contingently issuable (see Note 5).
The following table summarizes the computation of basic and diluted EPS for the nine months ended September 29, 2012 and October 1, 2011:
|
|
|
|
|
|
|
|
|
|
Nine months ended |
|
|
|
September 29,
2012
|
|
October 1,
2011
|
|
| |
|
|
|
(In thousands, except
for share data)
|
|
Net income (loss) |
|
$ |
(64,542 |
) |
$ |
7,068 |
|
| |
|
|
|
|
|
Weighted average common shares outstanding—basic |
|
|
500 |
|
|
500 |
|
| |
|
|
|
|
|
Weighted average number of common and potential common shares outstanding—diluted |
|
|
500 |
|
|
500 |
|
| |
|
|
|
|
|
Basic and diluted net income (loss) per common share |
|
$ |
(129.08 |
) |
$ |
14.14 |
|
| |
|
|
|
|
|
Unaudited Pro Forma Net Income / (Loss) Per Share
In connection with the Reorganization, all of the outstanding securities of Isola Group S.à r.l., including the common shares
and CPCs, will be contributed by TPG to Isola Group Ltd. As a result, Isola Group Ltd. will become our new holding company and Isola Group S.à r.l. will become a
subsidiary of Isola Group Ltd. The
F-82
Table of Contents
ISOLA GROUP S.À R.L. AND SUBSIDIARIES,
A WHOLLY OWNED SUBSIDIARY OF TPG HATTRICK PARTNERS, L.P.
NOTES TO CONSOLIDATED FINANCIAL STATEMENTS (UNAUDITED) (Continued)
As of September 29, 2012 and for the nine months ended
September 29, 2012 and October 1, 2011
unaudited pro forma basic and diluted net income (loss) per share for the nine months ended September 29, 2012 reflects the effective conversion of all outstanding common stock and CPCs into
ordinary shares of Isola Group Ltd. as though the conversion had occurred as of the beginning of the
period or the original date of issuance, if later. In addition, the pro forma amounts give effect to the termination of all outstanding stock-based awards associated with TPG and the replacement of
such awards with awards of Isola Group Ltd., with substantially the same terms, as of the beginning of the period. The unaudited pro forma basic and diluted net income (loss) per share has been
presented in accordance with SEC Staff Accounting Bulletin Topic I.B.3. The numerator in the pro forma basic and diluted net income (loss) per share calculation has been adjusted (i) to
remove gains and losses resulting from the change in fair value of the embedded derivative liability related to the CPCs, (ii) to remove accreted interest expense related to the CPCs, and
(iii) to remove foreign exchange gains and losses related to the CPCs and the associated embedded derivative liability.
The following table summarizes the computation of pro forma basic and diluted EPS for the nine months ended September 29, 2012:
|
|
|
|
|
|
|
|
September 29,
2012
|
|
| |
|
|
|
(In thousands,
except for
share data)
|
|
Net income / (loss)—basic |
|
|
|
|
Pro forma adjustments |
|
|
|
|
| |
Accreted interest on CPCs and amortization of discount |
|
|
|
|
| |
Embedded derivative gain / (loss)—CPCs |
|
|
|
|
| |
Foreign exchange (gain) loss |
|
|
|
|
Net income / (loss) used to compute pro forma net income / (loss) per share |
|
$ |
|
|
| |
|
|
|
Weighted average ordinary shares outstanding—basic |
|
|
|
|
Pro forma adjustments—basic |
|
|
|
|
| |
Assumed weighted-average effect of conversion of CPCs |
|
|
|
|
| |
|
|
|
Pro forma weighted average ordinary shares outstanding—basic |
|
|
|
|
| |
|
|
|
Pro forma net income / (loss) per ordinary share—basic |
|
$ |
|
|
| |
|
|
|
Pro forma weighted average ordinary shares outstanding—basic |
|
|
|
|
Pro forma adjustments—diluted |
|
|
|
|
| |
Assumed issuance of stock options and restricted units in Isola Group Ltd. |
|
|
|
|
| |
|
|
|
Pro forma weighted average ordinary shares outstanding—diluted |
|
|
|
|
| |
|
|
|
Pro forma net income / (loss) per ordinary share—diluted |
|
$ |
|
|
| |
|
|
|
Pro forma net income / (loss) per share excludes stock-based awards underlying ordinary shares of Isola Group Ltd. expected to be
outstanding subsequent to the Reorganization because their effect would have been anti-dilutive.
********
F-83
Table of Contents
ISOLA GROUP LTD.
A WHOLLY OWNED SUBSIDIARY OF TPG HATTRICK PARTNERS, L.P.
REPORT OF INDEPENDENT REGISTERED PUBLIC ACCOUNTING FIRM
To the Board of Directors of
Isola Group Ltd.
Chandler, Arizona
We
have audited the accompanying balance sheet of Isola Group Ltd. (the "Company") as of December 31, 2011. This financial statement is the responsibility of the Company's management.
Our responsibility is to express an opinion on this financial statement based on our audit.
We
conducted our audit in accordance with the standards of the Public Company Accounting Oversight Board (United States). Those standards require that we plan and perform the audit to obtain
reasonable assurance about whether the balance sheet is free of material misstatement. The Company is not required to have, nor were we engaged to perform, an audit of its internal control over
financial reporting. Our audit included consideration of internal control over financial reporting as a basis for designing audit procedures that are appropriate in the circumstances, but not for the
purpose of expressing an opinion on the effectiveness of the Company's internal control over financial reporting. Accordingly, we express no such opinion. An audit also includes examining, on a test
basis, evidence supporting the amounts and disclosures in the balance sheet, assessing the accounting principles used and significant estimates made by management, as well as evaluating the overall
balance sheet presentation. We believe that our audit provides a reasonable basis for our opinion.
In
our opinion, such balance sheet presents fairly, in all material respects, the financial position of the Company as of December 31, 2011, in conformity with accounting principles generally
accepted in the United States of America.
/s/
DELOITTE & TOUCHE LLP
Phoenix, Arizona
March 15, 2012
F-84
Table of Contents
ISOLA GROUP LTD.
A WHOLLY OWNED SUBSIDIARY OF TPG HATTRICK PARTNERS, L.P.
BALANCE SHEET
As of December 31, 2011
|
|
|
|
|
|
|
|
|
December 31,
2011
|
|
| |
|
TOTAL ASSETS |
|
$ |
0 |
|
| |
|
|
|
TOTAL LIABILITIES |
|
|
0 |
|
| |
|
|
|
COMMITMENTS AND CONTINGENCIES |
|
|
|
|
STOCKHOLDER'S EQUITY: |
|
|
|
|
| |
Common stock, $.0001 par value—100,000,000 shares authorized, one share issued and outstanding |
|
|
0 |
|
| |
Preferred stock, $.0001 par value—25,000,000 shares authorized, zero shares issued and outstanding |
|
|
0 |
|
| |
Retained Earnings |
|
|
0 |
|
| |
|
Total stockholder's equity |
|
|
0 |
|
| |
|
|
|
TOTAL LIABILITIES AND STOCKHOLDER'S EQUITY |
|
$ |
0 |
|
| |
|
|
|
See notes to consolidated financial statements.
F-85
Table of Contents
ISOLA GROUP LTD.
A WHOLLY OWNED SUBSIDIARY OF TPG HATTRICK PARTNERS, L.P.
NOTES TO BALANCE SHEET
As of December 31, 2011
1. ORGANIZATION
Isola Group Ltd. (the "Company") was incorporated in the Cayman Islands on September 20, 2011. The Company is a wholly-owned subsidiary
of TPG Hattrick Partners, L.P. ("TPG"). The Company has no operations and has been created for the purpose of effecting a corporate reorganization further described below.
There
has been no activity and, therefore, the statement of operations, the statement of stockholder's equity and the statement of cash flow are not presented.
2. REORGANIZATION MERGER
On September 20, 2011, TPG formed the Company. The Company has been authorized by its board of directors to file a registration statement with
the Securities and Exchange Commission ("SEC") permitting it to sell its ordinary shares in an initial public offering ("IPO"). Prior to the IPO, the Company will undergo a corporate reorganization
that will include the following steps:
- –>
- all
of the outstanding securities of Isola Group S.à r.l. (the "Luxembourg Holding Company"), including common shares and CPCs, will be
contributed by TPG to the Company, which will result in the Luxembourg Holding Company becoming a subsidiary of the Company;
- –>
- TPG,
and TPG's general partner, TPG Hattrick Holdco, LLC, will be liquidated and the ordinary shares of the Company will be distributed to the equity holders
of TPG and TPG Hattrick Holdco, LLC; and
- –>
- all
outstanding stock-based awards associated with TPG will be terminated and replaced with new awards for ordinary shares of the Company that have substantially the
same value and the same terms.
F-86
Table of Contents
ISOLA GROUP LTD.
A WHOLLY OWNED SUBSIDIARY OF TPG HATTRICK PARTNERS, L.P.
BALANCE SHEET
As of September 29, 2012 and December 31, 2011 (UNAUDITED)
|
|
|
|
|
|
|
|
|
|
|
|
September 29,
2012
|
|
December 31,
2011
|
|
| |
|
TOTAL ASSETS |
|
$ |
0 |
|
$ |
0 |
|
| |
|
|
|
|
|
TOTAL LIABILITIES |
|
|
0 |
|
|
0 |
|
| |
|
|
|
|
|
COMMITMENTS AND CONTINGENCIES |
|
|
|
|
|
|
|
STOCKHOLDER'S EQUITY: |
|
|
|
|
|
|
|
| |
Common stock, $.0001 par value—100,000,000 shares authorized, one share issued and outstanding |
|
|
0 |
|
|
0 |
|
| |
Preferred stock, $.0001 par value—25,000,000 shares authorized, zero shares issued and outstanding |
|
|
0 |
|
|
0 |
|
| |
Retained Earnings |
|
|
0 |
|
|
0 |
|
| |
|
Total stockholder's equity |
|
|
0 |
|
|
0 |
|
| |
|
|
|
|
|
TOTAL LIABILITIES AND STOCKHOLDER'S EQUITY |
|
$ |
0 |
|
$ |
0 |
|
| |
|
|
|
|
|
See notes to consolidated financial statements (unaudited).
F-87
Table of Contents
ISOLA GROUP LTD.
A WHOLLY OWNED SUBSIDIARY OF TPG HATTRICK PARTNERS, L.P.
NOTES BALANCE SHEET (UNAUDITED)
As of September 29, 2012
1. ORGANIZATION
Isola Group Ltd. (the "Company") was incorporated in the Cayman Islands on September 20, 2011. The Company is a wholly-owned subsidiary
of TPG Hattrick Partners, L.P. ("TPG"). The Company has no operations and has been created for the purpose of effecting a corporate reorganization further described below.
There
has been no activity and, therefore, the statement of operations, the statement of stockholder's equity and the statement of cash flow are not presented.
2. REORGANIZATION MERGER
On September 20, 2011, TPG formed the Company. The Company has been authorized by its board of directors to file a registration
statement with the Securities and Exchange Commission ("SEC") permitting it to sell its ordinary shares in an initial public offering ("IPO"). Prior to the IPO, the Company will undergo a corporate
reorganization that will include the following steps:
- –>
- all
of the outstanding securities of Isola Group S.à r.l. (the "Luxembourg Holding Company"), including common shares and CPCs, will be
contributed by TPG to the Company, which will result in the Luxembourg Holding Company becoming a subsidiary of the Company;
- –>
- TPG,
and TPG's general partner, TPG Hattrick Holdco, LLC, will be liquidated and the ordinary shares of the Company will be distributed to the equity holders
of TPG and TPG Hattrick Holdco, LLC; and
- –>
- all
outstanding stock-based awards associated with TPG will be terminated and replaced with new awards for ordinary shares of the Company that have substantially the
same value and the same terms.
F-88
Table of Contents
Table of Contents
PART II
INFORMATION NOT REQUIRED IN PROSPECTUS
Item 13. Other Expenses of Issuance and Distribution.
The following table shows the costs and expenses, other than underwriting discounts and commissions, payable in connection with the
sale and distribution of the securities being registered. Except as otherwise noted, we will pay all of these amounts. All amounts except the SEC registration fee and the FINRA fee are estimated. The
missing amounts will be filed by amendment.
|
|
|
|
SEC Registration Fee |
|
$ |
Nasdaq Listing Fee |
|
|
FINRA Fee |
|
|
Accounting Fees and Expenses |
|
|
Legal Fees and Expenses |
|
|
Printing Fees and Expenses |
|
|
Blue Sky Fees and Expenses |
|
|
Miscellaneous |
|
|
| |
Total |
|
$ |
Item 14. Indemnification of Directors and Officers.
A Cayman Islands exempted company is a company incorporated under the laws of the Cayman Islands whose business is conducted mainly
outside the Cayman Islands. As a Cayman Islands exempted company, the laws of the Cayman Islands will be relevant to the provisions relating to indemnification of our directors and officers. Cayman
Islands law does not limit the extent to which a company's articles of association may provide for indemnification of officers and directors, except to the extent any such provision may be held by the
Cayman Islands courts to be contrary to public policy, such as to the provision of indemnification against the consequences of committing a crime or against the indemnified person's own fraud or
dishonesty.
Our
articles of association provide that each of our directors and officers shall be indemnified out of our assets against any liability, action, proceeding, claim, demand, costs,
damages or expenses incurred by him as a result of any act or failure to act in carrying out his functions other than such liability, if any, that he may incur by his own fraud or knowing or reckless
breach of duty. No such director or officer shall be liable to us for any loss or damage in carrying out his functions unless that liability arises through the fraud or knowing or reckless breach of
duty of such director or officer.
We
have also entered into indemnification agreements with our directors and executive officers under which we have agreed to indemnify each such person and hold him harmless against
expenses, judgments, fines and amounts payable under settlement agreements in connection with any threatened, pending or completed action, suit or proceeding to which he has been made a party or in
which he became involved by reason of the fact that he is or was our director or officer. Except with respect to expenses to be reimbursed by us in the event that the indemnified person has been
successful on the merits or otherwise in defense of the action, suit or proceeding, our obligations under the indemnification agreements are subject to certain customary restrictions and exceptions.
The
underwriting agreement (to be filed as Exhibit 1.1 hereto) will provide for indemnification by the underwriters of us and our executive officers and directors, and
indemnification of the underwriters by us, for certain liabilities, including liabilities arising under the Securities Act of 1933, as amended, in connection with matters specifically provided in
writing by the underwriters for inclusion in the registration statement.
II-1
Table of Contents
In
addition, we maintain standard policies of insurance under which coverage is provided to our directors and officers against loss rising from claims made by reason of breach of duty or
other wrongful act, and to us with respect to payments which may be made by us to such directors and officers pursuant to the above indemnification provision or otherwise as a matter of law.
Item 15. Recent Sales of Unregistered Securities.
Isola Group Ltd.
During the three years preceding the filing of this registration statement, Isola Group Ltd., the registrant, has not sold any
of its securities without registration under the Securities Act of 1933, as amended, except as described below:
- •
- On September 20, 2011, Isola Group Ltd. issued one ordinary share to Reid Services Limited at par value in
connection with its incorporation under the laws of the Cayman Islands. The offer, sale and issuance of this security was deemed to be exempt from registration under the Securities Act under
Section 4(2) of the Securities Act as transactions by an issuer not involving any public offering. No underwriters were involved in the foregoing sale of the security. Reid Services Limited
subsequently transferred the one ordinary share held by it to the Sponsor Limited Partnership.
- •
- On January 31, 2012, Isola Group Ltd. issued 9,999 ordinary shares to the Sponsor Limited Partnership at par
value. The offer, sale and issuance of these securities was deemed to be exempt from registration under the Securities Act under Section 4(2) of the Securities Act as transactions by an issuer
not involving any public offering. No underwriters were involved in the foregoing sale of securities.
-
•
- Immediately prior to the completion of this offering and in connection with the corporate reorganization described in
"Summary—Concurrent Transactions—Corporate Reorganization," all of the ordinary shares of Isola Group Ltd. will be contributed to the Sponsors in connection with the
liquidation of the Sponsor Holding Company and Sponsor Limited Partnership. The offer, sale and issuance of these securities will be deemed to be exempt from registration under the Securities Act
under Section 4(2) of the Securities Act as transactions by an issuer not involving any public offering or Section 3(a)(9) of the Securities Act as securities exchanged by the issuer
with its existing security holders exclusively where no commission or other remuneration is paid or given directly or indirectly for soliciting such exchange. No underwriters will be involved in the
foregoing sales of securities.
- •
- Immediately prior to the completion of this offering and in connection with the corporate reorganization described in
"Summary—Concurrent Transactions—Corporate Reorganization," Isola Group Ltd. will grant options to
purchase ordinary shares to certain
shareholders,
directors, employees and former service providers of Isola in exchange for the termination of all outstanding options held by such persons to purchase equity interests in the Sponsor Limited
Partnership and Sponsor Holding Company. The offer, sale and issuance of these securities will be deemed to be exempt from registration under the Securities Act under Section 4(2) of the
Securities Act as transactions by an issuer not involving any public offering, Section 3(a)(9) of the Securities Act as securities exchanged by the issuer with its existing security holders
exclusively where no commission or other remuneration is paid or given directly or indirectly for soliciting such exchange or Rule 701 promulgated under the Securities Act as offers and sale of
securities pursuant to certain compensatory benefit plans and contracts relating to compensation in compliance with Rule 701. No underwriters will be involved in the foregoing sales of
securities.
II-2
Table of Contents
Luxembourg Holding Company
During the three years preceding the filing of this registration statement, the Luxembourg Holding Company, the predecessor of Isola
Group Ltd. and the holding company of Isola immediately prior to the completion of this offering (See "Summary—Concurrent Transactions—Corporate Reorganization") has not
sold its securities without registration under the Securities Act of 1933, as amended, except as described below:
- •
- On September 30, 2010 the Luxembourg Holding Company issued 43,500,666 Class C CPCs with a nominal value of
EUR 1.- per Class C CPC for a total amount of EUR 43,500,666 to the Sponsor Limited Partnership. The offer, sale and issuance of these securities were deemed to be exempt from registration
under the Securities Act under Section 4(2) of the Securities Act as transactions by an issuer not involving any public offering. No underwriters were involved in the foregoing sales of
securities.
Item 16. Exhibits and Consolidated Financial Statement Schedules.
|
|
|
|
| Exhibit No. |
|
Exhibit Description |
| |
1.1 |
** |
Form of Underwriting Agreement among Isola Group Ltd. and the Underwriters. |
|
3.1 |
† |
Memorandum and Articles of Association of Isola Group Ltd. |
|
4.1 |
† |
Form of Shareholders and Registration Rights Agreement by and between Isola Group Ltd. and the shareholders party thereto. |
|
4.2 |
† |
Form of Contribution Agreement by and between Isola Merger Co. and TPG Hattrick Partners, L.P. |
|
4.3 |
† |
Specimen of Ordinary Share certificate. |
|
4.4 |
** |
Form of Indenture by and between Isola USA Corp. and , as trustee, governing Isola USA Corp.'s % senior secured notes due
2019. |
|
5.1 |
* |
Form of Opinion of Appleby (Cayman Islands). |
|
10.1 |
† |
Form of Indemnification Agreement. |
|
10.2 |
† |
Form of Isola Group Ltd. 2012 Equity Incentive Plan. |
|
10.3 |
† |
Form of Share Option Agreement (U.S. Participant). |
|
10.4 |
† |
Form of Share Option Agreement (Non-U.S. Participant). |
|
10.5 |
† |
Form of Restricted Shares Agreement (U.S. Participant). |
|
10.6 |
† |
Amended and Restated Employment Agreement dated as of August 11, 2008 by and between Isola USA Corp. and Raymond P. Sharpe. |
|
10.7 |
† |
Amendment to Amended and Restated Employment Agreement dated as of September 30, 2010 by and between Isola USA Corp. and Raymond P. Sharpe. |
|
10.8 |
† |
Amendment to Amended and Restated Employment Agreement dated December 19, 2011 by and between Isola USA Corp. and Raymond P. Sharpe. |
|
10.9 |
† |
Amendment to Restated Employment Agreement dated April 1, 2012 by and between Isola USA Corp. and Raymond P. Sharpe. |
II-3
Table of Contents
|
|
|
|
| Exhibit No. |
|
Exhibit Description |
| |
10.10 |
† |
Employment Agreement dated as of June 30, 2009 by and between Isola USA Corp. and F. Gordon Bitter. |
|
10.11 |
† |
Amendment to Employment Agreement dated December 16, 2011 by and between Isola USA Corp. and F. Gordon Bitter. |
|
10.12 |
† |
Employment Agreement dated as of April 30, 2007 by and between Isola USA Corp. and Mathew R. LaRont. |
|
10.13 |
† |
Amendment to Employment Agreement dated December 20, 2011 by and between Isola USA Corp. and Mathew R. LaRont. |
|
10.14 |
† |
Restated Employment Agreement dated as of October 1, 2004 by and between Isola USA Corp. and Tarun Amla. |
|
10.15 |
† |
Amendment to Restated Employment Agreement dated December 29, 2011 by and between Isola USA Corp. and Tarun Amla. |
|
10.16 |
† |
Amendment to Restated Employment Agreement dated February 10, 2012 by and between Isola USA Corp. and Tarun Amla. |
|
10.17 |
† |
Employment Agreement dated as of July 21, 2011 by and between Isola USA Corp. and Robert Chaney. |
|
10.18 |
† |
Amendment to Employment Agreement dated December 14, 2011 by and between Isola USA Corp. and Robert Chaney. |
|
10.19 |
† |
Employment Agreement dated as of February 17, 2006 by and between Isola GmbH and Karl Stollenwerk. |
|
10.20 |
†+ |
Credit and Guaranty Agreement dated as of September 30, 2010 by and between Isola USA Corp., Isola Group, Hattrick Lux No. 2 S.à r.l., Hattrick Lux No. 4 S.à r.l., Hattrick
Holdings U.S. Inc, the Lenders party thereto from time to time, and Goldman Sachs Lending Partners LLC, as syndication agent, as administrative agent, as collateral agent and as documentation agent. |
|
10.21 |
† |
Waiver and Amendment No. 1 dated as of May 19, 2011 to the Credit and Guaranty Agreement dated as of September 30, 2010 by and between Isola USA Corp., Isola Group, Hattrick Lux No. 2
S.à r.l., Hattrick Lux No. 4 S.à r.l., Hattrick Holdings U.S. Inc., the Lenders party thereto, and Goldman Sachs Lending Partners LLC, as administrative agent. |
|
10.22 |
† |
Waiver and Amendment No. 2 dated as of June 30, 2011 to the Credit and Guaranty Agreement dated as of September 30, 2010 by and between Isola USA Corp., Isola Group, Hattrick Lux No. 2
S.à r.l., Hattrick Lux No. 4 S.à r.l., Hattrick Holdings U.S. Inc., the Lenders party thereto, and Goldman Sachs Lending Partners LLC, as administrative agent. |
|
10.23 |
† |
Mezzanine Credit and Guaranty Agreement dated as of September 30, 2010 by and between Isola USA Corp., Isola Group, Hattrick Lux No. 2 S.à r.l., Hattrick Lux No. 4 S.à r.l.,
Hattrick Holdings U.S. Inc. and the Lenders party thereto. |
|
10.24 |
† |
Waiver and Amendment No. 1 dated as of May 19, 2011 to the Mezzanine Credit and Guaranty Agreement dated as of September 30, 2010 by and between Isola USA Corp., Isola Group, Hattrick Lux No. 2
S.à r.l., Hattrick Lux No. 4 S.à r.l., Hattrick Holdings U.S. Inc. and the Lenders party thereto. |
II-4
Table of Contents
|
|
|
|
| Exhibit No. |
|
Exhibit Description |
| |
10.25 |
† |
Waiver and Amendment No. 2 dated as of June 24, 2011 to the Mezzanine Credit and Guaranty Agreement dated as of September 30, 2010 by and between Isola USA Corp., Isola Group, Hattrick Lux No. 2
S.à r.l., Hattrick Lux No. 4 S.à r.l., Hattrick Holdings U.S. Inc. and the Lenders party thereto. |
|
10.26 |
† |
Distributor Agreement dated as of June 1, 2004 by and between Insulectro and Isola USA Corp. |
|
10.27 |
† |
Supplemental Retirement Plan dated as of January 1, 2004. |
|
10.28 |
† |
Form of Non-Employee Director Compensation Policy. |
|
10.29 |
†+ |
2012 VICP Participant Letter Agreement dated March 5, 2012 by and between the Company and Raymond P. Sharpe. |
|
10.30 |
†+ |
2012 VICP Participant Letter Agreement dated March 5, 2012 by and between the Company and F. Gordon Bitter. |
|
10.31 |
†+ |
2012 VICP Participant Letter Agreement dated March 5, 2012 by and between the Company and Tarun Amla. |
|
10.32 |
†+ |
2012 VICP Participant Letter Agreement dated March 5, 2012 by and between the Company and Mathew LaRont. |
|
10.33 |
†+ |
2012 VICP Participant Letter Agreement dated March 5, 2012 by and between the Company and Robert Chaney. |
|
10.34 |
†+ |
2012 VICP Participant Letter Agreement dated March 5, 2012 by and between the Company and Karl Stollenwerk. |
|
10.35 |
** |
Form of Credit Agreement by and between Isola USA Corp., UBS AG, Stamford Branch, as administrative agent, and the lenders party thereto. |
|
21 |
† |
Subsidiaries of Isola Group Ltd. |
|
23.1 |
* |
Consent of Appleby (Cayman Islands) (included in Exhibit 5.1). |
|
23.2 |
* |
Consent of Deloitte & Touche LLP. |
|
23.3 |
* |
Consent of Deloitte & Touche LLP. |
|
24.1 |
† |
Powers of Attorney. |
- *
- Filed
herewith.
- **
- To
be filed by amendment.
- †
- Previously
filed.
- +
- Confidential
treatment has been requested as to certain portions, which portions have been omitted and filed separately with the Securities and Exchange
Commission.
II-5
Table of Contents
- (b)
- Financial Statement Schedules
Schedule 1—Financial
Statements of Parent Company as of January 1, 2011 and December 26, 2009
Financial Information of Parent Company
Isola Group S.à r.l.
CONDENSED BALANCE SHEETS
As of December 31, 2011 and January 1, 2011
|
|
|
|
|
|
|
|
|
|
|
|
December 31,
2011 |
|
January 1,
2011 |
|
|
|
(In thousands,
except share amounts)
|
|
ASSETS |
|
|
|
|
|
|
|
CURRENT ASSETS: |
|
|
|
|
|
|
|
| |
Cash |
|
$ |
39 |
|
$ |
6 |
|
| |
Receivables from subsidiaries |
|
|
22 |
|
|
23 |
|
| |
|
|
|
|
|
| |
|
Total current assets |
|
|
61 |
|
|
29 |
|
| |
|
|
|
|
|
TOTAL ASSETS |
|
$ |
61 |
|
$ |
29 |
|
| |
|
|
|
|
|
LIABILITIES AND STOCKHOLDER'S DEFICIENCY |
|
|
|
|
|
|
|
CURRENT LIABILITIES: |
|
|
|
|
|
|
|
| |
Accounts payable |
|
$ |
— |
|
$ |
— |
|
| |
Payables to subsidiaries |
|
|
6 |
|
|
5 |
|
| |
Accrued taxes payable |
|
|
208 |
|
|
359 |
|
| |
|
|
|
|
|
| |
|
Total current liabilities |
|
|
214 |
|
|
364 |
|
OBLIGATION FROM INVESTMENT IN SUBSIDIARY—NET |
|
|
178,561 |
|
|
141,499 |
|
CONVERTIBLE PREFERRED CERTIFICATES |
|
|
208,009 |
|
|
199,136 |
|
EMBEDDED DERIVATIVE |
|
|
18,055 |
|
|
60,459 |
|
| |
|
|
|
|
|
| |
|
Total liabilities |
|
|
404,839 |
|
|
401,458 |
|
STOCKHOLDER'S DEFICIENCY: |
|
|
|
|
|
|
|
| |
Common stock, 25 euro par value ($31)—500 shares authorized, issued, and outstanding |
|
|
15 |
|
|
15 |
|
| |
Additional paid-in capital |
|
|
33,269 |
|
|
30,652 |
|
| |
Accumulated deficit |
|
|
(388,494 |
) |
|
(398,467 |
) |
| |
Accumulated other comprehensive loss |
|
|
(49,568 |
) |
|
(33,629 |
) |
| |
|
|
|
|
|
| |
|
Total stockholder's deficiency |
|
|
(404,778 |
) |
|
(401,429 |
) |
| |
|
|
|
|
|
TOTAL LIABILITIES AND STOCKHOLDER'S DEFICIENCY |
|
$ |
61 |
|
$ |
29 |
|
| |
|
|
|
|
|
See
notes to condensed financial statements.
II-6
Table of Contents
Financial Information of Parent Company
Isola Group S.à r.l.
CONDENSED STATEMENTS OF OPERATIONS
For the fiscal years ended December 31, 2011, January 1, 2011 and December 26, 2009
|
|
|
|
|
|
|
|
|
|
|
|
|
|
|
December 31,
2011 |
|
January 1,
2011 |
|
December 26,
2009 |
|
|
|
(In thousands)
|
|
OPERATING EXPENSES |
|
|
|
|
|
|
|
|
|
|
| |
Sales, general, and administrative |
|
$ |
51 |
|
$ |
165 |
|
$ |
177 |
|
| |
|
|
|
|
|
|
|
| |
|
Total operating expenses |
|
|
51 |
|
|
165 |
|
|
177 |
|
| |
|
|
|
|
|
|
|
OPERATING LOSS |
|
|
(51 |
) |
|
(165 |
) |
|
(177 |
) |
OTHER INCOME—Net |
|
|
436 |
|
|
212 |
|
|
132 |
|
INTEREST EXPENSE |
|
|
(15,845 |
) |
|
(10,631 |
) |
|
(10,454 |
) |
INTEREST INCOME |
|
|
16,141 |
|
|
10,890 |
|
|
11,115 |
|
INCOME / (LOSS) ON EQUITY INVESTMENT IN SUBSIDIARIES |
|
|
9,505 |
|
|
998 |
|
|
(101,245 |
) |
FOREIGN EXCHANGE GAIN / (LOSS)—Net |
|
|
(5 |
) |
|
(2 |
) |
|
1 |
|
| |
|
|
|
|
|
|
|
INCOME / (LOSS) BEFORE TAXES |
|
|
10,181 |
|
|
1,302 |
|
|
(100,628 |
) |
PROVISION FOR INCOME TAXES |
|
|
(208 |
) |
|
(85 |
) |
|
(98 |
) |
| |
|
|
|
|
|
|
|
NET INCOME / (LOSS) |
|
$ |
9,973 |
|
$ |
1,217 |
|
$ |
(100,726 |
) |
| |
|
|
|
|
|
|
|
See
notes to condensed financial statements.
II-7
Table of Contents
Financial Information of Parent Company
Isola Group S.à r.l.
CONDENSED STATEMENTS OF COMPREHENSIVE LOSS
For the fiscal years ended December 31, 2011, January 1, 2011 and December 26, 2009
|
|
|
|
|
|
|
|
|
|
|
|
|
December 31,
2011 |
|
January 1,
2011 |
|
December 26,
2009 |
|
|
|
(In thousands)
|
|
Net income (loss) |
|
$ |
9,973 |
|
$ |
1,217 |
|
$ |
(100,726 |
) |
Total other comprehensive income (loss) |
|
|
(15,939 |
) |
|
(6,780 |
) |
|
3,169 |
|
| |
|
|
|
|
|
|
|
Comprehensive loss |
|
$ |
(5,966 |
) |
$ |
(5,563 |
) |
$ |
(97,557 |
) |
| |
|
|
|
|
|
|
|
See
notes to condensed financial statements.
II-8
Table of Contents
Financial Information of Parent Company
Isola Group S.à r.l.
CONDENSED STATEMENTS OF CASH FLOWS
For the fiscal years ended December 31, 2011, January 1, 2011 and December 26, 2009
|
|
|
|
|
|
|
|
|
|
|
|
|
|
|
|
|
December 31,
2011 |
|
January 1,
2011 |
|
December 26,
2009 |
|
|
|
(In thousands)
|
|
CASH FLOWS FROM OPERATING ACTIVITIES: |
|
|
|
|
|
|
|
|
|
|
| |
Net income / (loss) |
|
$ |
9,973 |
|
$ |
1,217 |
|
$ |
(100,726 |
) |
| |
Adjustments to reconcile net income / (loss) to cash used in operating activities: |
|
|
|
|
|
|
|
|
|
|
| |
|
Equity in net (income) / loss of subsidiaries |
|
|
(9,505 |
) |
|
(998 |
) |
|
101,245 |
|
| |
|
Foreign currency translation |
|
|
12 |
|
|
— |
|
|
— |
|
| |
|
Accreted interest expense on convertible preferred certificates and amortization of discount |
|
|
15,845 |
|
|
10,631 |
|
|
10,454 |
|
| |
|
Accreted interest income on convertible preferred certificates in subsidiary and amortization of discount |
|
|
(16,141 |
) |
|
(10,890 |
) |
|
(11,115 |
) |
| |
|
Change in operating assets and liabilities: |
|
|
|
|
|
|
|
|
|
|
| |
|
|
Receivables from subsidiaries |
|
|
1 |
|
|
2 |
|
|
(1 |
) |
| |
|
|
Account payable |
|
|
— |
|
|
(44 |
) |
|
(7 |
) |
| |
|
|
Accrued taxes payable |
|
|
(152 |
) |
|
85 |
|
|
98 |
|
| |
|
|
|
|
|
|
|
| |
|
|
|
Net cash used in operating activities |
|
|
33 |
|
|
3 |
|
|
(52 |
) |
CASH FLOWS FROM INVESTING ACTIVITIES |
|
|
|
|
|
|
|
|
|
|
| |
Investment in subsidiary |
|
|
— |
|
|
(57,707 |
) |
|
— |
|
| |
|
|
|
|
|
|
|
| |
|
|
|
Net cash used in investing activities |
|
|
— |
|
|
(57,707 |
) |
|
— |
|
CASH FLOWS FROM FINANCING ACTIVITIES |
|
|
|
|
|
|
|
|
|
|
| |
Proceeds from financing transactions |
|
|
— |
|
|
57,130 |
|
|
— |
|
| |
Proceeds of capital contributions |
|
|
— |
|
|
577 |
|
|
— |
|
| |
|
|
|
|
|
|
|
| |
|
|
|
Net cash provided by / (used in) financing activities |
|
|
— |
|
|
57,707 |
|
|
— |
|
| |
|
|
|
|
|
|
|
CASH—Beginning of year |
|
|
6 |
|
|
3 |
|
|
55 |
|
| |
|
|
|
|
|
|
|
CASH—End of year |
|
$ |
39 |
|
$ |
6 |
|
$ |
3 |
|
| |
|
|
|
|
|
|
|
See
notes to condensed financial statements.
II-9
Table of Contents
Financial Information of Parent Company
Isola Group S.à r.l.
NOTES TO CONDENSED FINANCIAL STATEMENTS
As of December 31, 2011 and January 1, 2011, and for the fiscal years ended
December 31, 2011, January 1, 2011 and December 26, 2009
1. BASIS OF PRESENTATION
Isola Group S.à r.l. (the "Parent Company") is a holding company incorporated in Luxembourg whose subsidiaries
manufacture and sell laminate products across Europe, Asia, and the Americas. Substantially all of its business operations are conducted through its subsidiaries. We refer to the Parent Company and
its subsidiaries collectively as the Company.
The
accompanying condensed financial statements of the Parent Company have been prepared in accordance with Rule 12-04, Schedule I of
Regulation S-X, as the restricted net assets of the Parent Company's subsidiaries exceed 25% of the consolidated net assets of the Company. Accordingly, these statements have been
prepared on a "parent-only" basis.
Under
presentation on a parent-only basis, the Parent Company's investment in its consolidated subsidiaries is presented using the equity method of accounting.
In
June 2011, the FASB issued an amendment to the existing guidance on the presentation of comprehensive income. Under the amended guidance, entities have the option to present the
components of net income and other comprehensive income in either a single continuous statement of comprehensive income or in two separate but consecutive statements. Entities no longer have the
option of presenting the components of other comprehensive income within the statement of changes in stockholders' equity. This amendment is effective on a retrospective basis for interim and annual
periods beginning after December 15, 2011; however, presentation of reclassification adjustments has been deferred. The Company retrospectively adopted this amendment effective
December 28, 2008. The adoption of this amendment resulted in the Company changing its current presentation of comprehensive income so that the components of net income and other comprehensive
income are presented in two separate consecutive statements. The adoption of this amendment did not have any impact on the Company's consolidated financial position or results of operations.
Certain
information and footnote disclosures normally included in financial statements prepared in accordance with U.S. GAAP have been condensed or omitted. As such, these
parent-only statements should be read in conjunction with the notes to the consolidated financial statements of the Company included elsewhere herein.
2. CONVERTIBLE PREFERRED CERTIFICATES
Convertible Preferred Certificates ("CPCs") were issued to the sole shareholder of the Parent Company. In conjunction with each
issuance of CPCs to the sole shareholder, the Parent Company was issued CPCs from its subsidiary with the equivalent terms, interest rates, conditions and amounts, with the exception of the original
issuance of Class A and Class B CPCs. A CPC liability and embedded derivative liability with an offsetting CPC asset and embedded derivative asset were recorded with the issuance of the
II-10
Table of Contents
Class C
CPCs. See Note 5 to the consolidated financial statements. The following table presents the carrying value of the CPCs at December 31, 2011 and January 1, 2011:
|
|
|
|
|
|
|
|
|
|
|
December 31,
2011 |
|
January 1,
2011 |
|
Issued and outstanding Class A CPCs(1) |
|
$ |
0.5 |
|
$ |
0.6 |
|
Issued and outstanding Class B CPCs(2) |
|
|
124.0 |
|
|
127.7 |
|
Issued and outstanding Class C CPCs(3), net of unamortized discount of $32.7 million and $33.8 million as of December 31,
2011 and January 1, 2011 |
|
|
23.6 |
|
|
24.3 |
|
Accrued interest payable |
|
|
|
|
|
|
|
| |
Class A CPCs |
|
|
0.2 |
|
|
0.2 |
|
| |
Class B CPCs |
|
|
55.0 |
|
|
45.4 |
|
| |
Class C CPCs |
|
|
4.7 |
|
|
0.9 |
|
| |
|
|
|
|
|
Total Convertible Preferred Certificates liability |
|
$ |
208.0 |
|
$ |
199.1 |
|
| |
|
|
|
|
|
- (1)
- Par value €0.4 million
- (2)
- Par value €95.8 million
- (3)
- Par value €43.5 million
The
investment in CPCs is included in the Obligation from Investment in Subsidiary—net on the consolidated balance sheet as there is a right of offset. Due to
the offsetting effect of the embedded derivative asset and liability, the change in the fair value of the derivative is zero and not presented on the statement of operations.
3. COMMITMENTS AND CONTINGENCIES
Obligation from investment in subsidiary—The carrying value of an investment in one of the Company's subsidiaries reflects a negative balance as a
result of the recognition of cumulative reported losses. As the Company has the intention to fund current and any future losses, the Company continues to apply the equity method of accounting for the
investment in the subsidiary.
The
Parent Company's subsidiary, Isola USA Corp., entered into a series of financing transactions on September 30, 2010, including a senior secured credit agreement and a
mezzanine credit agreement, with a syndicate of lenders, the majority of which are partial owners in an entity that is the Parent Company's sole stockholder (collectively "the Credit Agreements"). The
Parent Company guarantees the obligations of the borrower, Isola USA Corp., under the Credit Agreements. As of December 31, 2011, there was $210.0 million of outstanding principal
related to the senior secured credit agreement. As of December 31, 2011, there was $193.2 million of outstanding principal, which consisted of $175.0 million in term loans and
$18.2 million of accreted interest related to the mezzanine credit agreement. Additionally, see Note 8 of the Company's consolidated financial statements for a discussion of its commitments and
contingencies.
II-11
Table of Contents
The
following table provides details of the Company's valuation and qualifying accounts (in millions):
|
|
|
|
|
|
|
|
|
|
|
|
|
|
|
|
|
|
|
Beginning |
|
|
|
|
|
|
|
|
|
|
|
|
|
Ending
balance |
|
|
|
Balance |
|
Additions |
|
Deductions(1) |
|
Other(2) |
|
Fiscal Year Ended December 31, 2011 |
|
|
|
|
|
|
|
|
|
|
|
|
|
|
|
|
Valuation allowance for doubtful accounts |
|
$ |
3.9 |
|
$ |
0.4 |
|
$ |
(2.5 |
) |
$ |
— |
|
$ |
1.8 |
|
Valuation allowance for deferred income taxes |
|
|
104.9 |
|
|
5.0 |
|
|
(2.5 |
) |
|
— |
|
|
107.4 |
|
Fiscal Year Ended January 1, 2011 |
|
|
|
|
|
|
|
|
|
|
|
|
|
|
|
|
Valuation allowance for doubtful accounts |
|
$ |
3.8 |
|
$ |
— |
|
$ |
— |
|
$ |
0.1 |
|
$ |
3.9 |
|
Valuation allowance for deferred income taxes |
|
|
126.6 |
|
|
19.9 |
|
|
(43.3 |
) |
|
1.7 |
|
|
104.9 |
|
Fiscal Year Ended December 26, 2009 |
|
|
|
|
|
|
|
|
|
|
|
|
|
|
|
|
Valuation allowance for doubtful accounts |
|
$ |
21.3 |
|
$ |
0.6 |
|
$ |
(17.0 |
) |
$ |
(1.1 |
) |
$ |
3.8 |
|
Valuation allowance for deferred income taxes |
|
|
121.2 |
|
|
35.0 |
|
|
(26.2 |
) |
|
(3.4 |
) |
|
126.6 |
|
- (1)
- Deductions totaling $2.5 million for the fiscal year ended December 31, 2011 include the release of reserves of $1.1 million and the
write-off of $1.4 million in accounts receivable against the reserve. Deductions of $17.0 million for the fiscal year ended December 26, 2009 include the
write-of $13.5 million in accounts receivable against the reserve related to the liquidation of our Italian laminate facility, MAS Italia s.r.l. The remaining $3.5 million
relates to the write-off of accounts receivable against the reserve from customers primarily in Taiwan and Germany, who shut down their operations or became insolvent in fiscal 2009.
- (2)
- Includes foreign currency translation amounts and other comprehensive loss adjustments
- (c)
- Report of Independent Registered Public Accounting Firm on Financial Statement Schedules
Report
of Independent Registered Public Accounting Firm on Financial Statement Schedules
To the Board of Directors of
Isola Group S.à r.l. and subsidiaries
Chandler, Arizona
We have audited the financial statements of Isola Group S.à r.l. and subsidiaries (the "Company") as of December 31, 2011, and January 1, 2011, and
for the years ended December 31, 2011, January 1, 2011 and December 26, 2009, and have issued our report thereon dated March 15, 2012. Our audits also included the
financial statement schedules listed in Item 16(b) of this Registration Statement. These financial statement schedules are the responsibility of the Company's management. Our responsibility is
to express an opinion based on our audits. In our opinion, such financial statement schedules, when considered in relation to the basic financial statements taken as a whole, present fairly in all
material respects the information set forth therein.
As
discussed in Note 1 to the condensed financial statements, the accompanying condensed financial statements have been retrospectively adjusted for the presentation of separate
condensed statements of comprehensive loss.
/S/
DELOITTE & TOUCHE LLP
Phoenix, Arizona
March 15,
2012 (May 11, 2012 as to the effects of the retrospective presentation of separate condensed statements of comprehensive loss, discussed in Note 1)
II-12
Table of Contents
Item 17. Undertakings.
- (a)
- The
undersigned Registrant hereby undertakes:
- (1)
- That,
for the purposes of determining any liability under the Securities Act, the information omitted from the form of prospectus filed as a part of this
registration statement in reliance upon Rule 430A and conformed in a form of prospectus filed by the registrant pursuant to Rule 424(b)(1) or (4) or 497(h) under the Securities
Act shall be deemed to be part of this registration statement as of the time it was declared effective.
- (2)
- That,
for the purpose of determining any liability under the Securities Act, each post-effective amendment that contains a form of prospectus
shall be deemed to be a new registration statement relating to the security offered therein and the offering of such securities on such form shall be deemed to be the initial bona fide offering
thereof.
- (b)
- The
undersigned Registrant hereby undertakes to provide to the underwriters at the closing specified in the Underwriting Agreement certificates in such
denominations and registered in such names as required by the underwriters to permit prompt delivery to each purchaser.
Insofar
as indemnification for liabilities arising under the Securities Act may be permitted to directors, officers and controlling persons of the Registrant pursuant to the foregoing provisions, or
otherwise, the Registrant has been advised that in the opinion of the Commission, such indemnification is against public policy as expressed in the Securities Act and is therefore, unenforceable. In
the event that a claim for indemnification against such liabilities (other than the payment by the Registrant of expenses incurred or paid by a director, officer or controlling person of the
Registrant in the successful defense of any action, suit or proceeding) is asserted by such director, officer or controlling person in connection with the securities being registered, the Registrant
will, unless in the opinion of its counsel the matter has been settled by controlling precedent, submit to a court of appropriate jurisdiction the
question whether such indemnification by it is against public policy as expressed in the Securities Act and will be governed by the final adjudication of such issue.
II-13
Table of Contents
SIGNATURES
Pursuant to the requirements of the Securities Act of 1933, the registrant has duly caused this registration statement to be signed on
its behalf by the undersigned, thereunto duly authorized, in the City of Chandler, State of Arizona, on November 13, 2012.
|
|
|
|
|
|
|
ISOLA GROUP LTD. |
|
|
By: |
|
/s/ RAYMOND P. SHARPE
|
|
|
Name: |
|
Raymond P. Sharpe |
|
|
Title: |
|
President and Chief Executive Officer
(Principal Executive Officer) |
|
|
By: |
|
/s/ F. GORDON BITTER
|
|
|
Name: |
|
F. Gordon Bitter |
|
|
Title: |
|
Executive Vice President and Chief Financial Officer
(Principal Financial Officer) |
|
|
By: |
|
/s/ NINA HARALAMBIDIS
|
|
|
Name: |
|
Nina Haralambidis |
|
|
Title: |
|
Vice President, Corporate Controller and Chief Accounting Officer
(Principal Accounting Officer) |
Pursuant to the requirements of the Securities Act of 1933, this registration statement has been signed by the following persons in the capacities and on the dates indicated.
|
|
|
|
|
Signature
|
|
Title
|
|
Date
|
|
|
|
|
|
/s/ RAYMOND P. SHARPE
Raymond P. Sharpe |
|
Director, President and Chief Executive Officer |
|
November 13, 2012 |
*
Kevin R. Burns |
|
Director |
|
November 13, 2012 |
*
Donald A. Colvin |
|
Director |
|
November 13, 2012 |
*
H. McIntyre Gardner |
|
Director |
|
November 13, 2012 |
*
Jordon L. Kruse |
|
Director |
|
November 13, 2012 |
II-14
Table of Contents
|
|
|
|
|
Signature
|
|
Title
|
|
Date
|
|
|
|
|
|
*
Jeffrey S. McCreary |
|
Director |
|
November 13, 2012 |
*
Timothy Millikin |
|
Director |
|
November 13, 2012 |
*
Cassidy J. Traub |
|
Director |
|
November 13, 2012 |
|
|
|
|
|
| *By: |
|
/s/ MICHAEL S. RAFFORD
Michael S. Rafford
Attorney-in-fact |
|
|
II-15