Attached files
| file | filename |
|---|---|
| 8-K - 8-K - INLAND REAL ESTATE CORP | a12-26722_18k.htm |
Exhibit 99.1
|
|
Investor Presentation Third Quarter 2012 www.inlandrealestate.com NYSE: IRC November 2012 |
|
|
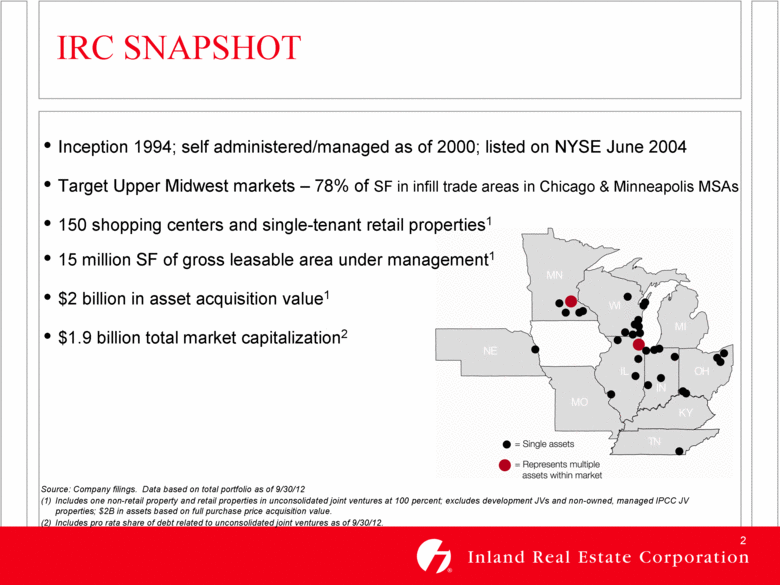
IRC SNAPSHOT Source: Company filings. Data based on total portfolio as of 9/30/12 (1) Includes one non-retail property and retail properties in unconsolidated joint ventures at 100 percent; excludes development JVs and non-owned, managed IPCC JV properties; $2B in assets based on full purchase price acquisition value. (2) Includes pro rata share of debt related to unconsolidated joint ventures as of 9/30/12. Inception 1994; self administered/managed as of 2000; listed on NYSE June 2004 Target Upper Midwest markets – 78% of SF in infill trade areas in Chicago & Minneapolis MSAs 150 shopping centers and single-tenant retail properties1 15 million SF of gross leasable area under management1 $2 billion in asset acquisition value1 $1.9 billion total market capitalization2 Single assets Represents multiple assets within market |
|
|
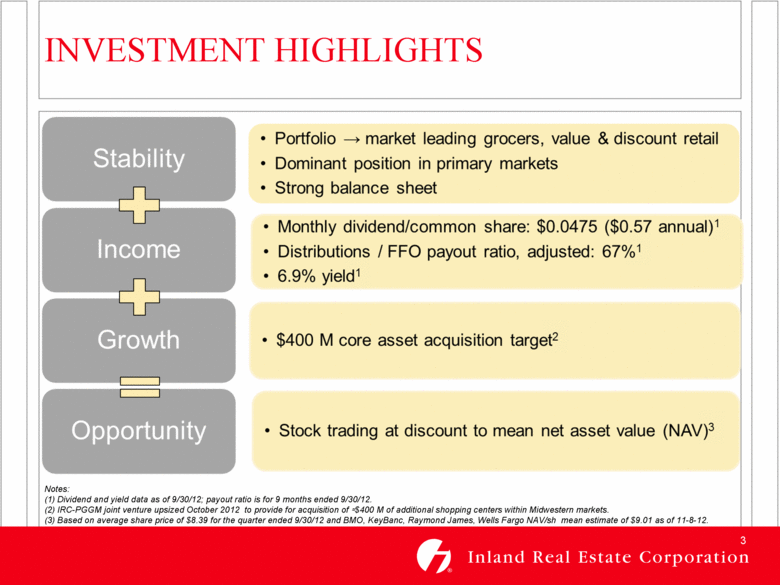
INVESTMENT HIGHLIGHTS Notes: (1) Dividend and yield data as of 9/30/12; payout ratio is for 9 months ended 9/30/12. (2) IRC-PGGM joint venture upsized October 2012 to provide for acquisition of ≈$400 M of additional shopping centers within Midwestern markets. (3) Based on average share price of $8.39 for the quarter ended 9/30/12 and BMO, KeyBanc, Raymond James, Wells Fargo NAV/sh mean estimate of $9.01 as of 11-8-12. Stability portfolio market leading grocers, value & discount retail Dominant position in primary markets Strong balance sheet Income Monthly dividend/common share: $0.0475 ($0.57 annual)1 Distributions/FFO payout ratio, adjusted: 67% 1 6.9% yield 1 Growth $400 M core asset acquisition target 2 Opportunity Stock trading at discount to mean net asset value (NAV)3 |
|
≈ |
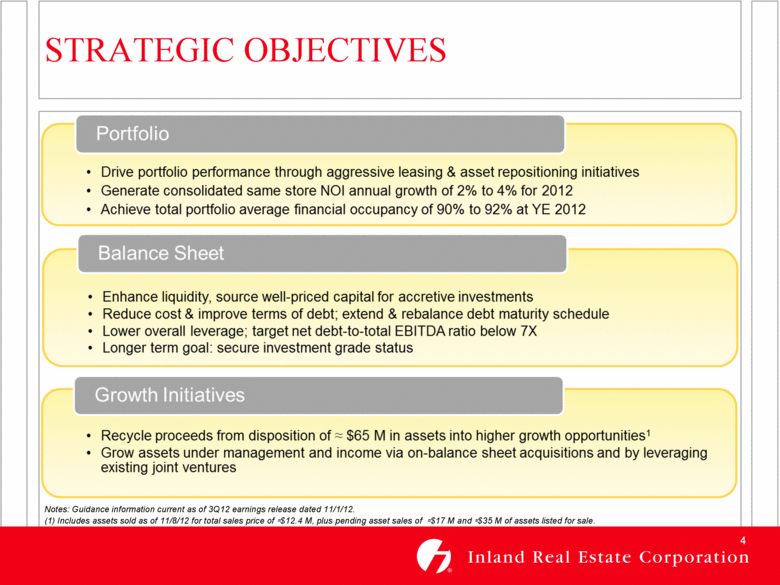
STRATEGIC OBJECTIVES Notes: Guidance information current as of 3Q12 earnings release dated 11/1/12. (1) Includes assets sold as of 11/8/12 for total sales price of ≈$12.4 M, plus pending asset sales of ≈$17 M and ≈$35 M of assets listed for sale. Portfolio Drive portfolio performance through aggressive leasing $ asset repositioning initiatives Generate consolidated same store NOI annual growth of 2% to 4% for 2012 Achieve total portfolio average financial occupancy of 90% to 92% at YE 2012 Balance Sheet Enhance liquidity, source well-priced capital for accretive investments Reduce cost & improve terms of debt; extend & rebalance debt maturity schedule Lower oveall leverage; target net debt-to-total EBITDA ratio below 7X Longer term goal: secure investment grade status Growth Initiatives Recycle proceeds from disposition of ≈$65 M in assets into higher growth opportunities 1 Grow assets under management and income via on-balance sheet acquisitions and by leveraging existing joint ventures |
|
|
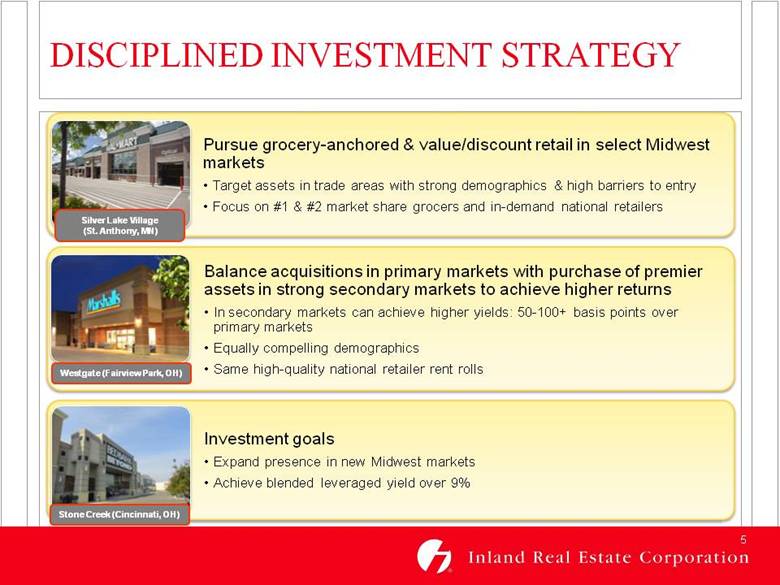
DISCIPLINED INVESTMENT STRATEGY Silver Lake Village (St. Anthony, MN) Westgate (Fairview Park, OH) Stone Creek (Cincinnati, OH) Pursue grocery-anchored & value/discount retail in select Midwest markets Target assets in trade areas with strong demographics & high barriers to entry Focus on #1 & #2 market share grocers and in-demand national retailers Balance acquisitions in primary markets with purchase of premier assets in strong secondary markets to achieve higher returns In secondary markets can achieve higher yields: 50-100+ basis points over primary markets Equally compelling demographics Same high-quality national retailer rent rolls Investment goals Expand presence in new Midwest markets Achieve blended leveraged yield over 9% |
|
|
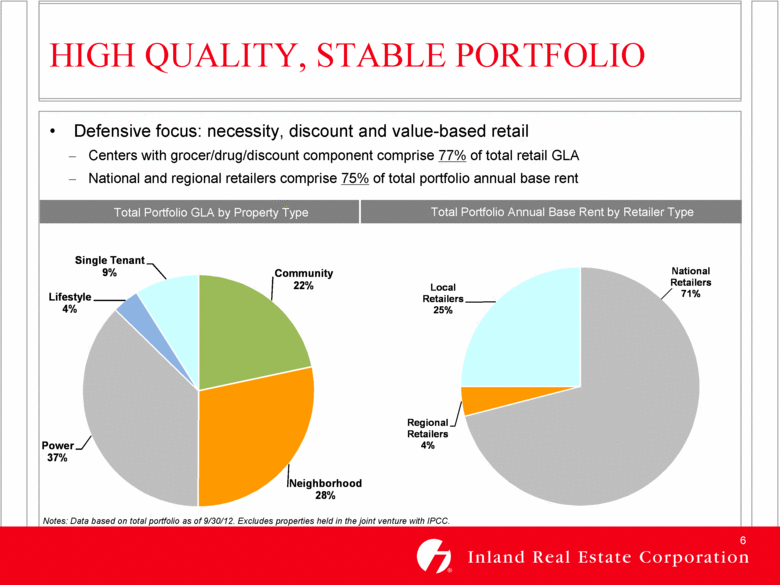
HIGH QUALITY, STABLE PORTFOLIO Notes: Data based on total portfolio as of 9/30/12. Excludes properties held in the joint venture with IPCC. Total Portfolio GLA by Property Type Total Portfolio Annual Base Rent by Retailer Type Defensive focus: necessity, discount and value-based retail Centers with grocer/drug/discount component comprise 77% of total retail GLA National and regional retailers comprise 75% of total portfolio annual base rent Community 22% Neighborhood 28% Power 37% Lifestyle 4% Single Tenant 9% National Retailers 71% Regional Retailers 4% Local Retailers 25% |
|
|
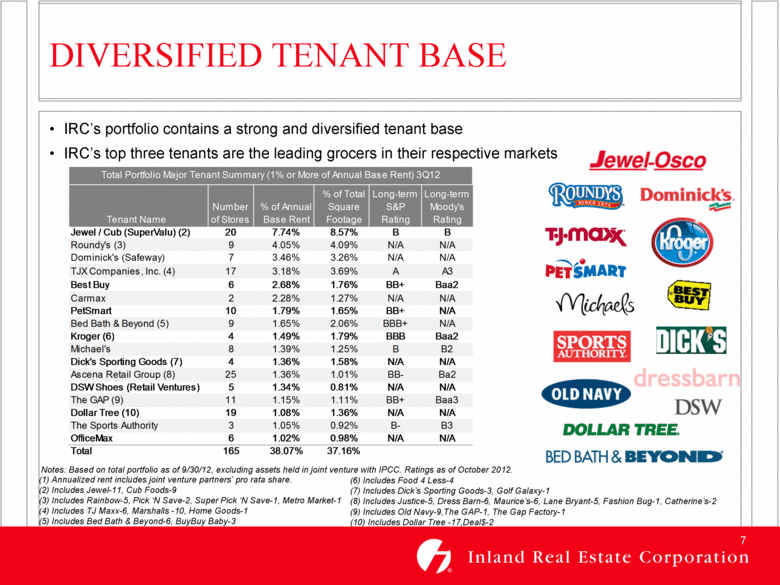
(6) Includes Food 4 Less-4 (7) Includes Dick’s Sporting Goods-3, Golf Galaxy-1 (8) Includes Justice-5, Dress Barn-6, Maurice’s-6, Lane Bryant-5, Fashion Bug-1, Catherine’s-2 (9) Includes Old Navy-9,The GAP-1, The Gap Factory-1 (10) Includes Dollar Tree -17,Deal$-2 DIVERSIFIED TENANT BASE IRC’s portfolio contains a strong and diversified tenant base IRC’s top three tenants are the leading grocers in their respective markets (1) Annualized rent includes joint venture partners’ pro rata share. (2) Includes Jewel-11, Cub Foods-9 (3) Includes Rainbow-5, Pick ‘N Save-2, Super Pick ‘N Save-1, Metro Market-1 (4) Includes TJ Maxx-6, Marshalls -10, Home Goods-1 (5) Includes Bed Bath & Beyond-6, BuyBuy Baby-3 Notes: Based on total portfolio as of 9/30/12, excluding assets held in joint venture with IPCC. Ratings as of October 2012. Tenant Name Number of Stores % of Annual Base Rent % of Total Square Footage Long-term S&P Rating Long-term Moody's Rating Jewel / Cub (SuperValu) (2) 20 7.74% 8.57% B B Roundy's (3) 9 4.05% 4.09% N/A N/A Dominick's (Safeway) 7 3.46% 3.26% N/A N/A TJX Companies, Inc. (4) 17 3.18% 3.69% A A3 Best Buy 6 2.68% 1.76% BB+ Baa2 Carmax 2 2.28% 1.27% N/A N/A PetSmart 10 1.79% 1.65% BB+ N/A Bed Bath & Beyond (5) 9 1.65% 2.06% BBB+ N/A Kroger (6) 4 1.49% 1.79% BBB Baa2 Michael's 8 1.39% 1.25% B B2 Dick's Sporting Goods (7) 4 1.36% 1.58% N/A N/A Ascena Retail Group (8) 25 1.36% 1.01% BB- Ba2 DSW Shoes (Retail Ventures) 5 1.34% 0.81% N/A N/A The GAP (9) 11 1.15% 1.11% BB+ Baa3 Dollar Tree (10) 19 1.08% 1.36% N/A N/A The Sports Authority 3 1.05% 0.92% B- B3 OfficeMax 6 1.02% 0.98% N/A N/A Total 165 38.07% 37.16% Total Portfolio Major Tenant Summary (1% or More of Annual Base Rent) 3Q12 |
|
|
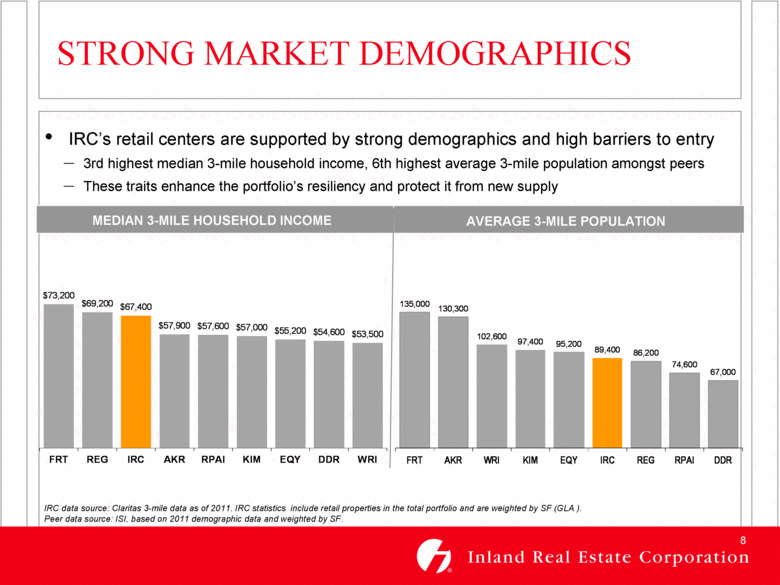
STRONG MARKET DEMOGRAPHICS IRC’s retail centers are supported by strong demographics and high barriers to entry 3rd highest median 3-mile household income, 6th highest average 3-mile population amongst peers These traits enhance the portfolio’s resiliency and protect it from new supply MEDIAN 3-MILE HOUSEHOLD INCOME AVERAGE 3-MILE POPULATION IRC data source: Claritas 3-mile data as of 2011. IRC statistics include retail properties in the total portfolio and are weighted by SF (GLA ). Peer data source: ISI, based on 2011 demographic data and weighted by SF. $73,200 $69,200 $67,400 $57,900 $57,600 $57,000 $55,200 $54,600 $53,500 FRT REG IRC AKR RPAI KIM EQY DDR WRI 135,000 130,300 102,600 97,400 95,200 89,400 86,200 74,600 67,000 FRT AKR WRI KIM EQY IRC REG RPAI DDR |
|
|
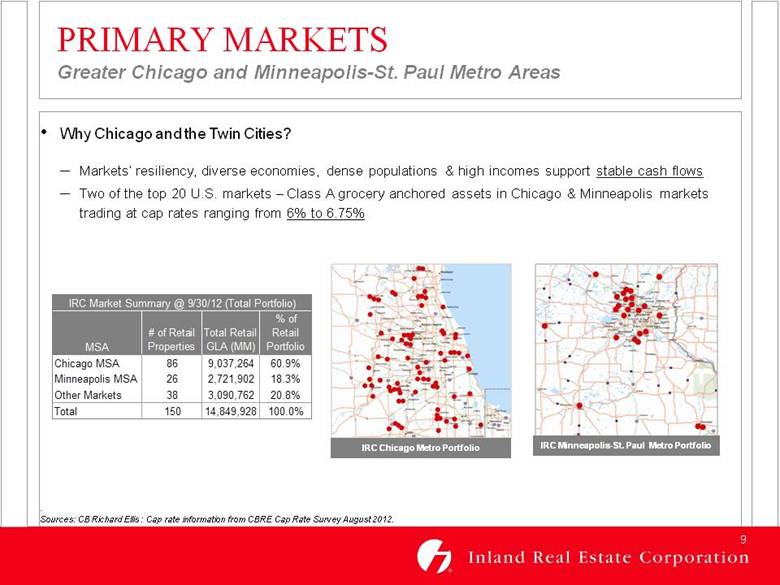
PRIMARY MARKETS Greater Chicago and Minneapolis-St. Paul Metro Areas Sources: CB Richard Ellis : Cap rate information from CBRE Cap Rate Survey August 2012. Why Chicago and the Twin Cities? Markets’ resiliency, diverse economies, dense populations & high incomes support stable cash flows Two of the top 20 U.S. markets – Class A grocery anchored assets in Chicago & Minneapolis markets trading at cap rates ranging from 6% to 6.75% IRC Chicago Metro Portfolio IRC Minneapolis-St. Paul Metro Portfolio MSA # of Retail Properties Total Retail GLA (MM) % of Retail Portfolio Chicago MSA 86 9,037,264 60.9% Minneapolis MSA 26 2,721,902 18.3% Other Markets 38 3,090,762 20.8% Total 150 14,849,928 100.0% IRC Market Summary @ 9/30/12 (Total Portfolio) |
|
|
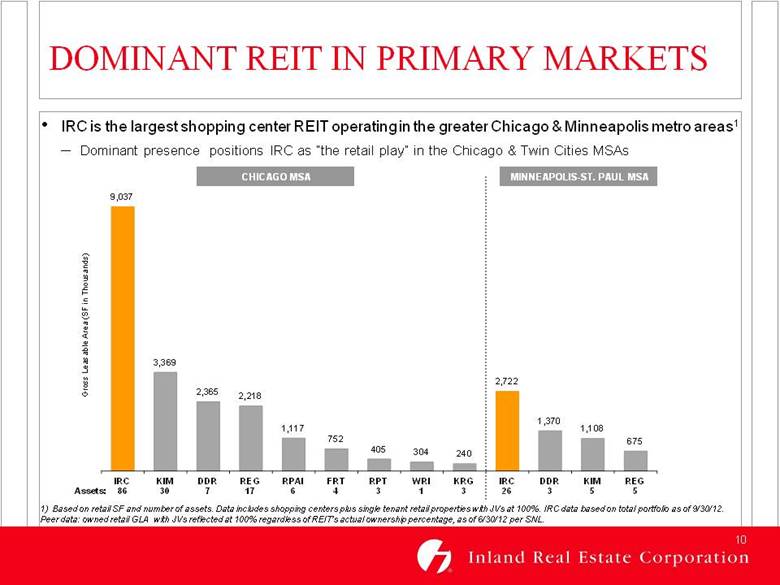
Assets: DOMINANT REIT IN PRIMARY MARKETS IRC is the largest shopping center REIT operating in the greater Chicago & Minneapolis metro areas1 Dominant presence positions IRC as “the retail play” in the Chicago & Twin Cities MSAs 1) Based on retail SF and number of assets. Data includes shopping centers plus single tenant retail properties with JVs at 100%. IRC data based on total portfolio as of 9/30/12. Peer data: owned retail GLA with JVs reflected at 100% regardless of REIT’s actual ownership percentage, as of 6/30/12 per SNL. MINNEAPOLIS-ST. PAUL MSA CHICAGO MSA 9,037 3,369 2,365 2,218 1,117 752 405 304 240 2,722 1,370 1,108 675 IRC 86 KIM 30 DDR 7 REG 17 RPAI 6 FRT 4 RPT 3 WRI 1 KRG 3 IRC 26 DDR 3 KIM 5 REG 5 Gross Leasable Area (SF in Thousands) |
|
|
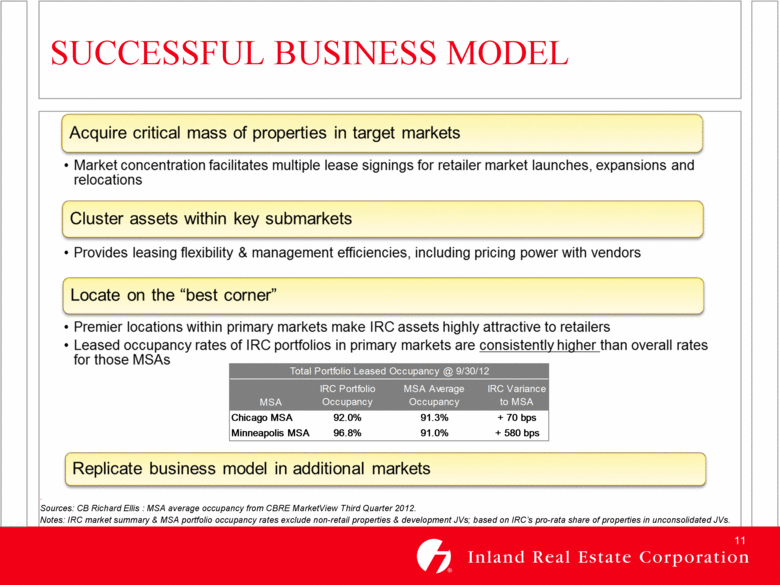
Sources: CB Richard Ellis : MSA average occupancy from CBRE MarketView Third Quarter 2012. Notes: IRC market summary & MSA portfolio occupancy rates exclude non-retail properties & development JVs; based on IRC’s pro-rata share of properties in unconsolidated JVs. SUCCESSFUL BUSINESS MODEL MSA IRC Portfolio Occupancy MSA Average Occupancy IRC Variance to MSA Chicago MSA 92.0% 91.3% + 70 bps Minneapolis MSA 96.8% 91.0% + 580 bps Total Portfolio Leased Occupancy @ 9/30/12 Acquire critical mass of properties in target markets Market concentration facilitates multiple lease signings for retailer market launches, expansions and relocations Cluster assets within key submarkets Provides leasing flexibility & management efficiencies, including pricing power with vendors Locate on the “best corner” Premier locations within primary markets make IRC assets highly attractive to retailers Leased occupancy rates of IRC portfolios in primary markets are consistently higher than overall rates for those MSAs |
|
|
Tenant # Leases Signed by IRC Annual Base Rent Roundy’s / Pick ‘N Save 6 Leases $ 4.0 Million Kroger / Food 4 Less 4 Leases $ 2.6 Million Hobby Lobby 3 Leases $ 1.9 Million Dollar Tree 18 Leases $ 1.8 Million Ross Dress for Less 7 Leases $1.7 Million Gordmans 3 Leases $1.5 Million Jo-Ann Stores 6 Leases $ 1.2 Million Ulta 5 Leases $1.2 Million BuyBuy Baby 3 Leases $ 1.0 Million Party City 5 Leases $ 0.9 Million Famous Footwear 6 Leases $ 0.7 Million PetSmart 2 leases $ 0.7 Million Old Navy 2 Leases $ 0.5 Million Five Below 2 Leases $ 0.2 Million LEASING EFFICIENCIES Substantial Market Presence Facilitates Multiple Lease Signings Note: Data reflects active leases signed by IRC 2004 to 9/30/12; excludes leases that were already in place when properties were acquired by IRC. Annual base rent is based on September 2012 rent annualized. |
|
|
Seventh consecutive quarter of positive spreads on new leases as of 3Q12 & continued positive leasing spreads on renewals Reflects strength of locations & more level playing field with regard to lease negotiations TOTAL PORTFOLIO RENT SPREADS ON NEW AND RENEWAL LEASES (AVERAGE BASE RENTS) OPERATING FUNDAMENTALS POSITIVE LEASING SPREADS + 6.4% + 17.5% + 8.2% + 5.2% + 5.3% + 8.6% + 39.7% +7.4% + 8.2% + 2.9% + 14.0% + 11.0% + 3.4% + 5.1% $13.65 $10.56 $10.51 $11.56 $12.19 $11.35 $14.11 $10.66 $13.86 $13.83 $15.95 $14.52 $13.25 $11.32 $14.35 $10.91 $11.67 $12.51 $12.55 $12.19 $15.01 $12.52 $14.59 $15.02 $17.26 $15.29 $15.10 $15.81 1Q11 Renewals 1Q11 New 2Q11 Renewals 2Q11 New 3Q11 Renewals 3Q11 New 4Q11 Renewals 4Q11 New 1Q12 Renewals 1Q12 New 2Q12 Renewals 2Q12 New 3Q12 Renewals 3Q12 New Former Average Base Rent Per SF New Average Base Rent Per SF |
|
|
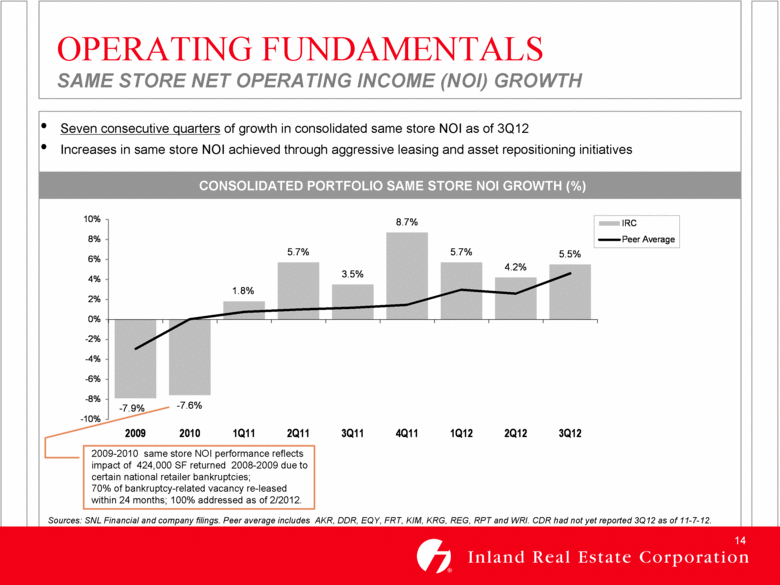
Seven consecutive quarters of growth in consolidated same store NOI as of 3Q12 Increases in same store NOI achieved through aggressive leasing and asset repositioning initiatives CONSOLIDATED PORTFOLIO SAME STORE NOI GROWTH (%) OPERATING FUNDAMENTALS SAME STORE NET OPERATING INCOME (NOI) GROWTH Sources: SNL Financial and company filings. Peer average includes AKR, DDR, EQY, FRT, KIM, KRG, REG, RPT and WRI. CDR had not yet reported 3Q12 as of 11-7-12. 2009-2010 same store NOI performance reflects impact of 424,000 SF returned 2008-2009 due to certain national retailer bankruptcies; 70% of bankruptcy-related vacancy re-leased within 24 months; 100% addressed as of 2/2012. - 7.9% - 7.6% 1.8% 5.7% 3.5% 8.7% 5.7% 4.2% 5.5% -10% -8% -6% -4% -2% 0% 2% 4% 6% 8% 10% 2009 2010 1Q11 2Q11 3Q11 4Q11 1Q12 2Q12 3Q12 IRC Peer Average |
|
|
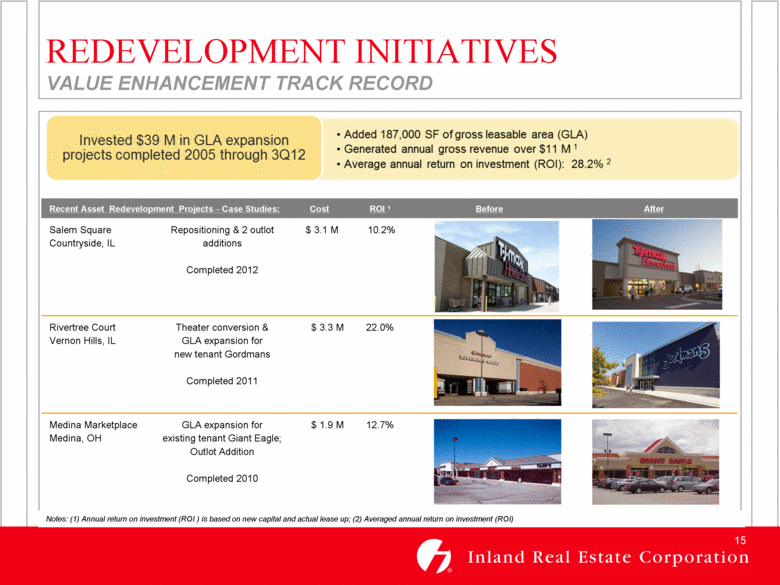
Recent Asset Redevelopment Projects – Case Studies: Cost ROI 1 Before After Salem Square Countryside, IL Repositioning & 2 outlot additions Completed 2012 $ 3.1 M 10.2% Rivertree Court Vernon Hills, IL Theater conversion & GLA expansion for new tenant Gordmans Completed 2011 $ 3.3 M 22.0% Medina Marketplace Medina, OH GLA expansion for existing tenant Giant Eagle; Outlot Addition Completed 2010 $ 1.9 M 12.7% Notes: (1) Annual return on investment (ROI ) is based on new capital and actual lease up; (2) Averaged annual return on investment (ROI) REDEVELOPMENT INITIATIVES VALUE ENHANCEMENT TRACK RECORD Invested $39 M in GLA expansion projects completed 2005 through 3Q12 Added 187,000 SF of gross leasable area (GLA) Generated annual gross revenue over $11 M 1 Average annual return on investment (ROI): 28.2% 2 |
|
|
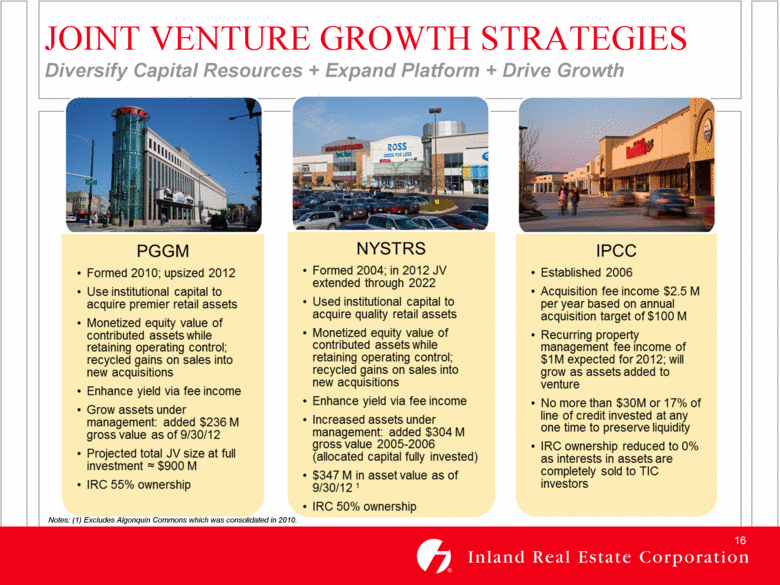
JOINT VENTURE GROWTH STRATEGIES Diversify Capital Resources + Expand Platform + Drive Growth Notes: (1) Excludes Algonquin Commons which was consolidated in 2010. PGGM Formed 2010; upsized 2012 Use institutional capital to acquire premier retail assets Monetized equity value of contributed assets while retaining operating control; recycled gains on sales into new acquisitions Enhance yield via fee income Grow assets under management: added $236 M gross value as of 9/30/12 Projected total JV size at full investment≈$900M IRC 55% ownership NYSTRS Formed 2004; in 2012 JV extended through 2022 Used institutional capital to acquire quality retail assets Monetized equity value of contributed assets while retaining oprating control; recycled gains on sales into new acquisitions Enhance yield via fee income Increased assets under management: added $304 M gross value 2005-2006 (allocated capital fully invested) $347 M in asset value as of 9/30/12 1 IRC 50% ownership IPCC Established 2006 Acquisition fee income $2.5 M per year based on annual acquisition target of $100 M Recurring property management fee income of $1M expected for 2012; will grow as assets added to venture No more than $30M or 17% of line of credit invested at any one time to preserve liquidity IRC ownership reduced to 0% as interest in assets are completely sold to TIC investors |
|
|
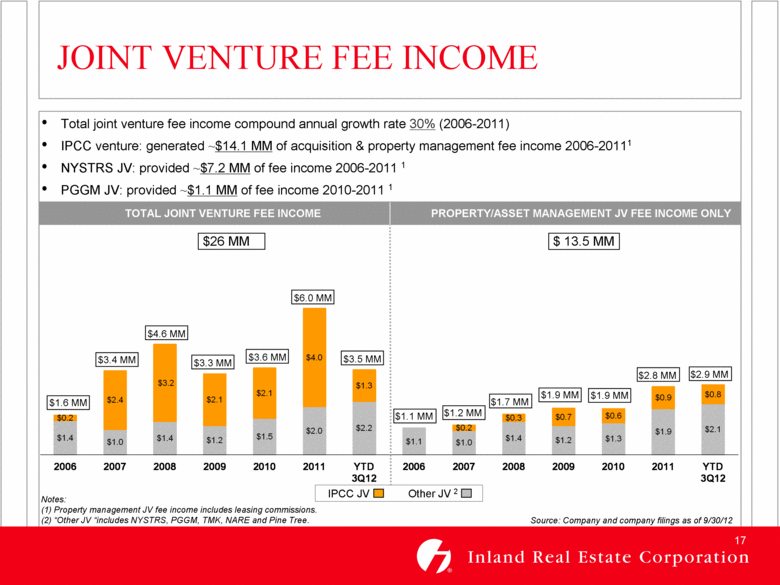
$3.4 MM $3.3 MM $1.6 MM $4.6 MM $3.6 MM $6.0 MM $1.1 MM $1.2 MM $1.7 MM $1.9 MM $2.8 MM $1.9 MM JOINT VENTURE FEE INCOME Total joint venture fee income compound annual growth rate 30% (2006-2011) IPCC venture: generated ~$14.1 MM of acquisition & property management fee income 2006-20111 NYSTRS JV: provided ~$7.2 MM of fee income 2006-2011 1 PGGM JV: provided ~$1.1 MM of fee income 2010-2011 1 Notes: (1) Property management JV fee income includes leasing commissions. (2) “Other JV “includes NYSTRS, PGGM, TMK, NARE and Pine Tree. TOTAL JOINT VENTURE FEE INCOME PROPERTY/ASSET MANAGEMENT JV FEE INCOME ONLY IPCC JV Other JV 2 $26 MM $ 13.5 MM Source: Company and company filings as of 9/30/12 $3.5 MM $2.9 MM $1.4 $1.0 $1.4 $1.2 $1.5 $2.0 $2.2 $1.1 $1.0 $1.4 $1.2 $1.3 $1.9 $2.1 $0.2 $2.4 $3.2 $2.1 $2.1 $4.0 $1.3 $0.2 $0.3 $0.7 $0.6 $0.9 $0.8 2006 2007 2008 2009 2010 2011 YTD 3Q12 2006 2007 2008 2009 2010 2011 YTD 3Q12 |
|
|
As of 11/8/2012; acquisitions are shown on positive axis & include sold core properties and properties acquired through unconsolidated joint ventures at 100 percent; acquisitions exclude IPCC JV acquisitions that were completed with no equity contribution from IRC; dispositions are shown on negative axis & exclude sold IPCC JV assets. Acquisition value represents full purchase price, including potential earn-outs. IRC has been an active acquirer of assets for our own balance sheet and through joint ventures Over half of core asset acquisitions have been principal to principal transactions; typically get best pricing in private deals IRC/NYSTRS/PGGM Acquisitions IPCC Acquisitions Dispositions Acquisition Cap Rate $278.1 $111.2 $238.3 $251.3 PORTFOLIO TRANSACTION HISTORY (1) TRANSACTION HISTORY CONSOLIDATED & JOINT VENTURES $17.8 $77.4 $181.8 $365.8 $298.3 $43.3 $3.3 $207.2 $78.0 $75.3 $143.8 $150.1 $181.4 $2.4 $8.4 $12.0 $24.6 $6.2 $15.7 $29.6 $14.8 $6.6 $17.7 $8.2 $12.4 ($50) ($25) $0 $25 $50 $75 $100 $125 $150 $175 $200 $225 $250 $275 $300 $325 $350 $375 1995 1996 1997 1998 1999 2000 2001 2002 2003 2004 2005 2006 2007 2008 2009 2010 2011 2012 YTD Dispositions / Acquisitions ($MM) |
|
|
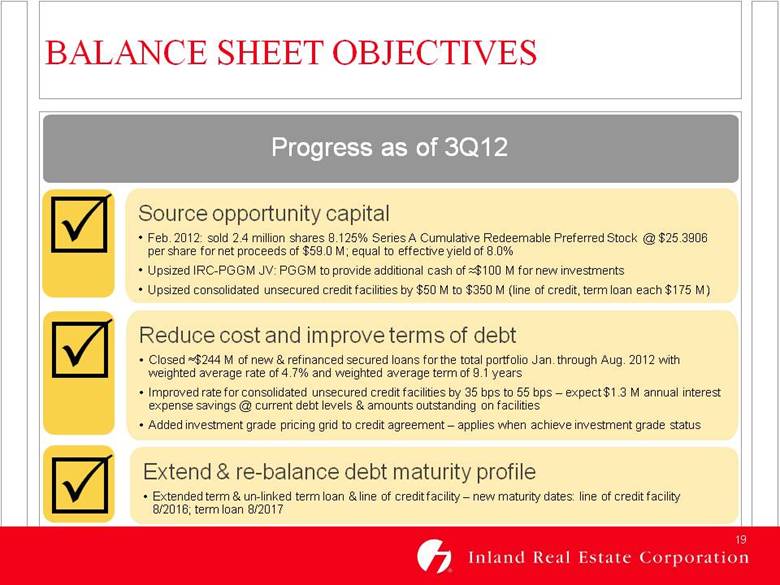
xxx BALANCE SHEET OBJECTIVES Progress as of 3Q12 Source opportunity capital Feb. 2012: sold 2.4 million shares 8.125% Series A Cumulative Redeemable Preferred Stock @ $25.3906 per share for net proceeds of $59.0 M; equal to effective yield of 8.0% Upsized IRC-PGGM JV: PGGM to provide additional cash of ≈$100 M for new investments Upsized consolidated unsecured credit facilities by $50 M to $350 M (line of credit, term loan each $175 M) Reduce cost and improve terms of debt Closed ≈$244 M of new & refinanced secured loans for the total portfolio Jan. through Aug. 2012 with weighted average rate of 4.7% and weighted average term of 9.1 years Improved rate for consolidated unsecured credit facilities by 35 bps to 55 bps – expect $1.3 M annual interest expense savings @ current debt levels & amounts outstanding on facilities Added investment grade pricing grid to credit agreement – applies when achieve investment grade status Extend & re-balance debt maturity profile Extended term & un-linked term loan & line of credit facility – new maturity dates: line of credit facility 8/2016; term loan 8/2017 |
|
|
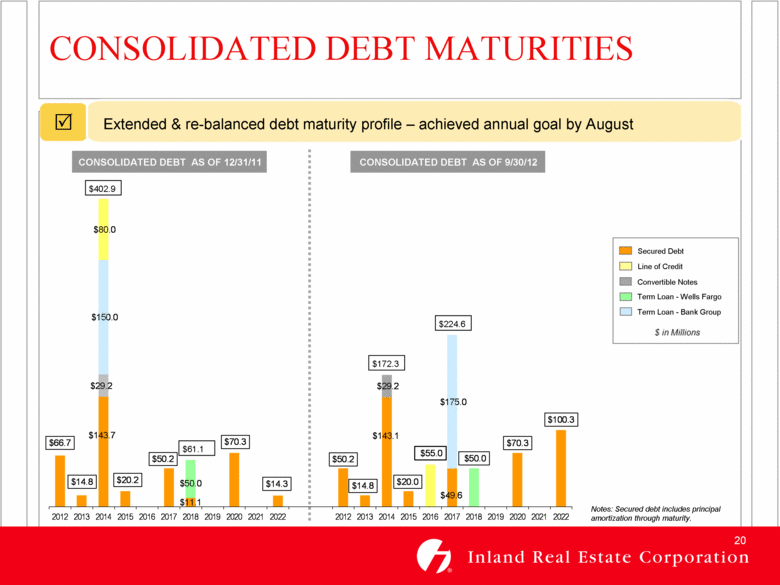
$402.9 $172.3 $61.1 $224.6 Term Loan - Bank Group Term Loan - Wells Fargo Notes: Secured debt includes principal amortization through maturity. CONSOLIDATED DEBT AS OF 9/30/12 CONSOLIDATED DEBT AS OF 12/31/11 Extended & re-balanced debt maturity profile – achieved annual goal by August CONSOLIDATED DEBT MATURITIES $66.7 $14.8 $143.7 $20.2 $50.2 $11.1 $70.3 $14.3 $50.2 $14.8 $143.1 $20.0 $49.6 $70.3 $100.3 $29.2 $29.2 $150.0 $175.0 $50.0 $50.0 $80.0 $55.0 2012 2013 2014 2015 2016 2017 2018 2019 2020 2021 2022 2012 2013 2014 2015 2016 2017 2018 2019 2020 2021 2022 Secured Debt Line of Credit Convertible notes |
|
|
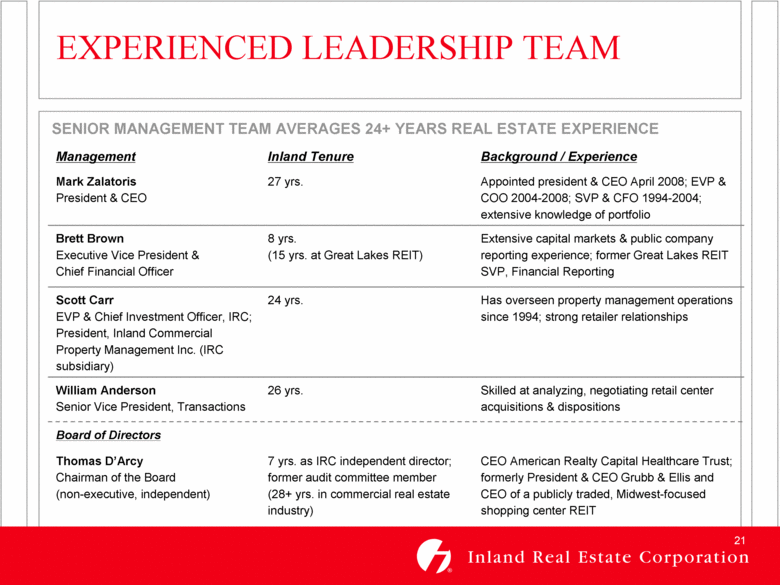
EXPERIENCED LEADERSHIP TEAM Management Inland Tenure Background / Experience Mark Zalatoris President & CEO 27 yrs. Appointed president & CEO April 2008; EVP & COO 2004-2008; SVP & CFO 1994-2004; extensive knowledge of portfolio Brett Brown Executive Vice President & Chief Financial Officer 8 yrs. (15 yrs. at Great Lakes REIT) Extensive capital markets & public company reporting experience; former Great Lakes REIT SVP, Financial Reporting Scott Carr EVP & Chief Investment Officer, IRC; President, Inland Commercial Property Management Inc. (IRC subsidiary) 24 yrs. Has overseen property management operations since 1994; strong retailer relationships William Anderson Senior Vice President, Transactions 26 yrs. Skilled at analyzing, negotiating retail center acquisitions & dispositions Board of Directors Thomas D’Arcy Chairman of the Board (non-executive, independent) 7 yrs. as IRC independent director; former audit committee member (28+ yrs. in commercial real estate industry) CEO American Realty Capital Healthcare Trust; formerly President & CEO Grubb & Ellis and CEO of a publicly traded, Midwest-focused shopping center REIT SENIOR MANAGEMENT TEAM AVERAGES 24+ YEARS REAL ESTATE EXPERIENCE |
|
|
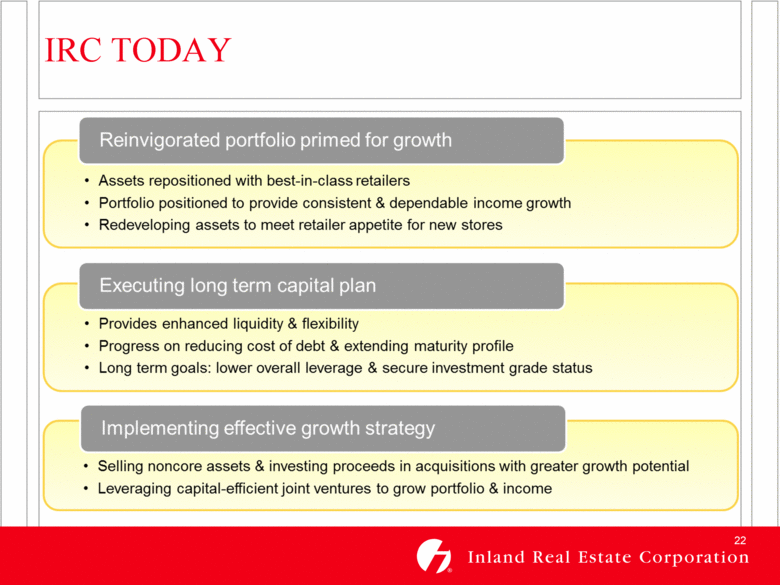
IRC TODAY Reinvigorated portfolio primed for growth Assets repositioned with best-in-class retailers Portfolio positioned to provide consistent & dependable income growth Redeveloping assets to meet retailer appetite for new stores Executing long term capital plan provides enhanced liquidity & flexibility Progress on reducing cost of debt & extending maturity profile Long term goals: lower overall leverage & secure investment grade status Implementing effective growth strategy Selling noncore assets & investing proceeds in acquisitions with greater growth potential Leveraging capital-efficient joint ventures to grow portfolio & income |
|
|
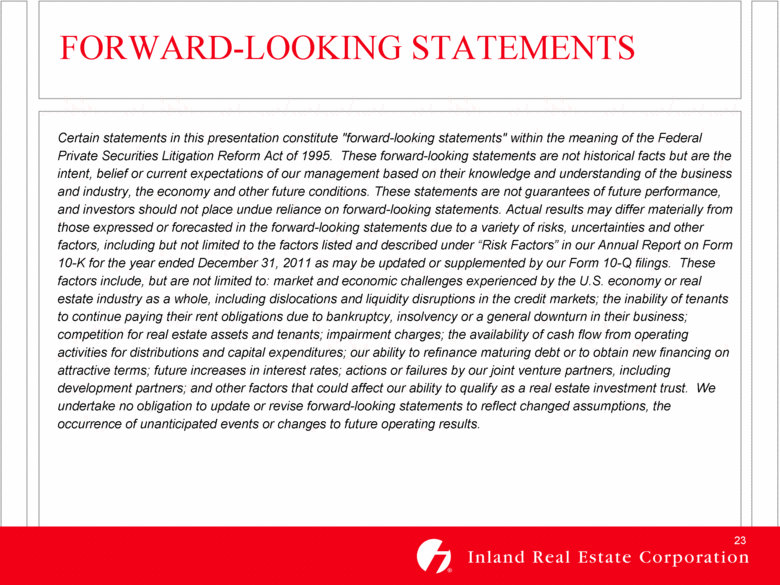
FORWARD-LOOKING STATEMENTS Certain statements in this presentation constitute "forward-looking statements" within the meaning of the Federal Private Securities Litigation Reform Act of 1995. These forward-looking statements are not historical facts but are the intent, belief or current expectations of our management based on their knowledge and understanding of the business and industry, the economy and other future conditions. These statements are not guarantees of future performance, and investors should not place undue reliance on forward-looking statements. Actual results may differ materially from those expressed or forecasted in the forward-looking statements due to a variety of risks, uncertainties and other factors, including but not limited to the factors listed and described under “Risk Factors” in our Annual Report on Form 10-K for the year ended December 31, 2011 as may be updated or supplemented by our Form 10-Q filings. These factors include, but are not limited to: market and economic challenges experienced by the U.S. economy or real estate industry as a whole, including dislocations and liquidity disruptions in the credit markets; the inability of tenants to continue paying their rent obligations due to bankruptcy, insolvency or a general downturn in their business; competition for real estate assets and tenants; impairment charges; the availability of cash flow from operating activities for distributions and capital expenditures; our ability to refinance maturing debt or to obtain new financing on attractive terms; future increases in interest rates; actions or failures by our joint venture partners, including development partners; and other factors that could affect our ability to qualify as a real estate investment trust. We undertake no obligation to update or revise forward-looking statements to reflect changed assumptions, the occurrence of unanticipated events or changes to future operating results. |

